Article

A Systematic Study on the Analysis of the Emission of CO, CO2 and HC for Four-Wheelers and Its Impact on the Sustainable Ecosystem

by
Rohit Sharma
1,
Raghvendra Kumar
2,
Pradeep Kumar Singh
3,*,
Maria Simona Raboaca
4,5,* and
Raluca-Andreea Felseghi
5
1
Departments of Electronics & Communication Engineering, SRM Institute of Science and Technology, NCR Campus, Ghaziabad 201204, India
2
Department of Computer Science and Engineering, GIET University, Gunupur, Odisha 765022, India
3
Department of CSE, ABES Engineering College, Ghaziabad, Uttar Pradesh Pin-201009, India
4
National Research and Development Institute for Cryogenic and Isotopic Technologies—ICSI Rm. Valcea, Uzinei Street, No. 4, P.O. Box 7 Raureni, 240050 Valcea, Romania
5
Faculty of Electrical Engineering and Computer Science, Stefan cel Mare University of Suceava, Universităţii Street, No.13, 720229 Suceava, Romania
*
Authors to whom correspondence should be addressed.
Sustainability 2020, 12(17), 6707; https://0-doi-org.brum.beds.ac.uk/10.3390/su12176707
Submission received: 14 June 2020 / Revised: 8 August 2020 / Accepted: 9 August 2020 / Published: 19 August 2020

Abstract

:
The urbanization in Delhi NCR has led to a rapid increase in the vehicle count concerning the rise in population and mobilization. The emissions from the vehicles are currently counted amongst the main sources of air pollution in Delhi. This affects the quality of air. The emission criterion of various pollutants that are emitted from vehicles is evaluated through various International models, which include various vehicles, their modes of pollutants emitted while driving and other factors that are affecting the weather. The approximate emission of pollutants such as Carbon Monoxide (CO) and/or Particulate Matter (PM), from a variety of vehicles and different fuel types, has undergone diurnal variation over the years, depending on the time of the day. This study presents the emission factor of gaseous pollutants Hydrocarbons (HC), Carbon Monoxides (CO) and Carbon Dioxide (CO2) of 181 four-wheeler cars from different companies containing different types of fuels. The measurement of gaseous pollutants is performed for Delhi, the most polluted city in India. The various facts and data were calculated and analyzed with reference to the standard values set by the national schemes of the Pollution and Environment. Based on this statistical data obtained and analyzed, the scenarios regarding future vehicle growth rate and its impact on air quality are mentioned to overcome emission problems. Therefore, it is important to develop and deploy methods for obtaining real-world measurements of vehicle emissions, to estimate the pollutants. The analysis shows that few parameters need to be a concern for reducing the pollutants emission by vehicles. These major parameters are the high survival rates, decrease in annual mileage and major enforcement for three-to-five-year-old vehicles. This study shows that many old vehicles are used in different regions of the country, regardless of many notifications of banning old vehicles by the Government of India. These old vehicles are the major source of vehicle pollutants. The analysis stated that the diesel engine would emit less CO2/km than a petrol engine if having an almost similar engine capacity.

1. Introduction

India is one of the biggest emitters of pollutants, and vehicle pollution is one of the major sources of these pollutants. Here we present an inventory of vehicle pollution for different car models and companies. This inventory is the study of major pollutants Hydrocarbons (HC), Particulate Matter (PM), Carbon Monoxides (CO) and Carbon Dioxide (CO2), for the period from 2005 to 2019. These inventories play a very important role when we discuss the input for modeling of atmospheric composition, about the air and other pollution. In this paper, we study the major makers/companies of four-wheelers vehicles that emit the pollutants in the air. The maker/companies considered for this study are Toyota, Maruti Suzuki, Hyundai, Honda, Mahindra, TATA and some other luxury makers.
According to WHO, air pollution kills around seven million people worldwide every year. The data show that approximately 90% of the population breathes air containing high levels of pollution, resulting in around seven million deaths every year due to such exposure. In January 2019, the state-run Central Pollution Control Board’s air-quality index shows that the concentration of poisonous Particulate Matter, also known PM 2.5, stood at 440 and about 12 times more than the US-government-recommended level, i.e., the level of 35. Therefore, it becomes imperative for us to deeply understand and analyze the causes of air pollution in our surroundings. Vehicles are one of the major sources of emission of pollutants, especially in urban areas. The major pollutants associated with vehicular emission are Hydrocarbons (HC), Particulate Matter (PM), Carbon Monoxides (CO) and Carbon Dioxide (CO2). In this paper, we analyze these major pollutants emitted by different fuel vehicles. In the next section, we detail these pollutants in brief. The fuel and air can be the source of different pollutants that can be harmful to human health. Here we discuss some of the major pollutants caused by vehicular emission.
Fuel + Air ←Hydrocarbons + Carbon Dioxide + Carbon Monoxide + Nitrogen Oxide + Sulfur Dioxide + water.
Hydrocarbons (HC) are considered to be specks of molecules of fuel that are not fully burned. These react when sunlight and oxides of Nitrogen are present, and the reaction results in the formation of ground-based ozone. The ozone so formed majorly contributes to smog and irritates the eyes and nose and also damages the lungs. Some exhausts’ HCs are harmful, too, with the potential to cause cancer. Carbon Monoxide (CO) is the product of the incomplete burning of Hydrocarbons-based fuels. It is a colorless, odorless and poisonous gas. Mostly, when cars are about to start, and if they are not tuned in a proper way or at higher altitudes, where the fraction of oxygen that is available for combustion decreases, then the CO formed has a low air-to-fuel ratio in the engine. Two-thirds of the CO emissions arise from the sources of transport, cars being the largest contributor. In some areas, the contribution of on-road vehicles to Carbon Monoxide pollution may rise up to 90%. The affinity of CO to hemoglobin is about 250 times more than the oxygen. This may cause mild-to-severe poisoning, depending upon the concentration of CO and its exposed length. The symptoms include headache, dizziness, nausea, vomiting and loss of consciousness. Carbon Dioxide (CO2), as per the US Environmental Protection Agency (EPA), initially inspected CO2 as a result of “complete” combustion, but now suspects Carbon Dioxide as the concern of pollution. CO2 is a greenhouse gas that traps the heat of the earth and contributes to the change in the climate.
We have seen that the new vehicles are comparatively less polluting than before, but the number of vehicles and the overall distances traveled by them has considerably increased, and the people, especially while commuting, are heavily exposed to such pollutants. One such region which has an air-quality level of criticism is the Delhi National Capital Region. Delhi, also being the capital, is undergoing rapid development, with an ever-increasing number of vehicles, reaching more than 10 million now. Delhi NCR has been given the worst position among the 14 major cities of the country, on the basis of vehicular emissions, according to a study conducted by the Centre for Science and Environment (CSE). A survey conducted by IIT-Kanpur has revealed that such emissions from vehicles contribute 9% of the total Particulate Matter 10 (PM10) and 20% of the total PM2.5 in the national capital. Recently there have been some initiatives taken to curb or reduce vehicular pollution, including public-awareness campaigns, registration of only those first-sale four-wheeled petrol-driven vehicles which have catalytic converters installed, the expansion of the rapid public transport system, the phasing out of old commercial vehicles, compliance of tightened emission standards and improvement in fuel quality by completely phasing out leaded petrol, and introduction to low Sulfur diesel. However, despite all of these measures taken, the problem still persists, and there is a large and excessive need for studies and analyses, to understand the problem at a deeper level, and with those results, a more practical approach can be strategized. Hence, our paper analyses the different types of pollutants emitting from distinct vehicles, at different periods of time, and gives an overall view of the most current situation in this region.
Timely differences in vehicle emissions are influenced by many inter-mixing factors in the real world. Post tailpipe emission the particles go through a change as they come into the contact with atmosphere, as observed when we see two times the increase in emission factors from summer to winter [1]. Taking cost-effectiveness into account is one of the major things when it comes to implementing policies for the reduction of vehicular emissions. It was seen that implementing a policy of limited driving was less cost-effective than a policy of elimination of old cars [2]. Pollutants such as SO2, HC, CO2, CO and PM are emitted by vehicles in very high quantities [3]. Detailed specifications of the compound of gases where the particles are studied at different stages, such as cooling, equilibrating to current conditions, are needed for the evaluation of vehicular emissions [4,5,6]. Usually, the estimation of vehicular and engine emissions is done by using a chassis dynamometer and engine, but these are costly and require quite a high amount without the representation of real-life emissions [6]. Tunnel studies and remote sensing aptly represent the road fleet emissions, but traffic flow, road conditions and technology lead to varying real-life emissions [7,8].
Certain studies have been conducted for the evaluation of pollutant emission from Particulate Matter and gaseous pollutants [9].However, mostly, these evaluations are carried out for a few specific developing countries only. Intergovernmental Panel on Climate Change (IPCC) (2007) states that activity data and emission profiles from a regional source are required for the calculation of tier-two emissions. A large dataset is required for the refined estimation of emission from the road transport sector, while encompassing the effects of all the region-specific variables.
The indoor air quality has been measured by the emission evolution of specific indoor sources. This procedure included three typical activities, namely cooking style, biofuels and different levels of toasting bread [10]. In another study [11], three different models were integrated into a hybrid model for the prediction of vehicular emission, at a specific location and time, in Malaysia. A method has been proposed for emission estimation and energy consumption based on the condition of vehicles in different regions such as Spain, Malaysia and Colombia [12]. In another study, the author discussed the delay issues and time complexity on the internet of vehicles [13]. The prediction of boiler performance in terms of mass flow rate and the temperature was performed by using Artificial Neural Networks (ANNs) [14,15].
An inventory was performed for the Bangaluru region at a grid resolution of 1 km [16]. Another study provides the PM10 and PM2.5 concentration data for a populated region in Erongo [17]. The properties of SO2 adsorption have been explored and evaluated [18]. Another study investigated the combustion and emission characteristics of diesel engines [19].
Strict vehicle emission regulations make sure that vehicles are efficient during their operation [20]. For major vehicle categories, the emission limits from the late 1990s are given by Euro Path; in 2000, 2004 and 2007, they were given by National-1, N-2 and N-3 standards. However, while implementing N-3 standards, it has been observed that the vehicle degradation occurs as the vehicle emission factors reach their highest values (Zhang et al., 2008). Hence, it was seen that, only after enforcing the N-4 standards, the pollutant emission factor was decreased [20]. Findings from the American Environment Protection Agency showed that NOx emission was decreased by 5%, HC emission was decreased by 7% and CO emission was decreased by 8% when the Sulfur (S) content in fuel was decreased to 49 mg/kg, which was almost similar to the N-4 fuel standard from 327 mg/kg, which was similar to N-3 fuel standard.
In Delhi, the road traffic increased from 128 to 191 vehicles per kilometer in the time frame from 2003 to 2009 [21]. Due to this, the availability of road space in Delhi increased by 678 lane kilometers between 2003 and 2009. In Delhi, the average annual rate of the vehicle population growth is about 9.150% for commercial and 7.40% for private vehicles. Annual growth in the vehicle population is causing severe environmental problems in Delhi [22]. Delhi occupies the fifth position when it comes to the worst traffic congestion/jams in a major city. Various models, like Spreadsheet, Long-Range Energy Alternative Planning (LEAP) and Vehicle Air Pollution Information System (VAPIS), do not take into consideration many distinguishing factors in the local environment, such as management of traffic and behavior of the driver; along with this, there is also an assumption that vehicles having lower speed increase the pollutant emission. Considering the above discussion, an IVE model which has been applied in various major cities all over the world, including cities such as Shanghai and Beijing in China, can be used for emission estimations [23]. For differently fueled vehicles, features such as meteorological variables, emission factors and different modes of driving are being used in this model, with further related studies in References [24,25,26,27,28,29,30,31,32,33,34,35,36,37,38,39,40,41,42,43,44,45,46,47,48,49,50,51,52,53,54].
The study by Reference [55] concentrated on the analysis of CO2 emission for five NMI subsectors. Authors have studied the CO2 emission for the time period of 30 years, from 2010 to 2030. In another study, authors have estimated the environmental technical efficiency and shadow prices for SO2 emissions of China’s provinces, from 2001 to 2013 [56]. Authors have highlighted the incompatibility in Carbon neutrality assumptions, system boundaries, methodologies and functional units in LCA studies of paper and pulp making [57]. An analysis has also been carried out which measures the effect of acceleration and speed on the emission of HC, CO and NOX in four-stroke motorcycle exhaust [58]. Another study has discussed the prospect of ethanol as an effective substitute for gasoline and also analyzed its effect on the emissive behavior of SI engines [59].
Some initiatives have been already taken to curb or reduce vehicular pollution: public awareness campaigns, registration of only those first-sale four-wheeled petrol-driven vehicles which have catalytic converters installed, the expansion of the rapid public transport system, the phasing out of old commercial vehicles, the compliance of tightened emission standards and improvement in fuel quality by completely phasing out leaded petrol and introduction of low Sulfur diesel. However, despite all of these measures taken, the problem still persists as a large and excessive need to study this situation, and analyses are required to understand the problem at a deeper level; with those results, a more practical approach can be strategized. This study shows that few parameters need to be a concern for reducing the pollutants emission by vehicles. These major parameters are the high survival rates, decrease in annual mileage and major enforcement for three-to-five-years-old vehicles. This study shows that many old vehicles are used in different regions after the many notifications regarding banning old vehicles by the Government of India. These old vehicles are the major source of vehicle pollutants.
The urbanization in Delhi NCR has led to a rapid increase in the vehicle count with respect to the rise in population and mobilization. The emissions from the vehicles are currently counted amongst the main sources of air pollution in Delhi, and this affects the quality of air. The emission criterion of various pollutants that are emitted from vehicles is evaluated through various international models that include the different vehicles, their driving modes, pollutants emitted and other meteorological factors. The estimated emissions of pollutants such Carbon Monoxide (CO) and Particulate Matter (PM) from different types of vehicles and different fuel types have undergone diurnal variation over the years, depending upon the time of the day. This paper makes an attempt to study and analyze the pollutants by the emission of gases by vehicles which emit from them. The various facts and data were calculated and analyzed with reference to the standard values set by the national schemes of pollution and the environment. Based on this statistical data obtained and analyzed, the scenarios regarding future vehicle growth rate and its impact on air quality are mentioned, to overcome emission problems. Therefore, it is important to develop and deploy methods for obtaining real-world measurements of vehicle emissions, to estimate the pollutants. The comprehensive review reveals whether the moving vehicles create a significant impact on air quality on specific locations or not.
The significant contribution of this paper is its presentation of the gaseous pollutants (Hydrocarbons (HC), Carbon Monoxides (CO) and Carbon Dioxide (CO2)) emission factor of 181 four-wheeler cars from different companies and of different types of fuels. Based on this statistical data obtained and analyzed, the scenarios regarding future vehicle growth rate and its impact on air quality are mentioned, to overcome emission problems. This study shows that many old vehicles are used in different regions, even after the many notifications regarding banning old vehicles by the Government of India. These old vehicles are the major source of vehicle pollutants. The unauthorized installation of compressed natural gas (CNG) kits also has to be banned strictly. Secondly, technological advancement not only targets fuel efficiency but also targets the reduction of CO, CO2 and HC. It will be helpful to pollution-monitoring authorities for making new and effective policies against the emission of pollutants by vehicles.
The paper is organized as follows: The methodology is discussed in Section 2, which includes the quantification of emissions, studied area, experimental setup and data collection; Section 3 presents the result analysis; and, finally, the study is concluded in Section 4.

2. Methodology

2.1. Quantification of Emissions
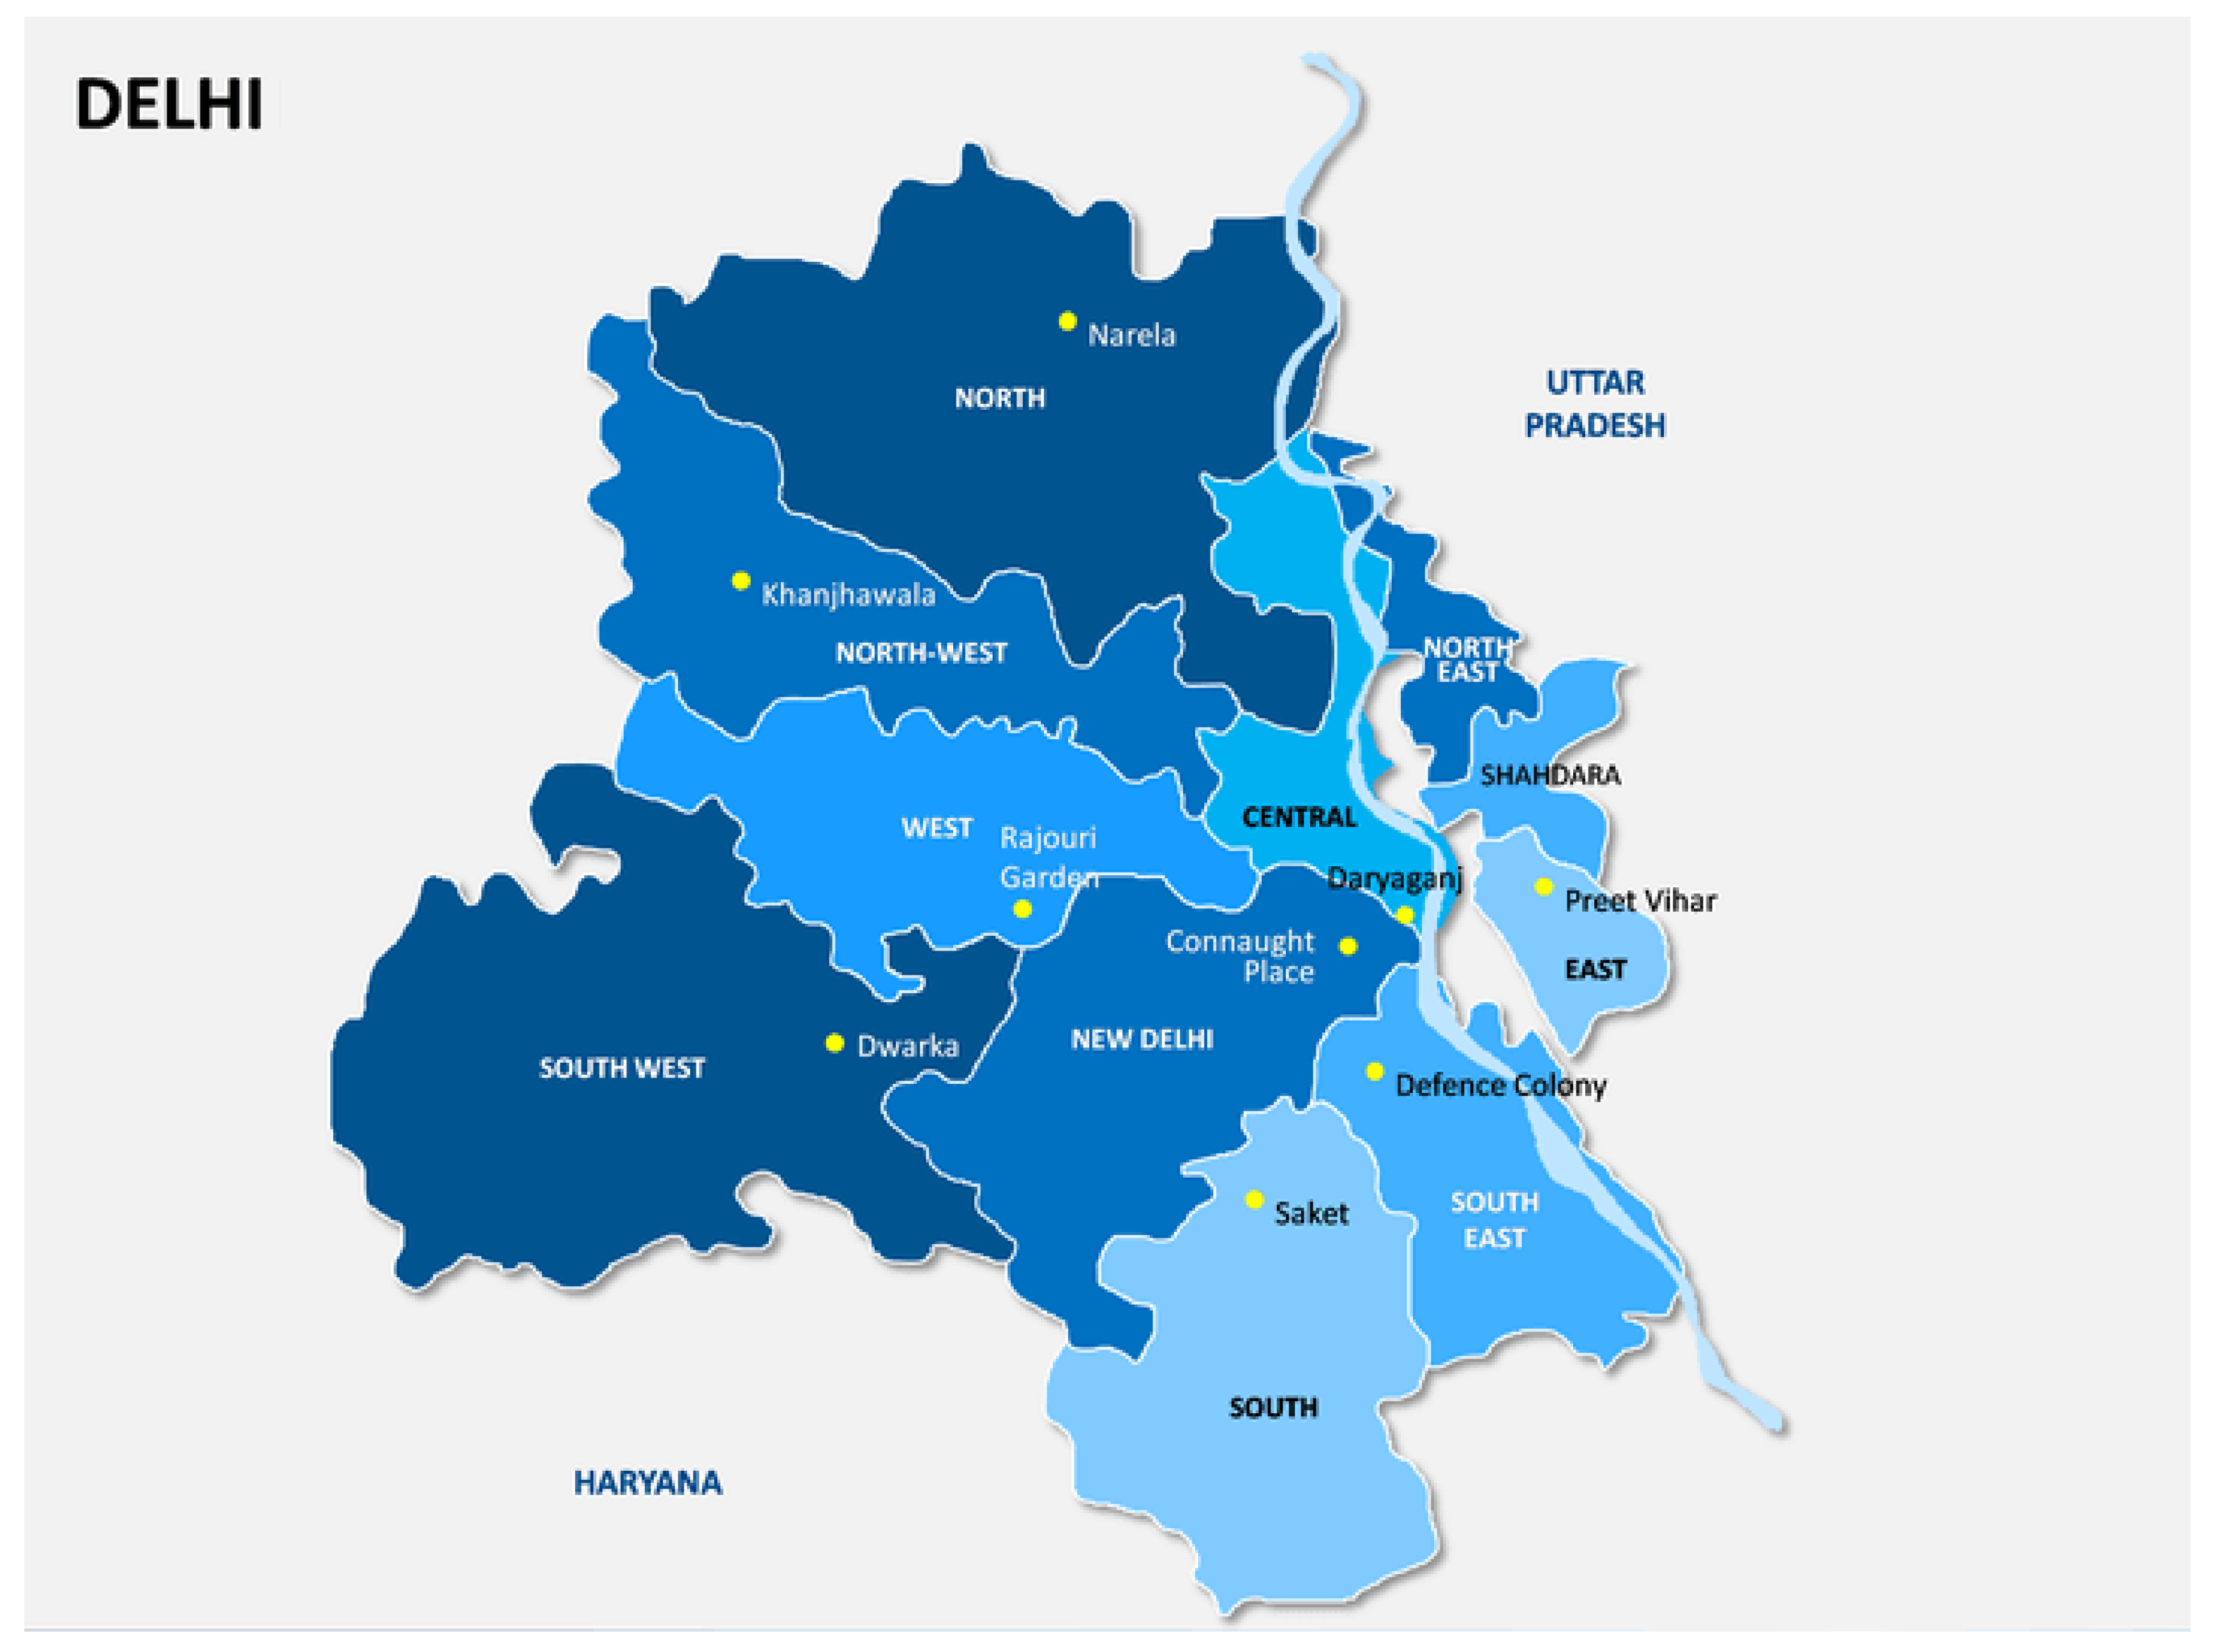
The estimation of the emissions from the on-road vehicles is done on the basis of a number of vehicles and distance traveled in a particular year per different vehicle. This can be expressed as follows:
E i = ( Vehj × Dj ) × Eijkm
where Ei = emission of compound (i); Vehj = number of vehicles per type (j); Dj = distance traveled in a year per different vehicle type (j); and Ei,j, and km = emission of compound (i) from bottom-up approach [60] were taken into account so as to estimate gaseous and particulate emission based on annual average utilization for a different vehicle category, number of registered vehicles and the corresponding emission factors vehicle type (j) per driven kilometer. Annual utilization of cars and jeeps and taxi were assumed to be 33,500, 12,600 and 12,600 km, respectively. These values were taken on the basis of five-year planning reports of India. For other sections of vehicles, annual utilization was calculated by taking the average of all the above values. The CO2 emission [61] is estimated by using the value of the consumption of fuel [24,62] and emission factor, as follows:
E i = ( Fuelj , k × EFi , j )
where Ei = emission of compound (i); Fuel j,k = consumption of fuel (j) for transport type (k); and EFi,j= emission factor for compound (i) emitted from fuel (j).
Emissions of CO and HC were estimated by using the following equation:
E m i s s i o n s   ( k t ) = Fuel   Consumption   ( kt ) × NCV ( TJ Kt ) × Gas   Specific   Emission   Co efficients   ( kg TJ )
Stoichiometric air–fuel ratio and equivalence air–fuel ratio or Lambda(λ) are the important parameters for the analysis of pollution emitted by vehicles. To understand the Stoichiometric air–fuel ratio, we need to look at the fuel combustion process. It is a process in which the mixture of fuel and water produces water, heat and Carbon Dioxide. Activation energy is also required for the occurrence of such an oxidation reaction.
Fuel   +   Oxygen     ( Activation   Energy )   S p a r k   ( SI ) H i g h T e m p e r a t u r e   ( CI )     CO 2   +   H 2 O   + Energy
With the help of Stoichiometric air–fuel ratio, the value of Lambda can be calculated by using the following equation:
Lambda   ( λ )   =   A F R a c t u a l A F R i d e a l
Hence, the Lambda factor can be calculated by using the actual and ideal value of air–fuel ratio.

2.2. Locations

The most appropriate region chosen for the analysis of vehicular emission and its pollutants is the Delhi Northern Central Region. Delhi, a vast metropolitan area in the northern part of the country, is India’s capital territory as shown in Figure 1. The city covers the area of 1484 square kilometers (573 sq. mi) bordered by Haryana and Uttar Pradesh. The urban area of Delhi extends afar from the national capital territory border. The National Capital Region (NCR) consists of cities like Gurgaon, Noida, Ghaziabad and Faridabad. The National Capital Region (NCR) also includes Delhi, which is considered to be an“interstate regional planning” area by the National Capital Region Planning Board Act of 1985. A survey conducted by the World Health Organization (WHO) in 2014 shows that Delhi was the most polluted city in the world. Delhi was downgraded to the eleventh-worst city in the urban air-quality database in 2016. The air quality of Delhi is usually Moderate (101–200) level between January to September, and then it becomes Very Poor (301–400), Severe (401–500) or Hazardous (500+) between October and December. There is such deterioration in air quality due to various factors like stubble burning, firecrackers burning during festivals like Diwali and cold weather. The levels of Particulate Matter (PM) in Delhi have increased by about 44%, mainly due to high industrial and vehicular emissions, construction work and crop burning in neighboring states. The level of airborne Particulate Matter is also very high, that is, around PM 2.5, which is considered as most harmful to health. Increasing levels of vehicular pollution have consequently caused diseases such as asthma and lung cancer amongst the population of Delhi. The dense smog results in major air and rail traffic disruptions every year, during the winter season. The Indian meteorologists lately stated that the average peak temperature during winters has decreased in Delhi since 1998 due to rising vehicular emissions and, hence, the air pollution. Some measures have been taken to overcome air pollution in Delhi. Delhi has been ranked third amongst the other Indian cities in the count of trees. The world’s largest fleet of eco-friendly compressed natural gas (CNG) buses is controlled by Transport Cooperation of Delhi. The CSE began public interest litigation that ordered the Delhi’s transport system to switch on CNG and not to use the leaded petrol in 1998. The Department of Energy of the United States declared Delhi as its first “Clean Cities International Partner of the Year” in 2003 for its efforts to overcome air pollution by choosing eco-friendly fuel initiatives. The air pollutants in the city are also reduced by choosing Delhi metro cooperation as the main transport source in the city.
Therefore, as per various studies, many of the gains are lost. There’s a significant decrement in bus ridership due to an increment in the market share of diesel cars. The city remains assessed at basic sustainability due to the Carbon emissions of its poorer neighborhoods.

2.3. Experimental Setup

In this section, we discuss the test procedure used for analyzer gasses. Some of the compulsory steps needed to be performed for the analysis of gas. For the gas analyzer, as per the specifications of the fabricator, the power supply is checked, and earthing also needs to be proper, in order to perform a test on vehicles. The electrical calibration should be checked. The availability and the functionality of all the components as per the fabricator need to be checked. With the help of the sample gas of suitable value for Carbon Monoxide (CO) and Hydrocarbons (HC), the span and zero calibrations are checked. We also need to check if the sampling system is leak-proof or not. Finally, it is checked if the printer is working efficiently and the print-out information is correct.
We also discuss the test procedure used for smoke meters. Some of the necessary steps needed to be carried out on smoke meters. It is checked that if the calibration of the meter is at zero and midscale point while the neutral density filter is available, after the warm-up of the meter. The ideal value must lie within 0.1 m−1. The components, such as the sample hose, internal pipes, etc., are checked if they are deteriorated or have damages, to ensure that there are no leakages. The functionality of the heating system for the optical chamber is checked. The purge air system and visual displays should also be checked, to see if they are working correctly. The functioning of the oil temperature and Revolutions Per Minute (RPM) sensor also needs to be checked. Finally, it is checked if the printer is working efficiently and the print out information is correct, and the instrument casing should be proper, with a proper electrical earthling.
The prescribed standard for different fuel-type vehicles consists of the appropriate values of Carbon monoxide (CO), Hydrocarbon (HC) and Lambda in the different Bharat stage norms as shown in Table 1. Here, CO and HC have emitted pollutants, and Lambda indicates the optimum condition needed for the proper functioning of catalytic converters. The estimation of the pollutants emitted is also based on the prescribed Hartridge Smoke Unit (HSU) and measured HSU. HSU (Hartridge Smoke Unit) is a unit of measurement used to measure the capacity of exhaust gases of emissions, especially in diesel engines. The HSU limit for pre-Bharat Stage 4 norms was 65. The prescribed values for petrol vehicles consisting of pollutants and Lambda are stated as follows:
  • Prescribed Standard for Petrol Vehicles in Bharat Stage 4 norms:
  • Carbon Monoxide (CO): −0.3 ppm.
  • Hydrocarbon (HC): −200 ppm.
  • Lambda (λ): Should be in the range of 0.97–1.03.
  • Prescribed Standard for Petrol Vehicles in Bharat Stage 3 norms:
  • Carbon Monoxide (CO): −0.5 ppm.
  • Hydrocarbon (HC): −750 ppm.
The emission estimation rate for petrol vehicles is evaluated using the prescribed values and the measured values of various pollutants and other different factors. The values of Carbon Monoxide (CO), Hydrocarbon (HC) and Carbon Dioxide (CO2) ppm. These measured values are then compared with the prescribed values based on various factors such as Bharat Stage norms, Manufacturer of the vehicle, Model of the vehicle, Year of Registration of the vehicle.
Similar to the emission evaluation of petrol vehicles is the emission estimation of petrol/CNG fuel type vehicles. It consists of the estimation of emission of pollutants from petrol/CNG vehicles by collecting the appropriate values of pollutants emitted with reference to the prescribed values as per the Bharat Stage norms. Here, we consider the prescribed standards of the petrol fuel type vehicles in Bharat Stage Norm 3 and Norm 4. Moreover for the CNG/petrol fuel type vehicles, the Carbon Monoxide (CO) and Hydrocarbon (HC) are considered only (in ppm) and not Carbon Dioxide and Lambda. The values of CO and HC are measured from vehicles which are then compared with the prescribed values of the petrol type vehicles based on various factors such as Bharat Stage norms, Manufacturer of the vehicle, Model of the vehicle, Year of Registration of the vehicle.
The estimation of the emission of various pollutants in diesel type vehicles is done by comparing the prescribed and measured values of HSU. HSU is the unit of estimation to evaluate the capacity of exhaust gases of emissions in diesel engines. HSU stands for Hartridge Smoke Unit. The prescribed standard of HSU (Hartridge Smoke Unit) for diesel vehicles in Bharat Stage 3 norm and Bharat Stage 4 norm is 65 and 50, respectively. The HSU values of different diesel vehicles are collected. The comparison is then made between diesel vehicles with respect to different comparable factors, such as Bharat stage norms, a manufacturer of the vehicle, vehicle model number, year of registration of the vehicle, prescribed values of HSU and measured values of HSU.

2.4. Data Collection
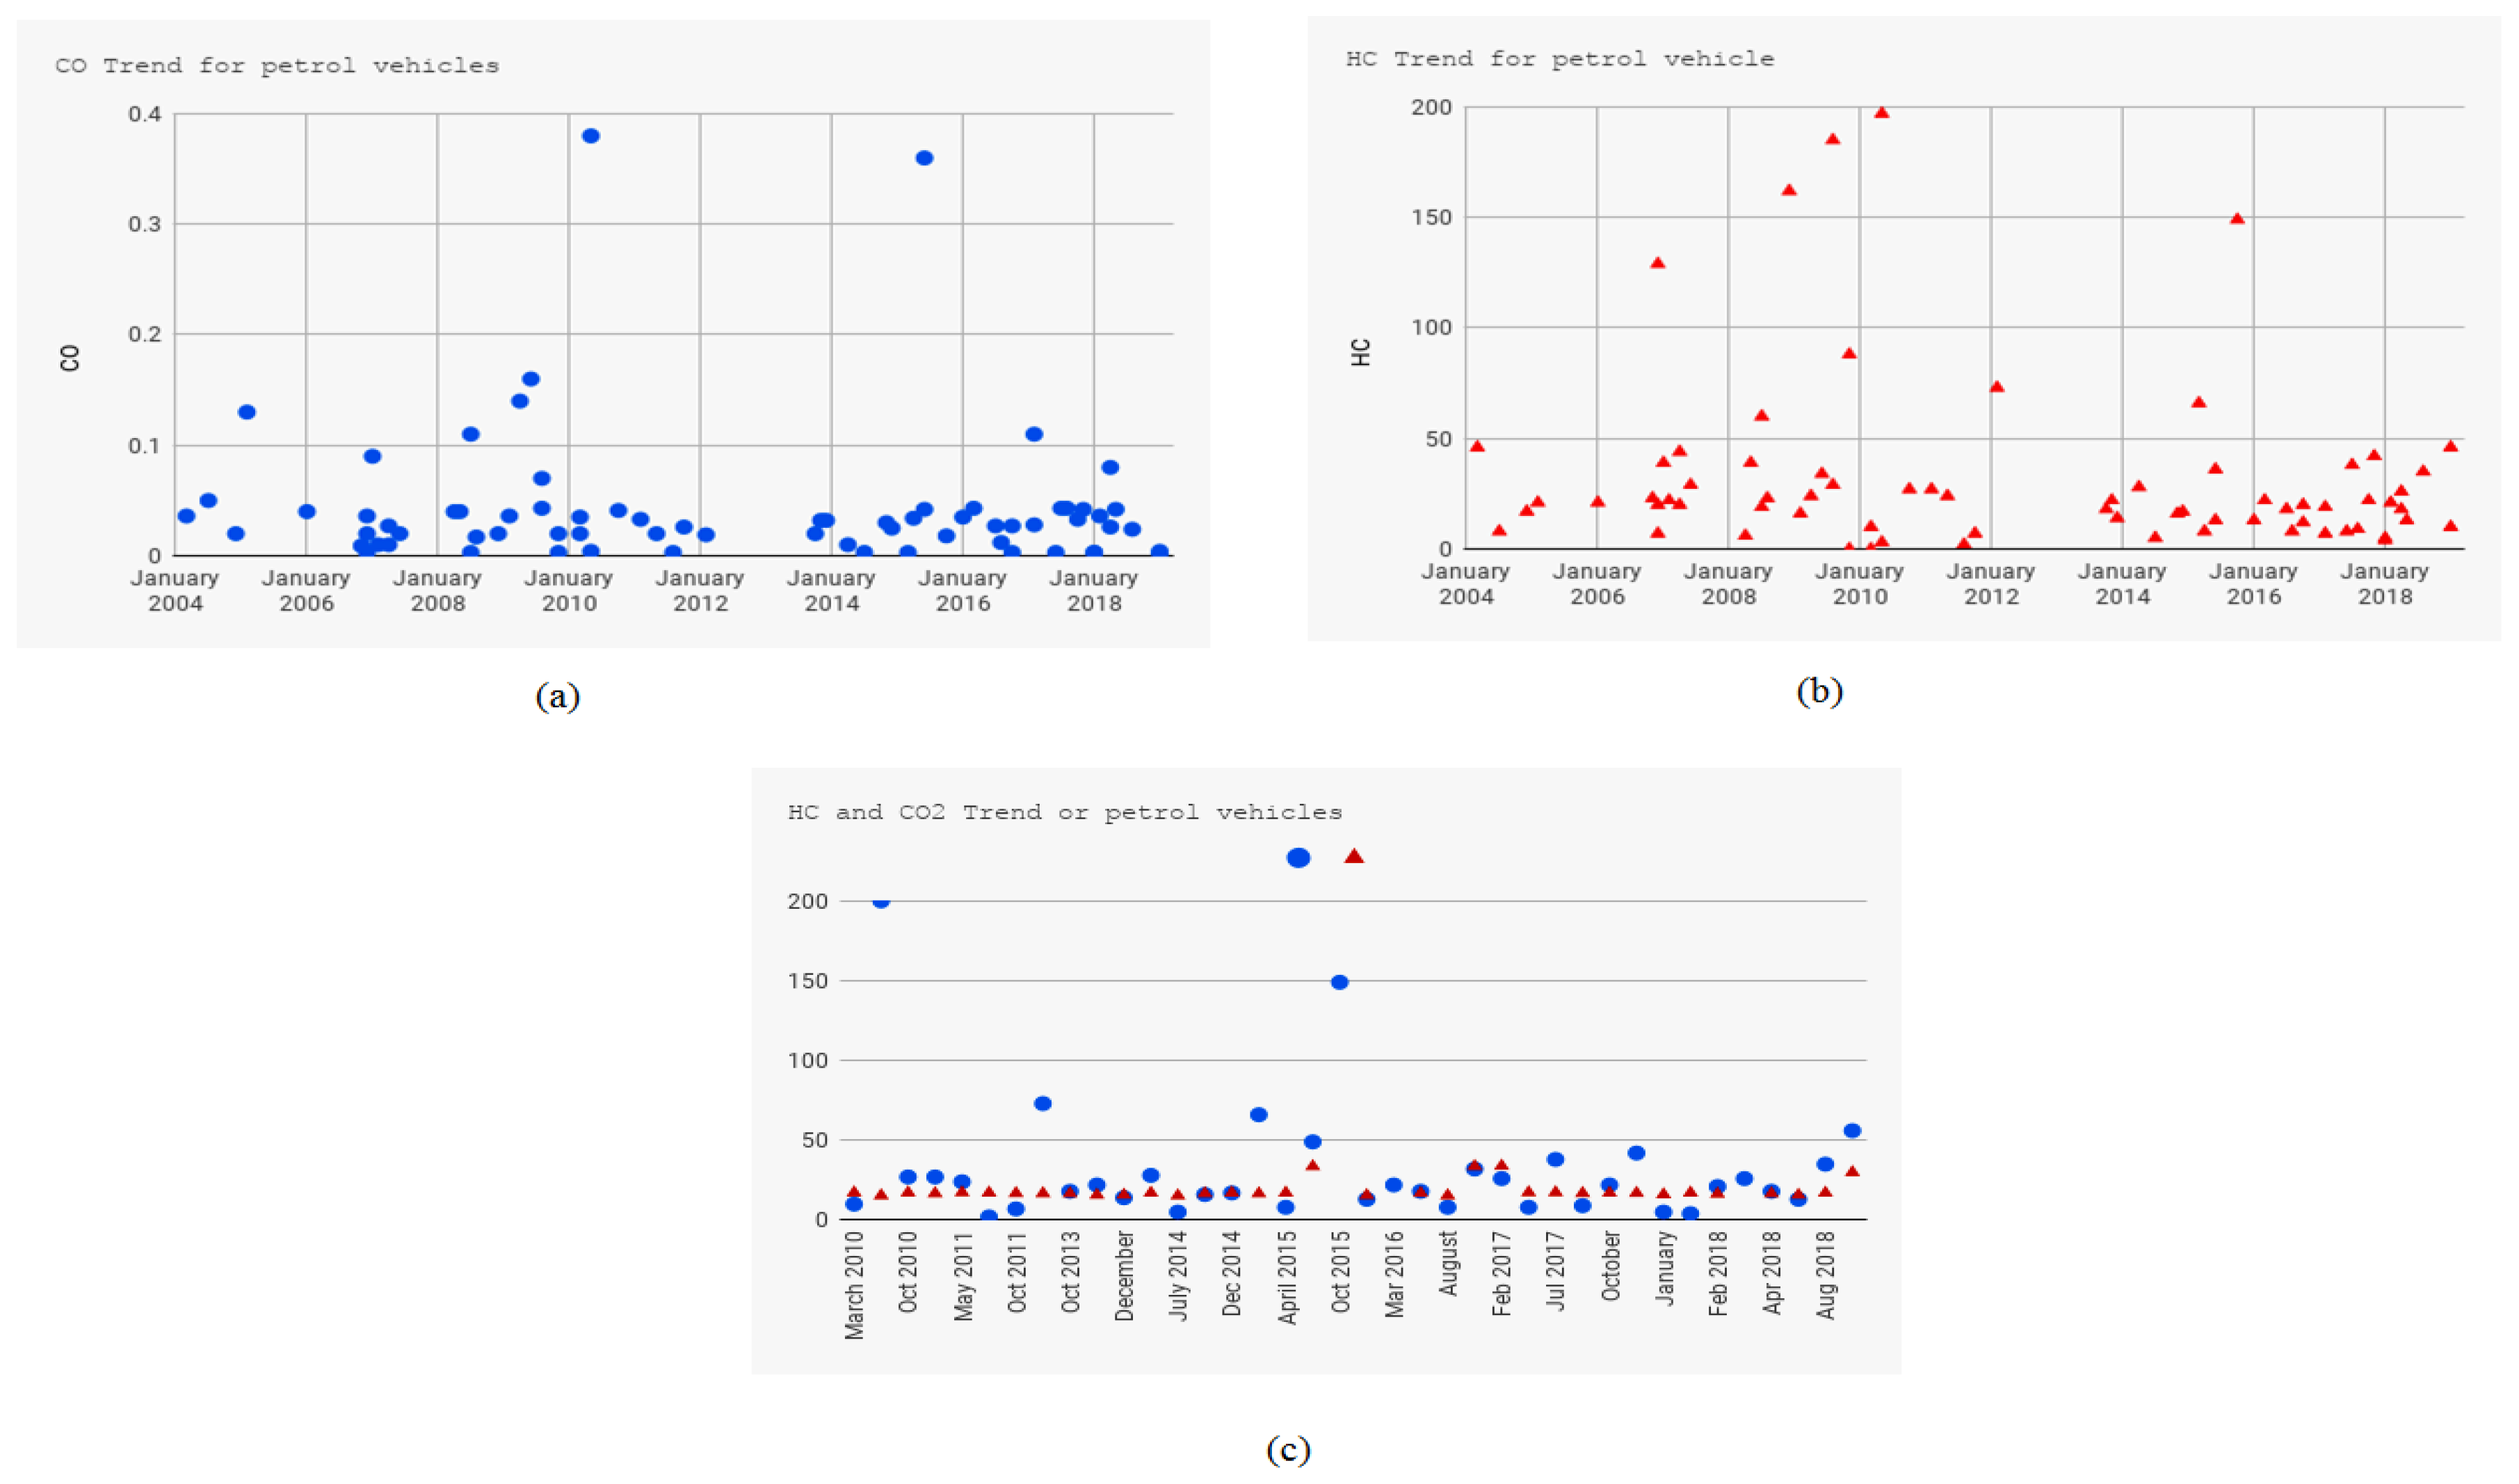
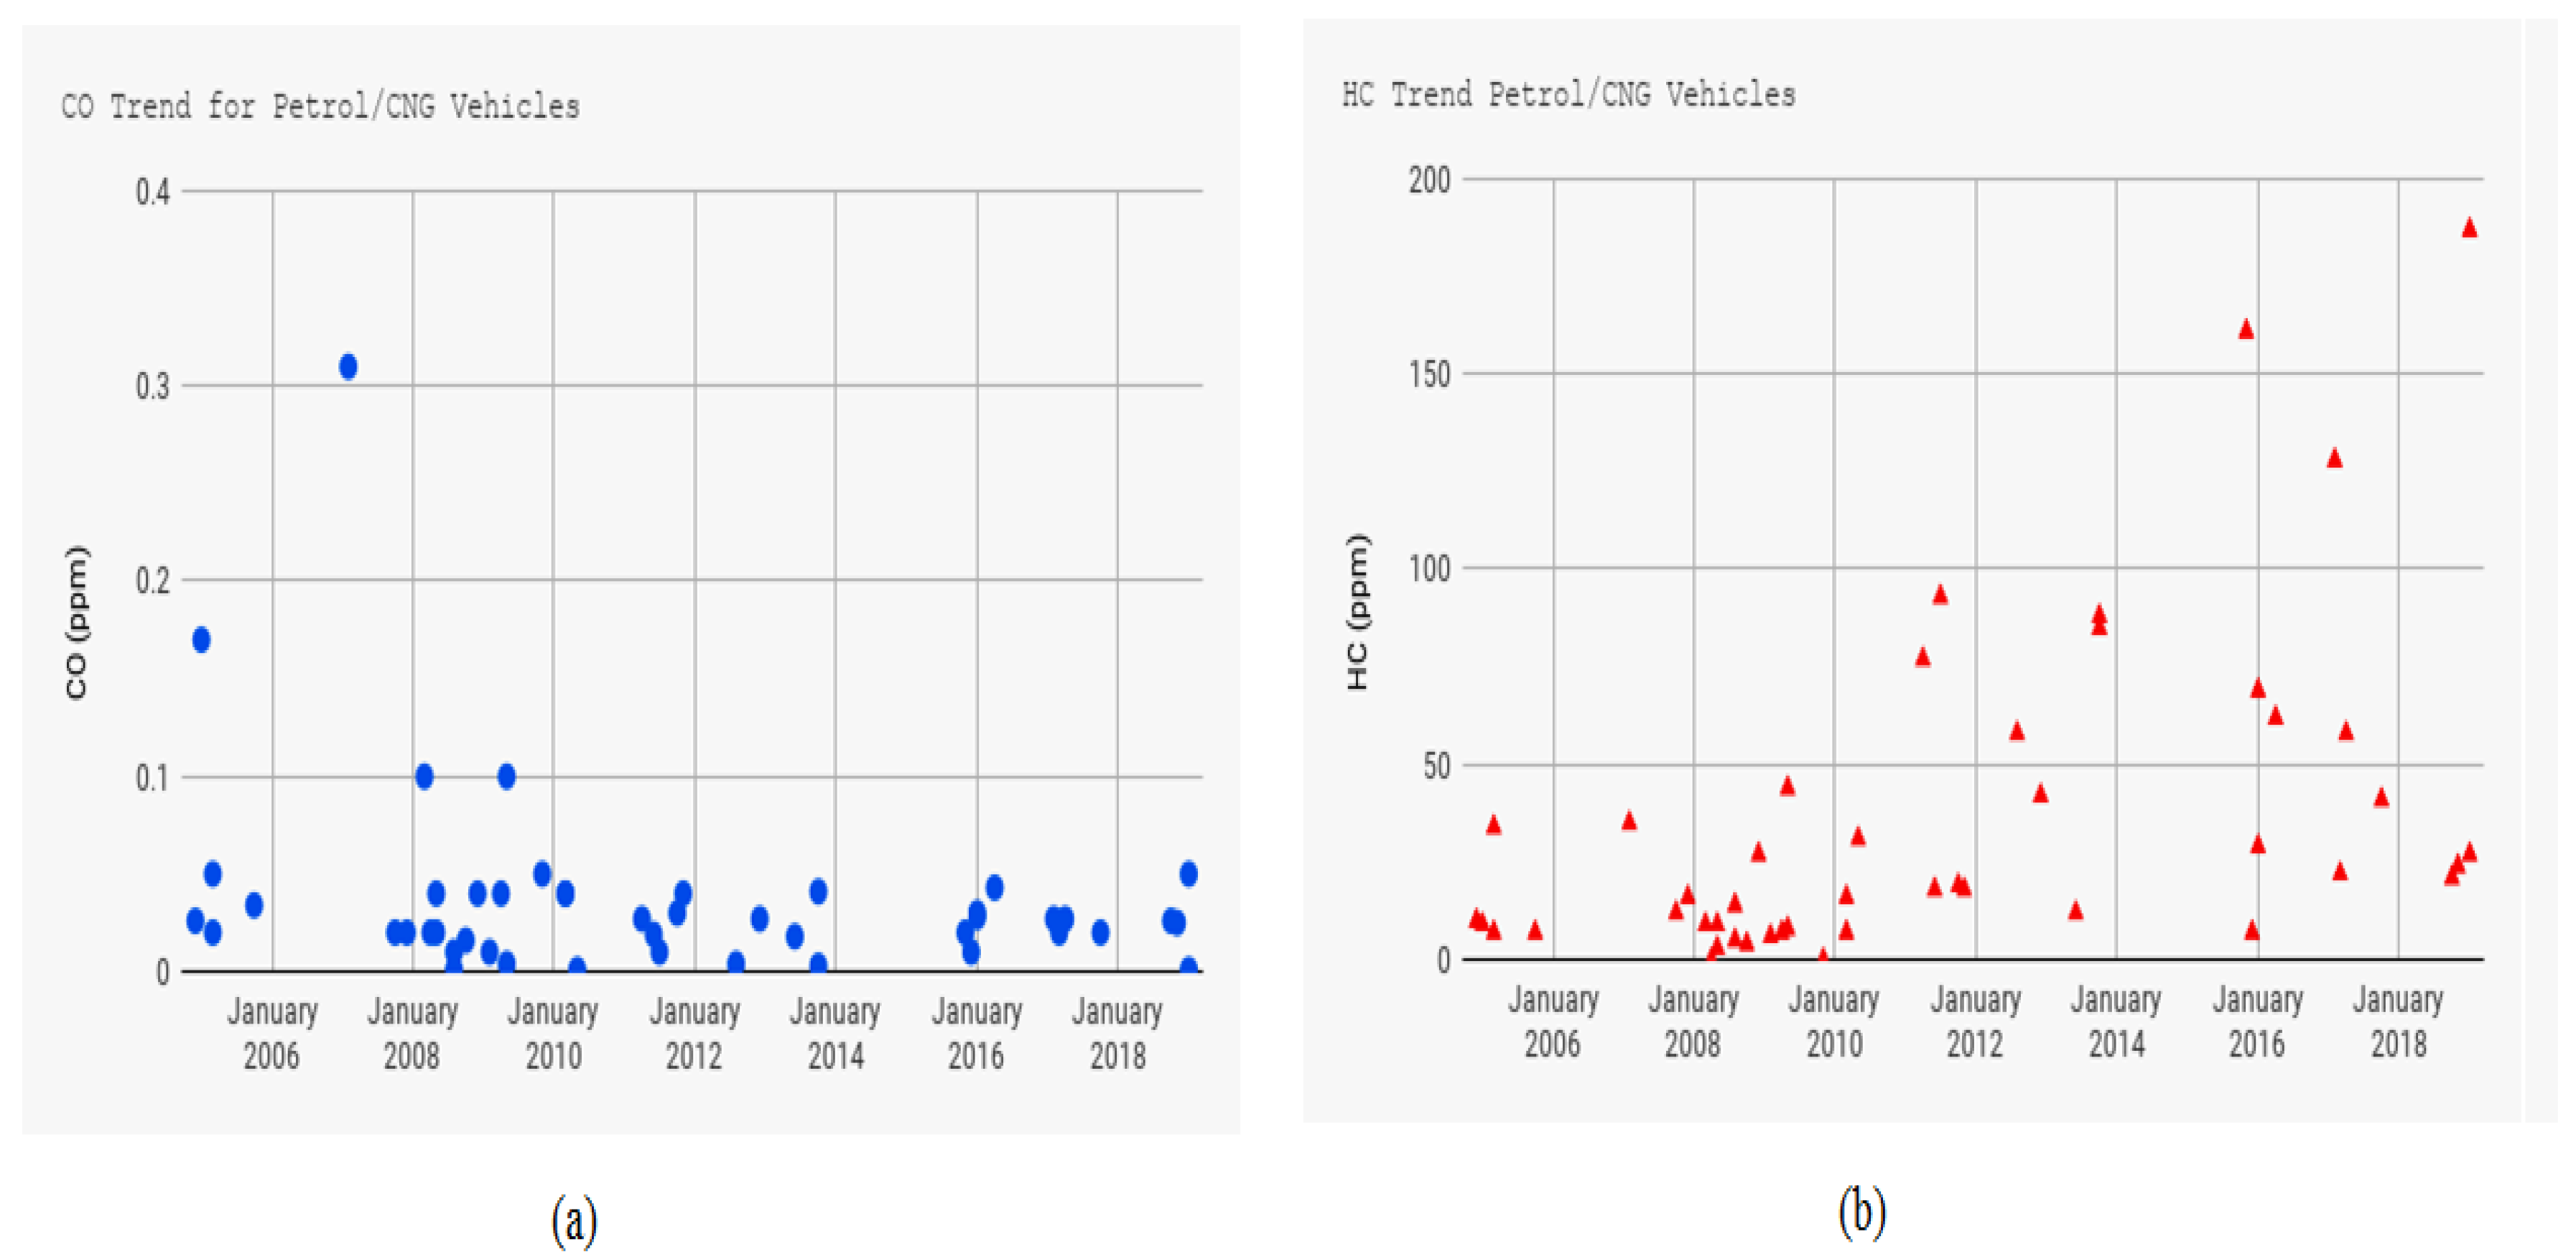
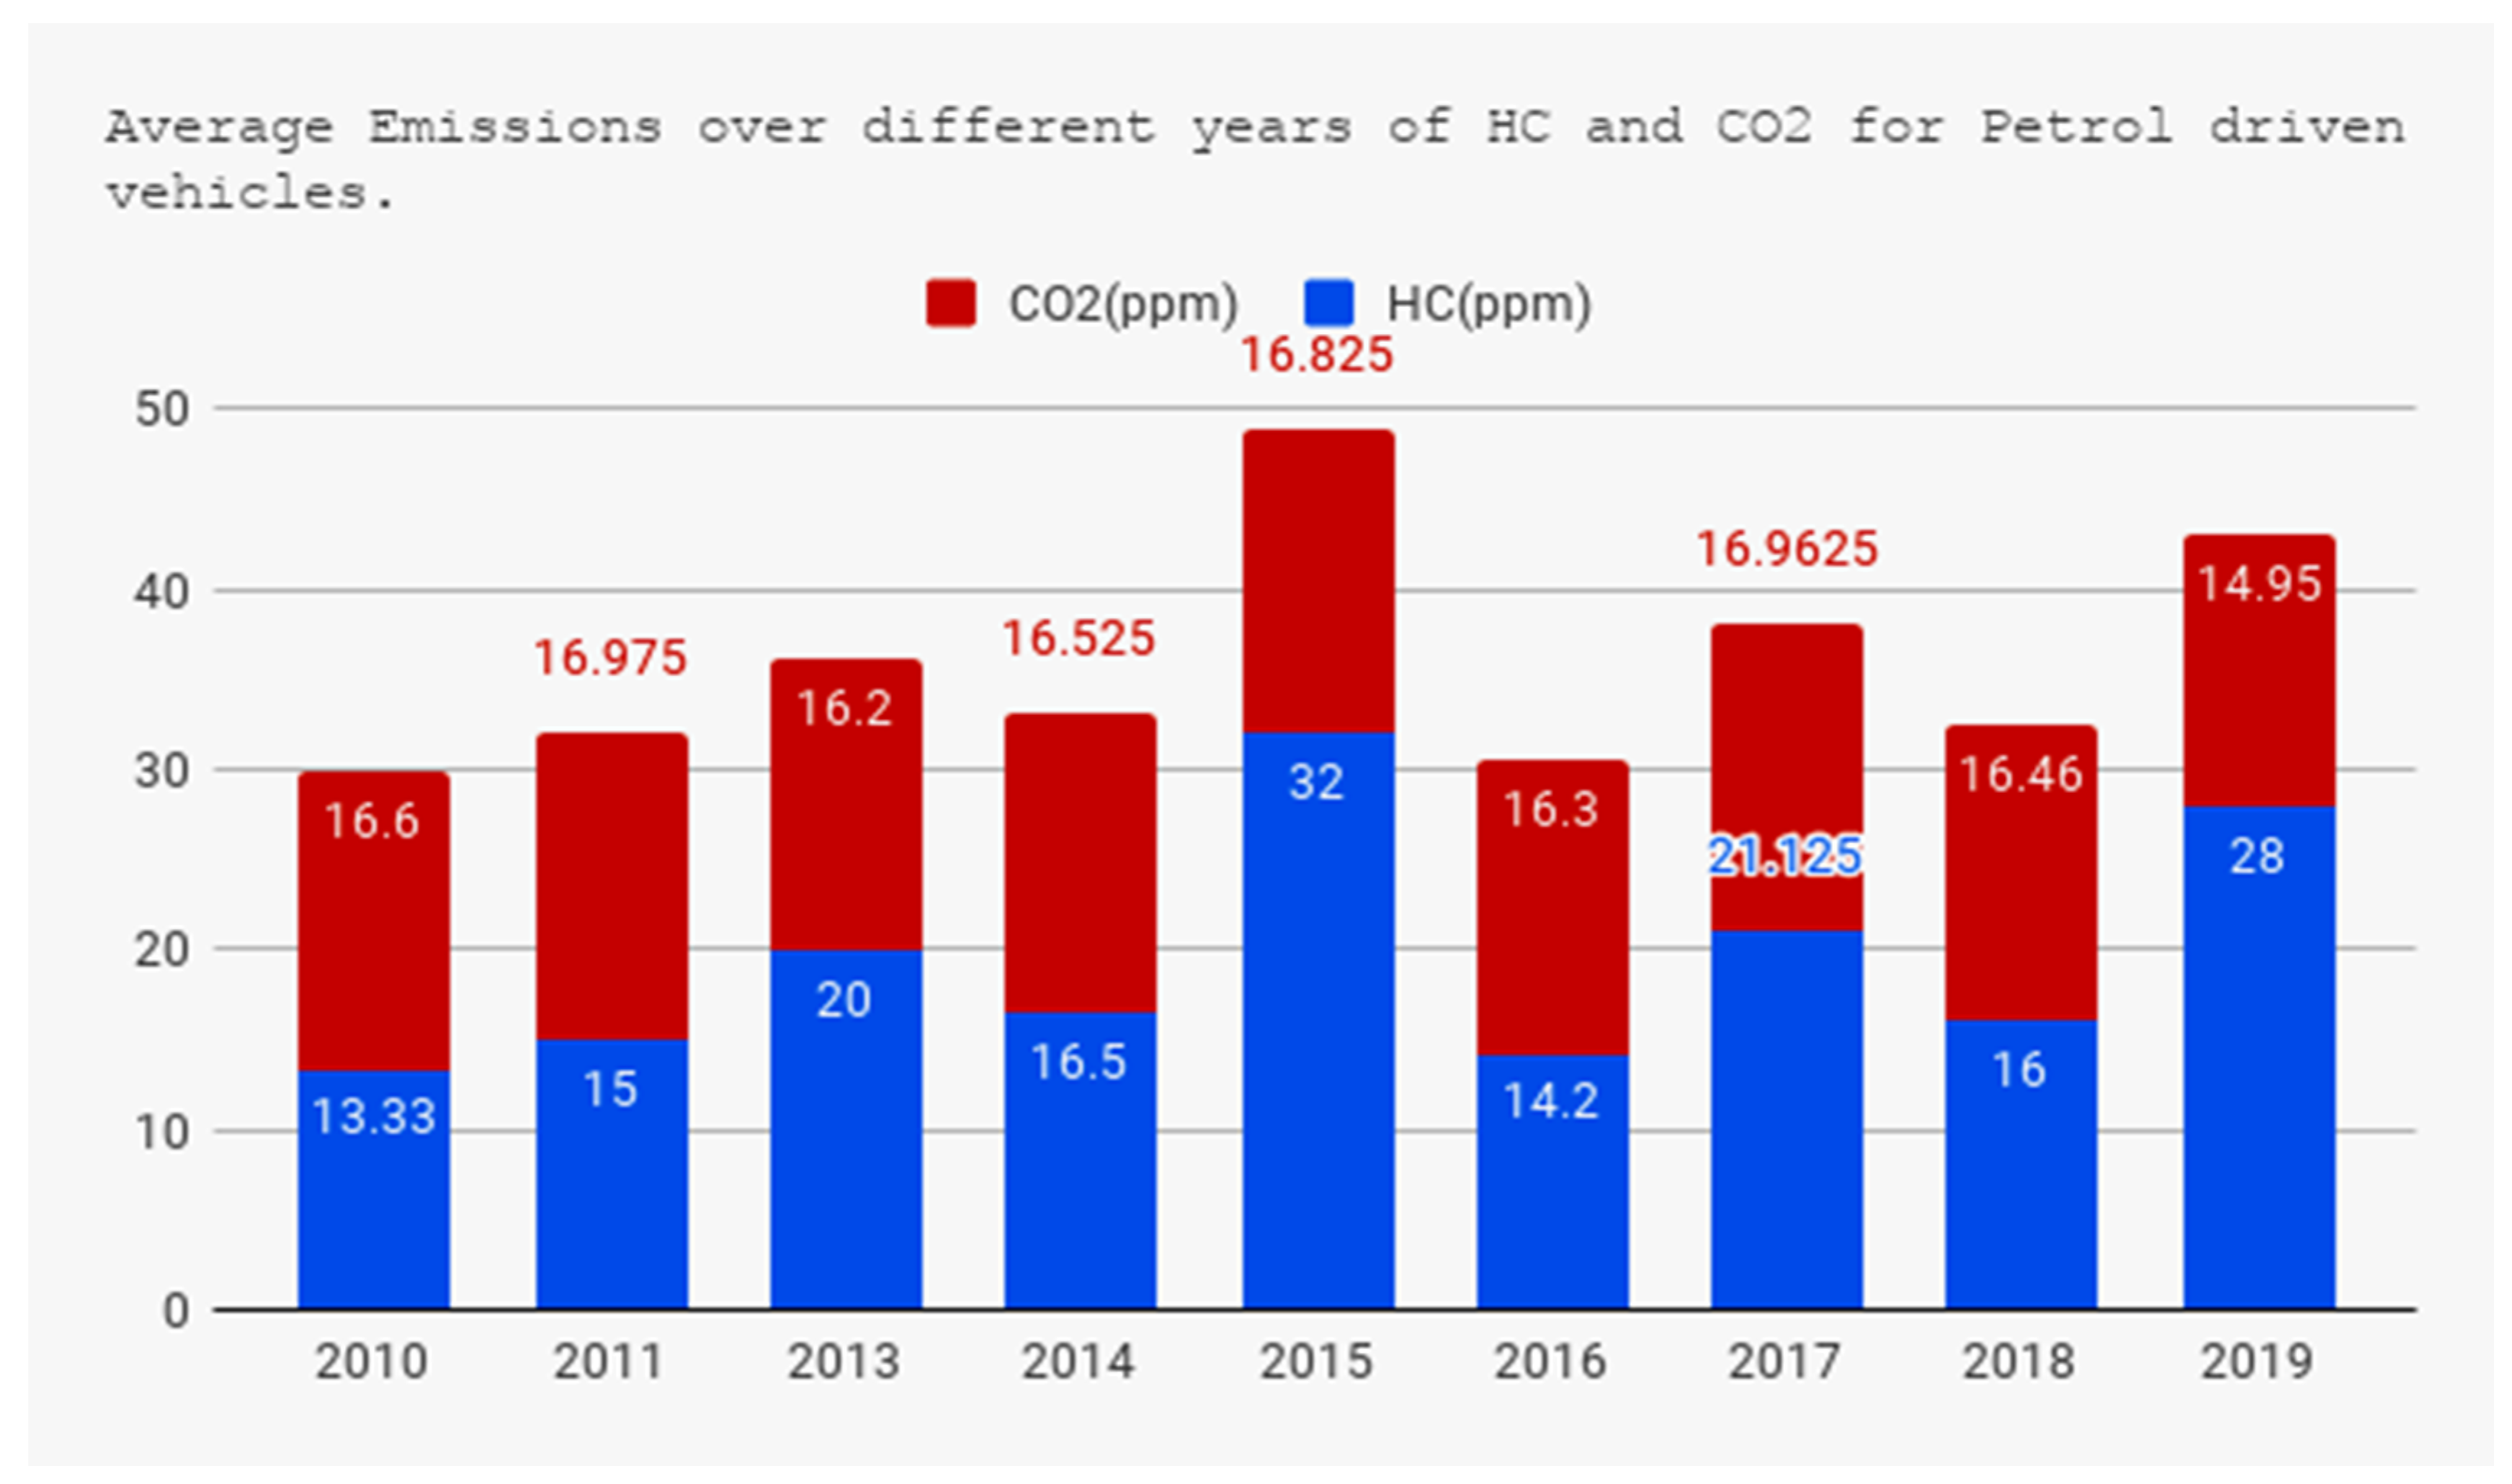
The following data were collected from pollution certificate centers of Delhi NCR. A total data of 181 vehicles were used and analyzed collectively, to reach the following outcomes. Table 2 showcases the characteristics of the different vehicles which were analyzed by displaying varying vehicle maker/companies having different models and registration dates. It also shows the varying or similar engine capacities between two fuel types (diesel and petrol) from different vehicle models. Engine capacity of a vehicle simply depicts the area in which any engine’s pistons work/operate; hence, a larger amount of fuel and air is being processed when a vehicle is moving with a larger engine capacity. The average engine capacity calculated from the given table is 1778 cm3 (approximately) for diesel engines and 1295 cm3 (approximately) for petrol engines; hence, we can observe that vehicles having a diesel engine have a larger engine capacity, on average, than vehicles having a petrol engine, meaning that it is processing more fuel than its counterpart. A major difference between diesel and petrol engines is that the diesel engine uses more air and less fuel than the petrol engine to operate at the same level, hence emitting less CO2 despite having a larger concentration of Carbon in it than petrol. The analysis stated that the diesel engine would emit less CO2/km than a petrol engine if having an almost-similar engine capacity.
Table 3, Table 4 and Table 5 display the value/level of pollutants emitted by each vehicle, with its prescribed value. It also shows the Bharat stage norms each car is following, and their registration dates are in the chronological order.
Table 3 displays the value/level for vehicles using diesel as a fuel type. Emission from diesel vehicles is measured on the basis of HSU (Hartridge Smoke Unit), which is a unit of measurement used to measure the capacity of exhaust gases during emission. The HSU limit for pre-Bharat Stage 4 norms was 65, and for Bharat Stage 4 norms, it has been reduced to 50. Some of the major maker/companies being showcased through the table are Toyota, Maruti Suzuki, Hyundai, Honda, Mahindra, TATA and some luxury makers. As can be seen from the information mentioned above, we used vehicles from both indigenous and foreign makers/companies, thus adding another dimension to the analysis. The given data of HSU range from the value of 30.90.86 to 46.01.43, leading to the conclusion that most of the diesel vehicles are well below the current prescribed limits of HSU emission, yet the pollution levels are increasing at an alarming rate. Here we can also conclude that some of the old cars are well maintained and not emitting a large number of pollutants; it may be because the regular maintenance and service by car owner. Many old-car owners followed the pollution-under-control norms introduced by the Government of India. They always adopt new steps for reducing the pollution emission, while driving their cars. The following are the steps that can be helpful for someone for reducing the maintenance cost of vehicles, as well as the emission of pollution, too. Everyone needs to keep vehicles well-tuned and inflate the tires regularly, use biofuels such as CNG for regular derive, kept regular maintenance and test vehicles every 3 months by nearby installed pollution-under-control-norms center.
Details about the petrol type fuel are presented in Table 4, in which emissions are measured from three different pollutants which are CO (Carbon Monoxide), HC (Hydrocarbons) and CO2 (Carbon Dioxide). Another parameter that is being measured for petrol driven vehicles is Lambda (λ), indicating the optimum conditioning needed for the proper functioning of catalytic converters. The vehicles registered during the pre-Bharat Stage 4 norms are only tested for CO and HC, having a prescribed limit of 0.5 and 750 ppm. For Bharat Stage 4 norms which were adopted in 2010 the prescribed limit for CO and HC are 0.3 and 200 ppm; Lambda should be in the range of 0.97 to 1.03. The given data of CO ranges from 0.001 to 0.380 ppm, and for HC, the data range from 0 to 197 ppm. The given data for both the pollutants have a large range, which shows that there are many parameters which give any vehicle its emission results, e.g., the distance traveled and the terrain on which the vehicle has been driven, the maintenance of the vehicle and the maker/company of the vehicle.
Table 5 showcases the details about vehicles that operate/run on petrol/CNG. For such vehicles, only CO and HC are measured with the same prescribed limit as according to pre-BS4 and BS4 norms; Lambda (λ), as a parameter, is not measured for such vehicles. In the data collected for petrol/CNG, the value of CO ranges from 0.001 to 0.310 ppm, and the value of HC ranges from 0 to 187 ppm. We can also notice that the data for petrol and petrol/CNG driven vehicles almost have the same range.
Table 6, Table 7 and Table 8 displays the average emissions over different years of HSU for diesel-driven vehicles and CO, HC and CO2 for petrol and for petrol/CNG-driven vehicles. Calculating the average emission over different years helps in realizing how a change in technology over the year can affect vehicular emissions. The average emissions in chronological order for vehicles operating from a diesel engine are given by Table 6. The average HSU emission is calculated from the year of 2009 to 2018. The lowest HSU emission average (38.53.36) is calculated from the year 2015, and the highest average (43.31.35) is calculated from the year 2009. Table 7 displays the average emissions of three pollutants (CO, HC and CO2) for vehicles operating on a petrol engine. The average values of pollutants are calculated from the year of 2010 to 2019.
The lowest average of CO (0.003 ppm) is derived from the year 2019, and the highest average (0.10975 ppm) is derived from the year 2015. The lowest average of HC (13.33ppm) is derived from the year 2010, and the highest average (32 ppm) is derived from the year 2015. The lowest average of CO2 (14.95 ppm) is from the year 2019, and the highest average (19.975 ppm) is from the year 2011.Table 8 displays the average emissions of just two pollutants (CO and HC) for vehicles operating on petrol/CNG. The average values of pollutants are calculated from the year 2005 to 2017. The lowest average of CO (0.0150 ppm) is from the year 2015, and the highest average (0.116 ppm) is from the year 2007. The lowest average of HC (8.875 ppm) is from the year 2008, and the highest average (84 ppm) is from the year 2015.

3. Result Analysis

Our analysis is based on the data collected from the different pollution tracker nodes installed across the different locations in Delhi NCR. The analysis shows that few parameters need to be a concern for reducing the pollutants emission by vehicles. These major parameters are the high survival rates, decrease in annual mileage and major enforcement for three-to-five-year-old vehicles. In Table 2, we can track out that a large number of old vehicles are used in different regions after the various notifications in regard to banning old vehicles by the Government of India. These old vehicles are the major source of vehicle pollutants (Figure 2, Figure 3 and Figure 4).
This situation can be handled by introducing the low survival rate for vehicles. It would correspond to easy replacement or breakdown of old vehicles. Thus, after introducing this, the pollutants share of old vehicles would be low. Lowering the survival rate will down the percentage of pollutants emission by old vehicles.
Lowering the mileage can also result in low fuel consumption and reduce emissions, too. The vehicles can be categorized in different mileage levels. For new vehicles, the mileage should be high, and for old vehicles, those having a high emission, the mileage level should be low. Major enforcement is also needed for reducing vehicle pollution. Time to time, vehicle services and enforcement are very important to reduce the pollutants emission by vehicles (Figure 5). The current study can make significant correlations with the impact of emission components toward sustainable development. We can further investigate in terms of green ICT and pollution, as well. In the future, based on several available studies found from the work done by several researchers, we may try to further explore the solutions for reducing pollutants. We can find some IoT sensor-enabled technologies to raise alarms if the pollution level or emission of specific gases, such as CO, CO2 and HC, go beyond the acceptable limits [63,64,65,66,67,68].

4. Conclusions

This study presents the gaseous pollutants (181) emission factors of 181four-wheeler cars from different companies and of different types of fuels. The measurement of gaseous pollutants was done for Delhi, the most polluted city in India. Table 3 displays the value/level for vehicles using diesel as a fuel type. Emission from diesel vehicles is measured based on HSU (Hartridge Smoke Unit), which is a unit of measurement used to measure the capacity of exhaust gases during emission. Some of the major makers/companies being showcased through the table are Toyota, Maruti Suzuki, Hyundai, Honda, Mahindra, TATA and some luxury makers. The given data of HSU range from the value of 30.90.86 to 46.01.43, leading to the conclusion that most of the diesel vehicles are well below the currently prescribed limits of HSU emission, yet the pollution levels are increasing at an alarming rate. Here we can also conclude that some of the old cars are well maintained and not emitting a large number of pollutants; it may be because of the regular maintenance and service by the car owner. This study is also demonstrating the different HSU values emitted by the different companies’ cars. The results also demonstrate that the new advancement in automobile industries is not very much concerned about maintaining the HSU level for vehicles.
Details about the petrol-type fuel show that the cars registered in 2015 emit higher amounts of pollutants as compared to those emitted by the cars registered in 2004. However, in the cars registered after 2015, the CO and HC values come down rapidly. On the other side, if we will look at the emission of CO2 by the vehicles registered in 2010, 2015 and 2019, we see the same value of CO2 emitted by the old and new cars. The results also demonstrate that the new advancement in automobile industries is not very much concerned about maintaining the CO2 level for vehicles. The outcome for petrol/CNG cars indicates that few petrol/CNG cars are emitting a large number of pollutants. The cars registered in 2019 are emitting higher pollutants compared to the cars registered in 2005. This is due to the easy availability of unauthorized installation of CNG kits in the Delhi NCR region. Yes, to reduce the expenses on travel, everyone is now adopting the easy installation of CNT kits from an unauthorized dealer. No one cares about the effect of unauthorized installation on pollutant emission.
Overall, the analysis shows that few parameters need to be a concern for reducing the pollutants emission by vehicles. These major parameters are the high survival rates, decrease in annual mileage and major enforcement for three-to-five-year-old vehicles. The unauthorized installation of CNG kits also has to be banned strictly. Secondly, technological advancement not only targets fuel efficiency but also targets to reduce CO, CO2 and HC. This study shows that many old vehicles are used in different regions after the various notifications regarding banning old vehicles by the Government of India. These old vehicles are the major source of vehicle pollutants. These old vehicles need to be banned immediately. This study will also help pollution-monitoring authorities make new and effective policies against the emission of pollutants by the vehicles. The significant contributions that were made by the work in this paper are summarized below:
  • Presents the gaseous pollutants (Hydrocarbons (HC), Carbon Monoxides (CO) and Carbon Dioxide (CO2)) emission factor of 181 four-wheeler cars from different companies and of different type of fuels.
  • Based on this statistical data obtained and analyzed, the scenarios regarding future vehicle growth rate and its impact on air quality are mentioned, to overcome emission problems.
  • The analysis shows that few parameters need to be a concern for reducing the pollutants emission by vehicles. These major parameters are the high survival rates, decrease in annual mileage and major enforcement for three-to-five-year-old vehicles.
  • This study shows that many old vehicles are used in different regions after the many notification regards to banning old vehicles by the Government of India. These old vehicles are the major source of vehicle pollutants.
  • The unauthorized installation of CNG kits also has to be banned strictly. Secondly, technological advancement not only targets fuel efficiency but also targets the reduction of CO, CO2 and HC.
  • It will be helpful to pollution-monitoring authorities for making new and effective policies against the emission of pollutants by the vehicles.

Author Contributions

Conceptualization, R.S., R.K., R.-A.F. and P.K.S.; methodology, R.S., M.S.R. and P.K.S.; software, R.K.; validation R.-A.F., R.S., P.K.S., M.S.R. and R.K.; formal analysis, investigation, resources, data curation, writing—original draft preparation and writing—review and editing, R.-A.F., M.S.R., P.K.S. and R.K.; visualization and funding acquisition, M.S.R. and R.-A.F. All authors have read and agreed to the published version of the manuscript.

Funding

This research received no external funding.

Acknowledgments

This work was supported by a grant from the Romanian Ministry of Research and Innovation, CCCDI-UEFISCDI, project number PN-III-P1-1.2-PCCDI-2017-0776/No. 36 PCCDI/15.03.2018, within PNCDI III.

Conflicts of Interest

The authors declare no conflict of interest.

References

  1. Wang, J.M.; Jeong, C.-H.; Zimmerman, N.; Healy, R.M.; Evans, G.J. Real-World vehicle fleet emission factors seasonal and diurnal variations in traffic related air pollutants. Atmos. Environ. 2018, 184, 77–86. [Google Scholar] [CrossRef]
  2. Xiao, C.; Chang, M.; Guo, P.; Chen, Q.; Tian, X. Comparison of the cost-effectiveness of eliminating high-polluting old vehicle sand imposing driving restrictions to reduce vehicle emissions in Beijing. Transp. Res. Part D Transp. Environ. 2019, 67, 291–302. [Google Scholar] [CrossRef]
  3. Ramachandra, T.V.; Shwetmala. Emissions from India’s transport sector: Statewise synthesis. Atmos. Environ. 2009, 43, 5510–5517. [Google Scholar] [CrossRef]
  4. Lipsky, E.M.; Robinson, A.L. Design and evaluation of a portable dilution sampling system for measuring fine particle emissions. Aerosol Sci. Technol. 2005, 39, 542–555. [Google Scholar] [CrossRef] [Green Version]
  5. Giechaskiel, B.; Maricq, M.; Ntziachristos, L.; Dardiotis, C.; Wang, X.; Axmann, H.; Bergman, A.; Schindler, W. Review of motor vehicle particulate emissions sampling and measurement: From smoke and filter mass to particle number. J. Aerosol Sci. 2014, 67, 48–86. [Google Scholar] [CrossRef]
  6. Wang, X.; Watson, J.G.; Chow, J.C.; Gronstal, S.; Kohl, S.D. An efficient multi-pollutant system for measuring real-world emissions from stationary and mobile sources. Aerosol Air Qual. Res. 2012, 12, 145–160. [Google Scholar] [CrossRef]
  7. Chen, C.; Huang, C.; Jing, Q.; Wang, H.; Pan, H.; Li, L. On-road emission characteristics of heavy-duty diesel vehicles in Shanghai. Atmos. Environ. 2007, 41, 5334–5534. [Google Scholar] [CrossRef]
  8. Fontaras, G.; Kouridis, H.; Samaras, Z.; Elst, D.; Gense, R. Use of a vehicle-modelling tool for predicting CO2 emissions in the framework of European regulations for light goods vehicles. Atmos. Environ. 2007, 41, 3009–3021. [Google Scholar] [CrossRef]
  9. Choudhary, A.; Gokhale, S. Urban real-world driving traffic emissions during interruption and congestion. Transp. Res. Part D Transp. Environ. 2016, 43, 59–70. [Google Scholar] [CrossRef]
  10. Canha, N.; Lage, J.; Galinha, C.; Coentro, S.; Alves, C.; Almeida, S.M. Impact of Biomass Home Heating, Cooking Styles, and Bread Toasting on the Indoor Air Quality at Portuguese Dwellings: A Case Study. Atmosphere 2018, 9, 214. [Google Scholar] [CrossRef] [Green Version]
  11. Azeez, O.S.; Pradhan, B.; Shafri, H.Z.M. Vehicular CO Emission Prediction Using Support Vector Regression Model and GIS. Sustainability 2018, 10, 3434. [Google Scholar] [CrossRef] [Green Version]
  12. Osorio-Tejada, J.L.; Llera-Sastresa, E.; Hariza Hashim, A. Well-to-Wheels Approach for the Environmental Impact Assessment of Road Freight Services. Sustainability 2018, 10, 4487. [Google Scholar] [CrossRef] [Green Version]
  13. Kamal, M.; Srivastava, G.; Tariq, M. Blockchain-Based Lightweight and Secured V2V Communication in the Internet of Vehicles. IEEE Trans. Intell. Transp. Syst. 2020, 1–8. [Google Scholar] [CrossRef]
  14. Shaha, A.P.; Singamsetti, M.S.; Tripathy, B.K.; Srivastava, G.; Bilal, M.; Nkenyereye, L. Performance Prediction and Interpretation of a Refuse Plastic Fuel Fired Boiler. IEEE Access 2020, 8, 117467–117482. [Google Scholar] [CrossRef]
  15. Srivastava, G. Brand Positioning of Automotive Lubricant in Indian Market. Int. J. Manag. 2013, 2, 43–55. [Google Scholar]
  16. Guttikunda, S.K.; Nishadh, K.A.; Gota, S.; Singh, P.; Chanda, A.; Jawahara, P.; Asundi, J. Air quality, emissions, and source contributions analysis for the Greater Bengaluru region of India. Atmos. Pollut. Res. 2019, 10, 941–953. [Google Scholar] [CrossRef]
  17. Liebenberg-Enslin, H.; von Oertzen, D.; Mwananaw, N. Dust and radon levels on the west coast of Namibia–What did we learn? Atmos. Pollut. Res. 2020. [Google Scholar] [CrossRef]
  18. Weng, J.; Gao, P.; Gao, Z.; Pihl, J.; LaClair, T.; Zhang, M.; Gluesenkamp, K.; Momen, A. Nanoarray-Based Monolithic Adsorbers for SO2 Removal. Emiss. Control Sci. Technol. 2020. [Google Scholar] [CrossRef]
  19. Ganesan, N.; Masimalai, S.; Ekambaram, P.; Selvaraju, K. Experimental Assessment of Effects of n-Butanol on Performance, Emission, and Combustion Characteristics of Mahua Oil Fueled Reactivity Controlled Compression Ignition (RCCI) Engine. Emiss. Control Sci. Technol. 2020. [Google Scholar] [CrossRef]
  20. Wang, Z.; Wu, Y.; Zhou, Y.; Li, Z.; Wang, Y.; Zhang, S.; Hao, J. Real-world emissions of gasoline passenger cars in Macao and their correlation with driving conditions. Int. J. Environ. Sci. Technol. 2014, 11, 1135–1146. [Google Scholar] [CrossRef] [Green Version]
  21. Goyal, P.; Mishra, D.; Kumar, A. Vehicular emission inventory of criteria pollutants in Delhi. SpringerPlus 2013, 10, 216. [Google Scholar] [CrossRef] [PubMed] [Green Version]
  22. GNCTD. State of Environment Report for Delhi, Department of Environment and Forests; Government of NCT of Delhi: New Delhi, India, 2010.
  23. Nagpure, A.S.; Sharma, K.; Gurjar, B.R. Traffic-induced emission estimates and trends (2000–2005) in megacity Delhi. Urban Clim. 2013, 4, 61–67. [Google Scholar] [CrossRef]
  24. CMIE. India’s Energy Sector; Centre for Monitoring Indian Economy: Mumbai, India, 2007. [Google Scholar]
  25. Goel, R.; Guttikunda, S.K.; Mohan, D.; Tiwari, G. Benchmarking vehicle and passenger travel characteristics in Delhi for on-road emissions analysis. Travel Behav. Soc. 2015, 2, 88–101. [Google Scholar] [CrossRef]
  26. A Delhi Particular; The Economist: London, UK, 2012; Available online: https://www.economist.com/banyan/2012/11/06/a-delhi-particular (accessed on 12 August 2020).
  27. ARAI. Emission Factor Development for Indian Vehicles; Automotive Research Association of India (ARAI): Pune, India, 2008. [Google Scholar]
  28. ARAI. Source Profiling for Vehicular Emission; Automotive Research Association of India (ARAI): Pune, India, 2009; Available online: http://www.cpcb.nic.in/Source_Profile_Vehicles.pdf (accessed on 31 November 2015).
  29. Bearak, M. Desperate for Clean Air, Delhi Residents Experiment with Solutions; New York Times: New York, NY, USA, 2014. [Google Scholar]
  30. Choudhury, S.R. Children in Delhi have Lungs of Chain-Smokers; India Today: Noida, India, 2014; Available online: https://www.indiatoday.in/india/north/story/pollution-in-delhi-cng-children-in-delhi-182151-2014-02-22 (accessed on 12 August 2020).
  31. National Capital Region Planning Board. Census 2011; National Capital Region Planning Board: New Delhi, India, 2016; p. 3. [Google Scholar]
  32. Delhi’s Air Has Become a Lethal Hazard and Nobody Seems to Know What to Do About It; Time Magazine: New York, NY, USA, 2014; Available online: https://time.com/6061/delhis-air-has-become-a-lethal-hazard-and-nobody-seems-to-know-what-to-do-about-it/ (accessed on 12 August 2020).
  33. Delhi ‘Third Greenest’ City. Available online: https://www.ndtv.com/cities/delhi-third-greenest-city-408116 (accessed on 12 August 2020).
  34. New Delhi Blanketed in Thick Smog, Transport Disrupted; Reuters: London, UK, 2013; Available online: https://www.scientificamerican.com/article/indian-capital-blanketed-in-thick-s/ (accessed on 12 August 2020).
  35. Fontaras, G.; Martini, G.; Manfredi, U.; Marotta, A.; Krasenbrink, A.; Maffioletti, F.; Terenghi, R.; Colombo, M. Assessment of on-road emissions off our Euro V diesel and CNG waste collection trucks for 46. J. Environ. Sci. 2017, 53, 39–47. [Google Scholar]
  36. Harris, G. Delhi Wakes Up to an Air Pollution Problem It Cannot Ignore; New York Times: New York, NY, USA, 2015. [Google Scholar]
  37. Goel, R.; Gutti Kunda, S.K. Evolution of on-road vehicle exhaust emissions in Delhi. Atmos. Environ. 2015, 105, 78–90. [Google Scholar] [CrossRef]
  38. Kelkar, K. How Crop Burning Affects Delhi’s Air. Wall Street Journal. 2014. Available online: http://on.wsj.com/1eYDyAR (accessed on 12 August 2020).
  39. Harris, G. Beijing’s Bad Air Would Be Step Up for Smoggy Delhi; New York Times: New York, NY, USA, 2014. [Google Scholar]
  40. Habib, I. The Agrarian System of Mughal India; Oxford University Press: Oxford, UK, 1999; pp. 1556–1707. [Google Scholar]
  41. Impose 30% Cess on Diesel Cars; Times of India: Mumbai, India, 2014; Available online: https://twitter.com/timesofindia/status/432978549352697858 (accessed on 12 August 2020).
  42. India’s Air Pollution Triggers Comparisons with China; Voice of America: Washington, DC, USA, 2014; Available online: https://www.voatibetanenglish.com/a/indias-air-pollution-triggers-comparisons-with-china/1855447.html (accessed on 12 August 2020).
  43. January Days Getting Colder, Tied to Rise in Pollution; Times of India: Mumbai, India, 2014; Available online: https://timesofindia.indiatimes.com/city/delhi/January-days-getting-colder-tied-to-rise-in-pollution/articleshow/29429495.cms (accessed on 12 August 2020).
  44. Kumar, R. Fancy Schemes for a Dirty Business; Digital Development Debates: Berlin, Germany, 2016. [Google Scholar]
  45. Ministry of Petroleum and Natural Gas. Indian Petroleum and Natural Gas Statistics 2011–12; The Government of India: New Delhi, India, 2012.
  46. Ministry of Road Transport and Highways. Road Transport Year Book 2009–10 & 2010–11; The Government of India: New Delhi, India, 2012.
  47. Madison, P. Top 20 most Polluted Cities in the World; CNN: Atlanta, GA, USA, 2016. [Google Scholar]
  48. Pollution Increasing Lung Cancer in Indian Women. Available online: https://zeenews.india.com/news/health/diseases-and-conditions/pollution-increasing-lung-cancer-in-indian-women_26498.html (accessed on 12 August 2020).
  49. Rationale; NCR Planning Board: New Delhi, India, 2012; Available online: http://ncrpb.nic.in/rationale.html (accessed on 12 August 2020).
  50. Society of Indian Automobile Manufacturers; The Indian Automobile Industry: New Delhi, India, 2010; Available online: https://www.indianmirror.com/indian-industries/associations/automobile-association.html (accessed on 12 August 2020).
  51. The Constitution (Sixty-Ninth Amendment) Act. 1991. Available online: https://www.india.gov.in/my-government/constitution-india/amendments/constitution-india-sixty-ninth-amendment-act-1991 (accessed on 12 August 2020).
  52. Mohan, V. Usual Suspects: Vehicles, Industrial Emissions behind the Foul Play All Year. Times of India. 2018. Available online: https://timesofindia.indiatimes.com/city/delhi/usual-suspects-vehicles-industrial-emissions-behind-foul-play-all-year/articleshow/66228517.cms (accessed on 12 August 2020).
  53. Narain, S. A Vicious Nexus. Down to Earth. 2018. Available online: https://www.downtoearth.org.in/blog/air/a-vicious-nexus-62475 (accessed on 12 August 2020).
  54. Wang, H.; Chen, C.; Huang, C.; Fu, L. On-road vehicle emission inventory and its uncertainty analysis for Shanghai, China. Sci. Total Environ. 2008, 398, 60–67. [Google Scholar] [CrossRef] [PubMed]
  55. Li, M.; Mi, Z.; Coffman, D.; Wei, Y.-M. Assessing the policy impacts on non-ferrous metals industry’s CO2 reduction: Evidence from China. J. Clean. Prod. 2018, 192, 252–261. [Google Scholar] [CrossRef] [Green Version]
  56. Zeng, S.; Jiang, X.; Su, B.; Nan, X. China’s SO2 shadow prices and environmental technical efficiency at the province level. Int. Rev. Econ. Financ. 2018, 57, 86–102. [Google Scholar] [CrossRef]
  57. Sun, M.; Wang, Y.; Shi, L.; Klemeš, J.J. Uncovering energy use, carbon emissions and environmental burdens of pulp and paper industry: A systematic review and meta-analysis. Renew. Sustain. Energy Rev. 2018, 92, 823–833. [Google Scholar] [CrossRef]
  58. Iodice, P.; Senatore, A. New research assessing the effect of engine operating conditions on regulated emissions of a 4-stroke motorcycle by test bench measurements. Environ. Impact Assess. Rev. 2016, 61, 61–67. [Google Scholar] [CrossRef]
  59. Iodice, P.; Senatore, A.; Langella, G.; Amoresano, A. Advantages of ethanol–gasoline blends as fuel substitute for last generation Si engines. Environ. Prog. Sustain. Energy 2017, 36, 1173–1179. [Google Scholar] [CrossRef]
  60. Gurjar, B.R.; Van Aardenne, J.A.; Lelievelda, J.; Mohan, M. Emission estimates and trends (1990–2000) for megacity Delhi and implications. Atmos. Environ. 2004, 38, 5663–5681. [Google Scholar] [CrossRef]
  61. Garg, A.; Bhattacharya, S.; Shukla, P.R.; Dadhwal, V.K. Regional and sectoral assessment of greenhouse gas emissions in India. Atmos. Environ. 2001, 35, 2679–2695. [Google Scholar] [CrossRef]
  62. MoPNG. Annual Report 2001–2002; Ministry of Petroleum and Natural Gas, Government of India: New Delhi, India, 2002.
  63. Singh, P.; Paprzycki, M.; Bhargava, B.; Chhabra, J.; Kaushal, N.; Kumar, Y. Futuristic Trends in Network and Communication Technologies. FTNCT. Commun. Comput. Inf. Sci. 2018, 958, 3–509. [Google Scholar]
  64. Singh, P.; Sood, S.; Kumar, Y.; Paprzycki, M.; Pljonkin, A.; Hong, W.C. Futuristic Trends in Networks and Computing Technologies. FTNCT. Commun. Comput. Inf. Sci. 2019, 1206, 3–707. [Google Scholar]
  65. Singh, P.K.; Bhargava, B.K.; Paprzycki, M.; Kaushal, N.C.; Hong, W.C. Advances in Intelligent Systems and Computing. In Handbook of Wireless Sensor Networks: Issues and Challenges in Current Scenario’s; Springer: Cham, Switzerland, 2020; Volume 1132, pp. 155–437. [Google Scholar]
  66. Singh, P.K.; Pawłowski, W.; Tanwar, S.; Kumar, N.; Rodrigues, J.J. Lecture Notes in Networks and Systems. In Proceedings of the First International Conference on Computing, Communications, and Cyber-Security (IC4S 2019), Cham, Switzerland, 12–13 October 2019; Volume 121, pp. 3–917. [Google Scholar]
  67. Marques, G.; Saini, J.; Dutta, M.; Singh, P.K.; Hong, W.-C. Indoor Air Quality Monitoring Systems for Enhanced Living Environments: A Review toward Sustainable Smart Cities. Sustainability 2020, 12, 4024. [Google Scholar] [CrossRef]
  68. Singh, P.K.; Kar, A.K.; Singh, Y.; Kolekar, M.H.; Tanwar, S. Lecture Notes in Electrical Engineering. In Proceedings of the ICRIC 2019, Recent Innovations in Computing, Cham, Switzerland, 8–9 March 2019; Volume 597, pp. 3–920. [Google Scholar]
Figure 1. Selected area for on-road emission estimation in Delhi National Capital Region (NCR). Source: https://www.sketchbubble.com/en/presentation-delhi-map.html.
Sustainability 12 06707 g001
Figure 2. Trend of HSU over an eight-year period for diesel vehicles [24,25,26,27,28,29,30,31,32,33,34,35,36,37,38,39,40,41,42,43,44,45,46,47,48,49,50,51,52,53,54].
Sustainability 12 06707 g002
Figure 3. Different emission trend for petrol vehicles: (a) CO trend for petrol vehicles, (b) HC trend for petrol vehicles and (c) HC and CO2 combined trend for petrol vehicles. [24,25,26,27,28,29,30,31,32,33,34,35,36,37,38,39,40,41,42,43,44,45,46,47,48,49,50,51,52,53,54].
Sustainability 12 06707 g003
Figure 4. Different emission trends for petrol/CNG vehicles: (a) CO trend for petrol/CNG vehicles and (b) HC trend for petrol/CNG [24,25,26,27,28,29,30,31,32,33,34,35,36,37,38,39,40,41,42,43,44,45,46,47,48,49,50,51,52,53,54].
Sustainability 12 06707 g004
Figure 5. Average emissions for petrol vehicles over nine years [24,25,26,27,28,29,30,31,32,33,34,35,36,37,38,39,40,41,42,43,44,45,46,47,48,49,50,51,52,53,54].
Sustainability 12 06707 g005
Table 1. Air-quality standards for national ambient [24,25,26,27,28,29,30,31,32,33,34,35,36,37,38,39,40,41,42,43,44,45,46,47,48,49,50,51,52,53,54].
S. No.PollutantTime Weighted AverageConcentration in Ambient Air
Industrial, Residential, Rural and Other AreasEcologically Sensitive Area (Notified by Central Government)Methods of Measurement
(1)(2)(3)(4)(5)(6)
1Sulfur Dioxide(SO2), µg/m3Annual *
24 h **
50
80
20
80
Improved West and Gaeke
Ultraviolet Fluorescence
2Nitrogen Dioxide(NO2), µg/m3Annual *
24 h **
40
80
30
80
Modified Jacob and Hochheiser (Na-Arsenite)
Chemiluminescence
3Particulate Matter(size less than 10µm) or PM10 µg/m3Annual*
24 h **
60
100
60
100
Gravimetric
TOEM
Beta attenuation
4Particulate Matter(size less than 2.5µm) or PM2.5 µg/m3Annual *
24 h **
40
60
40
60
Gravimetric
TOEM
Beta attenuation
5Ozone(O3) µg/m38 h **
1 h **
100
180
100
180
UV Photometric
Chemiluminescence
Chemical Method
6Lead(Pb) µg/m3Annual *
24 h **
0.50
1.0
0.50
1.0
AAS/ICP method after sampling on EPM 2000 or equivalent filter paper
ED-XRF using Teflon filter
7Carbon Monoxide(CO)
mg/m3
8 h **
1 h **
0.2
0.4
0.2
0.4
Non-Dispersive Infrared (NDIR) spectroscopy
8Ammonia(NH3) µg/m3Annual *
24 h **
100
400
100
400
Chemiluminescence
Indophenol blue method
* Annual arithmetic mean of minimum 104 measurements in a year, ** 24 hourly monitored values shall be complied with 98% of the time.
Table 2. Characteristics of selected cars [24,25,26,27,28,29,30,31,32,33,34,35,36,37,38,39,40,41,42,43,44,45,46,47,48,49,50,51,52,53,54].
Maker/CompanyModelRegistration DateFuel TypeEngine Capacity (cm3) *
ToyotaInnova2009Diesel2494
ToyotaFortuner2010Diesel2982
ToyotaAltis2014Diesel1364
Maruti SuzukiDzire2009Diesel1248
Maruti SuzukiSx42011Diesel1248
Maruti SuzukiSwift2012Diesel1248
Maruti SuzukiCiaz2015Diesel1248
Maruti SuzukiRitz2016Diesel1248
HondaAmaze2014Diesel1498
HondaMobilio2015Diesel1498
HondaCity2018Diesel1498
MahindraScorpio2010Diesel2179
MahindraXUV2014Diesel2179
MahindraThar2017Diesel2523
BMWX12011Diesel1995
BMW520D2013Diesel1995
Maruti SuzukiZen2004Petrol993
Maruti SuzukiWagonr2005Petrol1061
Maruti SuzukiAlto2006Petrol796
Maruti SuzukiEsteem2007Petrol1298
Maruti SuzukiRitz2009Petrol1197
Maruti SuzukiSwift2010Petrol1298
Maruti SuzukiEECO2011Petrol1196
Maruti SuzukiErtiga2013Petrol1373
Maruti SuzukiDzire2014Petrol1197
Maruti SuzukiCiaz2015Petrol1373
Maruti SuzukiCelerio2017Petrol998
Maruti SuzukiIgnis2018Petrol1197
HyundaiSantro2006Petrol1086
HyundaiI102009Petrol1086
HyundaiEON2013Petrol814
HyundaiXcent2015Petrol1186
HyundaiCreta2017Petrol1591
HyundaiGrand i102018Petrol1197
HondaAccord2006Petrol2354
HondaCivic2007Petrol1799
HondaCity2009Petrol1497
HondaAmaze2013Petrol1198
ToyotaInnova2010Petrol1998
ToyotaEtios2014Petrol1496
TataIndica2007Petrol1193
TataTiago2016Petrol1199
* Inventory shows the characteristics for petrol and diesel cars registered in 2004–2019. Engine capacity also affects the environment, as high-capacity engines emit high amounts of pollutants in the air.
Table 3. Measured Hartridge Smoke Unit (HSU) values for diesel vehicles [24,25,26,27,28,29,30,31,32,33,34,35,36,37,38,39,40,41,42,43,44,45,46,47,48,49,50,51,52,53,54].
S No.Bharat StageMaker/ModelRegistration DatePrescribed HSUMeasured HSU
13Toyota/InnovaJune 20096542.21.27
23Toyota/InnovaJuly 20096545.41.41
33Maruti Suzuki/DzireSept 20096544.31.36
43Mahindra/ScorpioJan 20106531.70.89
53Toyota/InnovaJan 20106539.81.18
63Toyota/FortunerMay 20106539.81.18
74Toyota/InnovaOct 20115042.51.29
84BMW X1July 20115039.91.07
94Maruti Suzuki/SwiftSept 20115042.51.28
104Hyundai/VernaFeb 20125042.71.29
114Maruti Suzuki/Sx4Aug 20125038.61.13
124Maruti Suzuki/DzireJuly 20135039.21.15
134BMW 520DAug 20135038.31.12
144Volkswagen/VentoOct 20135040.01.19
154Ford/ EcoSportNov 20135044.61.37
164Volvo/XC60Jan 20145041.41.24
174Maruti Suzuki/Sx4Feb 2014 5044.01.35
184Mahindra/XUVApril 20145038.81.14
194Toyota/EtiosJuly 20145043.01.30
204Maruti Suzuki/SwiftAug 20145041.51.24
214Toyota/AltisSept 2014 5043.81.34
223TATA/IndigoOct 20146546.01.43
231Audi/A6Oct 20146542.11.27
244Honda/AmazeNov 20145031.50.88
254Toyota/EtiosMarch 20155042.31.28
264BMWMarch 20155039.91.18
274Honda/MobilioApril 20155037.71.10
284Renault/Duster June 20155039.21.15
294Maruti Suzuki/SwiftJuly 20155039.81.18
304Mahindra/ScorpioJuly 20155044.61.37
314Hyundai/CretaAug 20155041.21.39
324Mercedes Ml250Aug 20155031.50.88
334Maruti Suzuki/CiazSept 20155030.90.86
344Mahindra/XUVSept 20155039.41.16
354Toyota/FortunerNov 20155042.41.28
364Maruti Suzuki/DzireDec 20155043.41.33
374Hyundai/CretaJune 20165043.51.33
384Honda/MobilioJuly 20165037.91.10
394Maruti Suzuki/RitzJuly 20165043.91.34
404FCA/AventuraAug 20165038.21.12
414Maruti Suzuki/CiazNov 20165041.31.24
423Toyota/InnovaDec 20166538.91.14
434Toyota/InnovaJan 20175042.61.29
444Maruti Suzuki/DzireFeb 20175044.21.36
454Honda/CityMarch 20175039.11.15
464Mahindra/THARMay 20175044.71.37
474Maruti Suzuki/CiazJune 20175039.01.15
484Toyota/InnovaDec 20175040.01.19
494Honda/AmazeDec 20175039.31.16
504Ford/EndeavourJan 20185039.01.15
514Maruti Suzuki/CiazSept 20185043.11.31
524Honda/CityNov 20185042.11.27
Table 4. Measurement of CO, CO2 and λ for petrol vehicles [24,25,26,27,28,29,30,31,32,33,34,35,36,37,38,39,40,41,42,43,44,45,46,47,48,49,50,51,52,53,54].
S No.Bharat StageMaker/ModelRegistration DateCO (ppm)HC (ppm)CO2 (ppm)Λ
13Maruti/M800March 20040.03646Pre-Bharat Stage 4 norms *
23Maruti Suzuki/ZenJuly 20040.0508
33Maruti Suzuki/VersaSept 20040.03611
43Maruti Suzuki/ZenDec 20040.02017
53Maruti Suzuki/WagonrFeb 20050.13021
63Hyundai/SantroJan 20060.04021
73Maruti/MarutiNov 20060.00923
83Honda/AccordDec 20060.0037
93Maruti Suzuki/AltoDec 20060.03620
103Maruti Suzuki/WagonrDec 20060.020129
113Hyundai/SantroJan 20070.09039
123Honda/CityFeb 20070.01022
133Maruti/MarutiApril 20070.02744
143TATA/IndicaApril 20070.01020
153Honda/CivicJune 20070.02029
163Honda/CitySept 20070.00175
173Maruti Suzuki/ EsteemSept 20070.100107
183Maruti Suzuki/AltoApril 20080.0406
193Hyundai/Santro May 20080.04039
203Maruti Suzuki/ZenJuly 20080.00319
213Hyundai/SantroJuly 20080.11060
223Honda/AccordAug 20080.01723
233Honda/CityDec 20080.020162
243Maruti Suzuki/WagonrFeb 20090.03616
253Hyundai/i10April 20090.14024
263Maruti Suzuki/SwiftJune 20090.16034
273Maruti Suzuki/AltoAug 20090.070185
283Hyundai/i10Sept 20090.10017
293Ford/IKONSept 20090.02025
303Hyundai/i10Sept 20090.11031
313Honda/CityAug 20090.04329
323Maruti Suzuki/RitzNov 20090.0200
333Hyundai/i10Nov 20090.00388
343Maruti Suzuki/Swift March 20100.0200
354Hyundai/i10March 20100.0351017.200.999
363Maruti Suzuki/WagonrMay 2010 0.380197
374Toyota/InnovaMay 20100.004315.41.005
384Maruti Suzuki/DzireOct 20100.0412717.201.003
394Maruti Suzuki/EECOFeb 20110.0332716.701.009
404Maruti Suzuki/AStarMay 20110.0202417.301.003
414Mitsubishi/OutlanderAug 20110.003217.101.004
424Maruti Suzuki/DzireOct 20110.026716.801.009
434Volkswagen/PoloFeb 20120.0197316.701.000
444Maruti Suzuki/WagonrSept 20130.0342616.801.000
454Maruti Suzuki/ErtigaOct 20130.0201816.601.003
464Honda/AmazeNov 20130.0322215.701.001
474Hyundai/EONDec 20130.0321415.701.003
484Hyundai/VernaApril 20140.01028171.007
494Maruti Suzuki/DzireJuly 20140.003515.301.009
504Maruti Suzuki/CiazNov 20140.0301616.700.998
514Toyota/EtiosDec 20140.0251717.101.003
524Ford/EcoMarch 20150.0036616.601.011
534Honda/AmazeApril 20150.034817.101.004
544Maruti Suzuki/CiazJune 20150.3636171.001
554Honda/CityJune 20150.0421316.601.002
563Hyundai/XcentOct 20150.018149
574Maruti Suzuki/DzireJan 20160.0351315.501.003
583Honda/AmazeMarch 20160.04322
594Maruti Suzuki/SwiftJuly 20160.0271816.901.003
604Renault/KwidAug 20160.012815.401.003
614TATA/TiagoOct 20160.0271216.801.004
624Honda/CityOct 20160.0032016.901.002
634Honda/CityFeb 20170.11716.901.004
644Hyundai/Grand i10Feb 20170.02819171.003
654Maruti Suzuki/SwiftJune 20170.003817.301.003
664Maruti Suzuki/DzireJuly 20170.0433817.301.002
674Hyundai/CretaAug 20170.043916.801.004
684Maruti Suzuki/CelerioOct 20170.03322171.003
694Maruti Suzuki/EECOSept 20170.0172416.501.029
704Maruti Suzuki/DzireNov 20170.0424216.901.002
714Renault/KwidJan 20180.0035161.003
724Maruti Suzuki/DzireJan20180.003417.101.003
734Maruti Suzuki/ErtigaFeb 20180.0362116.41.003
743Hyundai/ Grand i10April 20180.08026
754Maruti Suzuki/DzireApril 20180.0261816.61.003
764Maruti Suzuki/IgnisMay 20180.0421315.71.002
774Maruti Suzuki/IgnisAug 20180.02435171.003
784TATA/TiagoJan 20190.00446171.001
794Maruti Suzuki/EECOJan 20190.0021012.91.004
* Pre-Bharat Stage 4 norms cars do not have the CO2 and λ values.
Table 5. Petrol/compressed natural gas (CNG) vehicles [24,25,26,27,28,29,30,31,32,33,34,35,36,37,38,39,40,41,42,43,44,45,46,47,48,49,50,51,52,53,54].
S No.Bharat StageMaker/ModelRegistration DateCO (ppm)HC (ppm)
13Honda/CityDec 20040.02610
23Honda/CityJan 20050.1709
33Maruti Suzuki/WagonrMarch 20050.05034
43Maruti Suzuki/EsteemMarch 20050.0207
53Maruti Suzuki/EsteemOct 20050.0347
63Ford/IkonFeb 20070.31035
73Maruti Suzuki/EsteemOct 20070.02012
83Maruti Suzuki/EsteemDec 20070.02016
93Maruti Suzuki/SwiftMarch 20080.1009
103Maruti Suzuki/Alto April 20080.0200
113Maruti Suzuki/WagonrMay 20080.0409
123Maruti Suzuki/WagonrMay 20080.0203
133Maruti Suzuki/WagonrAug 20080.01014
143Maruti Suzuki/OmniAug 20080.0015
153Hyundai/SantroOct 20080.0164
163Toyota/AltisDecember 20080.04027
173Chevrolet/AveoFeb 20090.0106
183Hyundai/AccentApril 20090.0407
193Maruti SuzukiMay 20090.0048
203Maruti Suzuki/AltoMay 20090.10044
213Hyundai/i10Nov 20090.0500
223Maruti Suzuki/WagonrSept 20090.0419
233Maruti Suzuki/Sx4March 20100.0407
243Maruti Suzuki/Sx4March 20100.04016
253Maruti Suzuki/DzireMay20100.00131
264Maruti Suzuki/SwiftSept 20100.003132
274Maruti SuzukiApril 20110.02777
284Maruti Suzuki/EECOJune 20110.01918
294Hyundai/i20July 20110.01093
304Hyundai/SantroOct 20110.03019
314Maruti Suzuki/WagonrNov 20110.04018
324Maruti Suzuki/Alto Aug 20120.00458
334Maruti Suzuki/AltoDec 20120.02742
344Hyundai/i10June 20130.01812
354Maruti Suzuki/Sx4Oct 20130.04188
364Maruti Suzuki/WagonrOct 20130.00385
374Maruti Suzuki/DzireNov 20150.020161
384Maruti Suzuki/DzireDec 20150.0107
394Maruti Suzuki/EECOJan 20160.03029
404Honda/AmazeJan 20160.02869
414Maruti Suzuki/WagonrApril 20160.04362
424Hyundai/XcentFeb 20170.027128
434Maruti Suzuki/EECO March 20170.02022
444Maruti Suzuki/Celerio April 20170.02758
454Maruti Suzuki/TourSept 20170.05022
464Maruti Suzuki/DzireOct 20170.02041
47-Bajaj Auto/Compact Oct 20180.02621
484Maruti Suzuki/TourNov 20180.02524
494TATA/Truck LPTJan 20190.05027
50-Bajaj Auto/Compact Jan 20190.001187
Table 6. Average emissions over different years of HSU for diesel-driven vehicles [24,25,26,27,28,29,30,31,32,33,34,35,36,37,38,39,40,41,42,43,44,45,46,47,48,49,50,51,52,53,54].
YearHSU HSU HSU HSU
200942.21.27
45.41.41
44.31.36
201031.70.89
39.81.18
39.81.18
201142.51.29
39.91.07
42.51.28
201242.71.29
38.61.13
Average *43.31.35Average *36.77.41Average *41.64.21Average *40.66.21
HSU HSU HSU HSU
201339.21.15
38.31.12
40.01.19
44.61.37
201441.41.24
44.01.35
38.81.14
43.01.30
41.51.24
43.81.34
46.01.43
42.11.27
31.50.88
201542.31.28
39.91.28
37.71.10
39.21.15
39.81.18
44.61.37
41.21.39
31.50.88
30.90.86
39.41.16
42.41.28
43.41.33
201643.51.33
37.91.10
43.91.34
38.21.12
41.31.24
38.91.14
Average *40.29.21Average *41.35.35Average *38.53.36Average *40.63.21
HSU HSU HSU HSU
201742.61.29
44.21.36
39.11.15
44.71.37
39.01.15
40.01.19
39.31.16
201839.01.15
43.11.31
42.11.27
Average *41.28.24Average *41.08.24
* The average values are calculated by using data collected for diesel cars. * The results demonstrate that the new advancement in automobile industries is not very concerned about maintaining the HSU level for vehicles.
Table 7. Average emissions over different years of CO, HC and CO2 for petrol-driven vehicles [24,25,26,27,28,29,30,31,32,33,34,35,36,37,38,39,40,41,42,43,44,45,46,47,48,49,50,51,52,53,54].
YearCO (ppm)HC (ppm)CO2 (ppm) CO (ppm)HC (ppm)CO2 (ppm) CO (ppm)HC (ppm)CO2 (ppm)
20100.035
0.004
0.041
10
3
27
17.20
15.4
17.20
20110.033
0.020
0.003
0.026
27
24
2
7
16.70
17.30
17.10
16.80
20130.034
0.020
0.032
0.032
26
18
22
14
16.80
16.60
15.70
15.70
Average *0.02613.3316.6Average *0.02051516.975Average *0.02952016.20
20140.010
0.003
0.030
0.025
28
5
16
17
17
15.30
16.70
17.10
20150.003
0.034
0.36
0.042
66
8
36
18
16.60
17.10
17
16.60
20160.035
0.027
0.012
0.027
0.003
13
18
8
12
20
15.50
16.90
15.40
16.80
16.90
Average *0.01716.516.525Average *0.109753216.825Average *0.069414.2016.3
20170.11
0.028
0.003
0.043
0.043
0.033
0.017
0.042
7
19
8
38
9
22
24
42
16.9
17
17.30
17.30
16.80
17
16.50
16.90
20180.003
0.003
0.036
0.026
0.042
0.024
5
4
21
18
13
35
16
17.10
16.40
16.60
15.70
17
20190.004
0.002
46
10
17
12.9
Average *0.039821.12516.9625Average *0.0221616.46Average *0.0032814.95
* The average values are calculated by using data collected for petrol cars. * The table demonstrates the emission of CO, HC and CO2. * The average values for HC are rapidly growing every year. This is a matter of concern. New advancement in automobile industries do not take this into consideration to maintain these values.
Table 8. Average emissions over different years of CO and HC for petrol/CNG-driven vehicles [24,25,26,27,28,29,30,31,32,33,34,35,36,37,38,39,40,41,42,43,44,45,46,47,48,49,50,51,52,53,54]
YearCO (ppm)HC (ppm)YearCO (ppm)HC (ppm)YearCO (ppm)HC (ppm)
20050.0261020070.313520080.19
0.1790.02120.020
0.05340.02160.049
0.027 0.023
0.0347 0.0114
0.0015
0.0164
0.0427
Average *0.0613.4Average *0.11621Average *0.03088.875
YearCO (ppm)HC (ppm)YearCO (ppm)HC (ppm)YearCO (ppm)HC (ppm)
20090.01620100.04720110.02777
0.0470.04160.01918
0.00480.001310.0193
0.1440.0031320.0319
0.050 0.0418
0.0419
Average *0.040812.33Average *0.02146.5Average *0.025245
YearCO (ppm)HC (ppm)YearCO (ppm)HC (ppm)YearCO (ppm)HC (ppm)
20120.0045820130.0181220150.02161
0.027420.041880.017
0.00385
Average *0.015550Average *0.020661.66Average *0.01584
YearCO (ppm)HC (ppm)YearCO (ppm)HC (ppm)
20160.032920170.02758
0.028690.0522
0.043620.0241
Average *0.033653.33Average *0.032340.33
* The average values are calculated by using data collected for diesel cars. * The average values are calculated by using data collected for petrol/CNG cars. * The cars registered in 2017 are emitting higher pollutants compare to the cars registered in 2005. * This is due to the easy availability of unauthorized installation of CNG kits in the Delhi NCR region.

