1. Introduction
The new energy vehicle (NEV) industry has a significant strategic position in China [
1]. It is regarded as an emerging industry in the 13th Five-Year National Strategic Emerging Industry Development Plan launched by the Chinese government. Therefore, it is of great importance to promote the rapid growth of NEVs, strengthen technological innovation, and form internationally competitive NEV enterprises. In 2019, the sales volume of NEVs exceeded 1.2 million vehicles in China [
2]. With the world’s largest NEV market, complete industrial supporting system, and policy supporting system, a number of enterprises with international competitiveness have grown up [
3]. In the long run, the NEV industry has a good scale benefit advantage and development environment in China.
In the past few years, the technical strength of NEVs continues to improve with the rapid growth of China’s investment in R&D of NEVs [
4]. To enhance the technical level and maintain the standardized development of NEV enterprises, the central government has issued a number of industrial promotion policies [
5]. The technical standards of NEV have been clearly put forward in the Catalogue of Recommended Models for the Promotion and Application of NEVs launched by the Ministry of Industry and Information Technology in 2016, including energy consumption, driving mileage, battery safety, etc. Subsidy standards are determined according to the technical parameter level of corresponding types of NEVs. Therefore, the recommended catalogue policy effectively combines the subsidies of NEVs with technical standards, and improves the entry threshold of NEVs. To get government subsidies, NEV enterprises must have high technical levels and continuously innovate [
6].
Despite the strong policy support, China’s battery, motor, measurement, and control technical levels of NEV are still far from the world levels [
7]. The NEV industry is a complex industry with wide coverage and large differences between enterprises. Usually, it has a large investment scale, high R&D costs, high consumption of various resources, fierce market competition, strong liquidity, and shrinking profit space. At present, technology innovation of NEVs in China still faces many problems, such as unreasonable allocation of innovation resources, low efficiency of technological innovation, and unbalanced development, which seriously affect the healthy development of the NEV industry [
8]. In this respect, it is an important problem that China’s NEV enterprises need to solve right now; they must determine how to make scientific and rational use of human, financial, material, capital, and other resources with the least input to obtain the maximum benefit and rise against the competition [
9].
Therefore, improving the supply quality of innovative resources and optimizing the allocation of resources have become effective approaches to promote the innovation efficiency of NEVs and achieve coordinated development, which can better enable NEV enterprises to make efficient technological innovation decisions according to their own operating conditions and status in the competition [
10]. Previous research mainly regards the technological innovation process as a black box of single-stage input and output. In fact, a more accurate and comprehensive evaluation of innovation efficiency can be obtained by dividing the innovation process of NEVs into multiple stages [
11]. It is of great importance to give targeted guidance to improve the innovation efficiency of NEV enterprises by discussing the resource allocation structure in different stages of technological innovation [
12]. However, there is little research on breaking the single-stage black box of NEV innovation and discussing the innovation efficiency from a multi-stage perspective. In this regard, the major contributions of this paper are presented as below.
The technological innovation process of NEVs is divided into the R&D stage and achievement transformation stage.
Based on a data envelopment analysis (DEA)–Tobit model, an evaluation framework of technological innovation efficiency of NEV enterprises is constructed.
The two stages’ technological innovation efficiencies of 23 NEV listed enterprises from 2013 to 2018 are evaluated from the static and dynamic perspectives. Additionally, the factors affecting the efficiency of NEV enterprises are analyzed.
According to the two-stage innovation efficiency, the 23 NEV enterprises are divided into four categories. For different types of enterprises, targeted guidance to improve the innovation efficiency and reallocate the innovative resources is proposed.
The remaining structure of this research is arranged as follows: a literature review related to the technological innovation efficiency of NEV enterprises is presented in
Section 2;
Section 3 introduces the DEA–Tobit model;
Section 4 empirically evaluates and analyzes the 23 NEV listed enterprises’ innovation efficiency; discussion is conducted in
Section 5; finally,
Section 6 presents the conclusions.
3. Materials and Methods
3.1. Two-Stage Technological Innovation Process Framework of NEVs
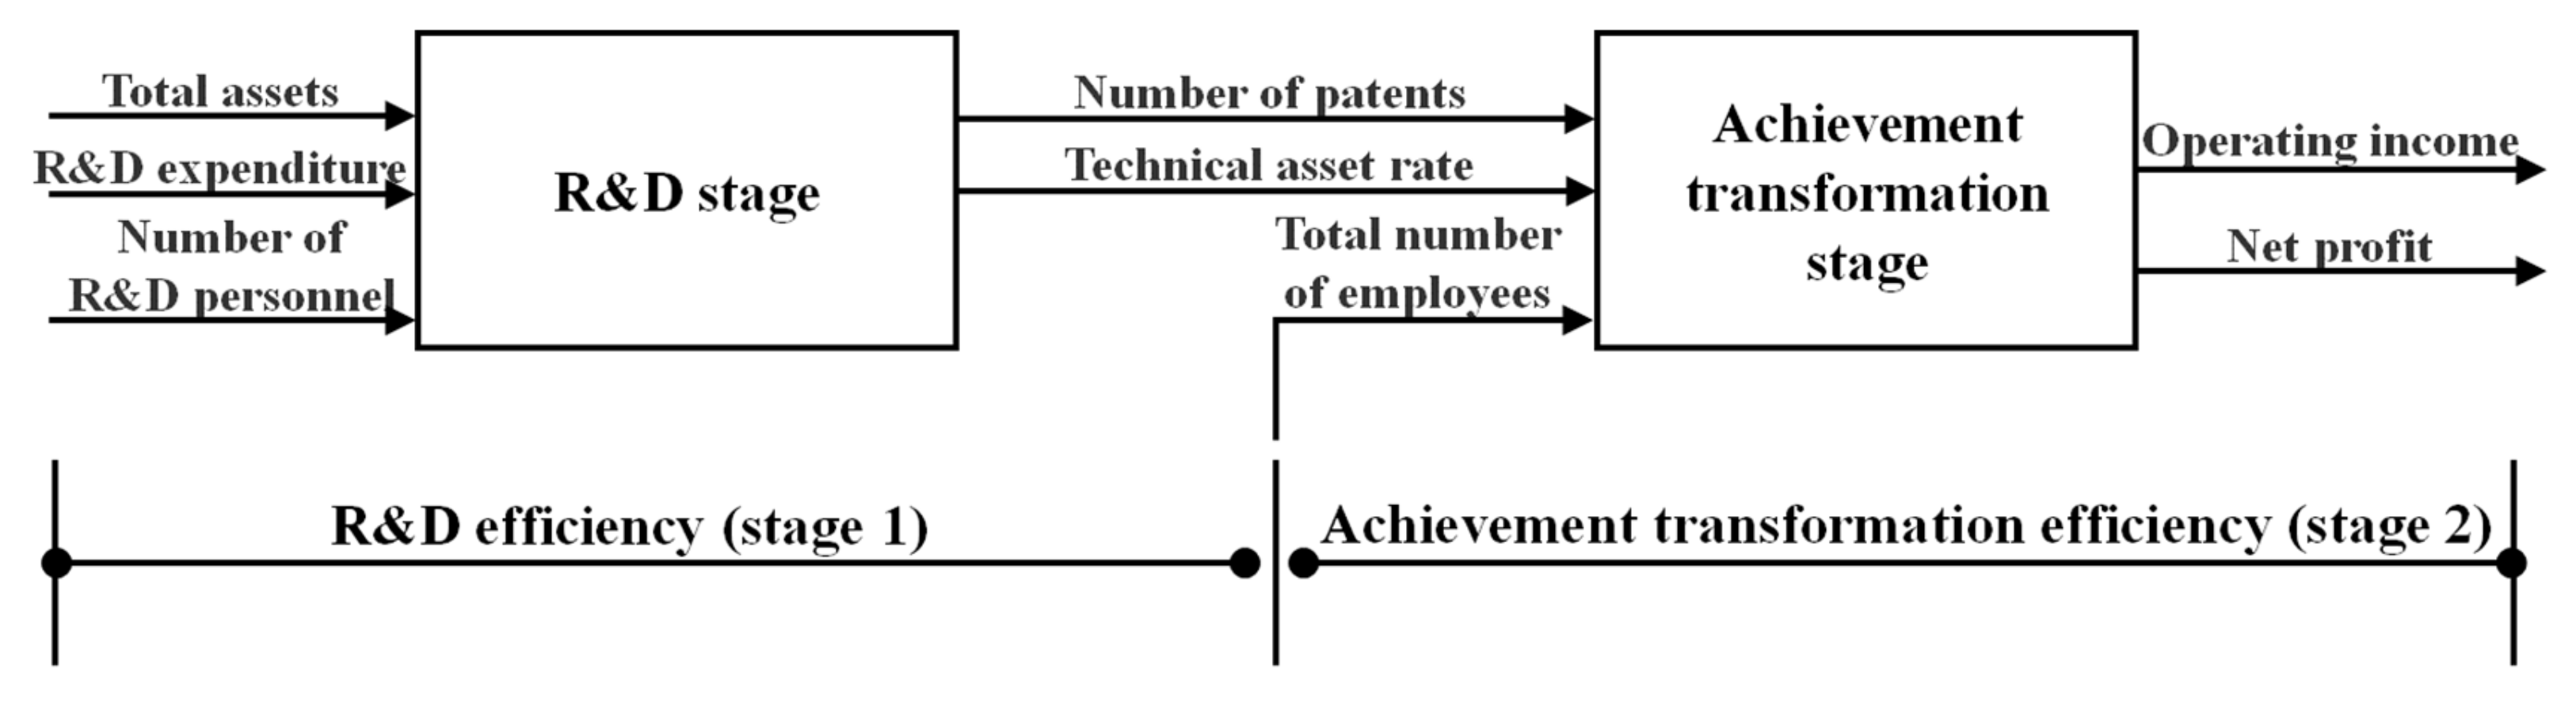
Technological innovation is a complex dynamic process. Firstly, R&D innovation resources are transformed into R&D innovation results through technological R&D activities. Then, R&D innovation results are put into production together with other non-R&D innovation resources. Finally, new products are produced [
27]. Based on the related research [
28], NEVs’ innovation process is broken down into an R&D stage and an achievement transformation stage (see
Figure 1). The R&D efficiency (i.e., the efficiency of the R&D stage) is the proportion of R&D output over input, which reflects the ability of NEV enterprises to convert R&D innovation resources into R&D output (e.g., patents), while the achievement transformation efficiency (i.e., the efficiency of achievement transformation stage) is the ratio of achievement transformation output to the sum of R&D output, non-R&D investment, and the rest investment, which reflects the ability of NEV enterprises to transform innovative resources (e.g., patents, technical assets, and non-R&D investment) into economic output (e.g., income and profit). Considering NEV enterprises’ technological innovation process as a whole, the overall technological innovation efficiency is the proportion of total innovative output to total innovative input.
According to the CCR model (DEA model under constant returns to scale) and BCC model (DEA model under variable returns to scale) of the DEA method, combined with relevant literature [
28] and the characteristics of NEV enterprises’ technological innovation process, this paper divides the NEVs’ technological innovation process into the R&D stage and the achievement transformation stage, so as to construct the evaluation framework of technological innovation efficiency of the NEV enterprises. To study the technological innovation efficiency of NEV enterprises, it is crucial to select the two-stage input–output index scientifically and reasonably. The input–output index is selected according to the principles of scientificity, rationality, and operability (see
Figure 1).
For the first stage of two-stage DEA, human capital investment and material capital investment are the basic elements of innovation. Thus, based on the availability and accuracy of data, total assets, R&D expenditure, the number of R&D personnel are selected as the input index of R&D stage, in which total assets and R&D expenditure are selected to reflect material capital investment, and the number of R&D personnel are selected to reflect human capital investment. As for the output index of the R&D stage, the achievements and benefits of technological innovation are the focus of consideration. In the R&D stage, the emergence of new technology is an important manifestation of technological innovation, thus, the number of patents and technology assets rate is chosen as the output index of the R&D stage.
For the second stage of two-stage DEA, the R&D output of the previous stage, the non-R&D input, and the new product development cost are all important input indexes of the achievement transformation stage to promote the transformation of achievements. Select the number of patents and technical asset rate of the R&D output as the DEA input index of achievement transformation stage. At the same time, the total number of employees is also selected as the DEA input index of achievement transformation stage to reflect the non-R&D input and the new product development cost. The output index of the achievement transformation stage represents the economic benefits generated by R&D innovation, mainly refers to the benefits brought to enterprises and society, and is also the ultimate embodiment of technological innovation. Therefore, operating income and net profit are selected as the DEA output index of the achievement transformation stage.
For the intermediate stage of two-stage DEA from the R&D stage to the achievement transformation stage, the number of patents and technological assets rate are both the R&D output and the achievement transformation input, because the authors consider the influence of patents and technological assets on the allocation of two-stage innovation resources. The total number of employees is an intermediate input, which is also selected as the achievement transformation input to reflect the non-R&D input.
3.2. The Efficiency Evaluation Model
In this research, the CCR model [
17] and the BCC model [
45] are applied to evaluate the innovation efficiency of NEV enterprises.
3.2.1. CCR Model
The CCR model comprehensively evaluates the scale effectiveness and technical effectiveness of a decision-making unit (DMU) under the term of constant returns to scale (CRSs), and obtains comprehensive technical efficiency (). To judge a DMU’s efficiency is to calculate whether it can fall on the production frontier of the production possible set. Assume that there are NEV enterprises, and they are regarded as DMU to analyze the innovation efficiency. A DMU is expressed by (, and each DMU has inputs (representing the resource consumption) and outputs (representing the achievement after resource consumption). The value of the input index , output index corresponding to the th DMU is ) and ) respectively. is a measure of the th input (weight coefficient). is a measure of the th output (weight coefficient). Let the input, output, and two weight vector be , , , respectively.
The efficiency
of
can be calculated as follows.
The CCR model is a fractional programming. In order to solve the calculation difficulties and facilitate discussion, the relaxation variables
(input redundancy),
(output insufficiency), and Archimedes infinitesimal
are introduced using linear programming and duality theory, and the following equivalent linear programming can be obtained.
where
is the efficiency evaluation value and
is a vector parameter. Let
be the optimal solution of the above programming, and the following conclusions can be obtained.
If , then is not effective, the technical efficiency and scale efficiency of economic activities are not optimal.
If , but at least one of , then is weakly effective, and the optimal technical and scale efficiency is not achieved simultaneously. To achieve comprehensive efficiency, input can be reduced under the condition of constant output, or output can be increased under the condition of constant input.
If , and , then is effective, and the optimal technical efficiency and optimal scale efficiency are achieved simultaneously. The input resources are fully utilized, and the output is maximized.
3.2.2. BCC Model
The BCC model measures a DMU’s efficiency under the condition of variable returns to scale (VRSs), and obtains pure technical efficiency () and scale efficiency respectively (). Compared with the CCR model, the BCC model adds to the constraint condition (represents VRS). The conclusion of the BCC model is similar to that of the CCR model mentioned above. The relationship between CCR and BCC model is .
3.3. Dynamic Efficiency Analysis Model
The Malmquist productivity index (MPI) [
46] is applied to measure NEV enterprises’ dynamic technological innovation efficiency. The Malmquist total factor productivity (TFP) can be described as follows.
where,
and
stands for the distance function under CRSs in period
and period
.
and
represent the difference of producer input in the mixing period compared with the production front.
TFP can be further divided into technical efficiency (
) and technical progress (
). Hence, the above equation can be expressed as follows.
Thus, the following equation can be obtained.
indicates the technical efficiency is unchanged, improved, and declined respectively. Similarly,
indicates the technical progress is unchanged, improved, and declined respectively.
is furtherly broken down into pure technical efficiency (
) and scale efficiency (
), and Equation (4) can be expressed as follows.
where,
and
represents the distance function under VRSs at period
and period
, and
.
Comparing Equation (4) with Equation (6), it can easily obtain . The numerical analysis of and is similar to and .
3.4. Tobit Regression Model
Tobit regression [
47] is applied to evaluate the influencing factors that affected the technological innovation efficiency of NEV enterprises. Tobit regression can be expressed by the following equation.
where
,
,
,
,
represent the independent variable vector, the observed dependent variable, the correlation coefficient vector, the intercept term vector, and the random error term, respectively.
In this research, NEV enterprises’ technological innovation efficiency is measured by CCR and BCC models, and the selected impacting factors are taken as explanatory variables for regression. With analyzation, the influence direction and intensity of explanatory variables on each efficiency value can be obtained.
4. Empirical Results and Analyzation
4.1. Dataset and Variables
The DEA model and Malmquist productivity index are applied to analyze NEV enterprises’ technological innovation efficiency. We selected 23 new energy vehicle listed enterprises in China as samples. These 23 listed enterprises are the most representative NEV enterprises in China, and have contributed the most authorized products in the NEV market. As described in
Section 3, the two-stage DEA input–output index was selected.
As described in detail in
Section 3, the input–output index of two-stage DEA was selected. The specific input–output index and descriptive statistics are shown in
Table 1. All data come from the BvD (Bureau van Dijk) database.
In this paper, data from 23 of China’s NEV listed enterprises from the BvD database during the six years from 2013 to 2018 were selected. The CCR model and BCC model were adopted and DEAP 2.1 software was used for calculation of NEV enterprise’ innovation efficiency. For each stage of the two-stage DEA, the data of input–output index were applied in DEAP 2.1 software with different models to obtain the various innovation efficiency of the R&D stage and achievement transformation stage. Especially, for the second stage of two-stage DEA, the data of the R&D stage output index (the number of patents and technological assets rate) and the data of the intermediate input index (total number of employees) were the data of achievement transformation stage input index. As negative values cannot appear in a DEA index, the negative samples were eliminated. The specific results and evaluation of R&D efficiency and achievement transformation efficiency are presented below.
4.2. DEA Static Analysis
4.2.1. Pure Technical Efficiency
Enterprises’ production efficiency influenced by management and technology is expressed by Pure technical efficiency (
).
indicates that the DMU is effective. Based on the sample data of 23 NEV enterprises, 23 NEV listed enterprises’ pure technical efficiency in the R&D stage and achievement transformation stage was obtained, see
Table 2 (due to limited space, the name of the enterprises are abbreviated).
It can be seen from
Table 2 that during the six years from 2013 to 2018, the average value of pure technical efficiency of 23 NEV listed enterprises increased from 0.586 to 0.612 in the R&D stage, the average value increased from 0.710 to 0.722 in the achievement transformation stage.
4.2.2. Scale Efficiency
Scale efficiency (
) reflects the deficiency between an enterprise’s optimal production scale and the actual production scale.
indicates that the DMU is effective. Based on the sample data of 23 NEV enterprises, 23 NEV listed enterprises’ scale efficiency in the R&D stage and achievement transformation stage are obtained, see
Table 3.
According to
Table 3, the scale efficiency of the R&D stage of new energy vehicle enterprises is generally higher than that in the achievement transformation stage. According to the specific situation of each enterprise, the scale efficiency of enterprises is quite different between the two stages.
4.2.3. Technical Efficiency
Technical efficiency is a criterion thoroughly analyzing enterprises’ resource allocation ability, resource use efficiency, and other capabilities. Technical efficiency reaching 1 indicates the DMU is effective. In the DEA method, technical efficiency value equals to
, which indicates that only when both
and
reach optimal efficiency can the technical efficiency be effective. Based on the sample data of 23 NEV enterprises, 23 NEV listed enterprises’ technical efficiency in the R&D stage and achievement transformation stage are obtained, see
Table 4.
It can be seen from
Table 4 that during the six years from 2013 to 2018, the two stages’ technical efficiency of 23 NEV enterprises are quite different.
4.2.4. Overall Analysis of Innovation Efficiency
According to
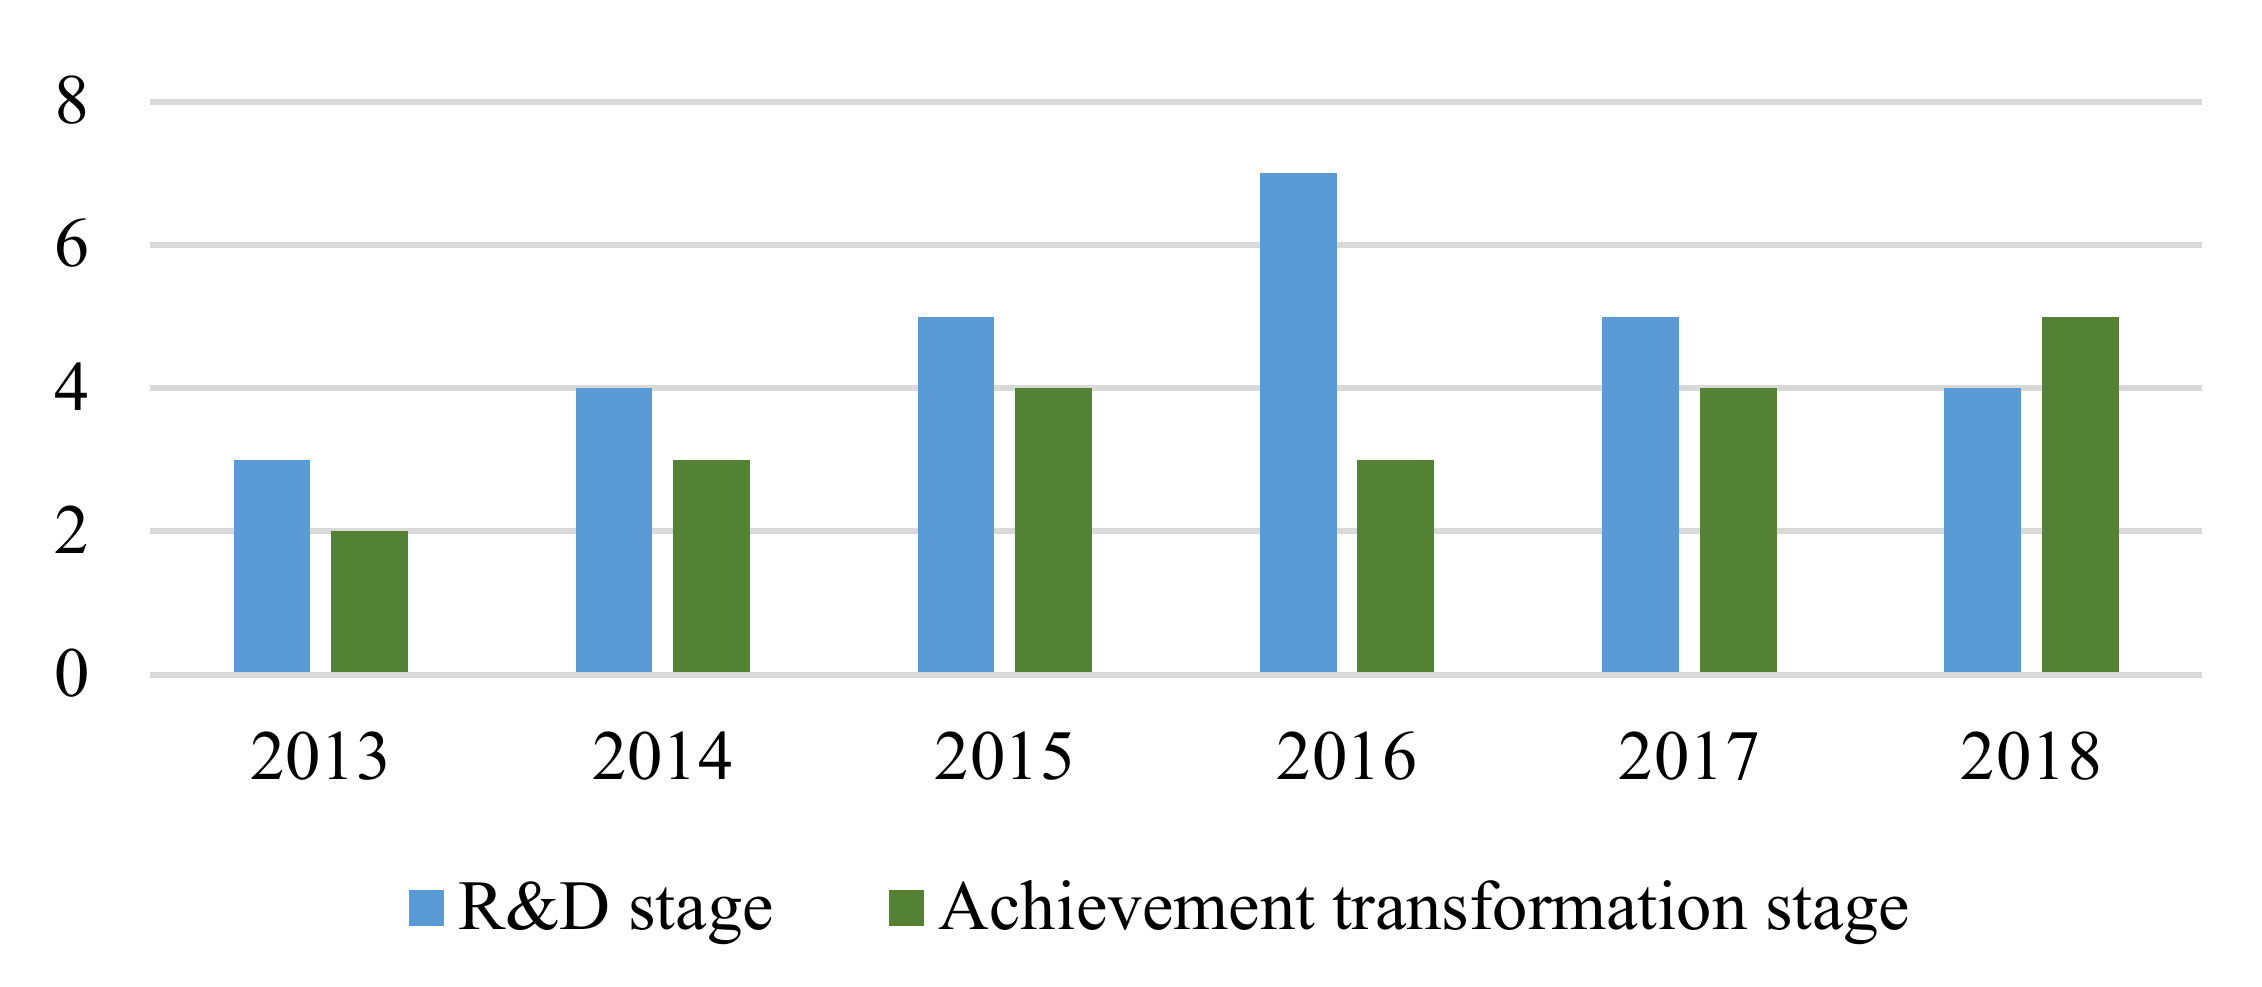
Table 5, the effective proportion in 2006′s R&D stage is the highest, and the number of effective enterprises in the R&D stage is generally greater than that in the achievement transformation stage. To observe the data characteristics more intuitively, see the effectiveness situation of 23 NEV enterprises’ technical efficiency in
Figure 2. According to
Figure 2, the number of effective enterprises in the R&D stage is obviously rising first and then falling, while the number of effective enterprises in the achievement transformation stage is generally rising. On the whole, there are more effective enterprises in the R&D stage.
On the basis of the above three efficiency evaluation, the authors analyzed the effectiveness of 23 NEV enterprises’ technical efficiency in each year. The number of effective enterprises, the number of ineffective enterprises, and the effective proportion of 23 NEV enterprises’ technical efficiency are listed in
Table 6. The 23 NEV enterprises’ average technical efficiency of two-stage DEA is listed in
Table 6.
According to
Figure 2, the number of effective enterprises in the R&D stage is obviously rising first and then falling, while the number of effective enterprises in the achievement transformation stage is generally rising. On the whole, there are more effective enterprises in the R&D stage.
According to
Table 6, numerically, 23 NEV enterprises’ average technical efficiency in both stages is low, fluctuating between 0.3 and 0.6. The difference between the two stages is not very obvious. In order to further observe the data characteristics, see the 23 NEV enterprises’ average technical efficiency of two-stage DEA in
Figure 3. According to
Figure 3, before 2016, the average technical efficiency in the R&D stage was markedly greater than that in the achievement transformation stage. After 2016, the technical efficiency in the achievement transformation stage was significantly improved, surpassing the R&D stage.
4.3. Dynamic Efficiency Evaluation
In order to obtain the dynamic characteristics of 23 NEV listed enterprises’ technical efficiency from 2013 to 2018, the MPI is applied to evaluate the panel data of samples. The changes and decomposition (
Effech,
Techch,
Pech,
Sech) of total factor productivity (
) in the six years from 2013 to 2018 are obtained, as shown in
Table 7.
According to
Table 7, in the R&D stage, the TFP of NEV enterprises is 0.921 from 2013 to 2018, which is not high. The pure technical efficiency is 1.079, indicating that the pure technical efficiency increases by 7.9% annually on average. The scale efficiency is the lowest, only 0.903, which shows that NEV enterprises have higher pure technical efficiency than the scale efficiency in the R&D stage, and the main reason for poorer total factor productivity is low scale efficiency.
From 2013 to 2018,
Effech,
Techch,
Pech, and
Sech are all greater than 1 in the achievement transformation stage, indicating that TFP is on the rise as a whole. The average year on year growth rate of
Effech,
Techch,
Pech,
Sech, and TFP is 5.1%, 5.7%, 1.6%, 3.5%, and 11.1%, respectively. It can also be deduced from
Table 7 that NEV enterprises have higher
Effech and
Sech in the achievement transformation stage, thus, NEV enterprises have higher TFP in the achievement transformation stage.
4.4. The Result of the Tobit Model
Tobit regression is adopted to evaluate the influencing factors that affected NEV enterprises’ technological innovation efficiency. As the DEA calculation results are truncated discrete distribution values between 0 and 1, if the ordinary least square method is applied to directly estimate the model, the parameter estimation values will be biased and inconsistent. Therefore, this paper adopted the Tobit regression of maximum likelihood estimation (ML) and established the Tobit regression model of NEV enterprises’ technological innovation efficiency as follows.
where,
is the intercept term of the model;
,
,
,
, and
are the regression coefficients of the explanatory variables.
stands for the NEV enterprise
(
),
stands for time (
),
is a random error term.
is the technical efficiency of NEV enterprise
in year
, and it is an explanatory variable.
and
represent the technical efficiency in the R&D and the achievement transformation stages, respectively. Due to the great differences among explanatory variables, to reduce the estimation error caused by dimension, all explanatory variables are standardized by dispersion. The specific explanatory variables and their descriptions are listed in
Table 8.
Regression analysis was carried out with Eviews10.0 software, and two-stage regression results were obtained (see
Table 9).
According to
Table 7, for the R&D stage, five results stand out. (1) The value of turnover of total capital is −0.5406, which indicates that the turnover of total capital is inversely proportional to the technological innovation efficiency of NEV enterprises. Each additional unit of turnover of total capital will lead to an average decrease of 0.5406 in the technological innovation efficiency, which is significant at a significant level of 1%. This reveals, in the R&D stage, the rapid turnover of total capital is not positive to technological innovation efficiency. (2) The value of government subsidy is 0.3920, which is significant at the significant level of 5%, indicating subsidy can significantly promote enterprises’ R&D efficiency. (3) The value of total assets is 0.192, indicating the total assets are inversely proportional to enterprises’ R&D efficiency. The total assets are significant at a significant level of 1%, which reveals the large scale of the company is not positive to the advancement of R&D efficiency. (4) The value of the management fee rate is −0.5300, which is strongly significant at the significant level of 1%, revealing, in the R&D stage, the high management cost of enterprises is not conducive to technological innovation efficiency. (5) Ownership structure, age of the enterprise, and return on assets did not pass the significance test. Revealing, in the R&D stage, these three indicators have no considerable effect on innovation efficiency.
Secondly, for the achievement transformation stage, five significant observations can be made. (1) The value of turnover of total capital is 0.1928, which indicates that the turnover of total capital is directly proportional to NEV enterprises’ innovation efficiency. Every additional unit of turnover of total capital will lead to an average increase of 0.1928 in technological innovation efficiency. Turnover of total capital is significant at a significant level of 5%, indicating that in the achievement transformation stage, the better the company’s management ability is, the more beneficial it is to technological innovation efficiency. (2) The value of total assets is 0.4915, which indicates that the total assets are directly proportional to the technological innovation efficiency of NEV enterprises in the achievement transformation stage. The total assets are significant at a significant level of 1%. This shows that the bigger the company is, the better it is for the enterprise to improve its innovation efficiency in the achievement transformation stage. (3) The value of the age of the enterprise is 0.5509, which is directly proportional to the efficiency value at a significant level of 1%, indicating that the longer the development history of the enterprise, the more experienced they are in transforming technological achievements. (4) The value of return on assets is 0.2676, which is significant at the significant level of 10%. Revealing, in the achievement transformation stage, the better the company’s profitability is, the more beneficial it is to technological innovation efficiency. (5) Ownership structure, government subordinate, and management fee rate failed the significance test, indicating that these three indicators have no considerable effect on innovation efficiency in the achievement transformation stage.
Finally, on the whole, the value of the ownership structure is not significant for both two stages, indicating that ownership structure has no considerable impact on innovation efficiency in both stages. Government subsidies’ impact on NEV enterprises’ innovation efficiency mainly lies in the R&D stage. Thus, the influence of government subsidy in the R&D stage is greater than that in the achievement transformation stage. Turnover of total capital and total assets have significant impacts in both two stages, but they have negative impacts in the R&D stage and positive impacts in the achievement transformation stage, indicating that the two stages’ technological innovation efficiency is quite different. Thus, it is necessary to evaluate them separately.
5. Discussion
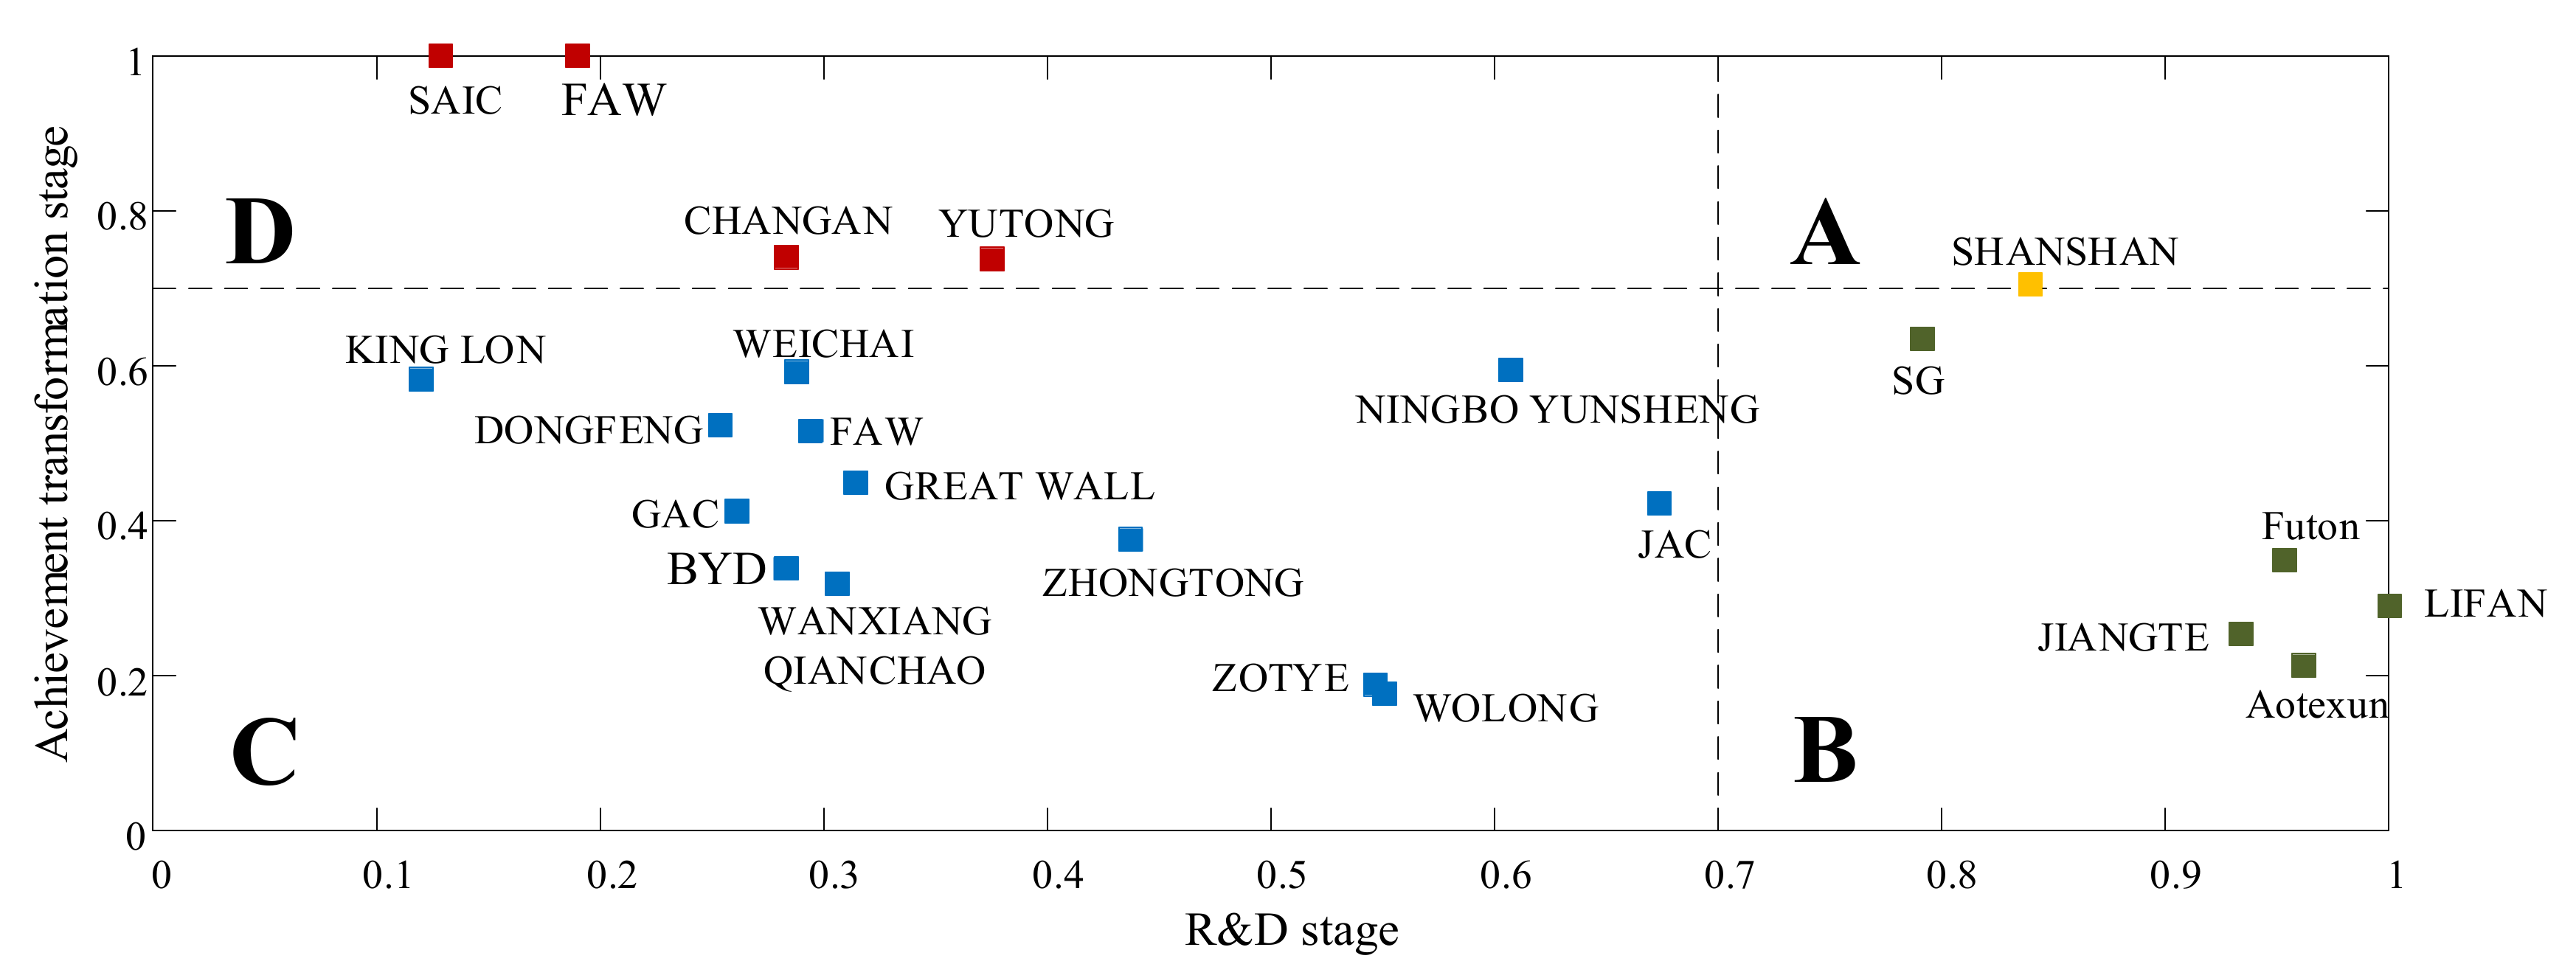
In order to analyze and discuss how different NEV companies improve the technological innovation efficiency and redistribute innovation resources, 23 NEV enterprises were classified into four types—A, B, C, and D—according to the value of R&D and achievement transformation stages’ technical efficiency. The two-dimensional block diagram of 23 NEV enterprises’ two-stage innovation efficiency was drawn, as shown in
Figure 4.
The authors classified 23 NEV enterprises into four types according to the value of R&D and achievement transformation stages’ technical efficiency. As shown in
Figure 4, type A enterprises are enterprises whose R&D and achievement transformation efficiency are all greater than 0.7. At present, only SHANSHAN is a type A enterprise; its R&D and achievement transformation efficiency are all very high. Type B enterprises are enterprises whose R&D efficiency are greater than 0.7, but whose achievement transformation efficiency are less than 0.7. Type B enterprises include LIFAN, Aotexun, Futon, SG, and JIANGTE. This type of enterprise has high R&D efficiency, but the achievement transformation efficiency is low, which indicates that the commercial value of R&D results has not been transformed in time, and affects the overall efficiency of technological innovation. Type C enterprises are enterprises whose R&D efficiency and achievement transformation efficiency are all less than 0.7. Type C enterprises include KING LONG, DONGFENG, WEICHAI, FAW, GREAT WALL, GAC, WANXIANG QIANCHAO, BYD, ZHONGTONG, ZOTYE, NINGBO YUNSHENG, JAC, and WOLONG. The R&D efficiency and achievement transformation efficiency of this type of enterprise are all low. Type D enterprises are enterprises whose R&D efficiency are less than 0.7, but whose achievement transformation efficiency are greater than 0.7. Type D enterprises include SAIC, FAW, CHANGAN, and YUTONG. The achievement transformation efficiency of this type of enterprise is high, some of which are close to 1, while the R&D efficiency is low.
According to the different characteristics and two-stage efficiency of each type of enterprise, this paper proposed the following guidance for different types of NEV enterprises to reallocate their resources more rationally and improve their innovation efficiency.
Firstly, for type A enterprises, the efficiency of this type of enterprise reaches the best in both stages, which indicates that the innovation factors such as total capital, R&D personnel, and R&D expenditure in both stages of technological innovation have been optimally allocated and rationally utilized. It is worth noting that the technological innovation efficiency of SHANSHAN has reached a very high level. At present, the global capacity of lithium battery materials has rapidly gathered in China, while the capacity of lithium battery materials in China has rapidly gathered in SHANSHAN. SHANSHAN devoted all its manpower, material resources, and financial resources to lithium battery materials as its main business. Its core goal is to occupy the market with advantages of cost performance, scale, and technology; lead the formulation of global industry technical standards; and strive to become a leader in the new energy industry in the world. While increasing investment in innovative resources, SHANSHAN should also pay attention to improving the utilization efficiency and management level of innovative resources, promoting the optimal allocation and rational utilization of innovative resources, and keeping its innovative resource structure in a rational state.
Secondly, for type B and type D enterprises, the unilateral breakthrough efficiency improvement path (B→A and D→A) should be adopted to improve innovation efficiency. These two types of enterprises should take the low efficiency stage as a breakthrough, focus on the utilization efficiency of various innovative resources at this stage, promote the coordinated development of innovation processes, and realize the overall improvement of innovation efficiency. Taking Futon as an example of a type B enterprise, Futon’s R&D efficiency has reached 0.953, while its achievement transformation efficiency is only 0.349. Obviously, the two stages’ efficiency level of Futon is extremely uneven. Although Futon can make full use of innovative resources such as manpower and capital to produce technological achievements, it fails to realize the transformation of technological achievements in time and effectively. Therefore, Futon should focus on the core business of commercial vehicles; take market competition as the guide; aim at the needs of users; pay attention to the economic transformation of R&D achievements; and promote the cooperation of production, education, and research. Taking CHANGAN as an example of a type D enterprise, the R&D efficiency of this enterprise is only 0.283, while the achievement transformation efficiency has reached 0.741. This shows that the efficiency levels of the two stages of this enterprise are quite uneven. In recent years, CHANGAN has continuously increased its R&D investment. This type of enterprise should focus on the R&D stage, make use of the existing technology market, introduce high-level talents in the fields of new energy, and set up R&D teams to improve the R&D efficiency.
Thirdly, for type C enterprises, a two-way coordinated efficiency improvement path should be adopted (C→A) to improve the innovation efficiency. As the efficiency level of these enterprises in both stages is low, it is of great importance to utilize the innovative resources in both stages of technological innovation well. Since there are a large number of enterprises of this type, they can be further refined into three types of enterprises according to the two-stage efficiency—namely C1, C2, and C3—to carry out targeted related efficiency improvement. C1-type enterprises are enterprises with similar R&D efficiency and achievement transformation efficiency, including ZHONGTONG, NINGBO YUNSHENG, and JAC. Taking ZHONGTONG as an example, its R&D efficiency is 0.437, and its achievement transformation efficiency is 0.377; the efficiency levels of the two stages are relatively close. Such enterprises should strengthen basic research and infrastructure construction, optimize the training system of innovative talent, and accelerate the improvement of overall efficiency in a short period of time. C2-type enterprises are enterprises whose R&D efficiency are greater than the achievement transformation efficiency, including ZOTYE and WOLONG. Taking ZOTYE as an example, the R&D efficiency of this enterprise is 0.547, the achievement transformation efficiency is 0.188. In recent years, the B-class platform chassis upgraded by ZOTYE has mastered the core chassis technology and reached the peak of the company in 2016 and 2017. Subsequently, the annual sales volume of ZOTYE declined rapidly for two consecutive years. Obviously, only when the technological achievements are transformed well and two stages develop harmoniously can the overall efficiency of technological innovation be improved steadily. C3-type enterprises are enterprises whose R&D efficiency is less than the achievement transformation efficiency, including KING LONG, DONGFENG, WEICHAI, FAW, GREAT WALL, GAC, WANXIANG QIANCHAO, and BYD. Taking DONGFENG as an example, its R&D efficiency is 0.254, and its achievement transformation efficiency is 0.523. This type of enterprise should pay attention to R&D efficiency, take differentiated measures according to its own reality, and improve R&D efficiency by attaching importance to technology introduction, so as to realize rapid improvement of overall efficiency in a short time.
6. Conclusions
In this paper, the NEVs’ technological innovation process is divided into two stages: the research and development (R&D) stage and achievement transformation stage. Based on DEA–Tobit model, an evaluation framework of NEV enterprises’ technological innovation efficiency was constructed. The R&D efficiency and achievement transformation efficiency of 23 NEV listed enterprises from 2013 to 2018 were evaluated. In addition, according to two stages’ efficiency, 23 NEV enterprises were divided into four categories. For different types of enterprises, targeted guidance to improve the innovation efficiency and reallocate the innovative resources was proposed. In summary, the following conclusions can be obtained.
First, the overall technological innovation efficiency of NEV enterprises in China is low, among which, the R&D efficiency is generally higher than the achievement transformation efficiency. In this paper, the innovation resource distribution in each stage of the technological innovation process is fully considered. NEV enterprises’ two-stage innovation efficiency is analyzed in depth, which is helpful to find out the deep-seated reasons for the lower overall efficiency of NEV enterprises, and plays a guiding role in seeking specific paths to improve innovation efficiency.
Second, from the multi-dimensional perspective of the enterprise life cycle, the innovation performance characteristics of enterprises in different dimensions are quite different, and the technological innovation efficiency among enterprises is also different, which indicates that there is an imbalance development in China’s NEV industry.
Third, according to NEV enterprises’ two-stage technological innovation efficiency and its specific situation, this paper proposed targeted guidance for different types of enterprises to improve their innovation efficiency. Due to the differences in technological innovation efficiency, different NEV enterprises should adopt different approaches to improve their technological innovation efficiencies. Enterprises should give full consideration to their own actual situation, combine the specific characteristics of the two-stage technological innovation efficiency, and come up with targeted approaches to improve the innovation efficiency.
However, the research on NEV technology innovation efficiency in this paper focused more on the existing first-mover advantage and scale advantage, and did not consider various transformation forces of the automobile industry. For example, the Internet, semiconductor, and other technology giants cross the border to enter the NEV industry, which reshapes the competition pattern and reconstructs the core value chain of the NEV industry. This paper lacks the consideration of these factors. In future, these factors will be added into the research.


