1. Introduction
In Brazil, road transport represents 61% of transport volume. This creates an imbalance due to the excess supply of road transport, which favors unfair competition with other modes of transport and limits the emergence of a scale that would justify investments in transport segments with higher fixed costs [
1]. According to [
2], this fact generates a vicious circle in which the prices paid by shippers barely remunerate the costs of carriers, causing narrow profit margins that contribute to lower maintenance rates and slower fleet renewals [
3]. Data from the National Registry of Road Transport of Goods (RNTRC) and [
4] show that in the current road transport of cargo, 85.6% of vehicles have an average age of 13.5 years, meaning there is a high rate of obsolescence [
4,
5,
6]. The association of this factor with the precariousness of preventive and corrective maintenance means that there is a higher risk of accidents and a lower energy efficiency in road transport, which can lead to reduced productivity.
Additionally, road freight transport (RFT) operates with precarious infrastructure, considering that only 13.6% of the 1,563,447 km of roads in the country are paved [
7]. This increases greenhouse gas (GHG) emissions [
8] and reduces energy efficiency [
9]. The most serious problem is related to accidents on Brazilian roads. According to data from the Seguradora Líder statistical bulletin, 37,492 deaths, 263,923 cases of permanent disability and 53,823 cases of reimbursement of medical expenses [
10] were recorded as a result of traffic accidents between January and November 2017. Data published in [
11] indicate that the total cost of traffic accidents on Brazilian roads has been about USD 7.89 billion, which adjusted by the Hamonised Index of Consumer Price (HICP) to values of December 2017 reaches USD 12.69 billion. This amount corresponds to 0.63% of Brazilian GDP in 2017, and was higher than the government investment in road infrastructure and measures to mitigate factors generating accidents.
The problems identified above, combined with the importance of RFT for the economic development of the country, gives rise to discussions on how to increase the level of safety, reduce the cost of transport and improve the functioning of the trucking industry. Based on a study published in [
12] that compared the influence of event data recorder (EDR) systems on driving patterns after the introduction of two short-term training sessions, it was perceived that the training process enhanced the results obtained. Thus, this paper evaluates the results of applying a specific training procedure, developed by us, based on the data collected by the EDR systems, and evaluates the efficiency indices calculated from those data through data envelopment analysis (DEA) with respect to safety, operational and economic criteria during different monitoring phases.
In this context, we respond to the following questions: (1) Can the data collected by EDR systems be used as a basis for structuring training and feedback procedures aimed at reducing undesirable behavior? (2) Do driver training procedures and feedback from managers influence results? (3) On the basis of the variables collected, can indicators be defined that characterize the various criteria? (4) Which of the criteria evaluated are most sensitive to the training and feedback procedures?
Thus, the objective of this work is to analyze the evolution of driving behavior through efficiency indices calculated using DEA, incorporating criteria for the economy, operation and safety in road freight transport fleets and taking into account the applications of specific training and feedback procedures elaborated from the data obtained by the EDR systems in different monitoring phases.
2. Background
The economies of most developing countries are strongly dependent on the road transport of goods and passengers. Despite this dependence, RFT has many factors that increase inefficiency. To understand the causes of this inefficiency in Brazil, data presented by several authors were analyzed, including [
13,
14,
15,
16,
17,
18,
19,
20,
21,
22,
23,
24,
25,
26,
27,
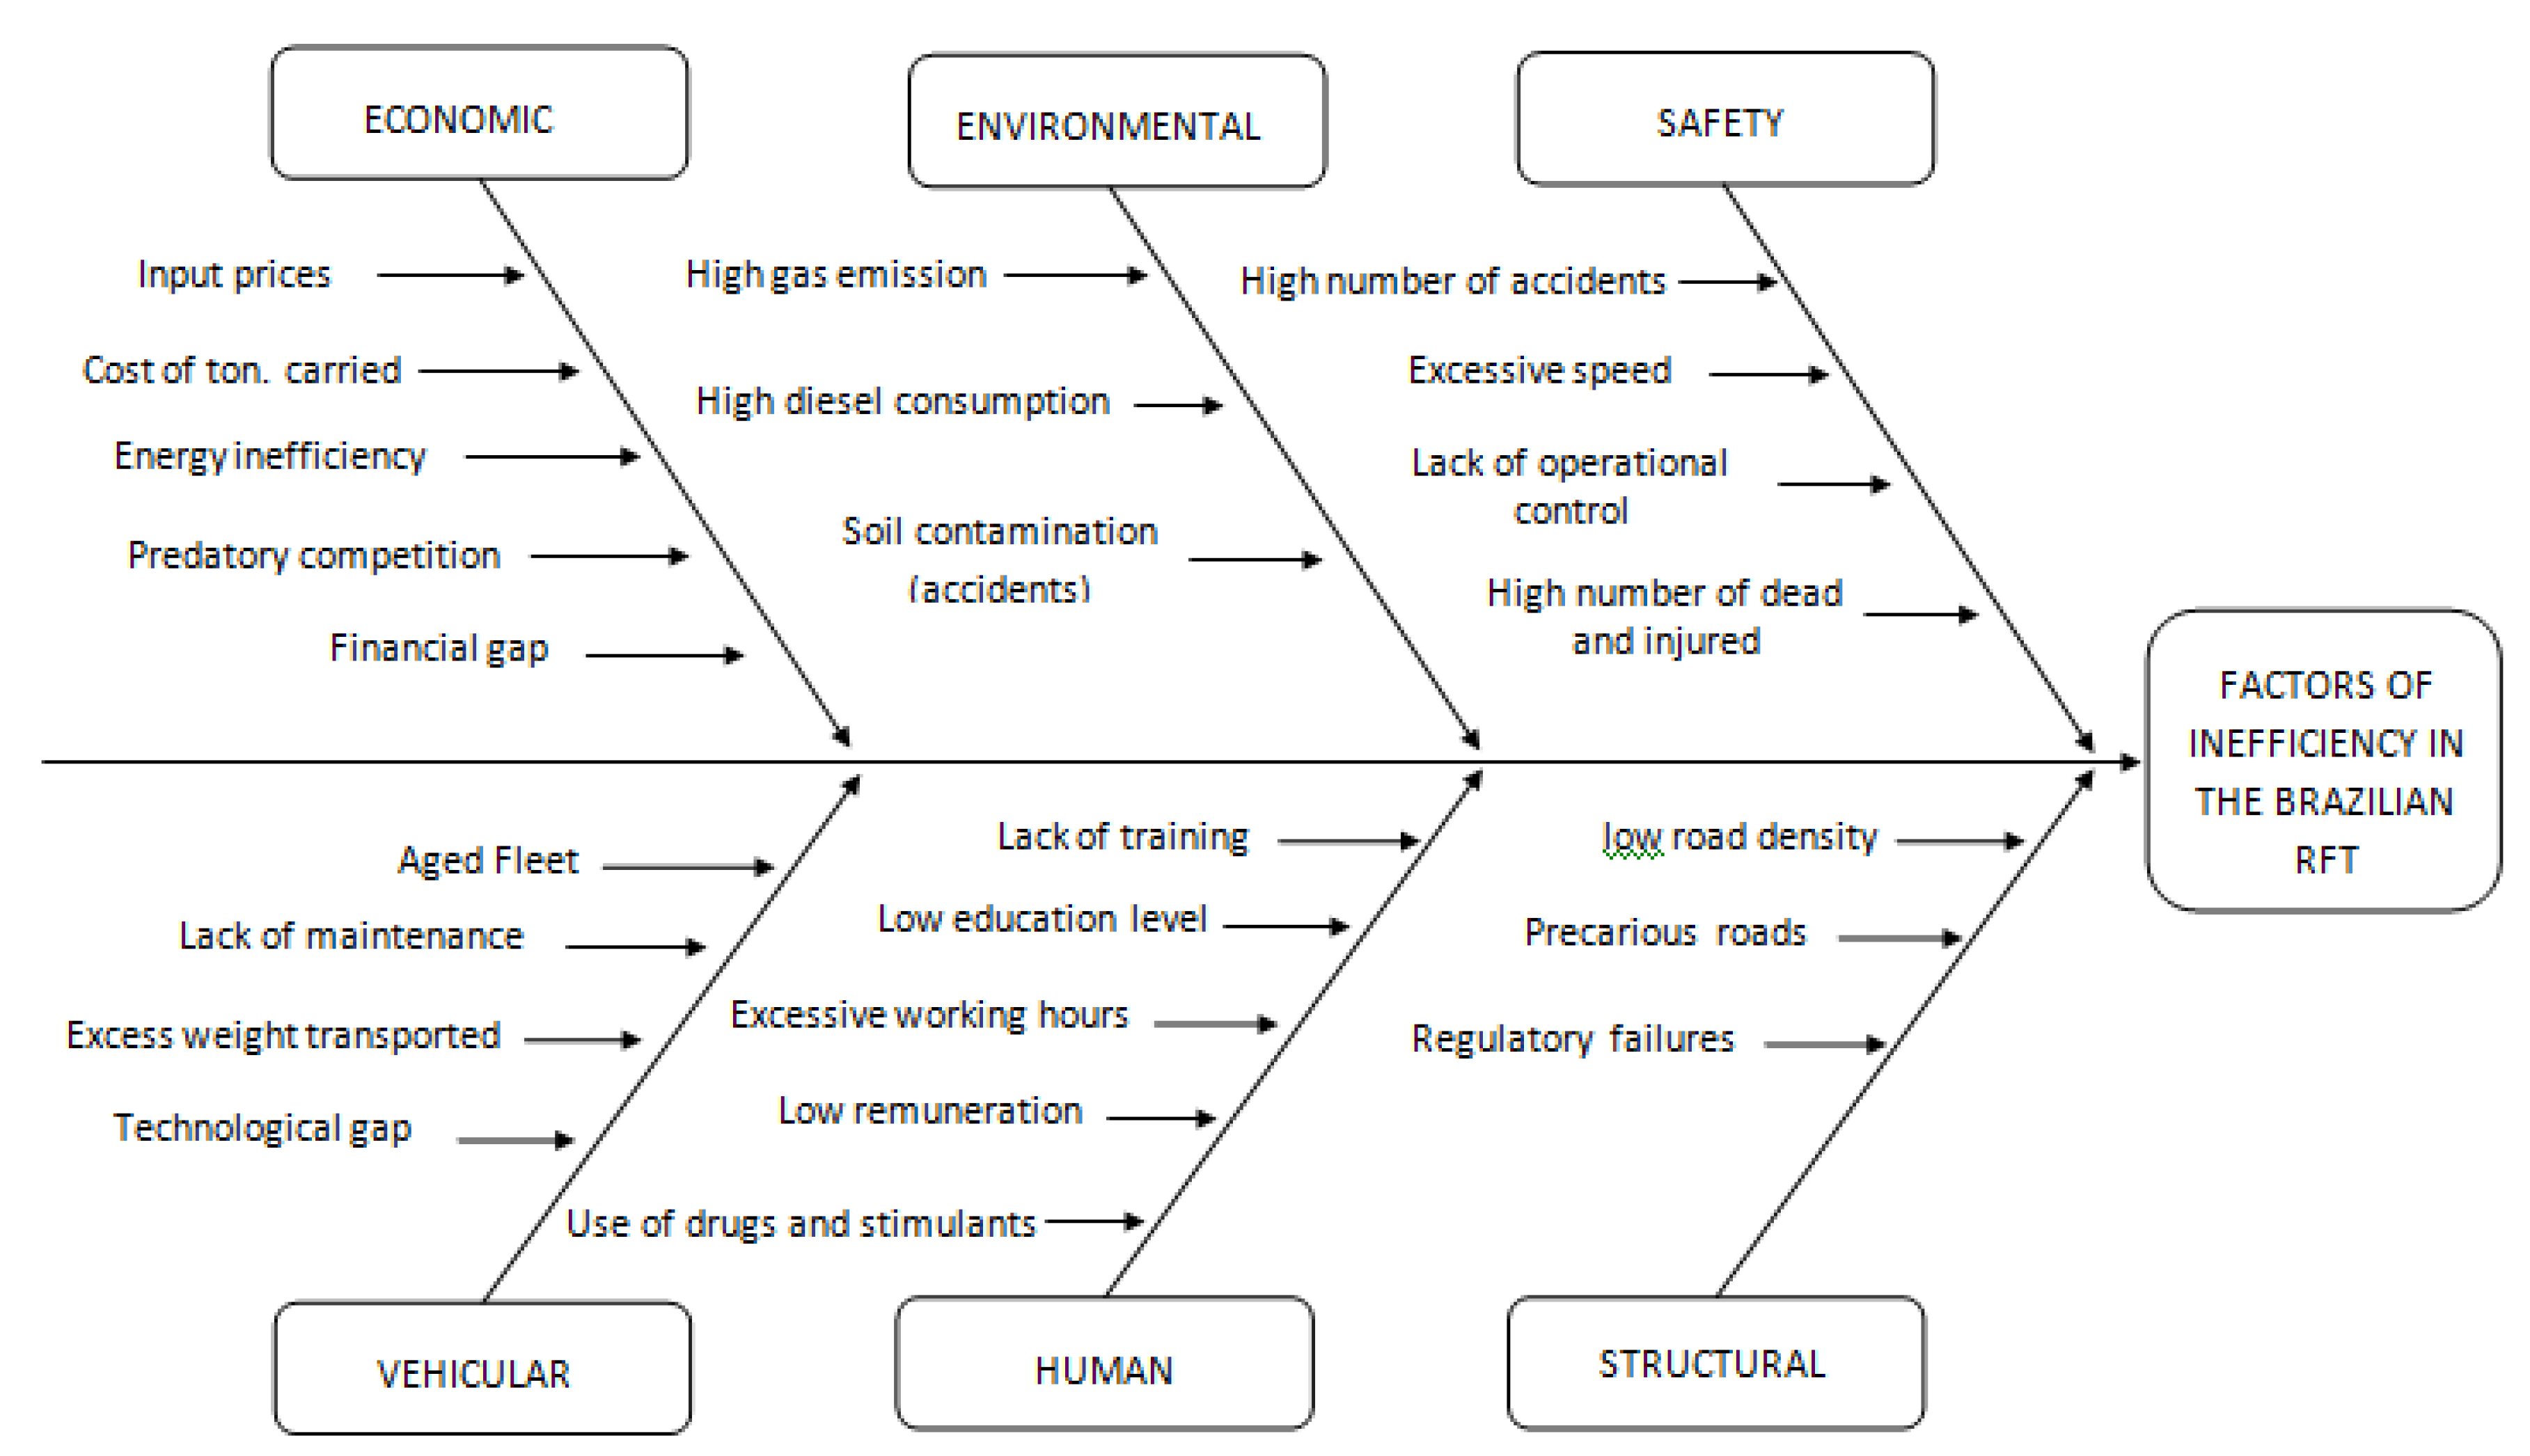
28]. Based on these sources, it was possible to prepare an Ishikawa diagram (a cause and effect diagram) in which the problem (effect) was inefficiency in the Brazilian RFT, and the causes were the following factors: vehicular, human, economic, environmental, safety and infrastructure (
Figure 1).
Among these factors, the most serious consequences are related to safety. According to [
29,
30], the human factor is the main reason for the occurrence of accidents, and is present in 93% of cases. A previous study [
31,
32] found that a lack of training processes, drug use and a low remuneration of drivers contributed to the adoption of unsafe actions that consequently reduced safety levels. Furthermore, Ref. [
33] found relationships among vehicular, human and structural factors in the occurrence of accidents.
The safety level and economic factors are also affected by the infrastructure factor. In Brazil, according to the [
34], 58.2% of the 211,468 km of paved roads are considered regular, bad or very bad, depending on their paving, signaling and/or geometry.
According to [
16], operating on roads with better paving conditions allows a reduction of up to 7.8% in fuel consumption and 2.8% in travel time. Also in relation to roads, in the world competitiveness ranking, comprehensive and efficient infrastructure ensure the proper functioning of a country’s economy [
35]. One of the main aspects cited by the study was quality of roads, and in this sense, Brazil was ranked 111th out of the 138 countries evaluated.
Regarding energy efficiency, the main problems arise as a result of the use of obsolete vehicles, with the average age of the fleet being 13.6 years [
5]. These vehicles operate with less efficiency and more pollution being emitted from their engines. In this respect, the Brazilian fleet on average operates with engines at stage P2 of the Program to Control Air Pollution by Automotive Vehicles (Proconve), which is equivalent to Euro 0, while current engines in Europe operate at P7 (Euro 5) or higher. This an 87% increase in CO
2 emissions, an 81% increase in HC emissions and an 86% increase in NO
x emissions [
36].
In relation to risk reduction, some actions and tools such as safety devices and integrated technologies have a good capacity to mitigate both the probability and severity of accidents in vehicles. The study in [
37] identifies five pillars that can increase safety, with the third being the need to promote the development of safe vehicles through the implementation of technologies that are active, passive or that combine the two. In this context, passive technologies aim to reduce the severity of injuries (e.g., airbags, seat belts, bumpers), while active technologies have the function of preventing accidents (e.g., EDR, electronic stability control, intelligent speed adapters) [
38]. The relationship between reducing the number of accidents and increasing the number of safety systems, combined with associated and integrated technologies, is described in [
39]. It is highlighted in [
40] that human errors are the main cause of road accidents, and that advanced driver assistance systems (ADAS) can reduce exposure to risk, since their main function is to support drivers through alerts, and in some cases take control in situations of eminent accident. A large number of integrated technologies that have enabled the collection of relevant data on both safety and driving behavior are discussed in [
41,
42]. Four active safety technologies (forward collision warning, lane departure warning, side view assist and adaptive headlights) are evaluated in [
43], which states that the combined use of these technologies could prevent or mitigate 1,866,000 collisions per year, including 149,000 serious and moderate accidents and 10,238 deaths on US roads. Twenty-one safety technologies applied to road vehicles were assessed for their cost–benefit ratio (CBR) [
44]. The report analyzed the impact of these technologies on reducing the number of occurrences and the degree of severity of accidents, and event data recorder (EDR) systems were ranked as the most promising technology by which to mitigate and minimize the factors associated with primary accident risks, justifying the investment required for their implementation.
EDR systems normally comprise an electronic control unit (ECU) that incorporates an Electrically-Erasable Programmable Read-Only Memory (EEPROM), with the objective of continuously recording parameters measured and recorded by the sensors and systems of the vehicle [
45]. These technologies are commonly known as “black boxes”, whose function is to capture all the electronic signals and electrical impulses generated by the various modules of the system, transforming these data into statistics via a proprietary platform [
46,
47].
According to [
48], EDR has a preventive character, with the capacity to reduce accidents by 20%, deaths by 5.5% and serious injuries by 3.5%. On the other hand, Ref. [
29] describes several functionalities of these systems that can be exploited in the driver training process to promote safety awareness and reduce accident rates—with significant benefits to companies, drivers and society. In addition to the safety aspects, these systems can allow companies to improve their efficiency and reduce fuel consumption.
The importance of EDR systems in reducing travel time and fuel consumption and improving environmental quality is also highlighted in [
49]. Feedback systems based on the Ecodriving concept, which evaluates variations in consumption and emissions that are generated during idling, is discussed in [
50].
The benefits of EDR systems in three areas (accident research, driver performance and vehicle maintenance) are evaluated in [
51], which posits that fuel consumption profiles are clearly related to the driving profiles, and that technology allows correcting errors and undesirable behavior in order to reduce consumption. Concerning vehicle maintenance, that study corroborated the capacity of these systems to provide continuous control and consequently identify defects and faults in fleets, generating relevant data for maintenance personnel that allow preventive interventions instead of corrective maintenance that could be more costly. The study also found that monitoring these variables over time has the potential to provide fleet performance indicators that can reduce costs, mitigate problems, prevent accidents and promote the improvement of environmental aspects.
According to [
12], the introduction of a standardized training that combines existing common and standardized training methods (based, for example, on the concepts of efficient driving, vehicle maintenance and transport planning, among others described in EC59/2003 and EU 645/2018 [
52,
53]), can have a positive effect on safety, economic and operational criteria. However, it is necessary to analyze the degree of efficiency of these criteria when analyzing drivers’ behavioral patterns when involved in specific training processes where procedures and courses are structured based on individual characteristics. For this reason, we developed a procedure based on the individual data of drivers, allowing training procedures to be tailored to each driver’s unique driving profile. The final aim of the study is to check whether there is a positive change in driving behavior when using this procedure than when using a normal training program, and to check whether or not the isolated use of this system guarantees that behavioral changes are maintained over time.
3. Data Envelopment Analysis (DEA)
Data envelopment analysis (DEA) is a nonparametric method that was originally developed in [
54] to compare the performances of homogeneous production units (HPUs) using multiple inputs in the production of one or more outputs [
55,
56].
A decision-making unit (DMU) can represent any type of productive unit that has autonomy in a decision-making process, including schools, industries, banks, private companies, military bases and governments, among others [
54,
57].
The results presented by the DEA model permit the formation of a standard efficiency frontier that is based on standard efficiency indices considering the optimal ratios of outputs to inputs. One of the advantages of the DEA method is the possibility of using several inputs and outputs whose units may differ from one another without the results being modified [
17]. Another advantage is the possibility of considering outliers as a reference (benchmark) to be studied according to the other DMUs [
58]. It is mentioned in [
59] that one of the greatest advantages of the DEA method is the flexibility of using weighting parameters, since this allows the identification of inefficient DMUs.
Among the disadvantages of DEA are the sensitivity of the results to the inclusion or exclusion of certain variables (inputs and/or outputs), as well as the inability to consider the differences between the external environments of the DMUs, which can result in a false result affecting the management capacity of the decision-makers [
58,
60].
To evaluate the performances of DMUs, the DEA method utilizes two types of models: classic and advanced. The classic model is composed of a constant return to scale (CRS) model and a variable return to scale (VRS) model [
61].
The Charnes, Cooper and Rhodes (CCR) model, based on the CRS model type, considers that the amount of resources (inputs) used is proportional to the amount of outputs produced [
54]. Graphically presented, the area of this model includes the values of the DMU variables that present the optimal relationships between outputs and inputs, as shown by Equations (1)–(4) [
62].
Subject to
where
and
represent input and output data, respectively, for
; and
and
represent the weights associated with the inputs and outputs, respectively.
The Banker, Charnes and Cooper (BCC) model, based on the VRS model type, was developed from the CCR model, in which the axiom of proportionality is replaced by the axiom of convexity (
), as shown in Equations (5)–(8) (primal) and Equations (9)–(12) (dual) [
63,
64].
Subject to
Subject to
Both models (CCR and BCC) have envelope and multiplier versions. The results presented by the multipliers are the weights assigned by the DEA model and the efficiency indices, which allow the formation of the efficiency frontier in the graph. The envelope determines the objectives, gaps and benchmarks of the inefficient management mechanisms, which determine to what extent the inefficient management mechanisms should increase (if they are production-oriented) or decrease (if the orientation is an input) the values of the problem’s variables [
63].
Classical DEA models can be input- or output-oriented. Output orientation occurs when the maximum number of outputs is desired without changing the amount of inputs used. The objective of this orientation is to identify the production potential of the DMUs. On the other hand, input orientation occurs when resources (inputs) need to be minimized without changing the outputs. In this orientation, the DEA model allows the free capacity of the DMUs to be identified [
58].
The DEA method is benevolent in its evaluation of the DMUs, considering the variables that most favor the calculation of efficiency and assigning greater weights to these variables and lower ones to unfavorable variables [
65].
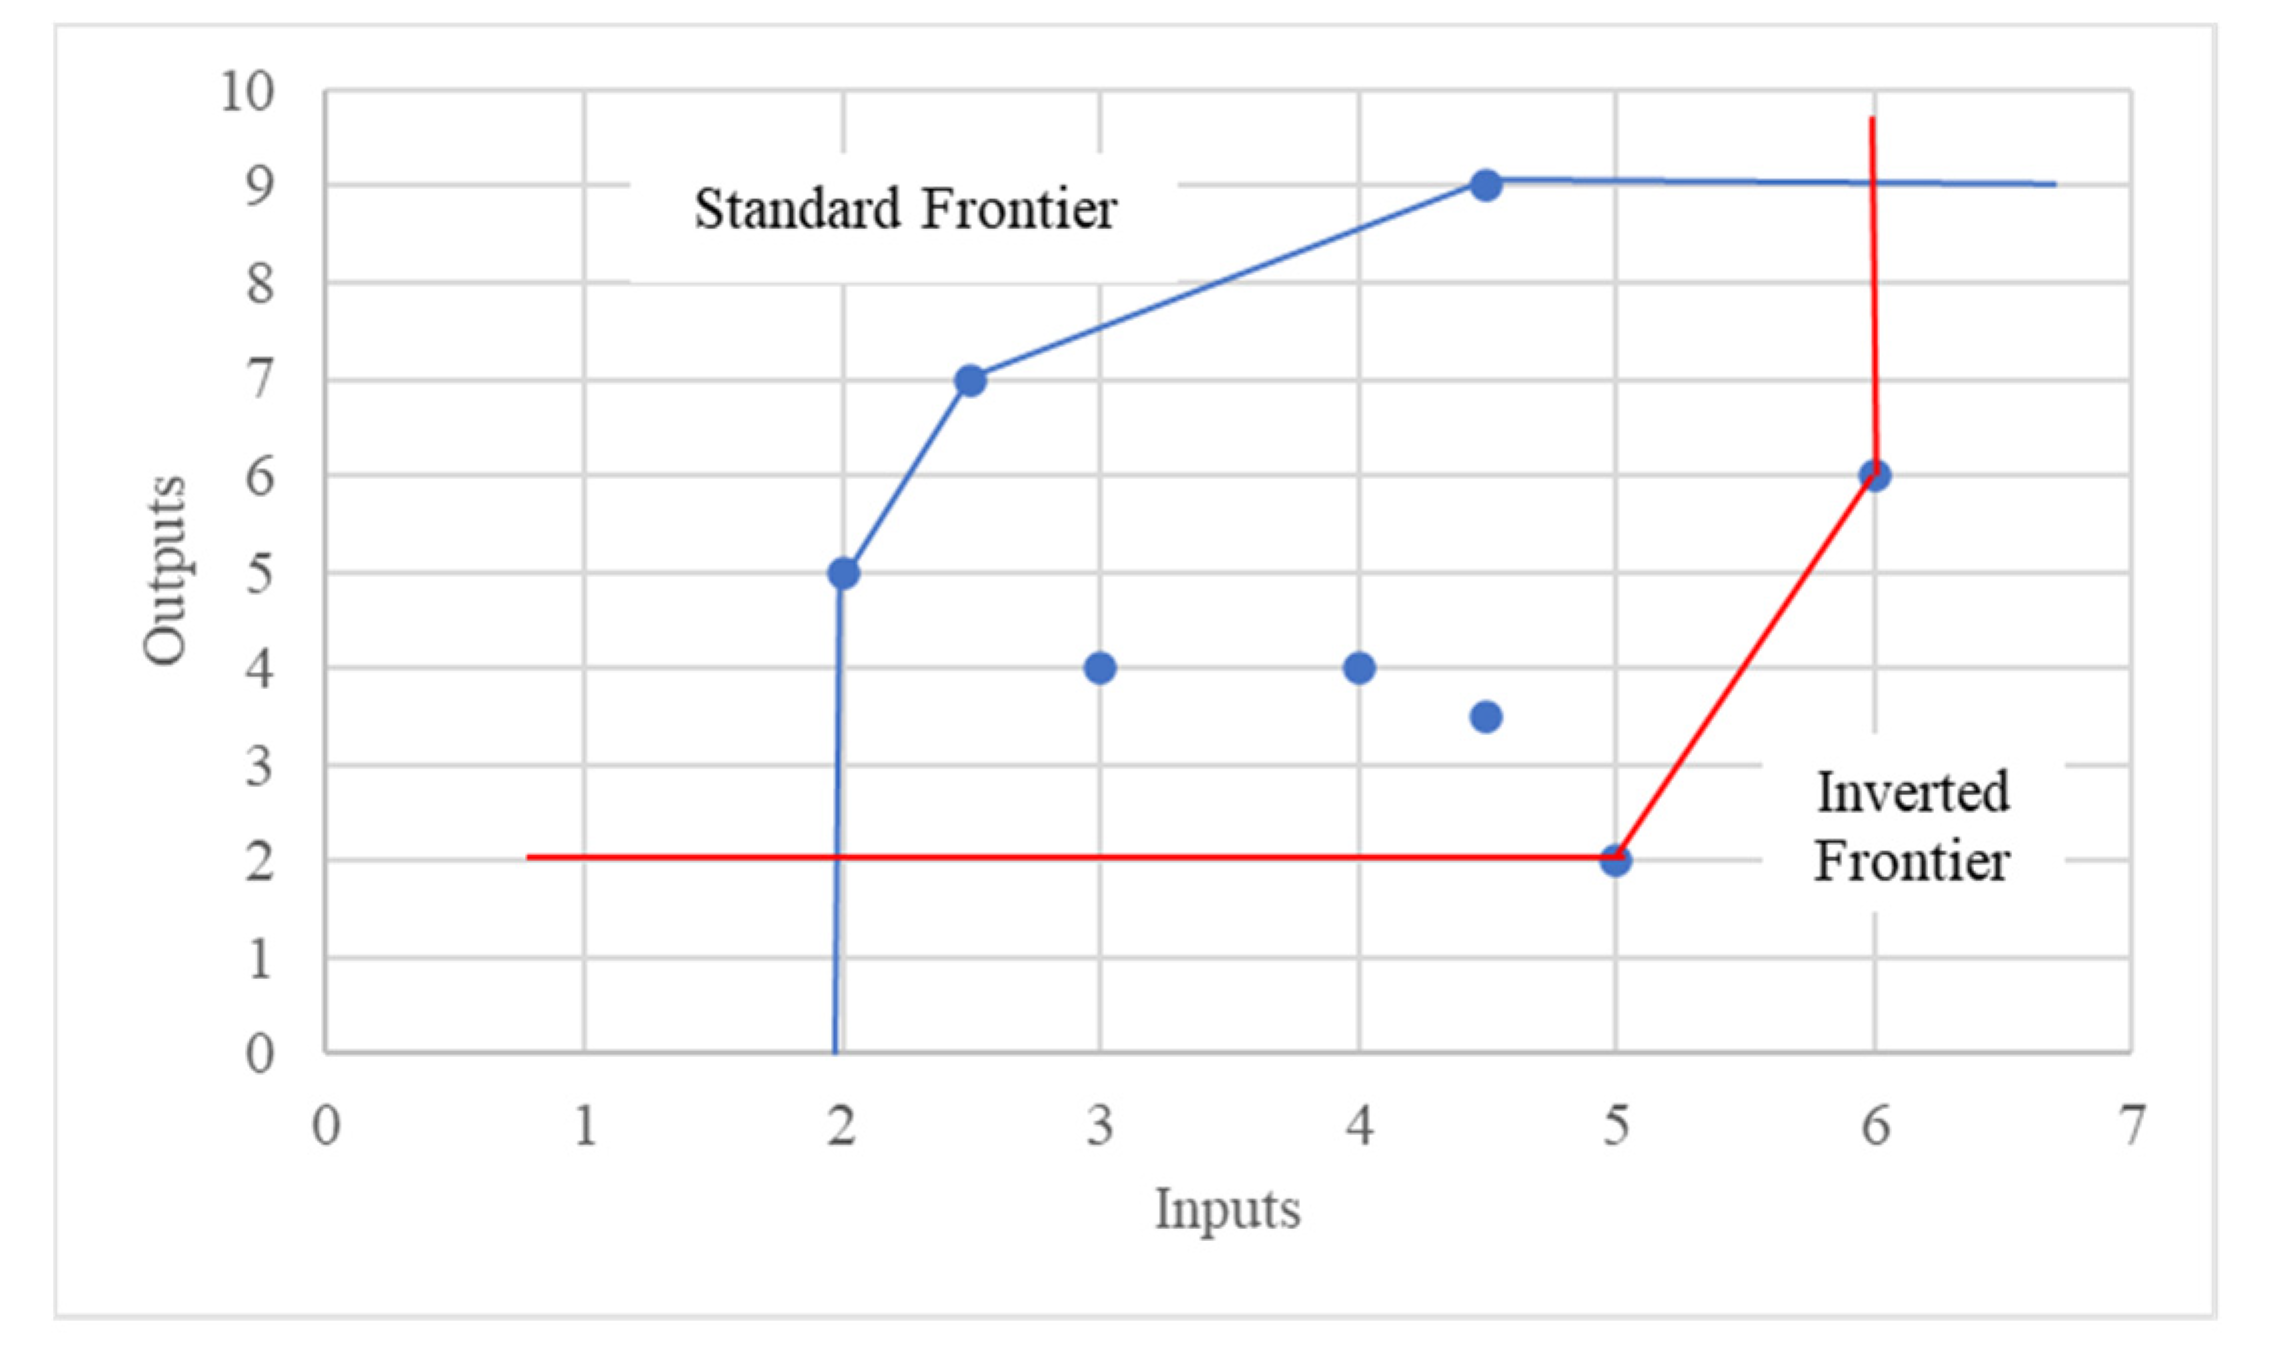
As a result of this benevolence, it is possible for a high number of DMUs to be considered efficient, which can affect the analysis. To overcome this drawback, the evaluation of the inverted frontier allows increased discrimination of efficient DMUs, since they should be in the standard efficiency frontier, which is located as far as possible from the inverted border. DMUs that integrate the two frontiers (standard and inverted) are falsely efficient, as they are just as efficient as they are inefficient.
Figure 2 shows the standard and inverted limits of the BCC in the DEA model [
63].
The composite efficiency index (
) used to increase the discrimination of efficient DMUs is calculated using Equation (13) [
66,
67,
68].
where
is the standard efficiency of the
DMU and
is the inverted efficiency of the
DMU.
The
results range from 0 to 1. The normalized composite efficiency index (
) is a way of prioritizing
, the ratio of each
value to the highest
of all DMUs (
), as shown in Equation (14) [
66].
4. Materials and Methods
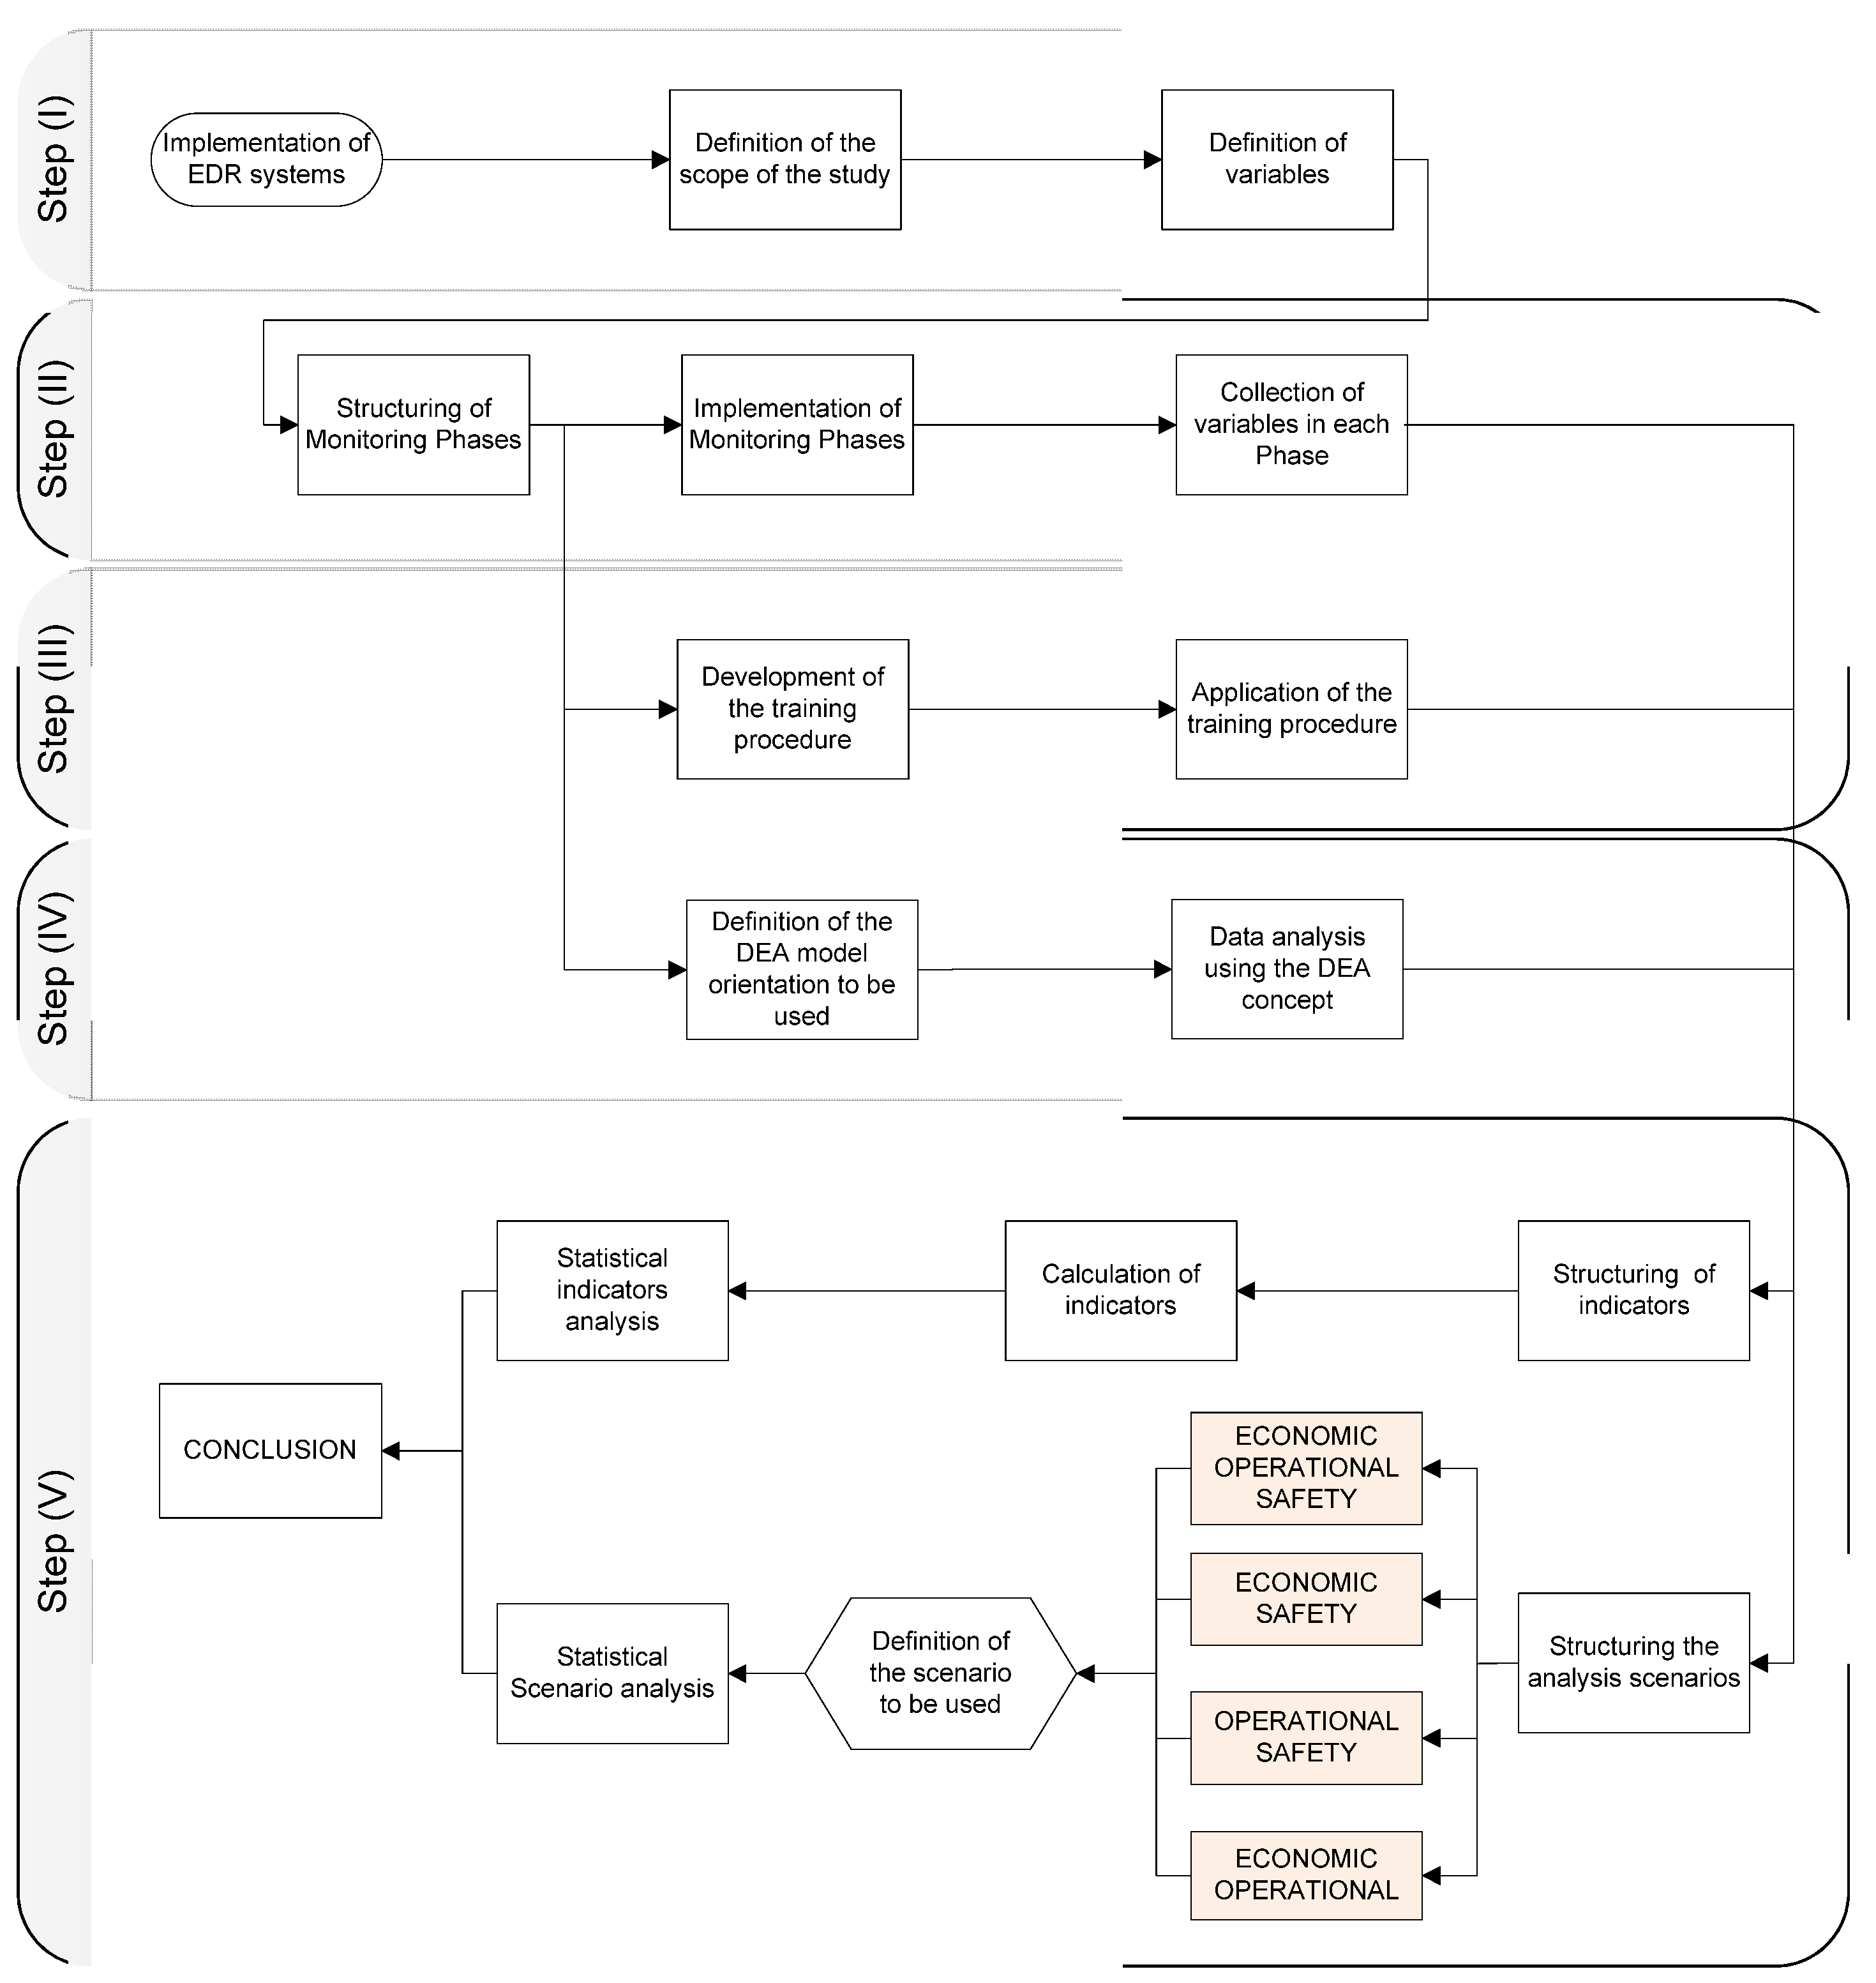
The procedure presented used a sample of 22 heavy trucks from a transport company. The trucks were monitored using EDR systems over a period of 13 months, with each driver permanently assigned to a truck, so that the observations regarding the behavior of vehicles pertained to the respective drivers. The system used was equipped with the following modules: a global positioning system (GPS), a driver identification card, a general packet radio service (GPRS) and a telemetry system. These modules allowed a set of variables linked to the driving habits of the drivers to be obtained, which were then converted into indicators based on economic, operational and safety criteria and submitted to DEA in four different scenarios, as shown in
Figure 3.
This step corresponded to the preparation and implementation of the EDR systems, including the definition of the study objective and the variables used as parameters for the analysis (
Table 1).
For the development of this stage, the structuring and implementation of monitoring phases was proposed based on the model applied in [
69], following parameters to allow the evaluation of natural driving habits and their evolution based on the variables collected and in accordance with the interventions proposed in the monitoring phases.
Hidden Monitoring (Hidden)—The objective of this phase was to evaluate the driving pattern of each driver without any type of intervention by researchers, managers or technology (e.g., over-revving alert). Thus, drivers did not accompany the process of installing the systems, and all sound signals and alerts were muted so that the system did not interact with them.
Conscious Monitoring 1 (C1)—In this phase, the EDR systems continued to monitor the driving pattern of the vehicles. However, all signals and alerts provided by the system were enabled and the technology began to interact with the drivers. In addition, drivers received specific training developed for this study related to knowledge of the use of the technology, safety aspects, operating efficiency and fuel savings that were based on the aspects contained in ISO 39001 and CSEAA [
70,
71]. In this specific phase, the managers began to analyze the data and disseminate regular information to drivers on their behavior. The objective of this phase was mainly to evaluate the impact on the variation of the data after enabling the alerts emitted by the EDR, and evaluate the results of the training procedure carried out by the managers [
72].
Conscious Monitoring 2 (C2)—In this phase, the data collection continued and the alerts were kept active, but there was no training or feedback offered by the managers. The objective of this step was to evaluate if the criteria related to economy, safety and operation would maintain the trend observed in C1, or if they would return to the levels observed in the Hidden Monitoring phase. During this phase, the intent was to evaluate the impacts related to the isolated use of the technology and compare them with the applications with associated training and feedback.
Conscious Monitoring 3 (C3)—Based on the analysis of the data obtained in the previous phases, the alerts issued by the system were maintained and the procedure involving continuous training and periodic feedback was incorporated into the fleet management process as a way of maintaining the improvement process.
For this stage, a training procedure for drivers and managers was developed and applied that was aimed at improving skills and attitudes in relation to economic, safety and operational criteria, based on the studies of [
73,
74,
75,
76,
77]. Thus, the training procedure focused on aspects related to four areas: operational safety, knowledge of the use of technologies, practical application of skills and perception of aspects of fatigue and stress. All the drivers went through all the 30-h training sessions. Associated with the training procedure during C1 and C3, the drivers began to receive feedback from the fleet managers at the end of each trip with the aim of increasing operational efficiency, mainly in relation to economy and safety [
78,
79].
According to [
80], investment in systematic developments for road safety such as training and control can improve profitability. Thus, the basis for the training process was structured in accordance with the requirements established by ISO 39001 [
70,
74] and CSEAA [
71], oriented mainly towards the evaluation of aspects related to safety.
For the analysis of data using the DEA method, we chose to use the BCC model because it considers the production scales in the efficiency calculation, which allows the technical efficiency of the vehicles (DMUs) to be identified. This is important, since the objective is to analyze the driving habits in consideration of the interventions made in the monitoring phases. In this way, the orientation to results became more adequate, since the objective was to maximize the results obtained based on the indicators related to safety and operational criteria (outputs).
The behavior of the DMUs was analyzed based on standard, inverted, composite and standardized composite efficiency indices in order to increase the discrimination of the DMUs located in the efficiency frontier. However, the results presented here are based on the composite values, since their calculation considers the standard and inverted efficiencies. The graphical analysis of Composite allowed us to observe the behavior of the average efficiency rates of the best and worst management practices (standard and inverted efficiency) of each vehicle.
To assess the effect of the interventions, the analysis focused on statistical variations in driving behavior based on the indicators described in
Table 2.
For the safety criterion, the indicators considered were the number of speeding events and the percentage of speeding time. The first of these was the number of times the maximum speed set was exceeded for more than 3 s. This indicator shows the driver’s acceptance of the speed limits imposed by legislation and/or by the company. The second indicator referred to the percentage of driving time above the speed limit, and was represented by the total driving time above the speed limits divided by the time the vehicle was moving. This indicator represents the exposure to the risk of driving too fast.
For the evaluation of the economic criterion, an analysis of the variation of fuel consumption was considered with the weight, route and driver characteristics maintained.
For the operational criterion, the indicator of percentage time in the economy range was considered in relation to the total time that the engine remained in operation. The economy range is determined by the manufacturer and aims to inform the driver about the most efficient mode of operation. Operation in this zone allows power and torque optimization, and hence fuel consumption optimization.
A second analysis was also proposed based on the results obtained from the data processing through the DEA method and the scenarios involving these criteria. The analysis was subdivided into individualized analyses, which included the behavior of each vehicle and a global analysis, which included the response of the fleet according to the criteria of safety, operation and economy. From the analysis of the indicators, it was possible to understand their influence, as well as to define their relevance when performing an analysis that integrated all the criteria.
The analysis focused on the structuring of four scenarios based on the composite values calculated with the DEA tool. The comparative scenarios included all the criteria under investigation (economic, operational and safety), as presented in
Table 3.
The development and analysis of the four scenarios made it possible to verify the variations in the relative efficiency indices of the DMUs based on a global analysis of the criteria (Scenario 1) and a paired analysis (Scenarios 2–4). Based on the analyses of all scenarios, we decided to use Scenario 1, since it covered all three criteria, making it possible to establish an overall view of the indicators and their correlation.
5. Results
The analyses proposed in this paper focus on verifying the variations in behavior of the indicators according to the interventions applied throughout the monitoring phases. It is important to note that the hidden monitoring phase was determined as a comparative reference, since there was no external intervention in this phase, allowing us to infer that the data collected by the EDR system represented the natural driving behavior. At the end of this monitoring period, three conscious monitoring phases (C1–3) were initiated in which all audio and visual signals emitted by the system were enabled. In C1 and C3, all drivers underwent the training procedure, and began receiving feedback from managers at the end of each trip based on an analysis of data collected by the system. These actions ensured that all participants were aligned with the objectives of the training procedure and the implementation of the technology.
The only difference in the phases of conscious monitoring was that in C2 there was an interruption in the training procedure to assess whether there was any variation in behavior due to the isolated use of the technology. This revealed whether the training procedure and feedback had improved the results.
5.1. Analysis of Indicators Based on Individual and Aggregated Driving Behavior Patterns
The analysis of the indicators made it possible to evaluate the behavior of the drivers according to the criteria of safety, operation and economy throughout the monitoring phases. However, it was also possible to make a general analysis of the fleet.
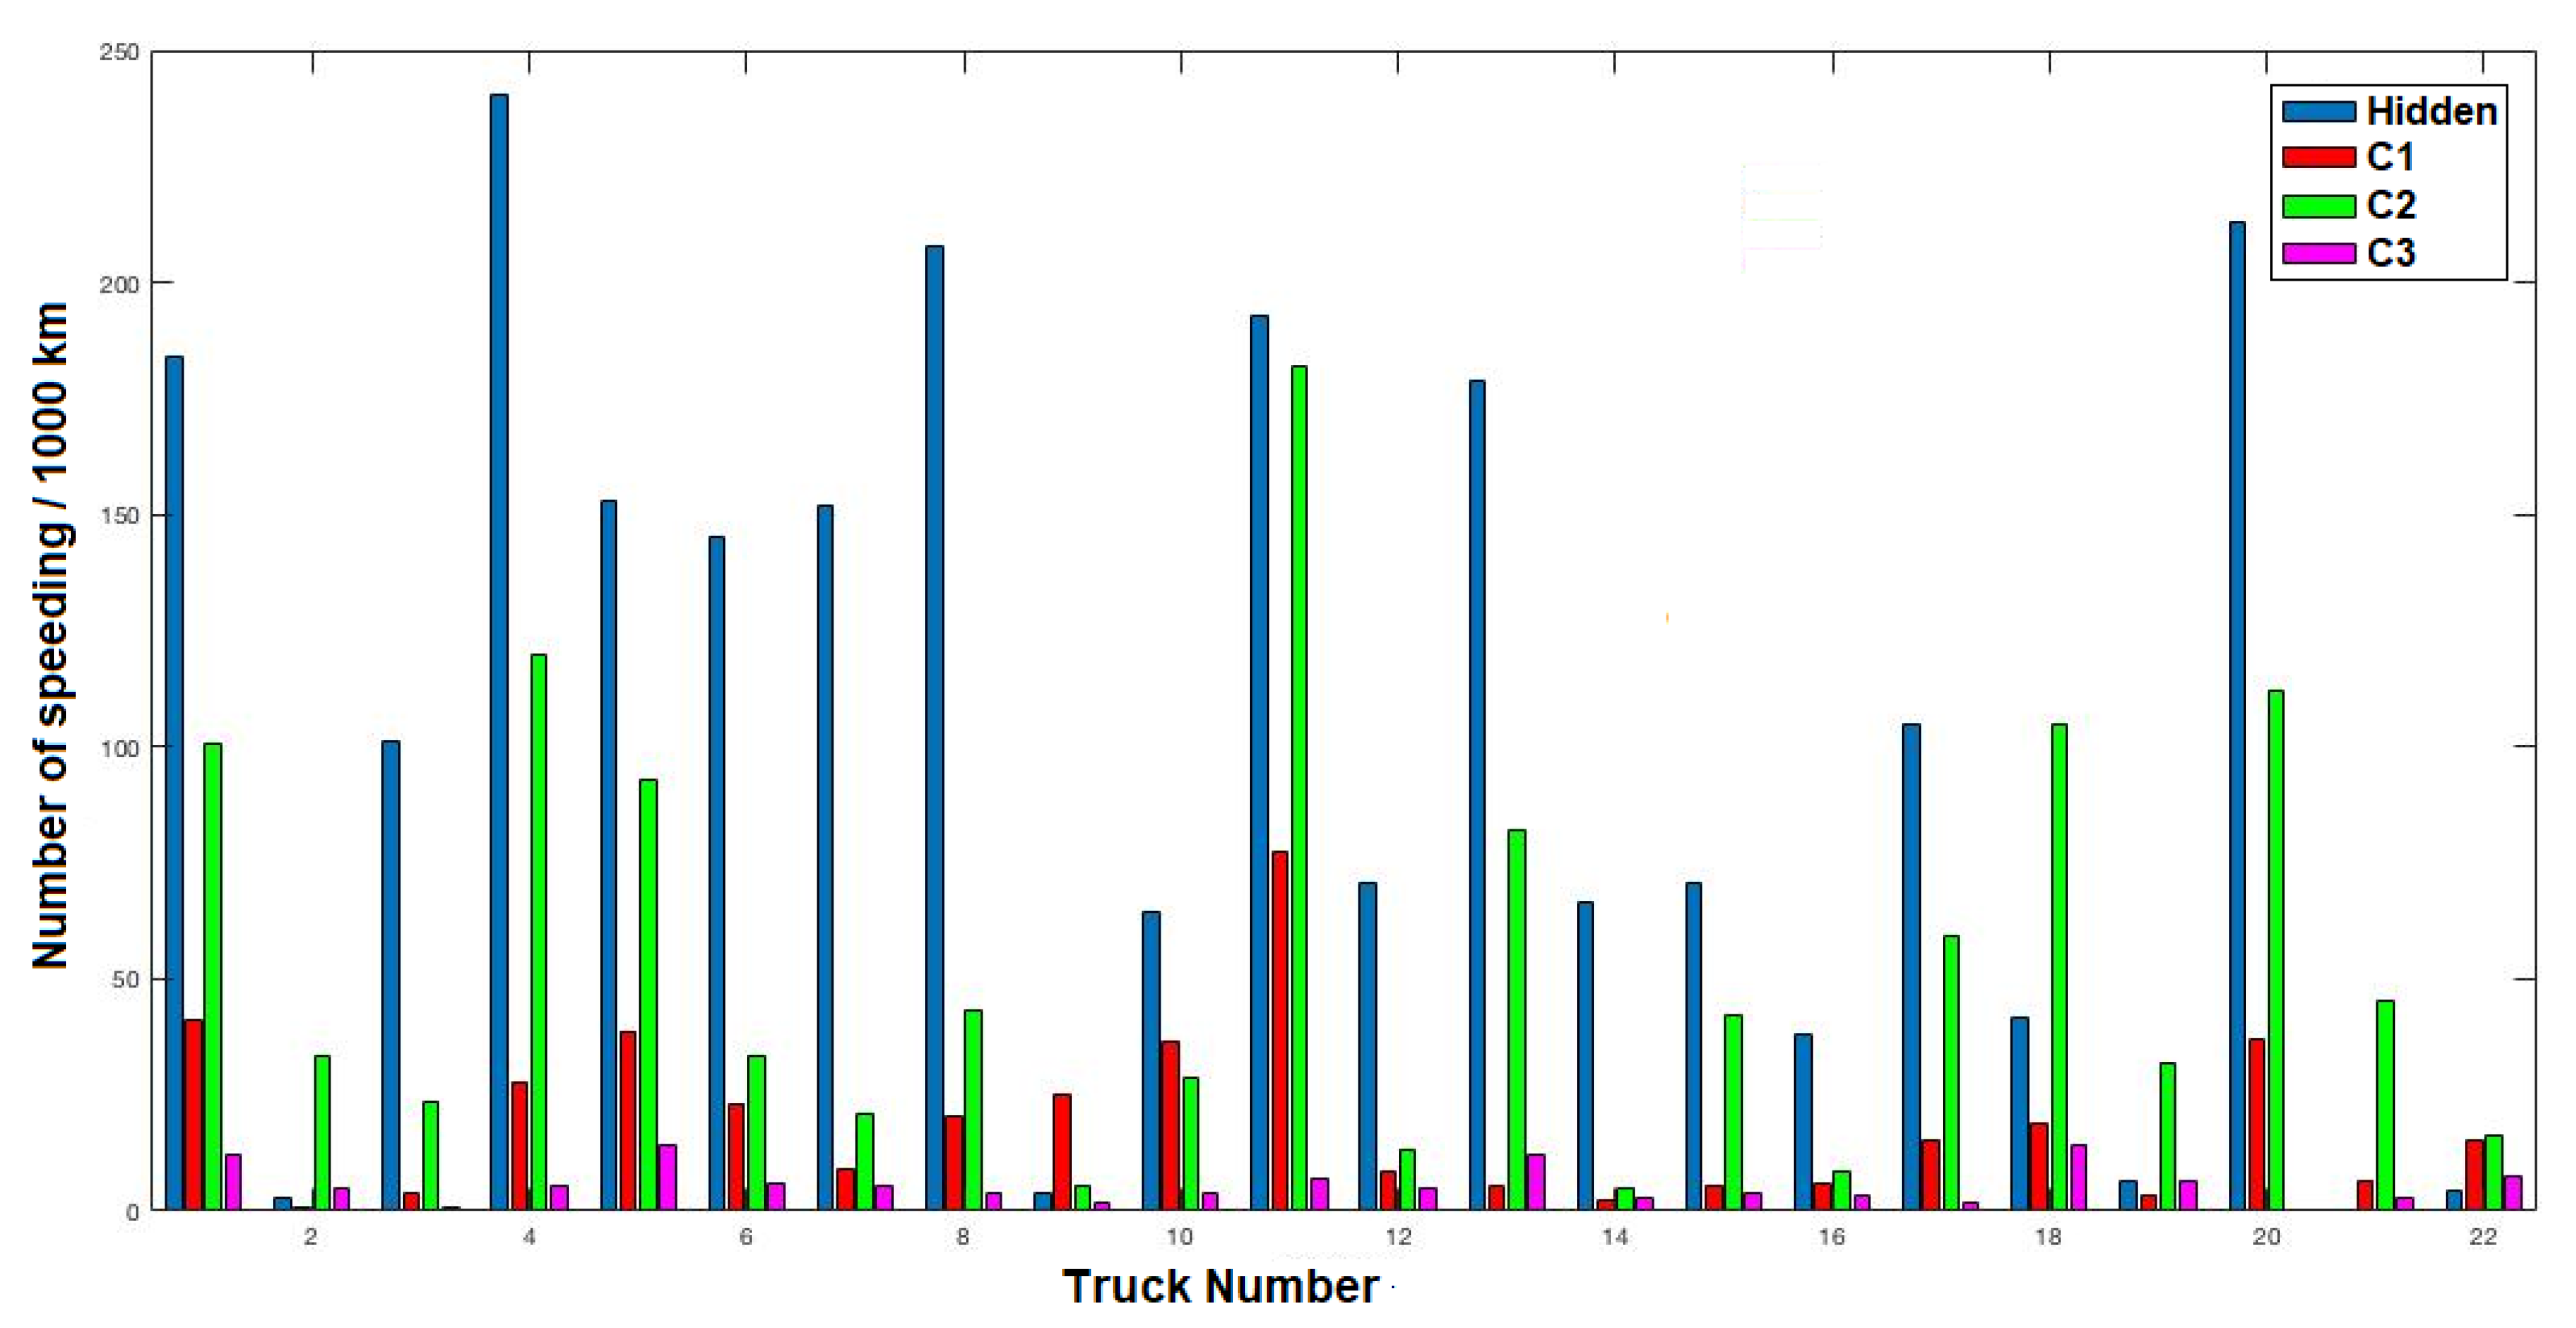
Regarding the safety criterion,
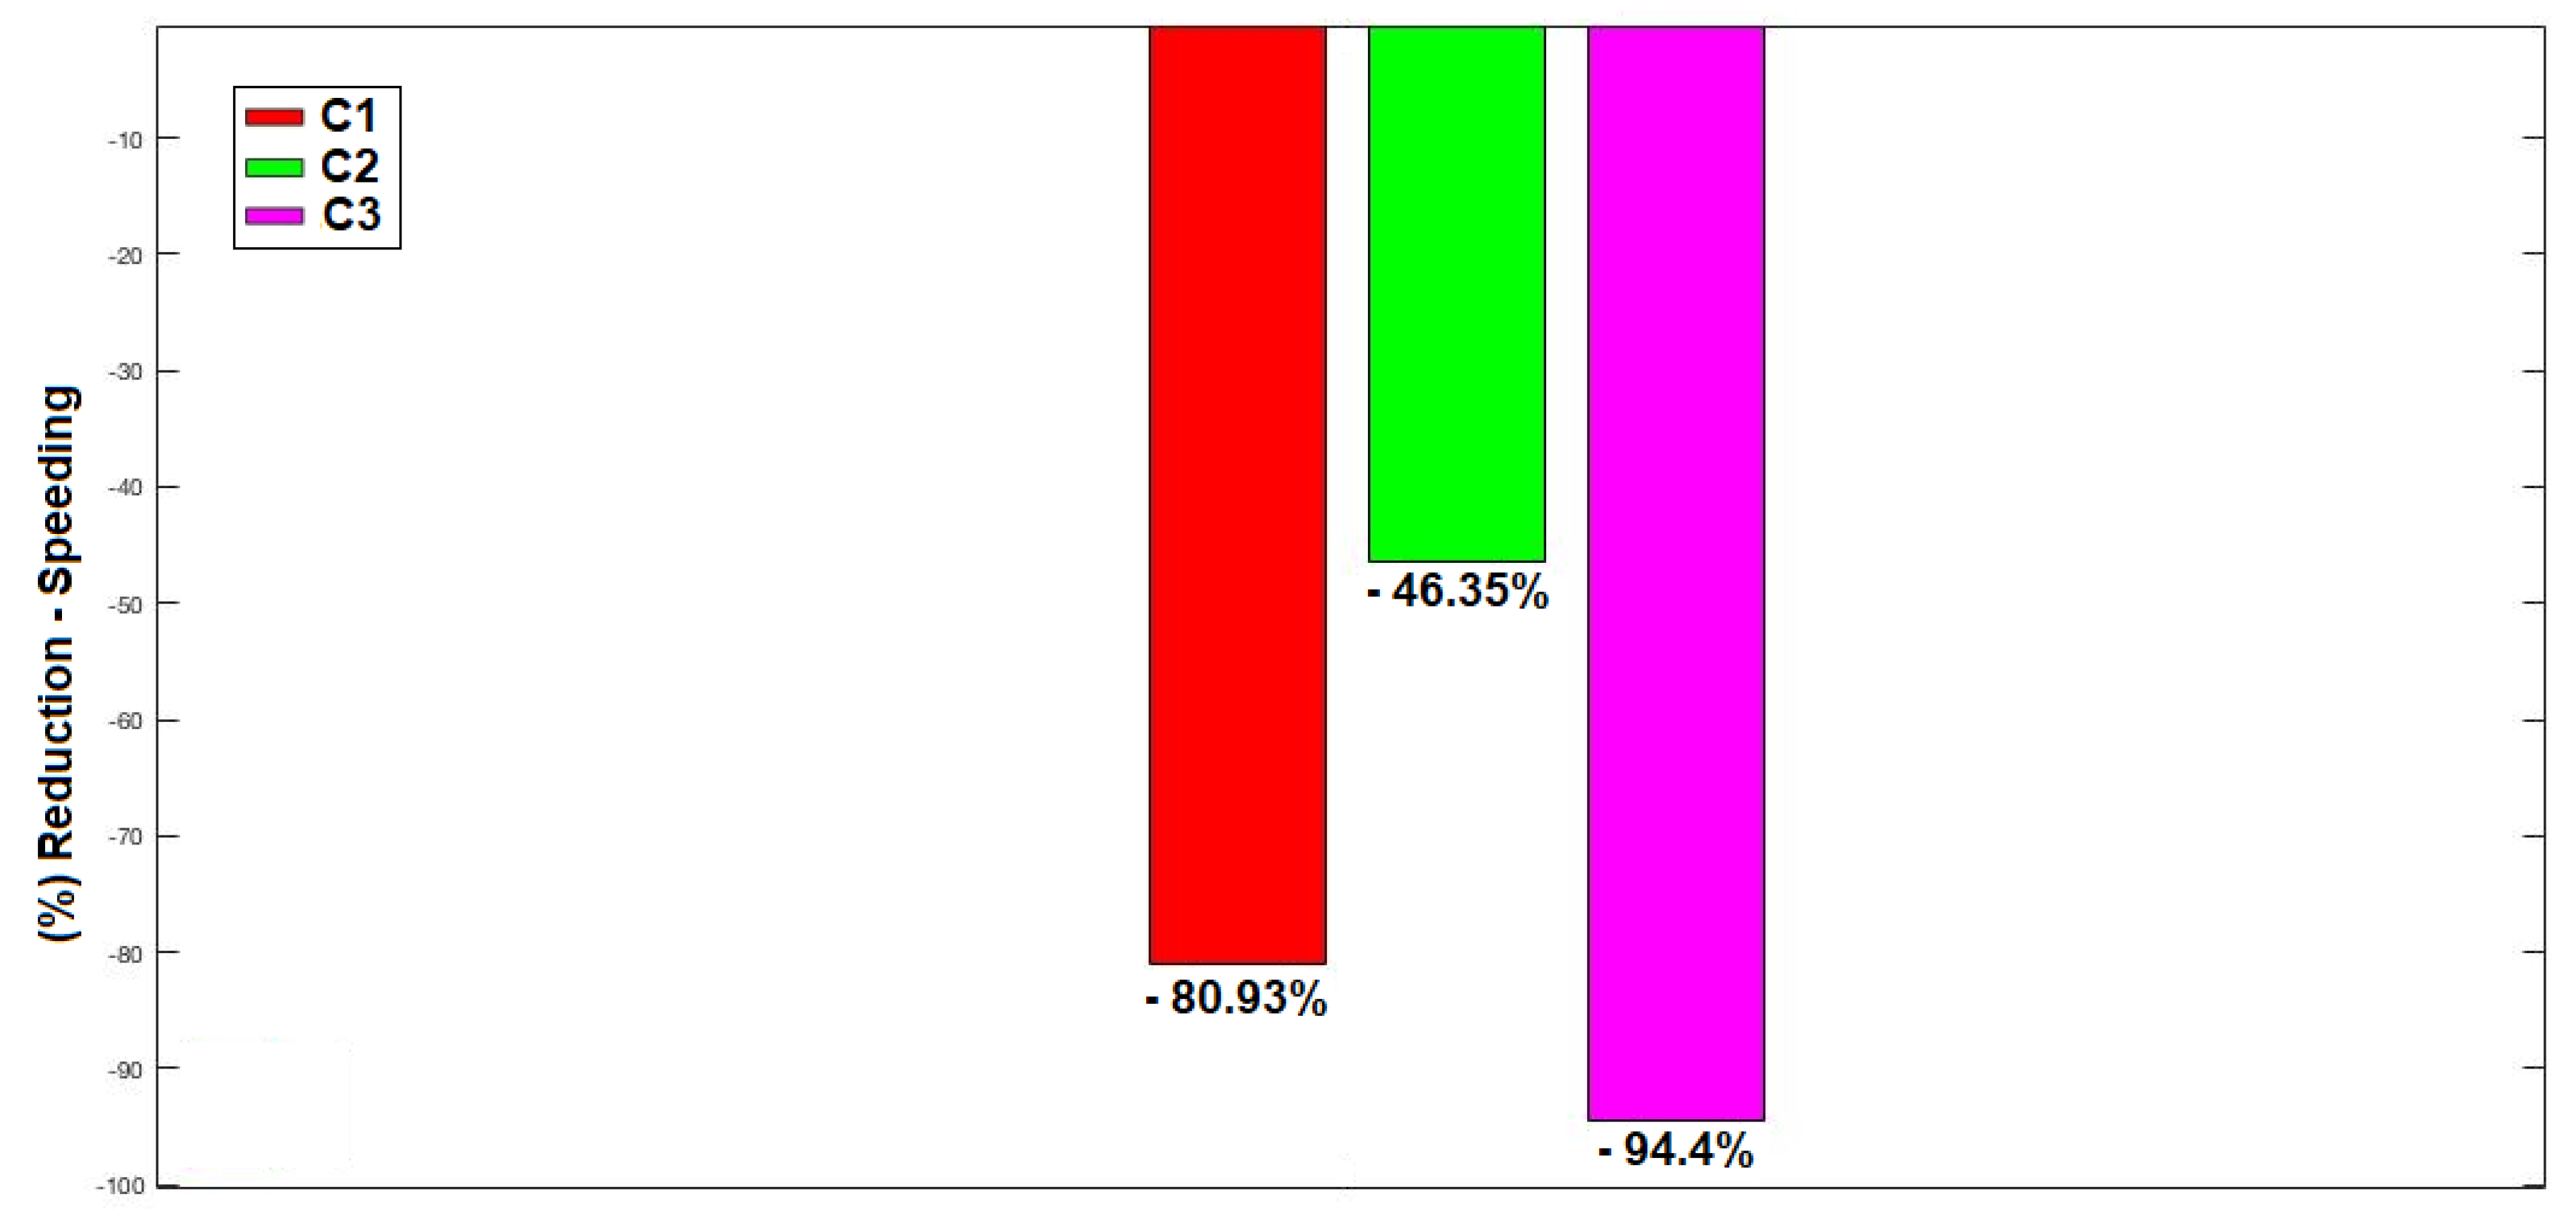
Figure 4 shows the variation in the behavior of the vehicles in relation to the monitoring phases. It can be seen that only three vehicles performed worse than during the hidden monitoring; that is, 86.4% of the vehicles observed showed improvement in this indicator. In particular, the number of speeding events in the fleet went from 2243 events per 1000 km traveled during the hidden monitoring to 126 events per 1000 km traveled during C3, which is a significant reduction in the level of risk acceptance.
Figure 5 presents the global percentage variation of this indicator in the conscious monitoring phases in relation to the hidden monitoring phase.
Another important conclusion about this indicator concerns the comparison between the conscious monitoring phases, where 95.5% of the vehicles performed worse during C2 than during C1 or C3. This supports the hypothesis that this training procedure and feedback on driver behavior are effective.
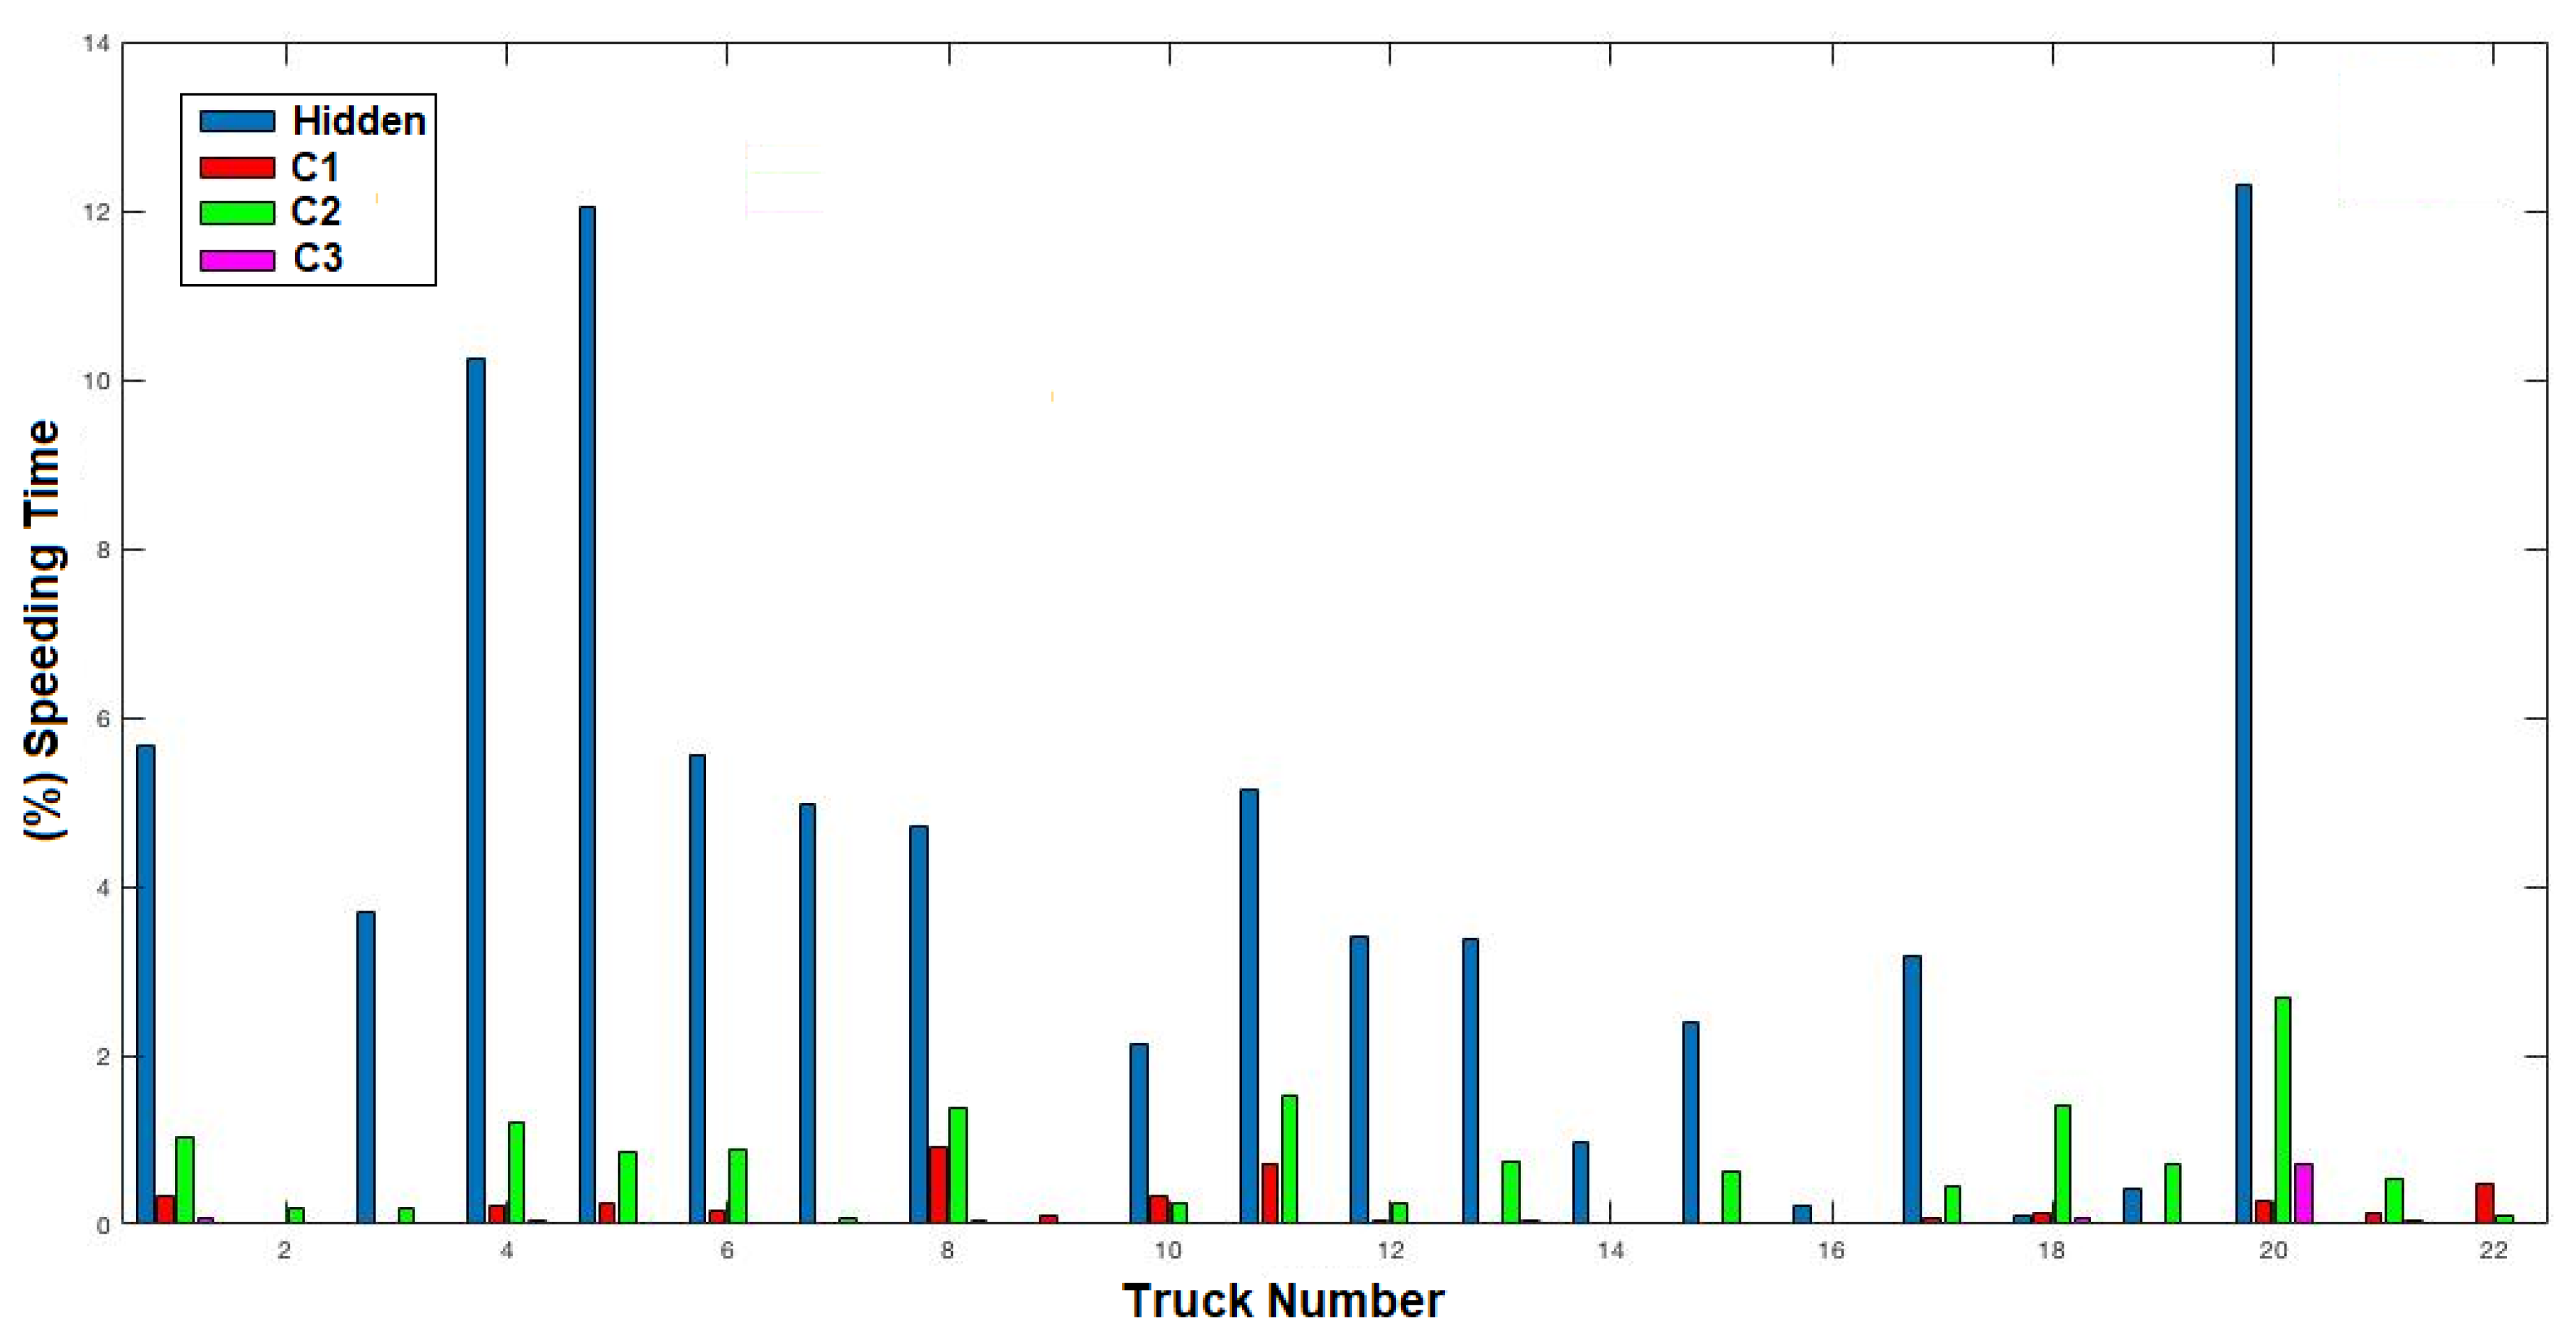
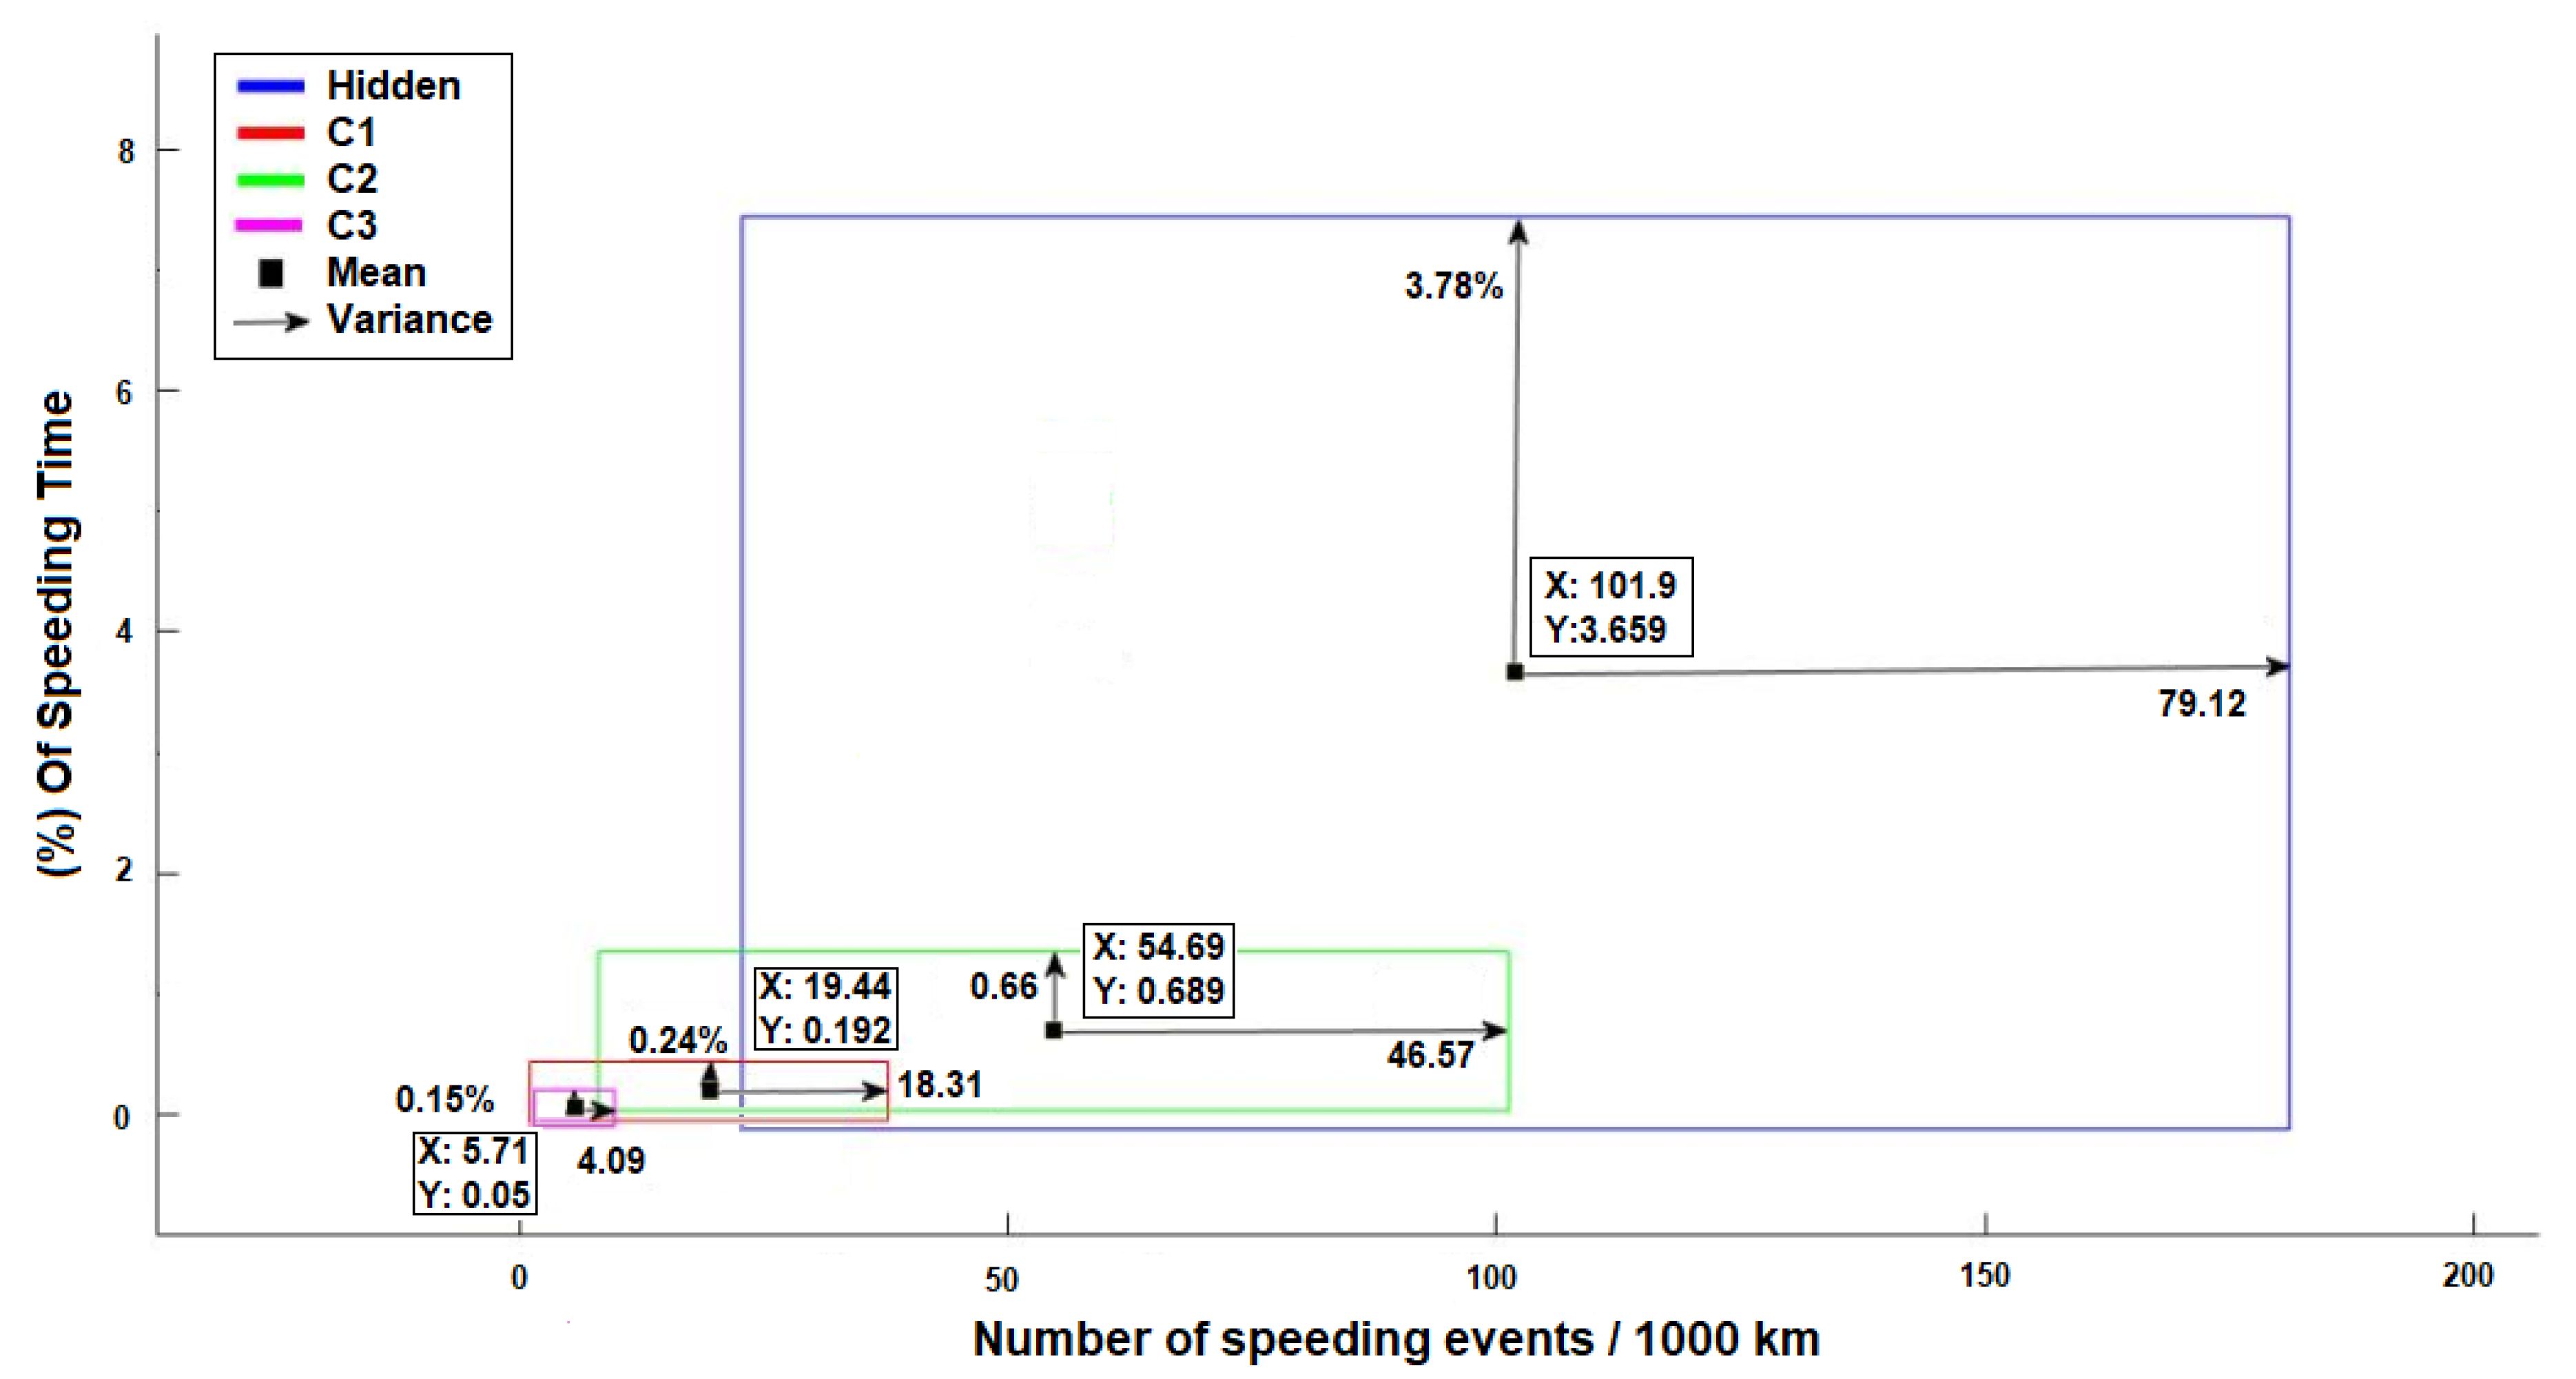
Furthermore, in relation to the safety criterion, the indicator concerning the percentage of speeding time as a function of total driving time was analyzed.
Figure 6 shows the individual behaviors of the vehicles, and it is possible to perceive a reduction in risk exposure by reducing the driving time above the speed limit during the monitoring phases, representing an increase in safety and a significant reduction in the risk of accidents. During the hidden monitoring, the vehicles remained above the speed limit on average 3.6% of the total driving time. Based on the average speed and distance traveled, this means vehicles traveled above the speed limit for 5838 s on average per month. The interventions applied reduced the speeding time to 0.05% of the total driving time, which is equivalent to driving above the limit for 83 s on average per month.
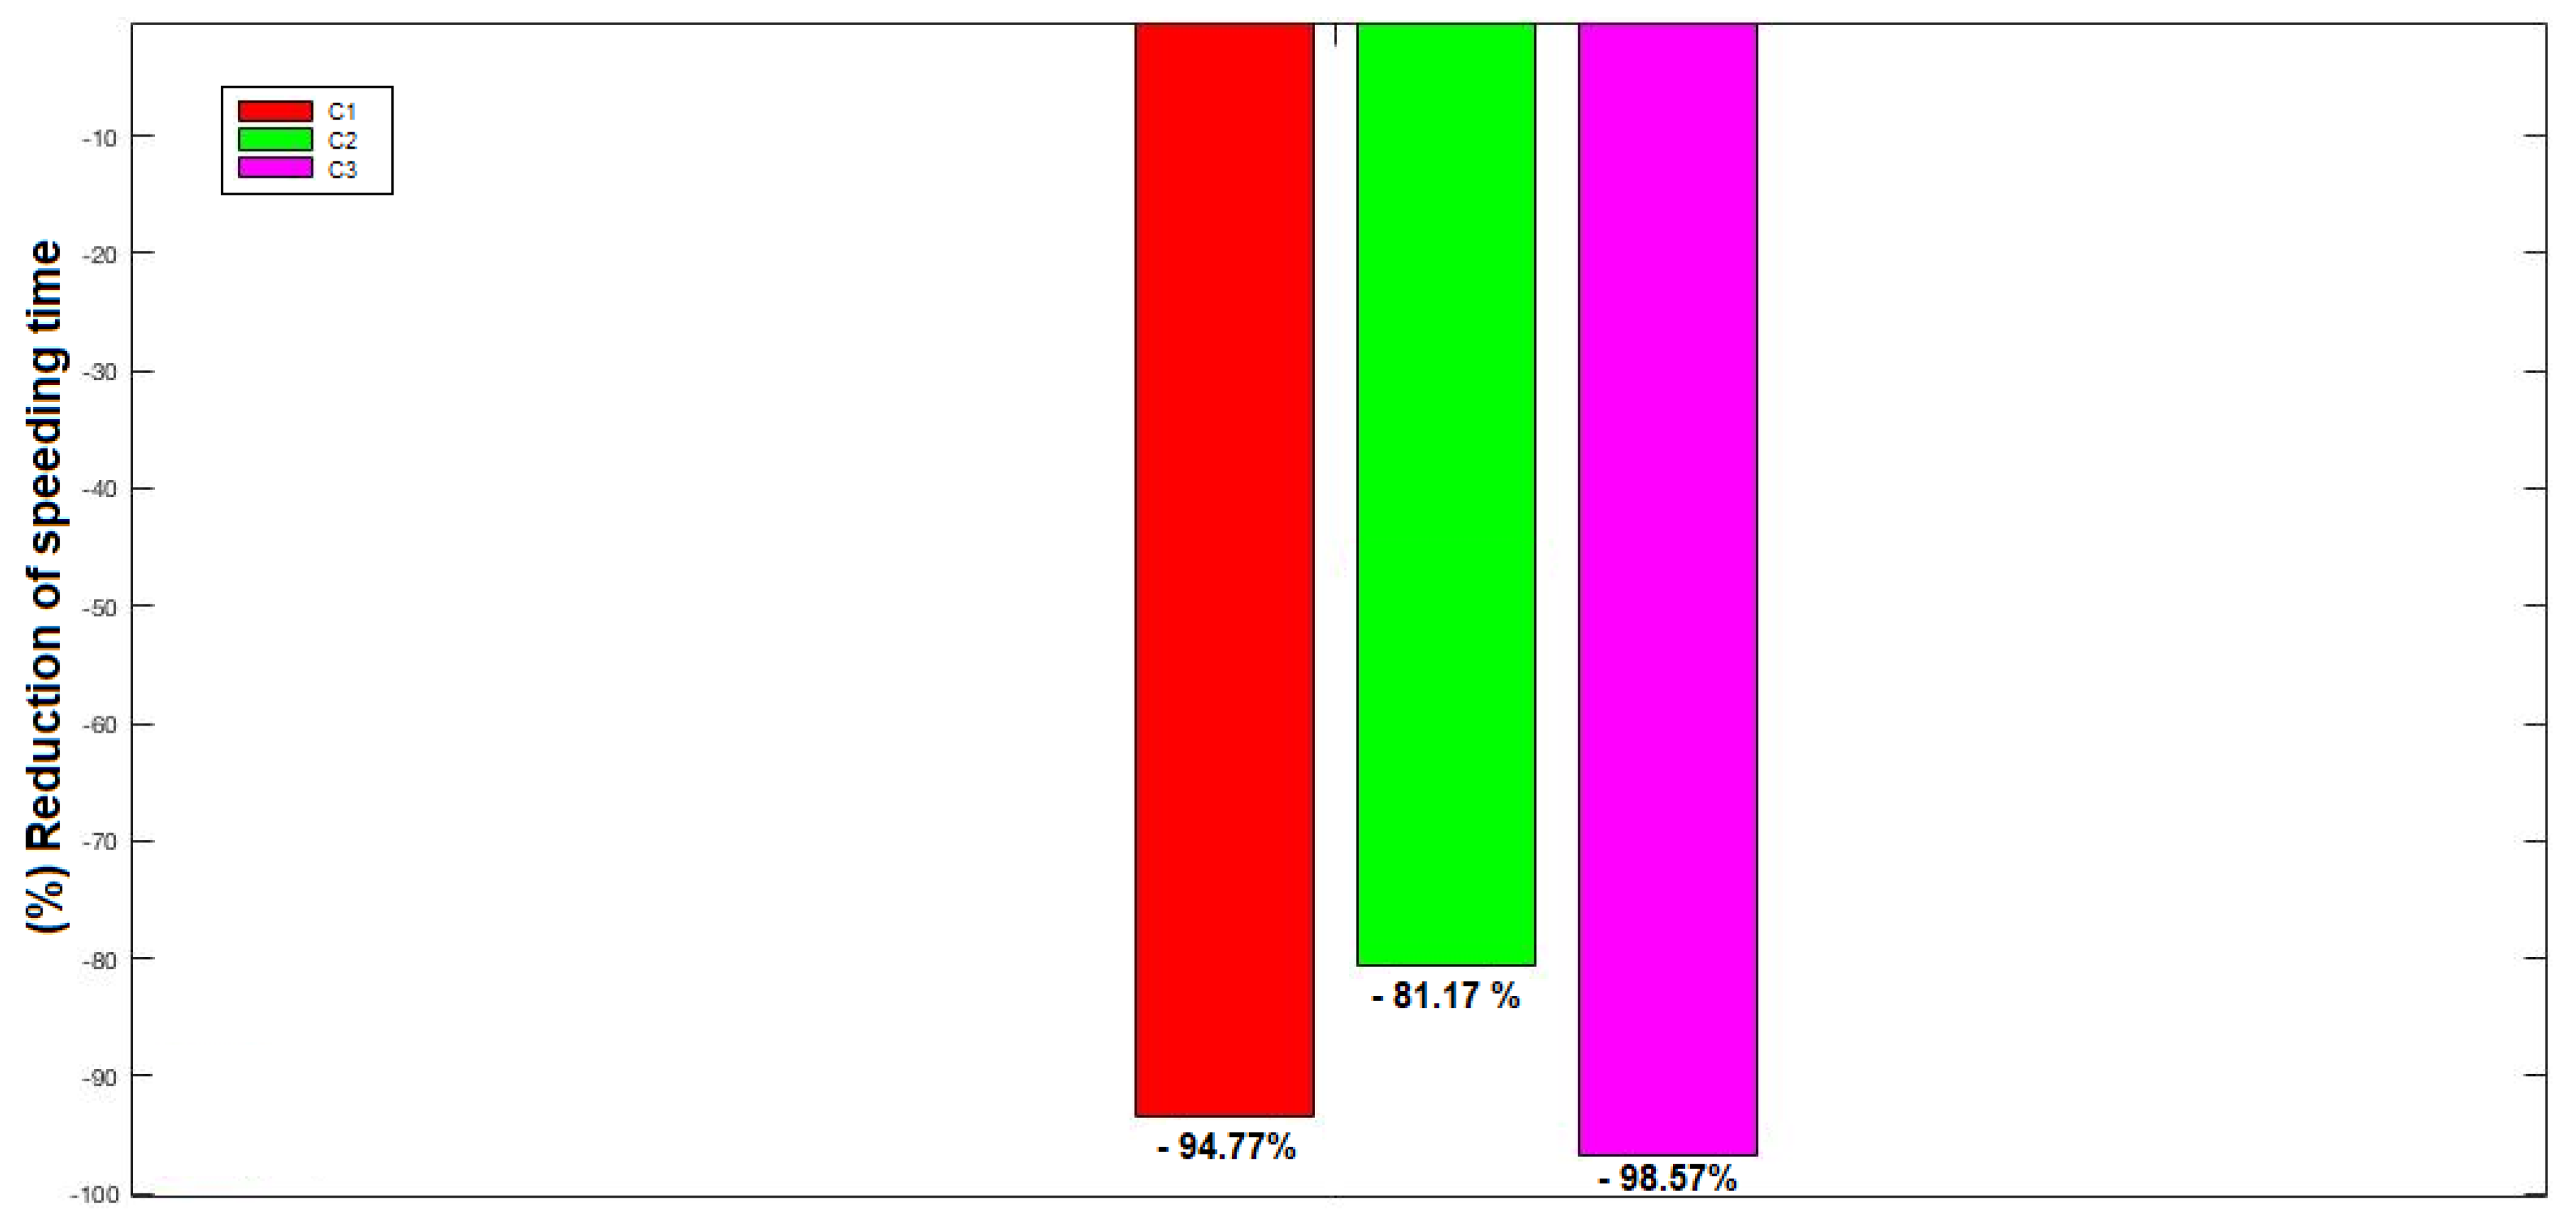
Figure 7 shows a comparison of the reduction percentages obtained during the conscious monitoring phases in relation to the data obtained in the hidden monitoring phase.
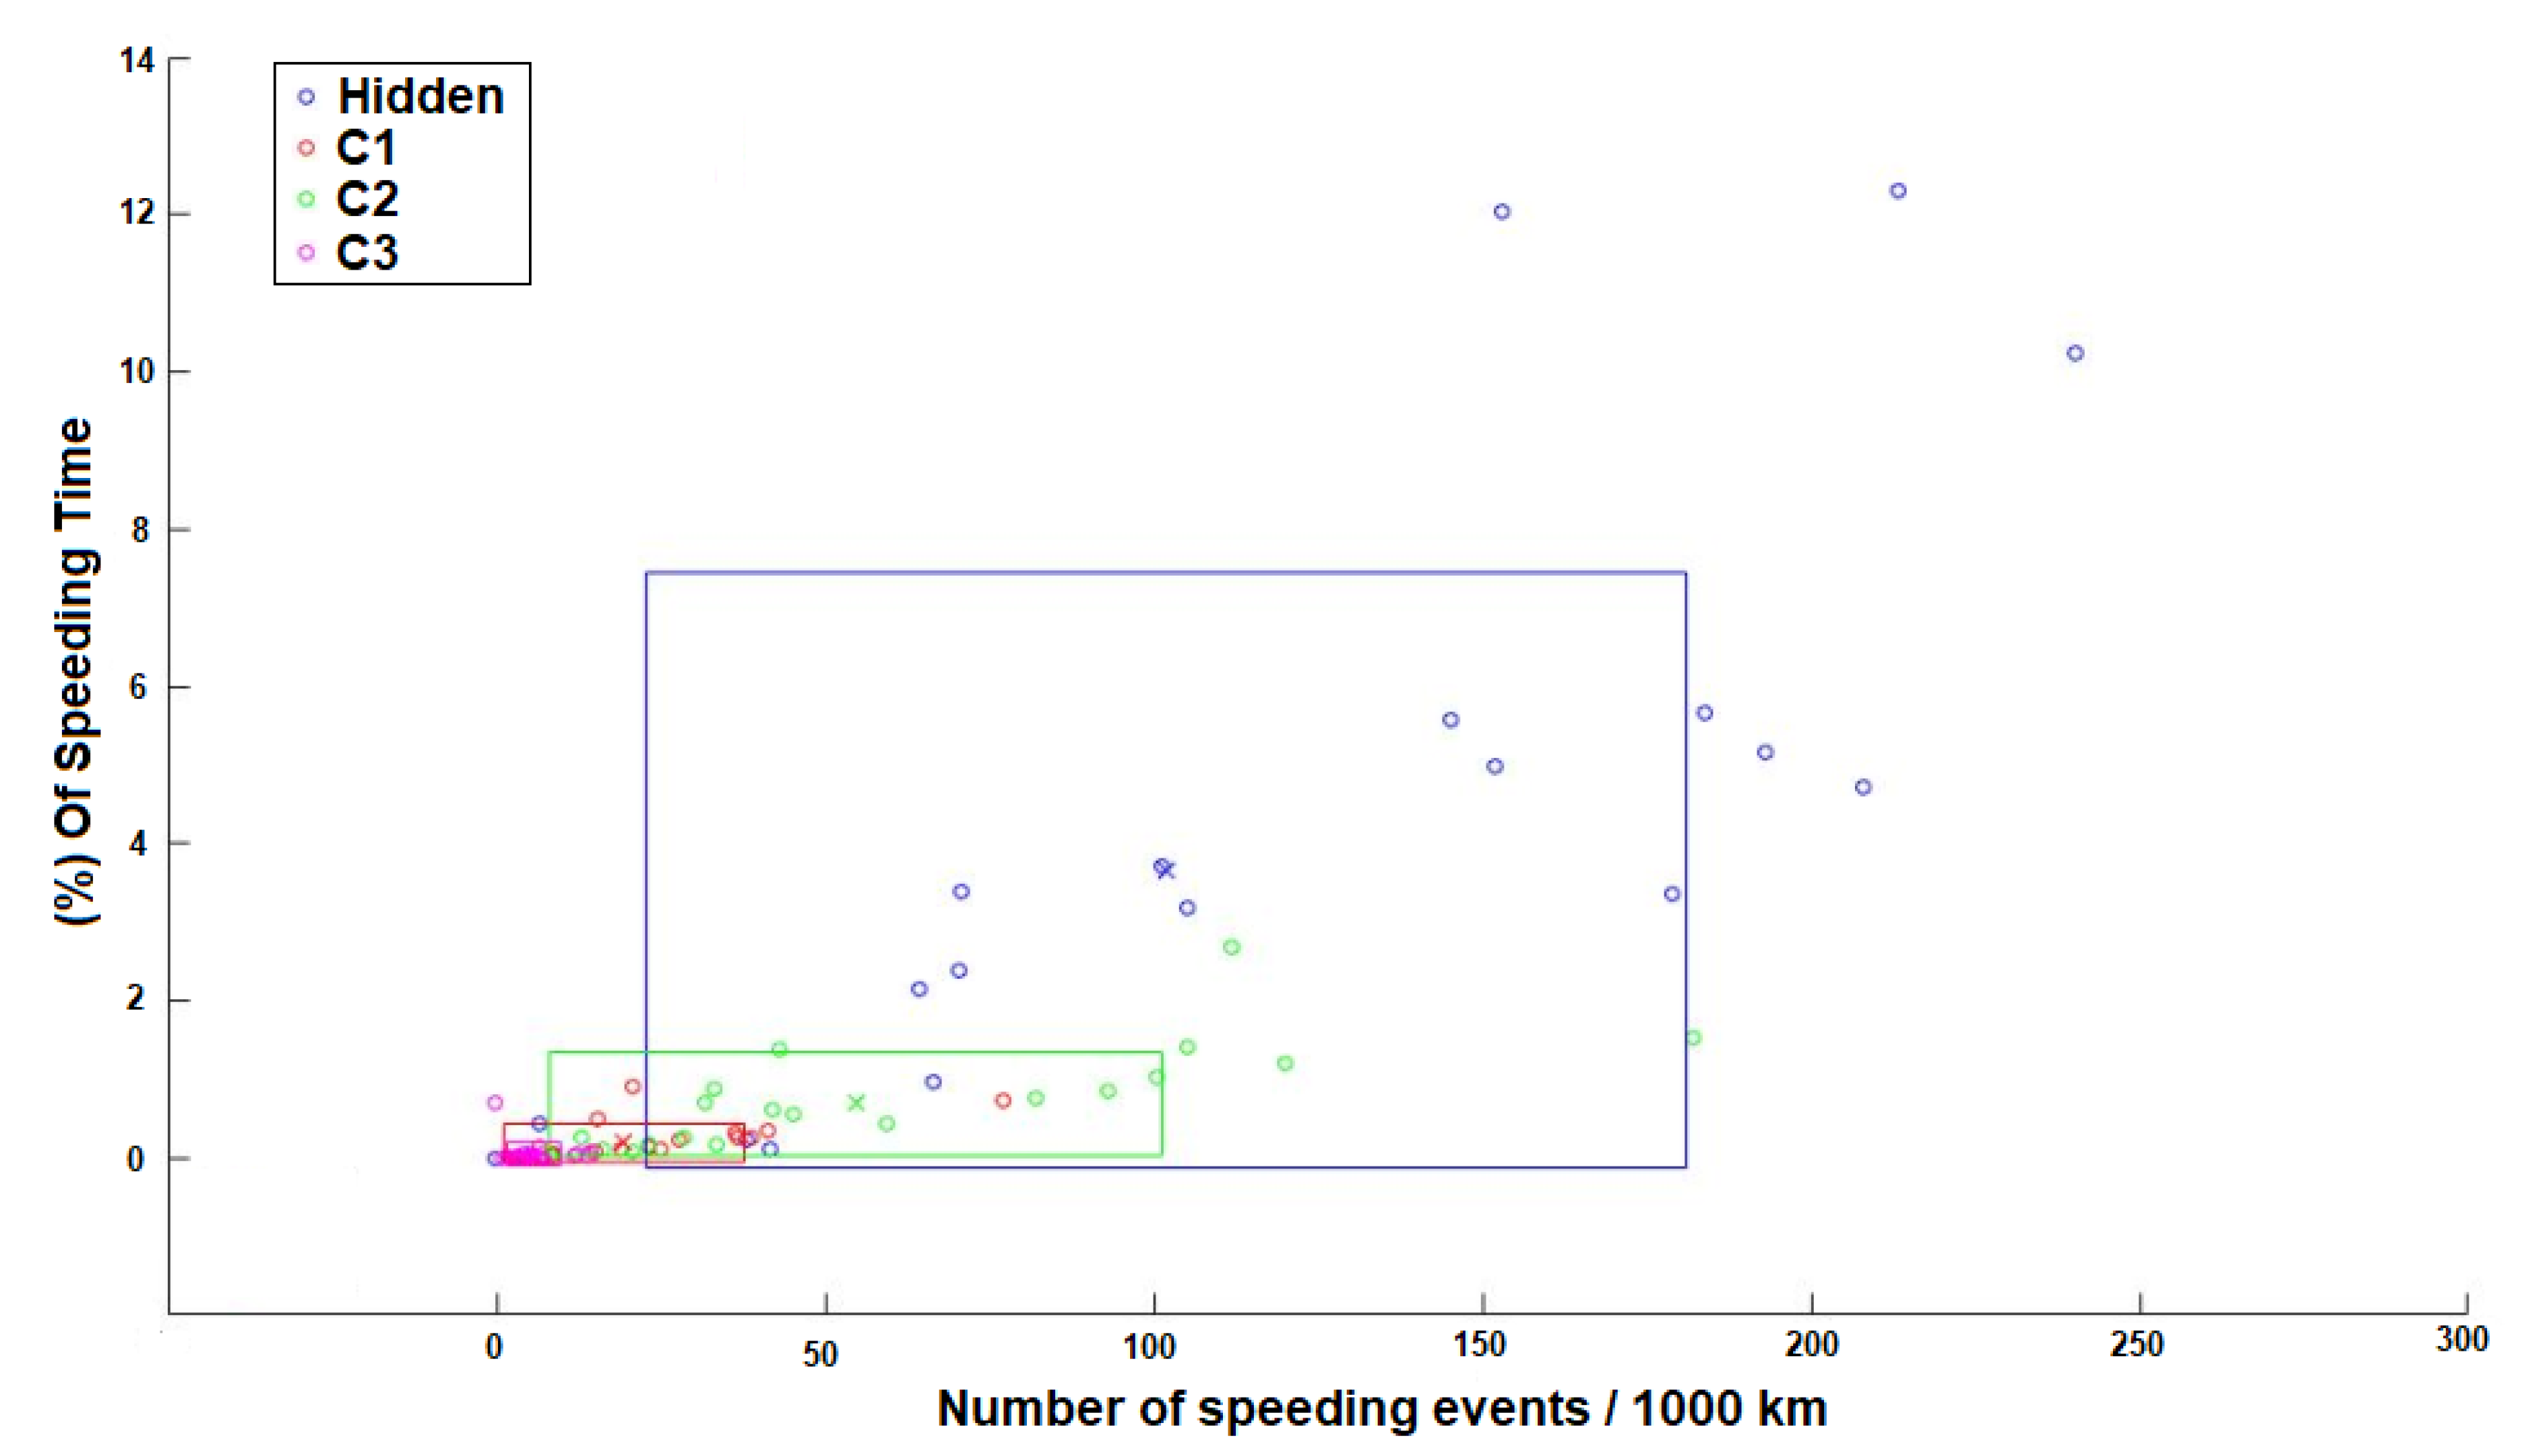
Through more extensive analysis of the criterion, we sought to relate driving behavior based on the dispersion of the points obtained in the two indicators, and it was possible to evaluate the evolution of driver behavior in relation to safety, as shown in
Figure 8 and
Figure 9. These figures ratify the trend of a reduction of the indicators and consequent standardization of behavior as a function of the monitoring phases based on the reduction of variance, dispersion and averages. These figures show that driving behavior was safer in the conscious monitoring phases than in the hidden monitoring phase, since both speed-related indicators declined. The best performance occurred during C1 andC3, where the training and feedback procedure was applied, and this reinforces the hypothesis that associated training, feedback and technologies produces better results than the isolated use of EDR systems.
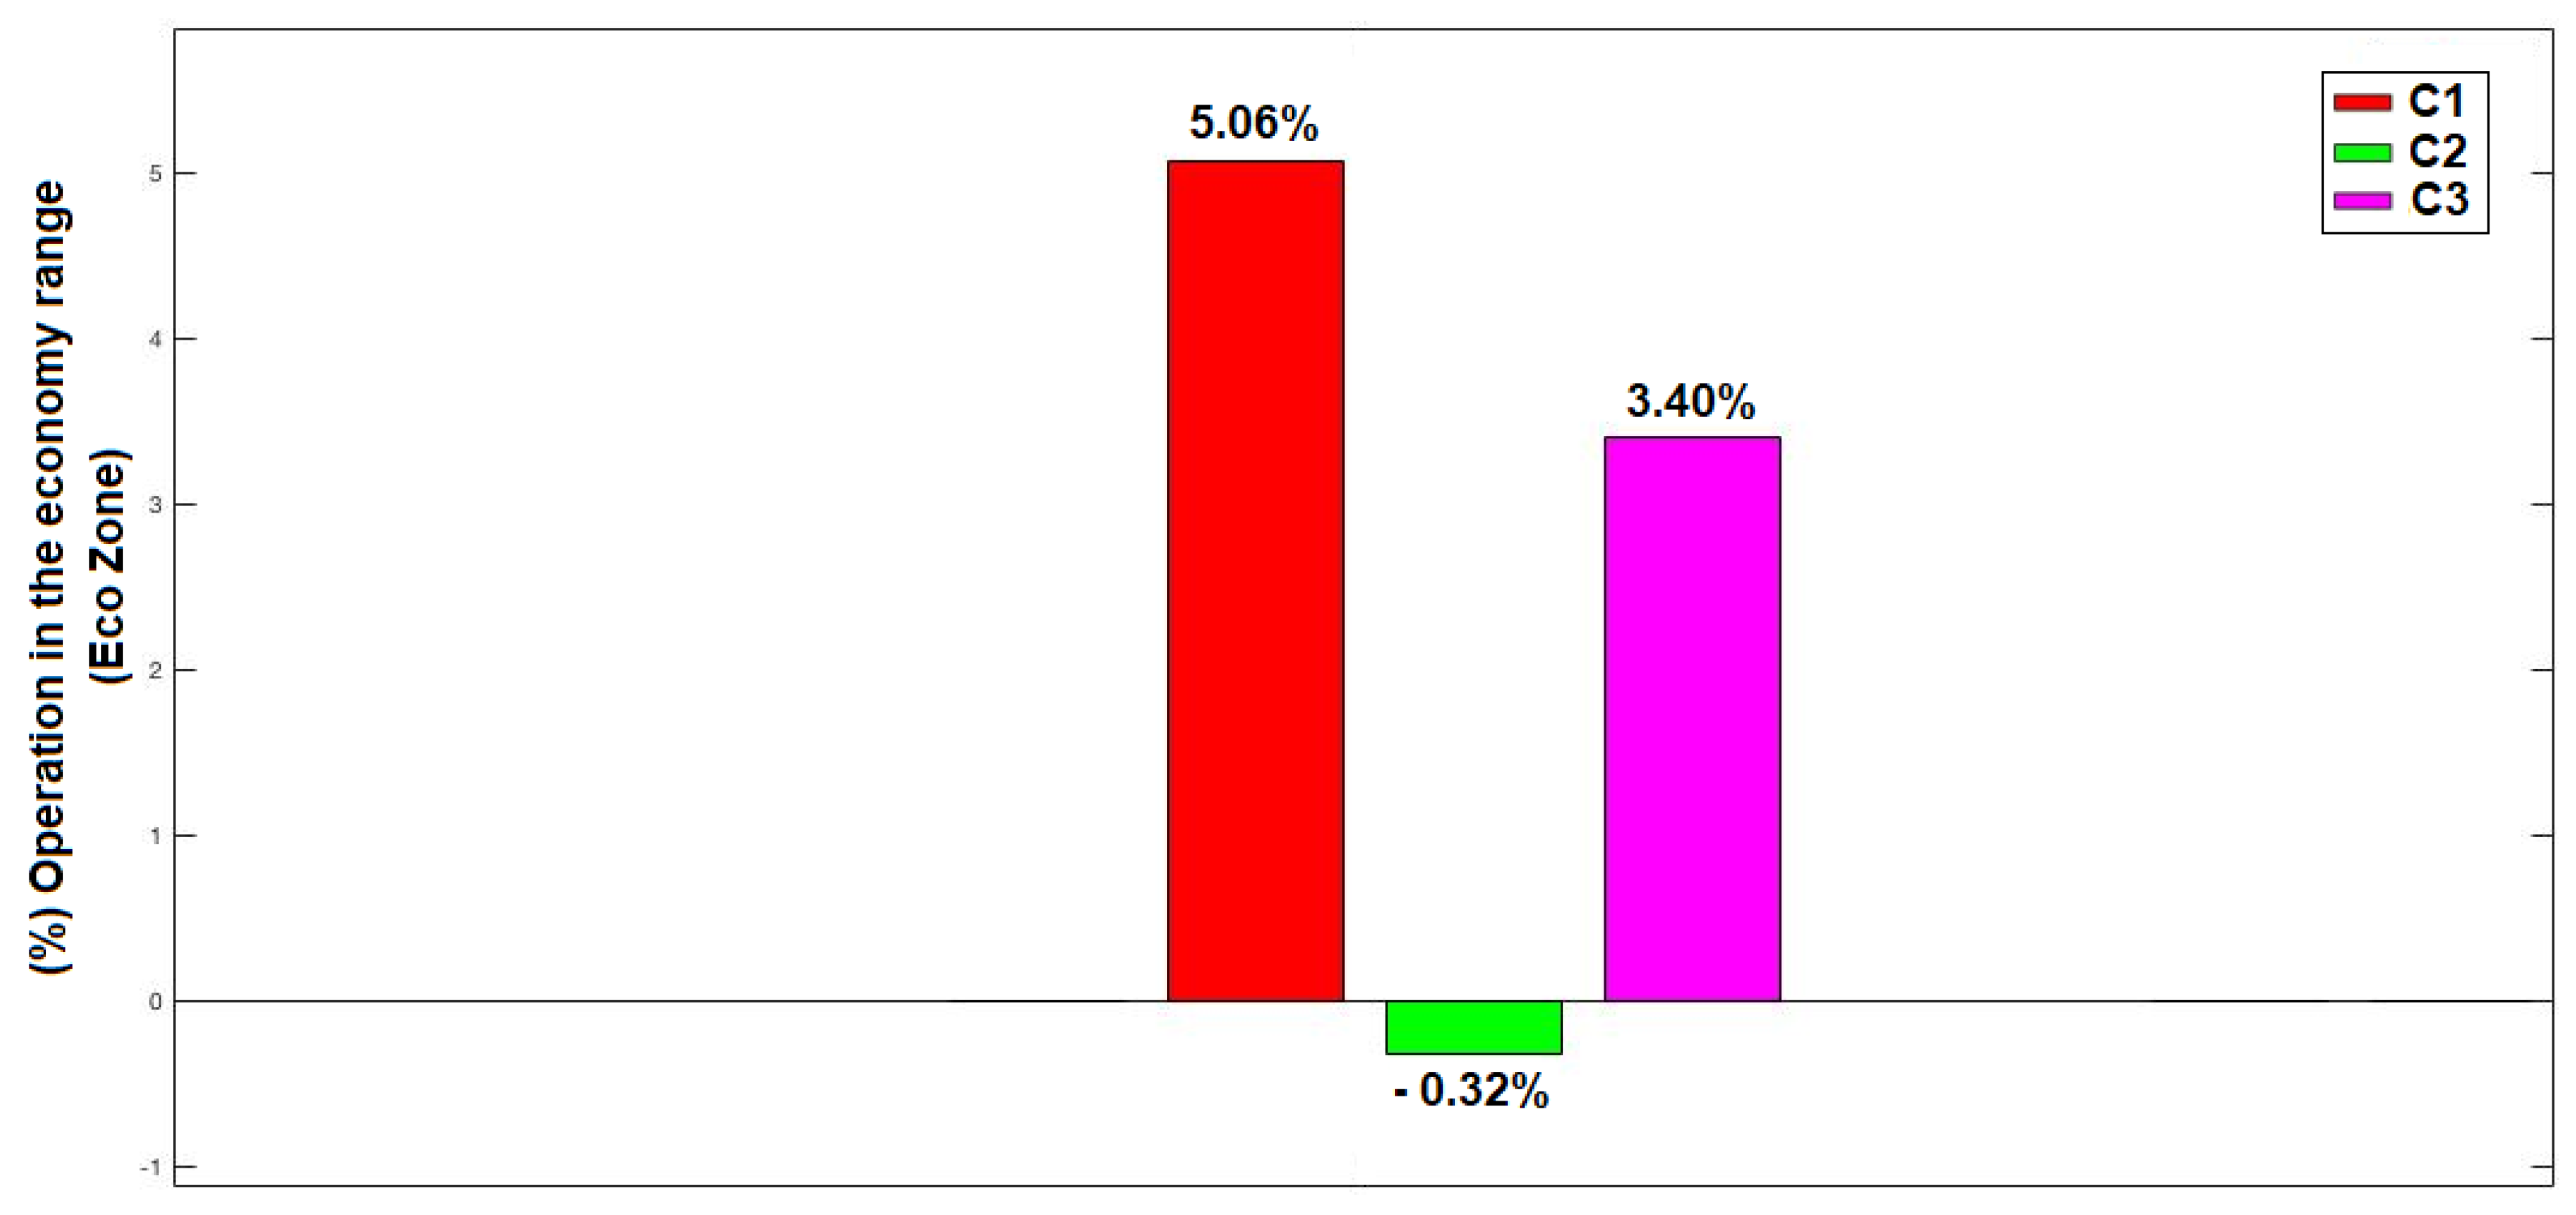
In relation to the operation criterion, the indicator of percentage of time in the economy zone was used, assuming that the higher the percentage of driving in this zone, the better the operational performance of the vehicle will be.
Figure 10 presents the behavior of the vehicles throughout the monitoring phases, showing that this indicator was more sensitive to the monitoring phases in which there were complementary training and monitoring actions. Ten vehicles showed better performances, six remained the same and six showed worse results than those observed during the hidden monitoring.
These results indicate improvements of 5.06% and 3.4% in the driving patterns of the vehicles in C1 and C3, respectively, compared to the hidden monitoring. Furthermore, during C2, there was a 0.32% worse result compared to the hidden monitoring, which can be explained by the absence of the training procedure and the provision of feedback, since the EDR system did not perform any real-time interaction with the driver such as audio warnings or visual alerts. It is important to highlight the relevance of the analysis of this indicator, since during C1 and C3, the vehicles were driven for 61.06% and 60.09% of the total moving time, respectively, in the most efficient engine operating zone. This means that in addition to a reduction in fuel consumption, a decrease in greenhouse gas emissions was also achieved, along with an increase in the maintenance of moving parts (e.g., the engine, transmission and tires).
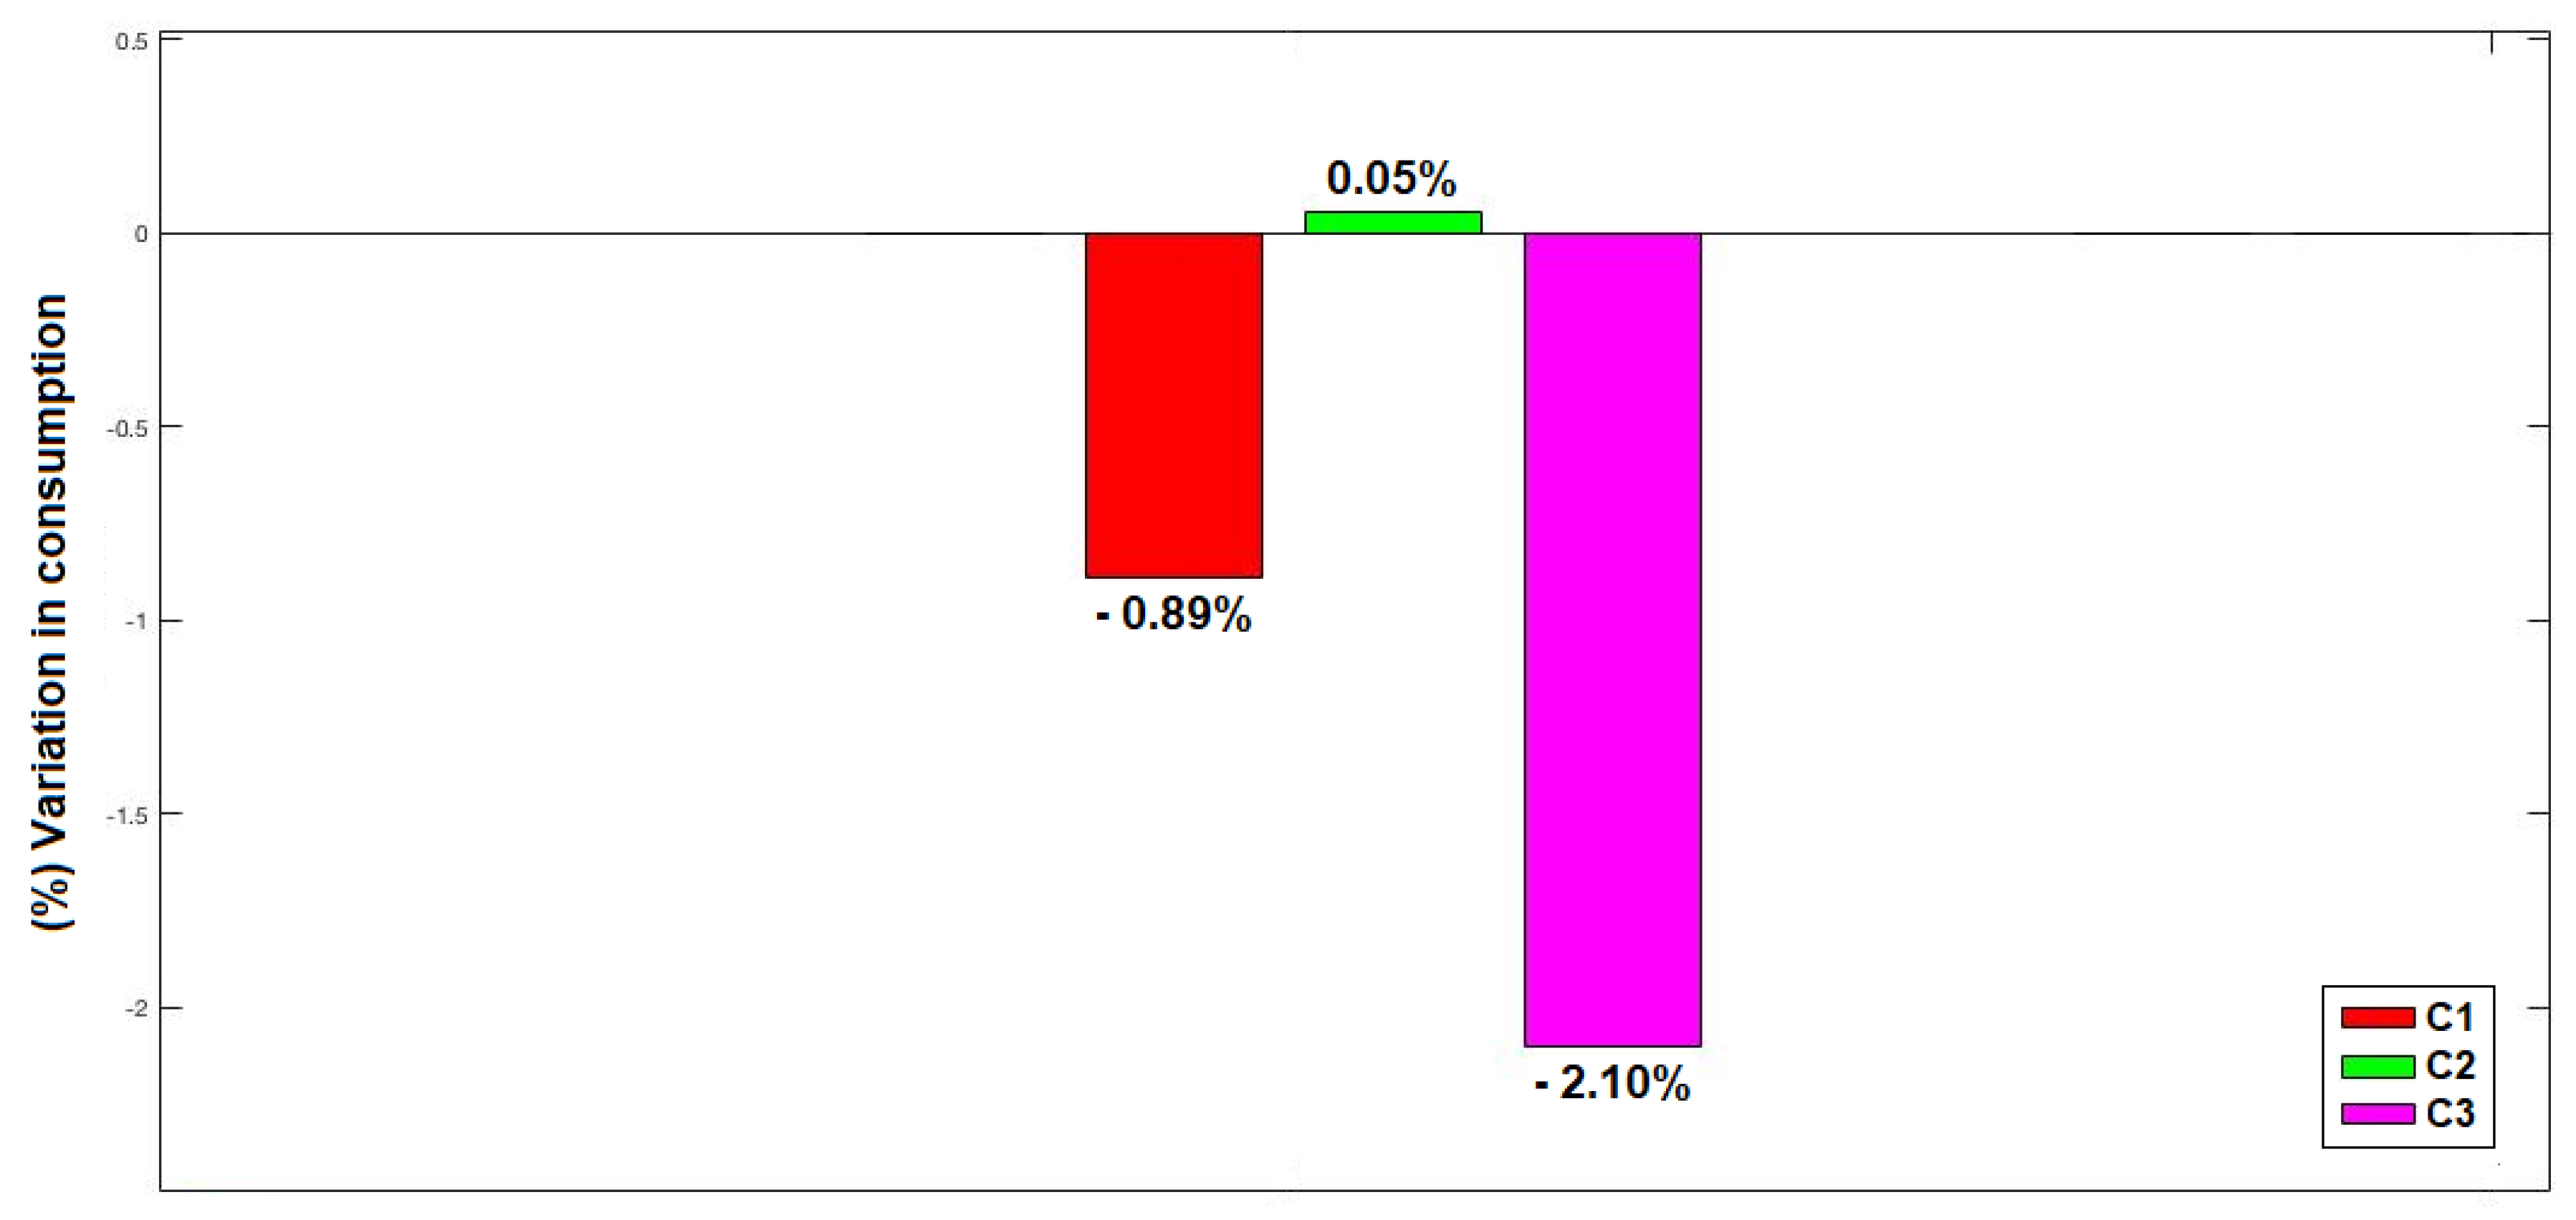
With regard to the economic criterion, only the fuel consumption indicator was analyzed, since variables such as weight carried, route and driver, among others, remained unchanged throughout the interventions, reducing the level of external factors linked to the variability of this indicator.
Regarding consumption behavior, throughout the monitoring phases, 59.1% of the vehicles showed a positive evolution and 22.7% remained practically stable, while 18.2% showed worse results. However, these latter vehicles were among those that presented higher consumption during the hidden monitoring.
Regarding an overall analysis of fuel consumption (
Figure 11), behavior was similar to that observed for the indicator of percentage of time spent driving in the economy zone. Furthermore, although the reduction percentage seems small, when converted into cost and consumption based on the results of the hidden monitoring, a monthly reduction of 345 L of fuel among the fleet (or 15.7 L per vehicle) was achieved for C1, while 811 L was saved among the fleet (or 36.9 L per vehicle) in the case of C3. The payback calculation reveals that the savings achieved during C3 could lead to an amortization of the investment in technology within approximately 36 months.
5.2. Data Envelopment Analysis (DEA) Applied to Safety, Operational and Economic Criteria
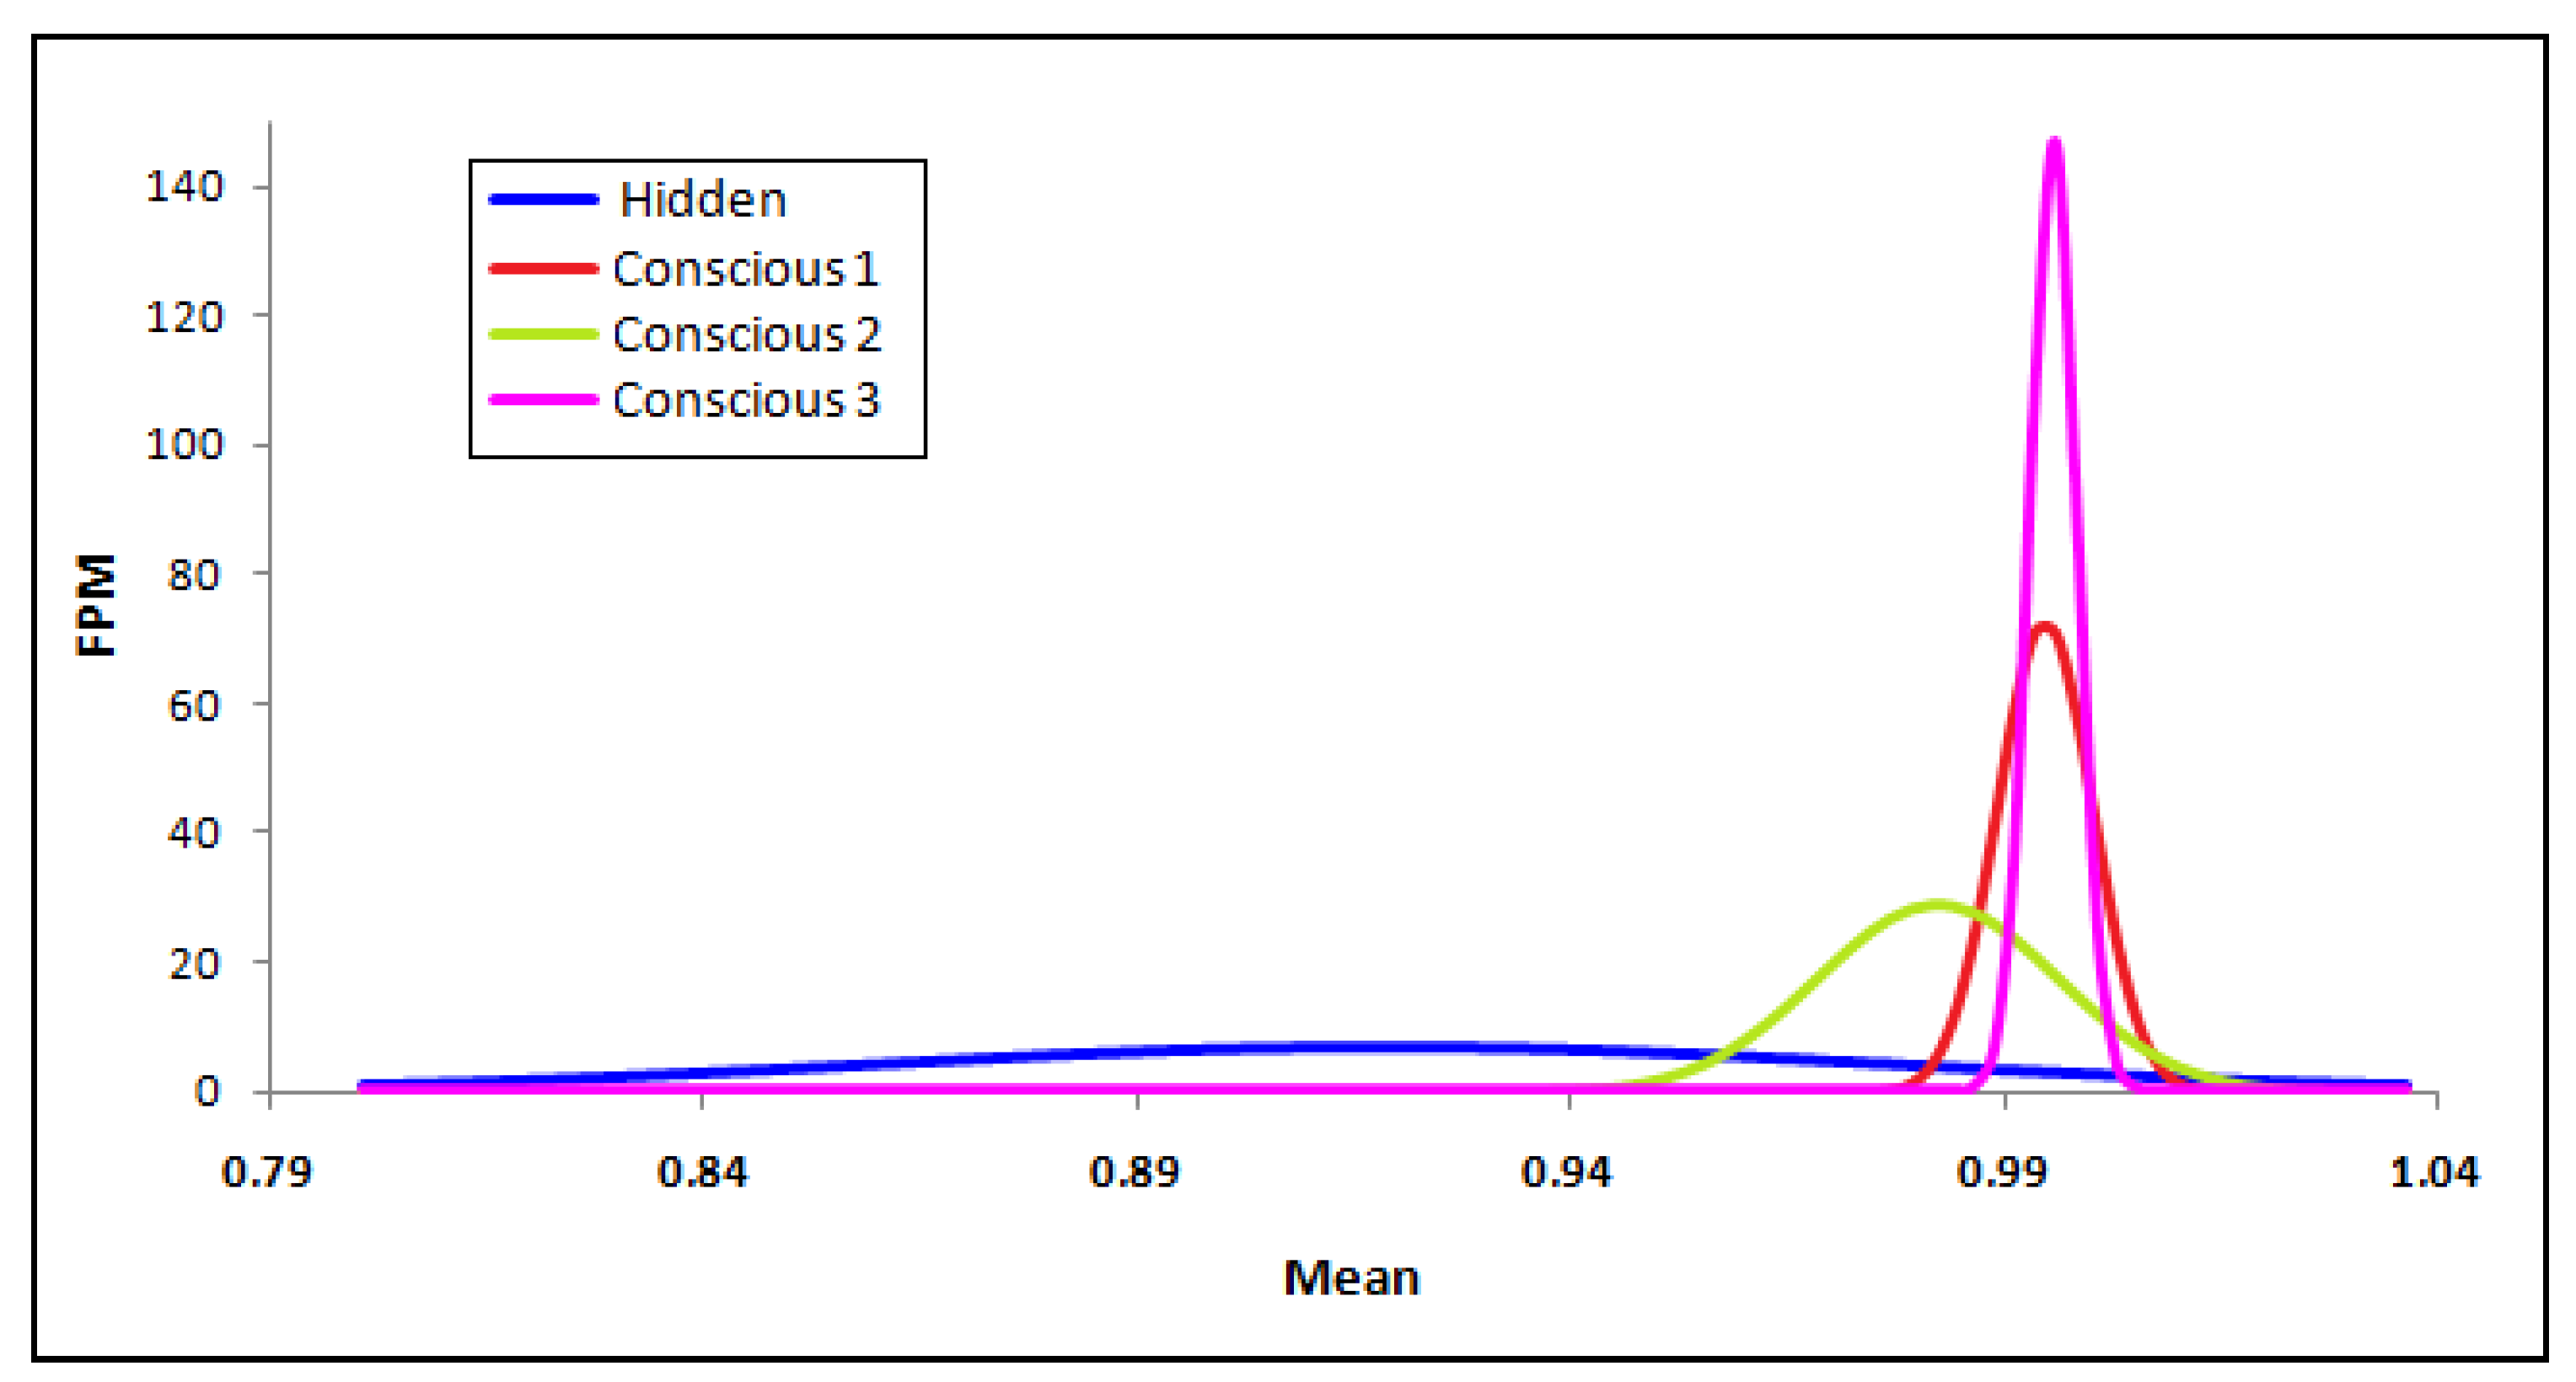
After analyzing the indicators, we performed a more in-depth analysis with the help of data envelopment analysis (DEA) tools, based on the variations of the indicators. It was possible to calculate the for each vehicle in each monitoring phase, and thus possible to calculate the probability function, considering its distribution curves with a confidence interval of two standard deviations. To verify the effectiveness of the interventions carried out in each of the monitoring phases, we assumed the null hypothesis (H0) that all the means were the same and that there would be no difference in the observed means. We also assumed as an alternative hypothesis (H1) that there was a difference between the means and that these differences would be greater during the phases in which the interventions related to training and feedback occurred.
The distribution of the data in
Figure 12 shows that a change in driving behavior occurred in relation to the hidden monitoring phase, with a reduction in the dispersion and increase of the mean and frequency. Based on the statistical analyses,
Table 4 shows a statistical summary in relation to the monitoring phases, and
Table 5 shows the analysis of variance, in which it can be seen that the
p-value was less than 0.05, indicating the existence of a statistically significant difference between the average values in the monitoring phases.
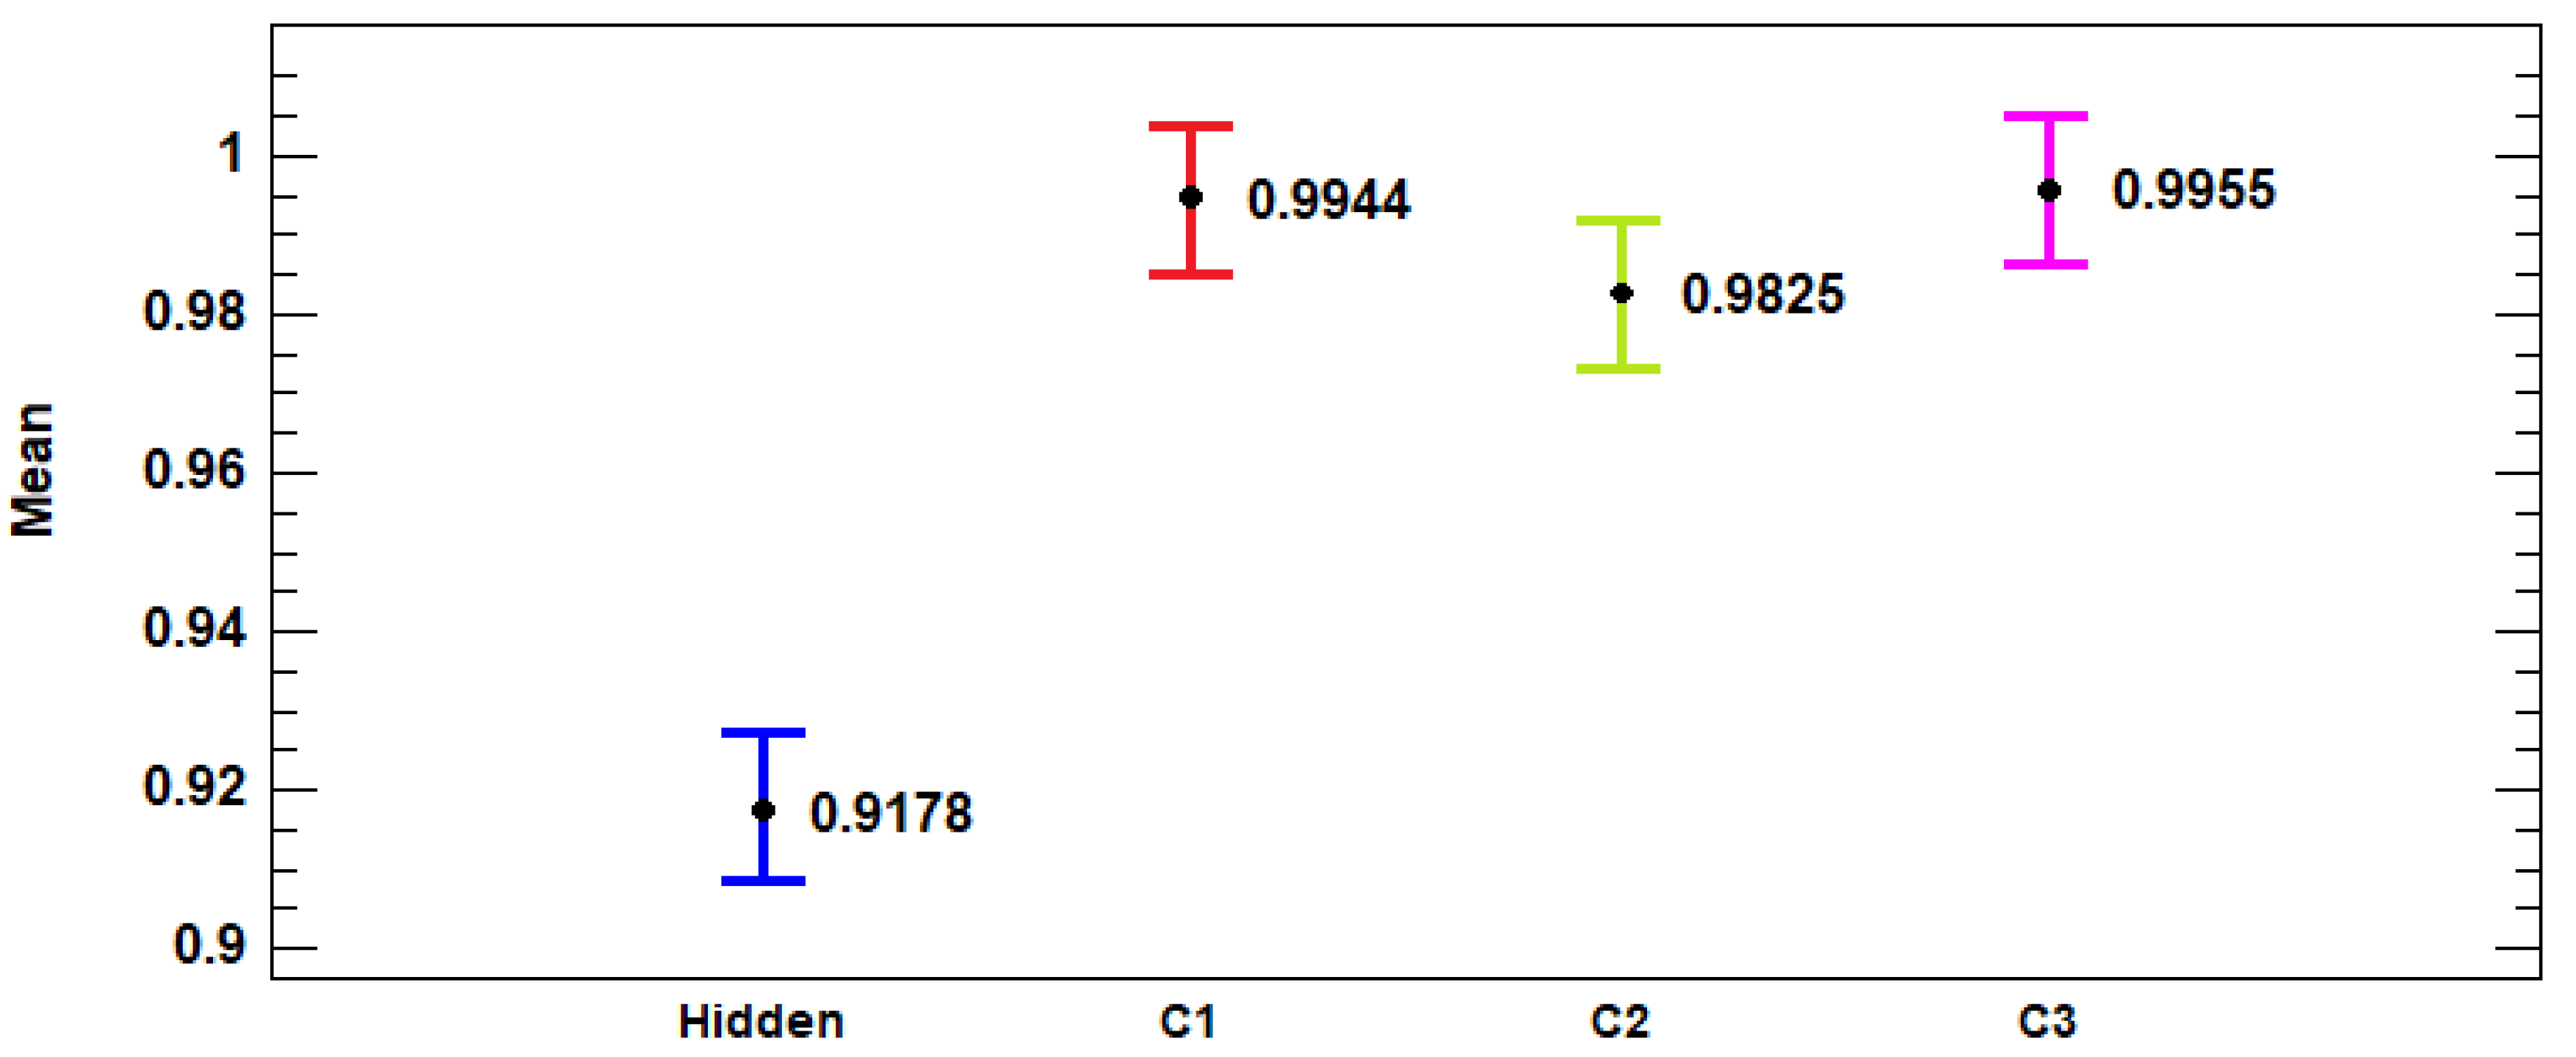
Figure 13 presents the results of a Fisher’s statistical significance test, showing that the average of the data obtained in the hidden monitoring was different from the others monitoring phases, since there is no overlap between the two.
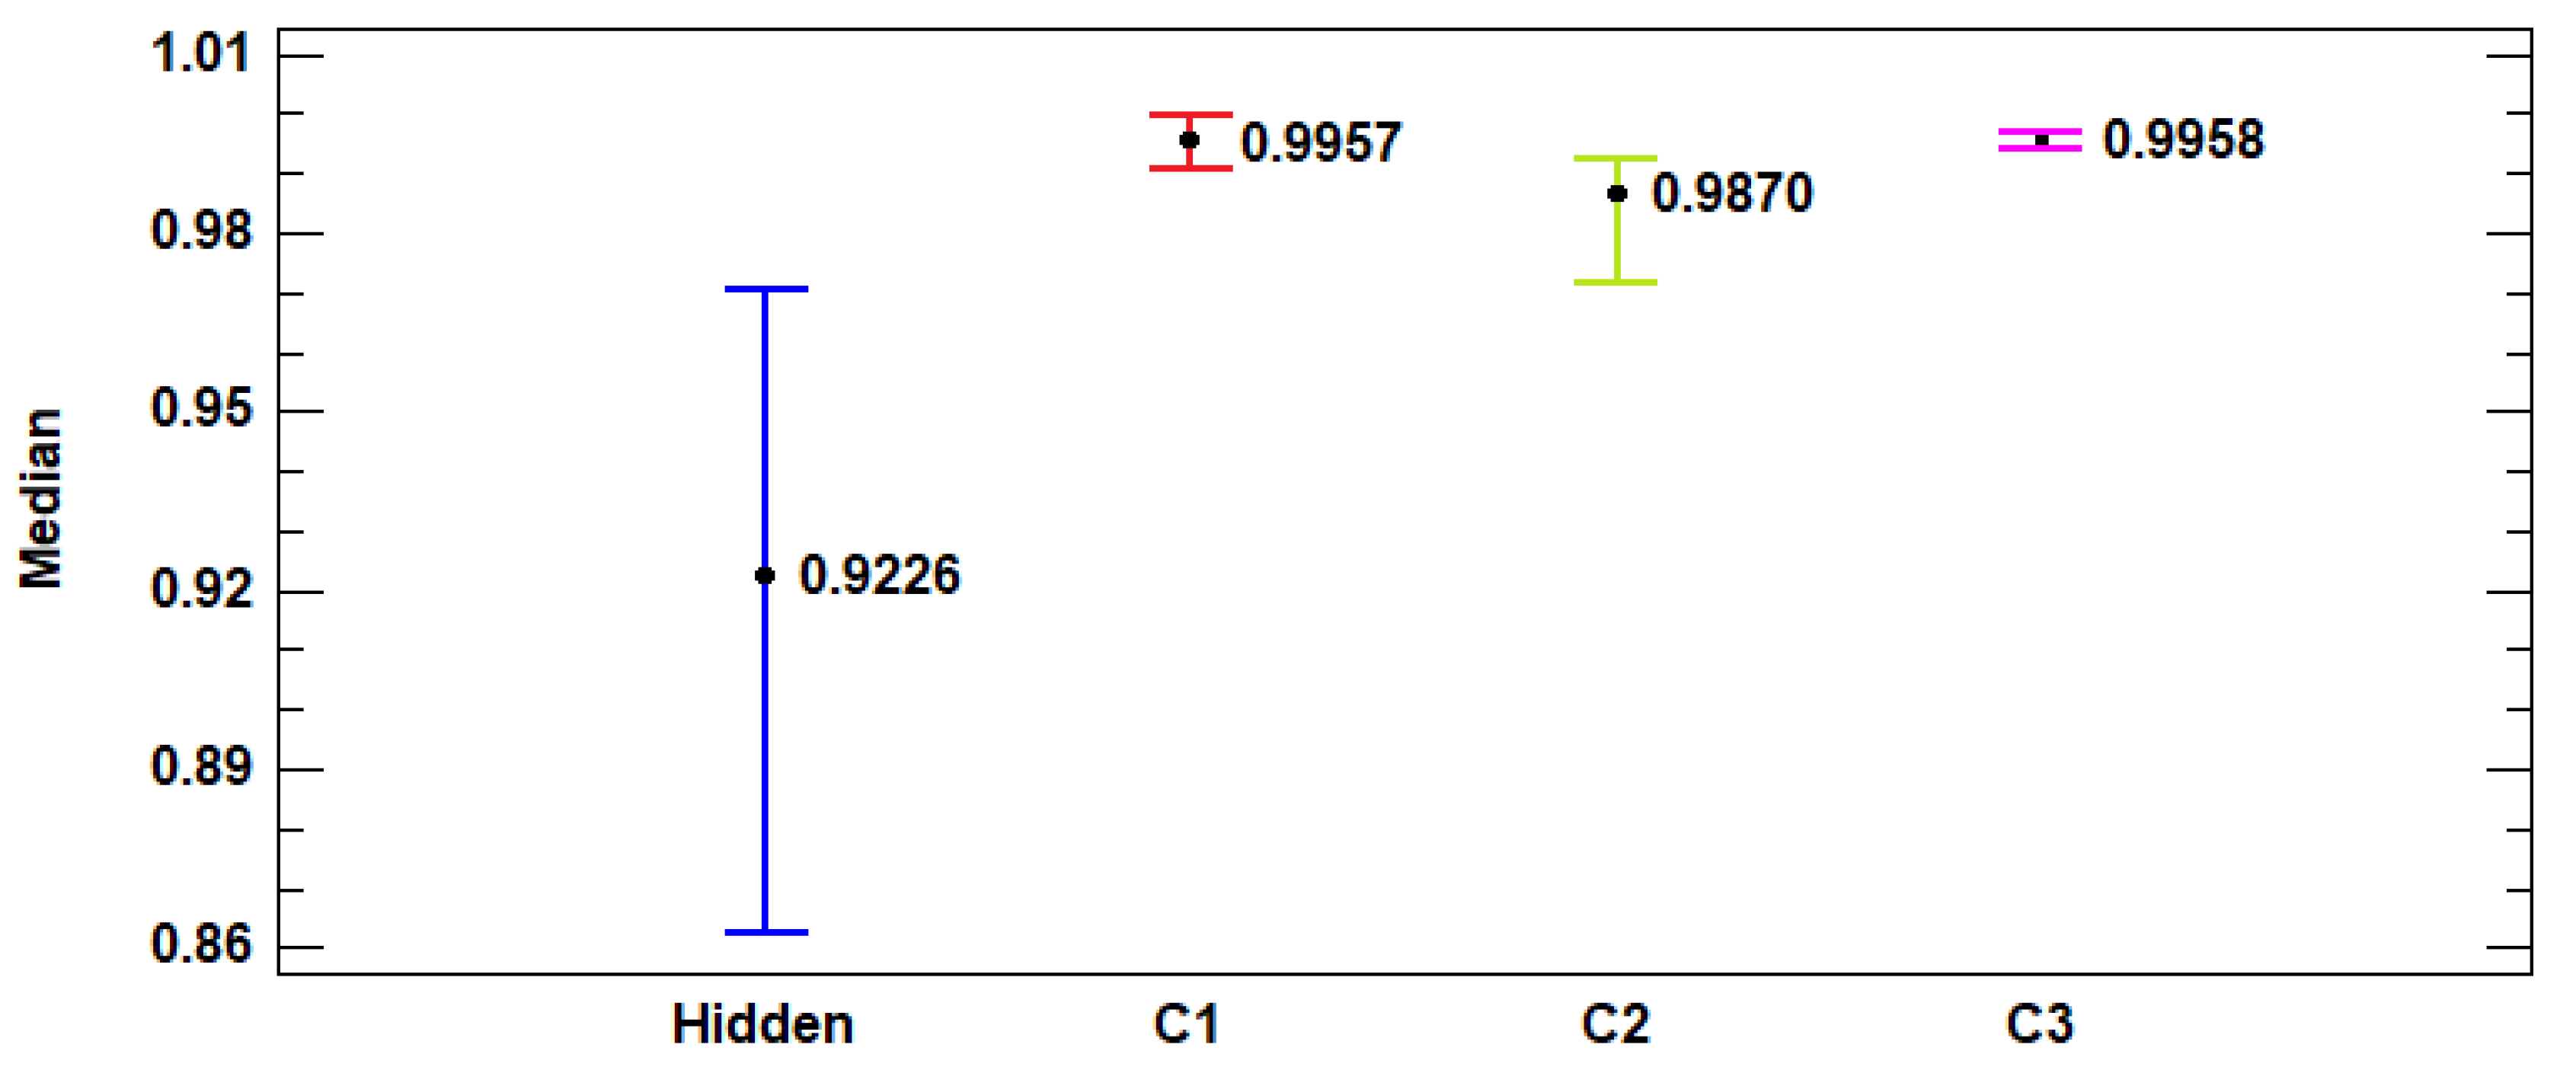
These observations are reinforced by the analysis in
Figure 14, which shows the behavior of the medians associated with a Mood’s statistical test, with a
p-value of 7.40725 e
−10 found for a chi-square test of 45.4545. Thus, we can affirm that the medians presented pairwise statistical differences.
The statistical tests applied to composite normalized data obtained by the DEA indicate a change in driver behavior from the moment the technology was enabled and the training and feedback procedure applied. In other words, there was a positive evolution in the criteria resulting from the application of conscious monitoring.
Based on this result, it is important to verify whether the initial hypothesis that the association of technology with the training and feedback procedures would produce better results in relation to the isolated use of EDR systems is valid.
To this end, we performed an analysis using only data from the conscious monitoring phases. It can be seen in
Table 6 and
Table 7 that the
p-value was lower than 0.05, indicating a statistically significant difference between the average values in the conscious monitoring phases.
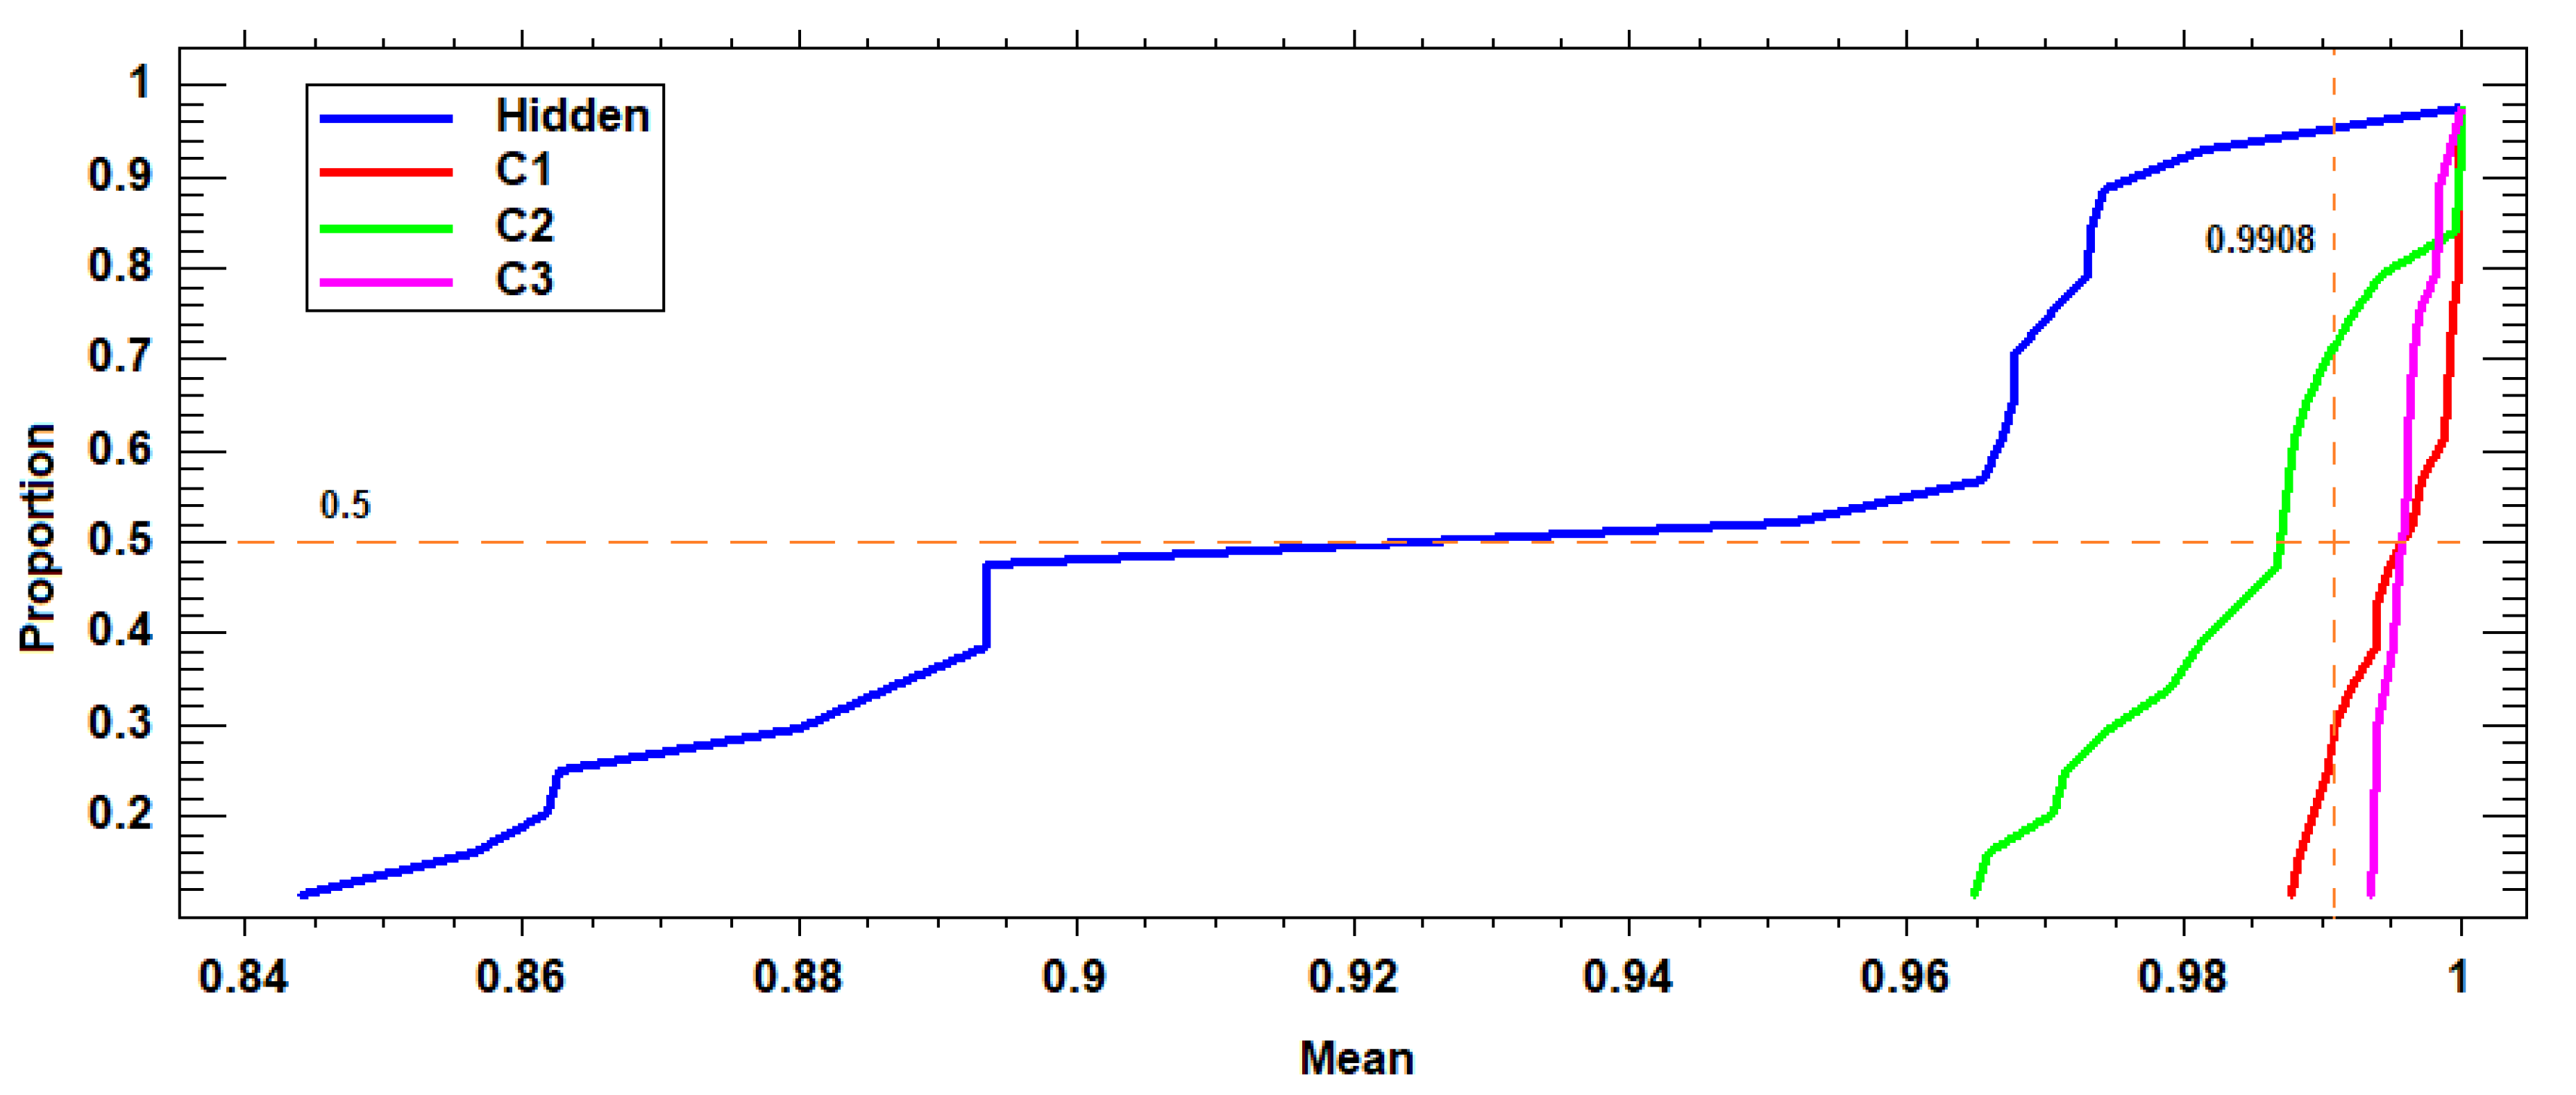
Analyzing the behavior of the data distribution in relation to proportionality, as presented in
Figure 15, similarity can be observed in the behavior of the data referring to C1 and C3, where more than 80% of the vehicles obtained results above the population average. In relation to conscious monitoring, only 26% of the vehicles remained above this level, which shows that there was standardization of behavior with a tendency toward better results and an improvement of the observed criteria.
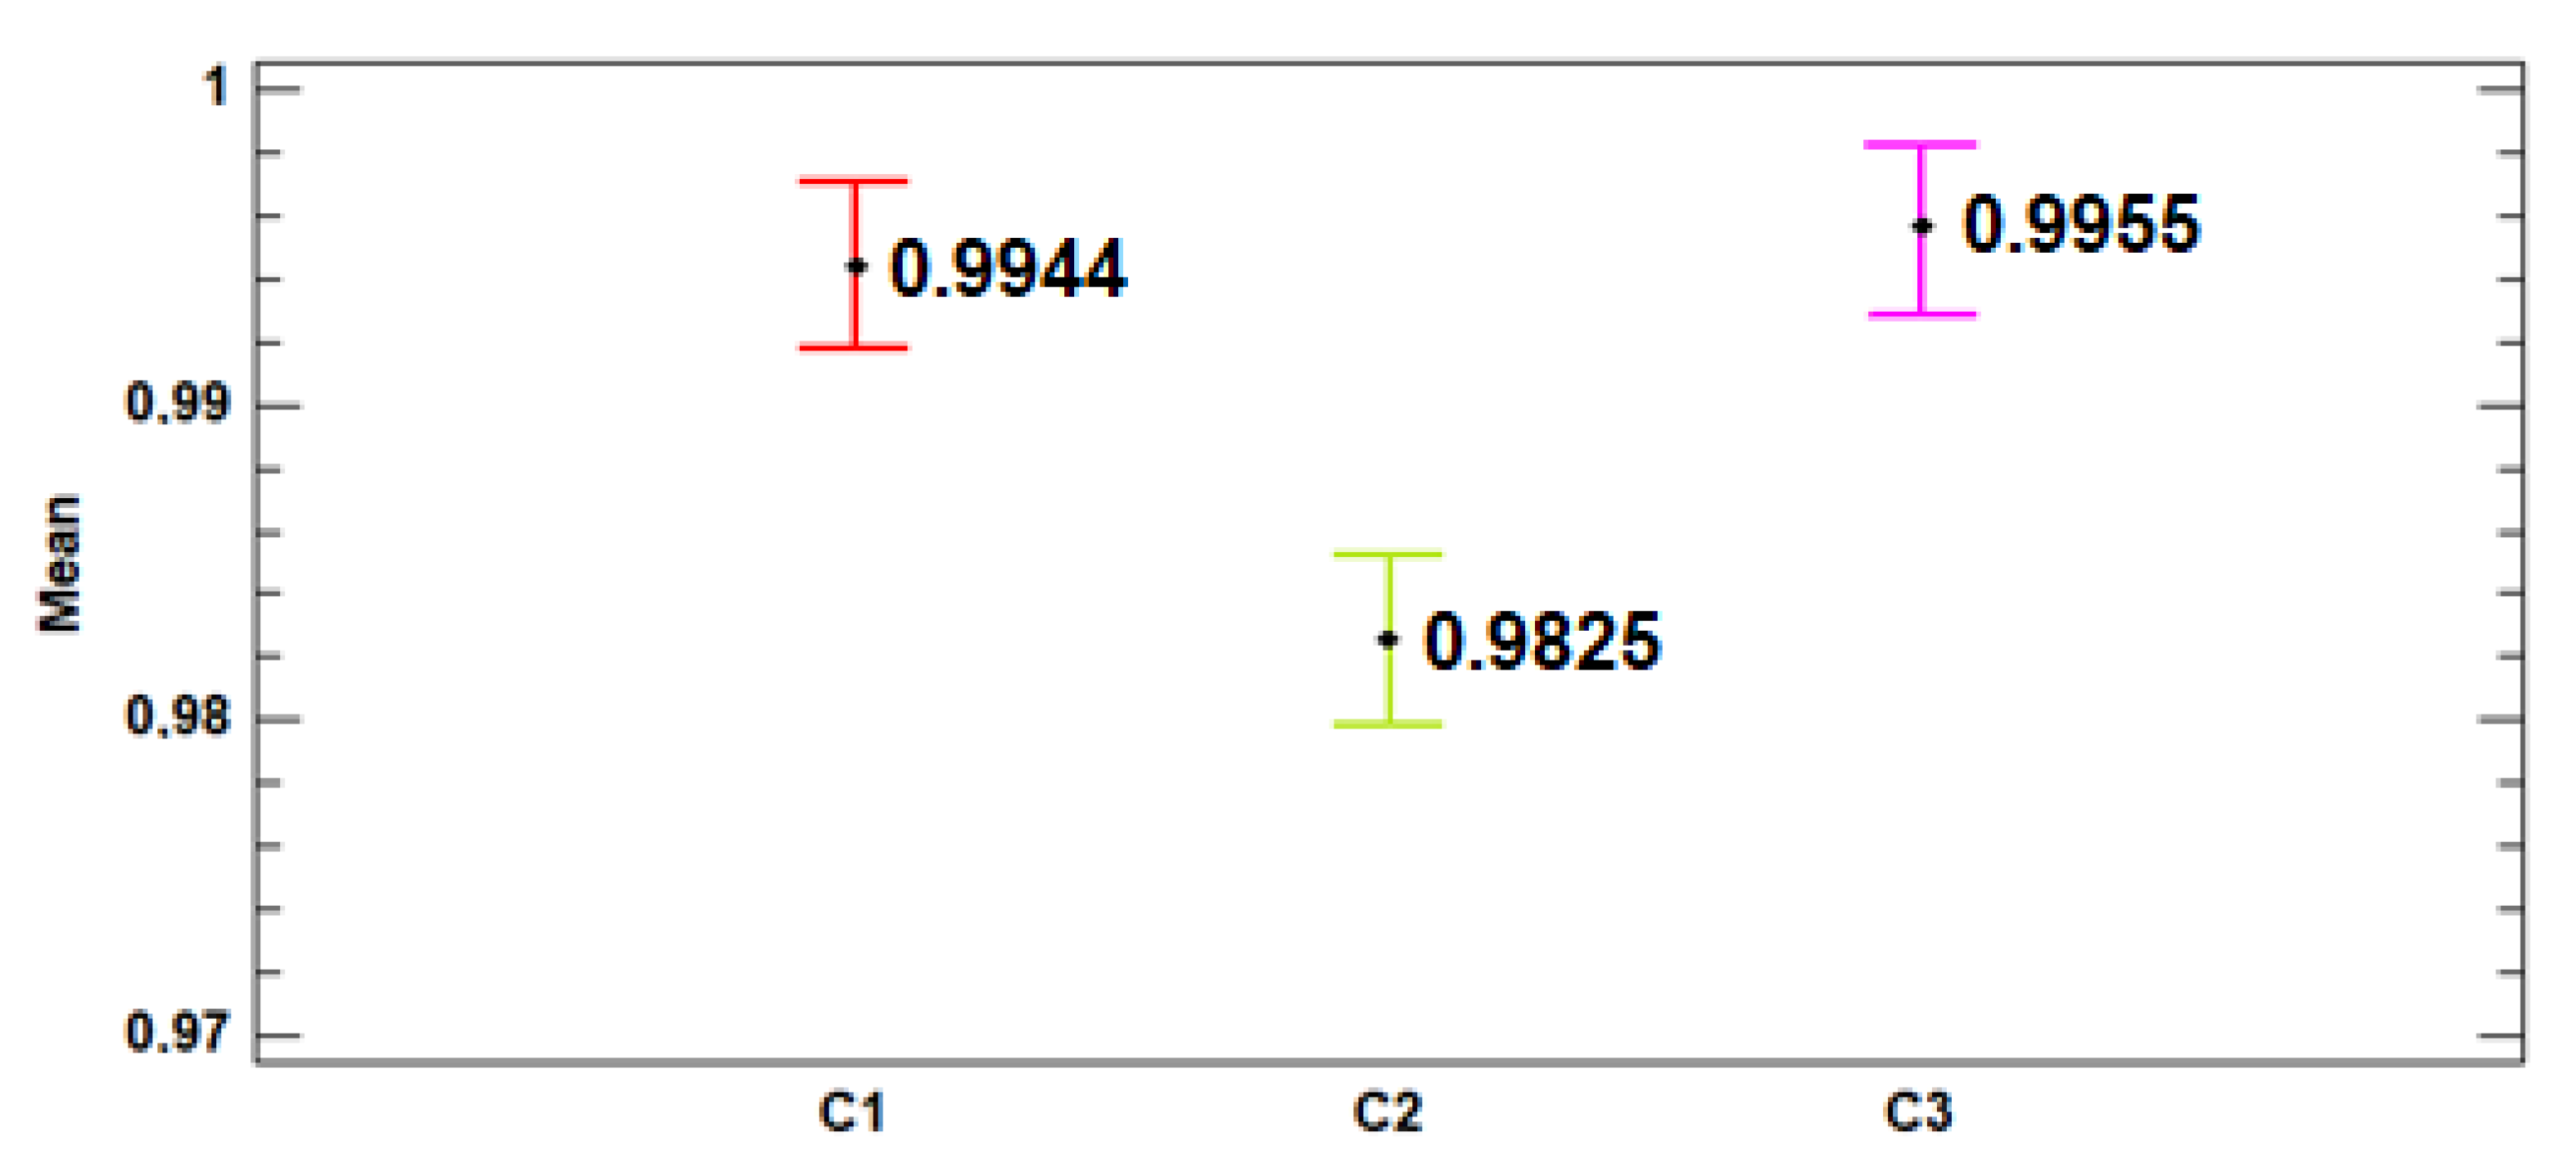
However, to define whether there was a statistically significant difference between the means, we applied a Fisher’s test again, which determined that only C1 and C3 were part of homogeneous groups, as can be seen in
Figure 16, where there is no overlap between the results of C2 and the others.
6. Conclusions
The analyses allowed an integrated assessment of the effects of introducing EDR systems into the behavior of truck drivers based on objective criteria related to the improvement of safety levels and operational standards and associated with a reduction of fuel consumption. Based on the results, it is possible to conclude that the use of EDR systems enables an improvement of safety levels without affecting operational efficiency or the cost of road transport.
The results show that the application of the technology had the capacity to improve indicators. The experiment also demonstrated that associating the use of the technology with the application of a structured training procedure based on continuous feedback substantially improved the results. The data also show that after restarting the training and feedback procedure (C3), the results were even higher than those obtained during C1, suggesting that the establishment of a training process and long-term monitoring can improve the safety and efficiency of trucking operations.
The EDR technology is a tool that can actively improve both the safety and efficiency of road transport. Furthermore, associating technology with training procedures and the provision of feedback can enhance the positive results of the isolated technology (C2). In this study, the most immediate and significant impact occurred to safety-related behavior, since the number of speeding events observed throughout the phases of conscious monitoring was reduced by more than 46.35% (
Figure 5), and the time spent driving time above the speed limit was reduced by 81.17% (
Figure 7). In addition,
Figure 8 and
Figure 9 show that standardization of safety-related behavior led to a significant reduction in unwanted behaviors, and comparison of this criterion with the other criteria revealed more significant short-term reductions. Another issue raised by the study is the potential relationship between the monitored variables and the proposed indicators when characterizing the investigated criteria. To this end, we gathered 21 variables and converted them into four indicators; however, some EDR systems allow the collection of up to 400 variables regarding the performance of a vehicle and its driver. Therefore, while the variables used in this paper characterized the current criteria, it is necessary to expand the collection of information regarding different variables so that researchers can better explain the individual behaviors of drivers. These results allow transport companies to create a mechanism to evaluate the behaviors of their drivers and to promote specific actions aimed at reducing unsafe acts related to the occurrence of accidents, leading to increased operational quality.
A proposal for future research is to broaden the scope by including a sensitivity analysis focused on individual DMU behaviors. Furthermore, it would be good to expand the sample size to diversify the segmentation related to the type of transport. Finally, it would be edifying to investigate the effect of structuring the entire training and feedback procedure as described by standards such as ISO 39001, CSEAA and Directives EC 59/2003 and EU 2018/645.

 ,
, 


