Active Road Studs as an Alternative to Lighting on Rural Roads: Driver Safety Perception


1
Transport Research Institute, Edinburgh Napier University, Edinburgh EH10 5DT, UK
2
Department of Civil, Environmental and Geomatic Engineering, UCL, London WC1E 6BT, UK
*
Author to whom correspondence should be addressed.
Sustainability 2020, 12(22), 9648; https://0-doi-org.brum.beds.ac.uk/10.3390/su12229648
Submission received: 17 October 2020
/
Revised: 15 November 2020
/
Accepted: 16 November 2020
/
Published: 19 November 2020
(This article belongs to the Collection Emerging Technologies and Sustainable Road Safety)
Abstract
:Drivers, particularly with increasing age, cite driving at night as being problematic and feeling unsafe. Ultimately this may result in self-regulation and avoidance, with potentially negative health effects. The issue is commonly mitigated through provision of street lighting, but with it comes cost, environmental impact, and other negative effects. Research has suggested that provision of LED Active Road Studs may be of assistance to drivers at night. However, it is not known how implementation of this measure affects driver confidence, as research to date has focused on observational study of actual driving behaviour. The present work addresses this gap in knowledge using data from 698 respondents to a questionnaire survey of households around a recently treated route. Overall, 72% reported an increase in confidence driving at night, with key reasons cited as increased preview time and reduced glare. A total of 80% of respondents believed the overall safety of the study route had improved. Underlying confidence was found to be lower in females, with confidence increasing with mileage driven. This study is the first to suggest the use of active road studs may increase driver confidence and provide increased travel opportunities, particularly where street lighting is impractical or undesirable in terms of sustainability.
1. Introduction
Meta-analysis of the effect of road lighting across the world as an accident countermeasure has suggested that general overall reductions in fatal and injury collisions can be expected during hours of darkness [1,2,3]. Higher savings in injury collisions have been reported in countrywide studies, particularly in rural areas [4]. Furthermore, where lighting has been installed, a relationship between increasing luminance levels and decreasing night to day crash ratios has been identified [5]. An increased collision frequency at night has been shown to occur on longer links in the network, although it has been postulated that this may be down to other factors such as increased speed rather than lighting conditions [6]. Indeed, the presence of lighting may itself be counterproductive in this respect; drivers may compensate for the presence of road lighting on links in terms of increased speed or reduced concentration [7]. The impact of weather conditions in combination with lighting has also been shown to have an effect, suggesting collisions may be caused by an inability in drivers to adjust speed in accordance with degraded visual performance [8].
One road feature where there appears to be significant correlation between safety and lighting is at junctions. Studies have shown that unlit junctions have higher night to day crash ratios and greater injury severity than those that are fully illuminated or feature simple destination lighting [6,9,10,11,12]. However, it has been recognised that due to fewer drivers driving during hours of darkness, exposure is lower and the benefits of lighting may be overstated in respect to other non-light related safety countermeasures [13]. Regardless of the net level of effect of lighting, in such situations older drivers are over represented in collision statistics [14] due to differences in abilities such as gap acceptance [15].
Future scenario planning exercises suggest that assistive technologies may alter the way in which people live and travel as the population ages [16]. However, for the foreseeable future, mobility is a significant contributor to happiness and good health, particularly for older people [17,18,19]. Such effects though, can be tempered by the proximity to urban areas and the spatial planning adopted [20,21]. Notably, in rural areas, public transport and active travel options often are limited and access to the car has been shown to be a key determinant of travel needs being met [22]. Drivers report feeling less comfortable driving in the dark, potentially resulting in self-regulation and avoidance [23,24,25]. On this basis, transport policymakers need to look beyond direct road safety implications when considering providing for drivers at night [26].
In terms of sustainability, the environmental impact of street lighting due to energy consumption has been substantially reduced in recent years, through the development of LED luminaires, solar power and adaptive control [27,28,29,30]. However, illumination solutions may result in adverse light pollution impacts in rural areas, the health and environmental effects of which are often overlooked in infrastructure development [31]. Lighting also has a significant capital and revenue cost implication and it has been recognised its application should be focused on addressing specific collision concerns, as opposed to universal adoption [32]. Further to this, poor driver confidence does not necessarily translate into a lack of ability [33,34]. On this basis, investment priorities to balance truly effective road safety measures with interventions to improve driver confidence need to be carefully considered.
Active Road Studs (also known as Internally Illuminated Raised Pavement Markers) are a development of traditional reflective road studs incorporating powered internal LED illumination. Through eliminating the reliance on reflected light and increasing illumination intensity through an active source, it is suggested they could assist drivers in several applications [35]. Field trials of the studs suggest they could have positive effects on vehicle positioning and speed [36]. Simulator studies support these assertions and also suggest increases in confidence from drivers may be expected in conjunction with their use [37,38]. However, to date no assessment has been made of whether this theoretical change in confidence translates to a real-world scenario. This work is intended to address this gap in knowledge.
The aim of this study was to measure self-reported levels of confidence felt in safety terms, using real-world rural junctions and links during hours of darkness where active road studs are installed, and how this may affect drivers’ propensity to travel. The objectives were to:
- quantify the levels of confidence of rural road users in different lighting conditions;
- determine the relative levels of importance of different road features to users in relation to confidence of driving at night;
- measure the effect on driver confidence resulting from the installation of active road studs; and
- understand the reasons for any changes in safety perception.
The work described here forms part of a larger study investigating the effects of active road studs on driver behaviour, such as lane discipline, speed and gap acceptance. The focus in this element is driver confidence.
2. Materials and Methods
2.1. Study Area
The A1 is a UK trunk road (road of national strategic importance) running east from Edinburgh in Scotland to the border with England and beyond. The road is dual carriageway from the edge of the city for around 50 km. After this, it is mostly single carriageway for the remaining 32 km to the border, with a short (4 km) section of dual carriageway roughly mid-length and a section of dual carriageway crossing the border itself. As a result of various upgrades in the latter decades of the 20th century, it is predominantly built to modern alignment standards. The single carriageway section of the A1 is rural in nature. The road carries a mixture of longer distance strategic traffic and local journeys between the small towns and villages in the surrounding area.
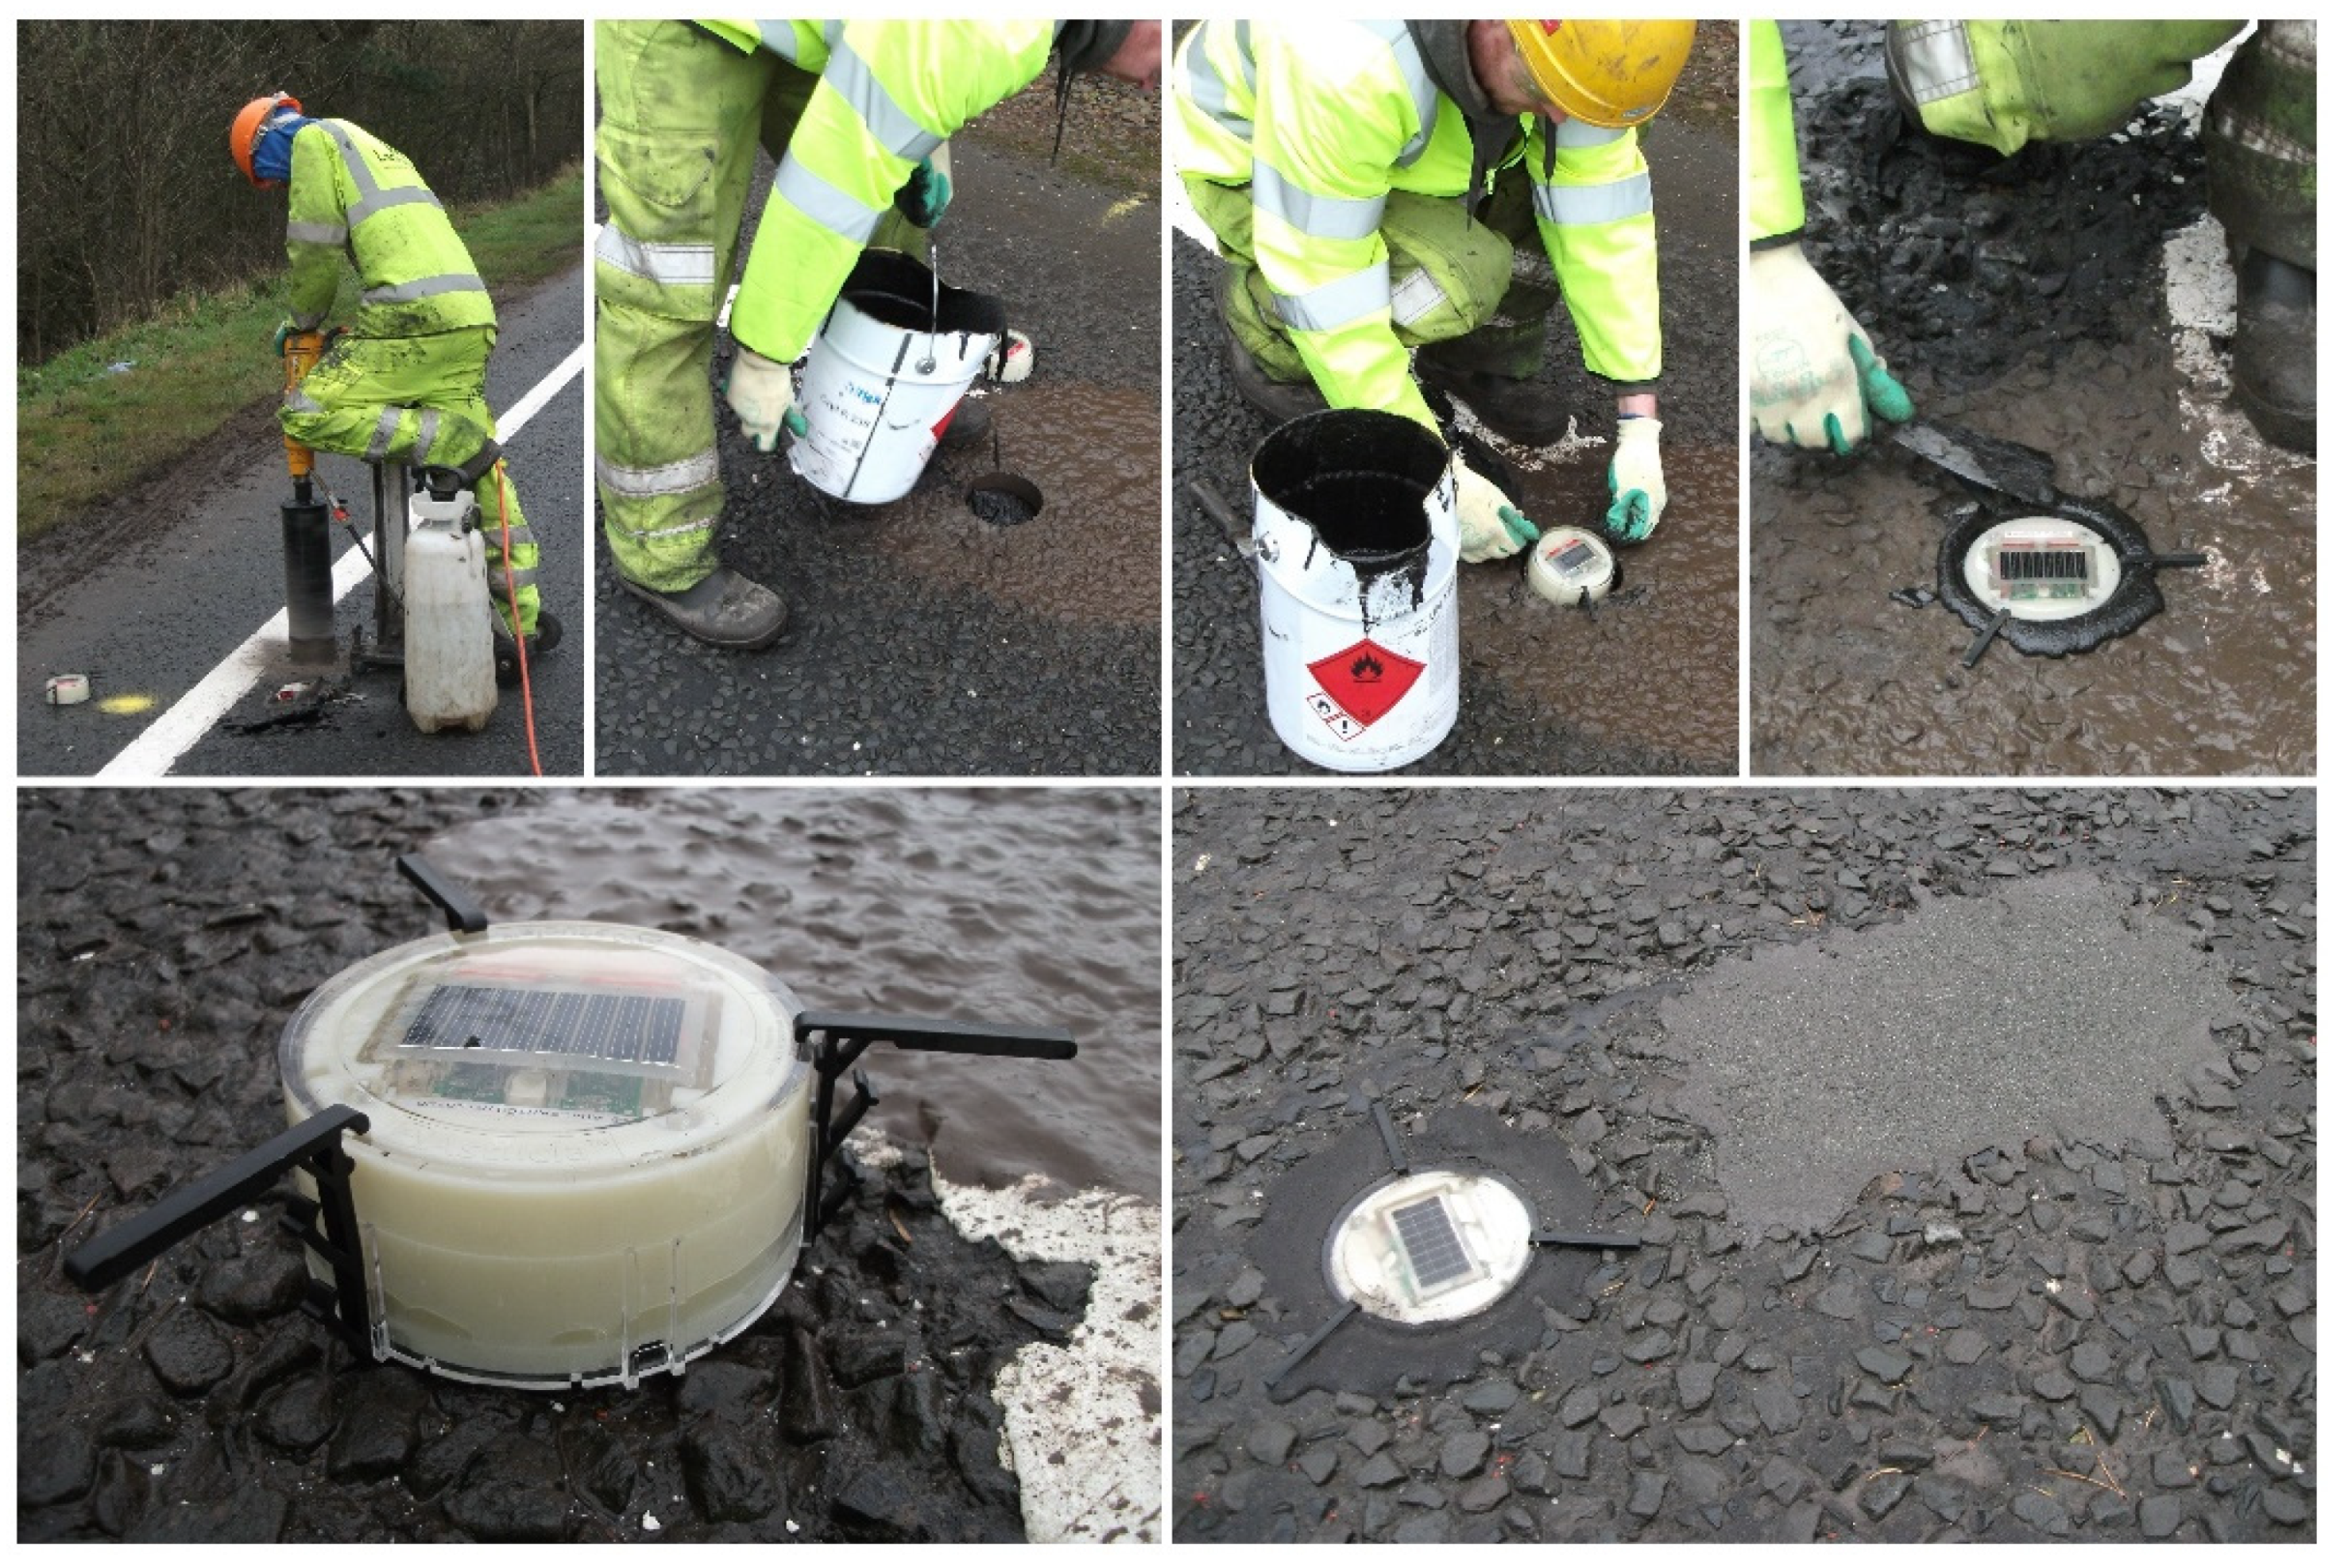
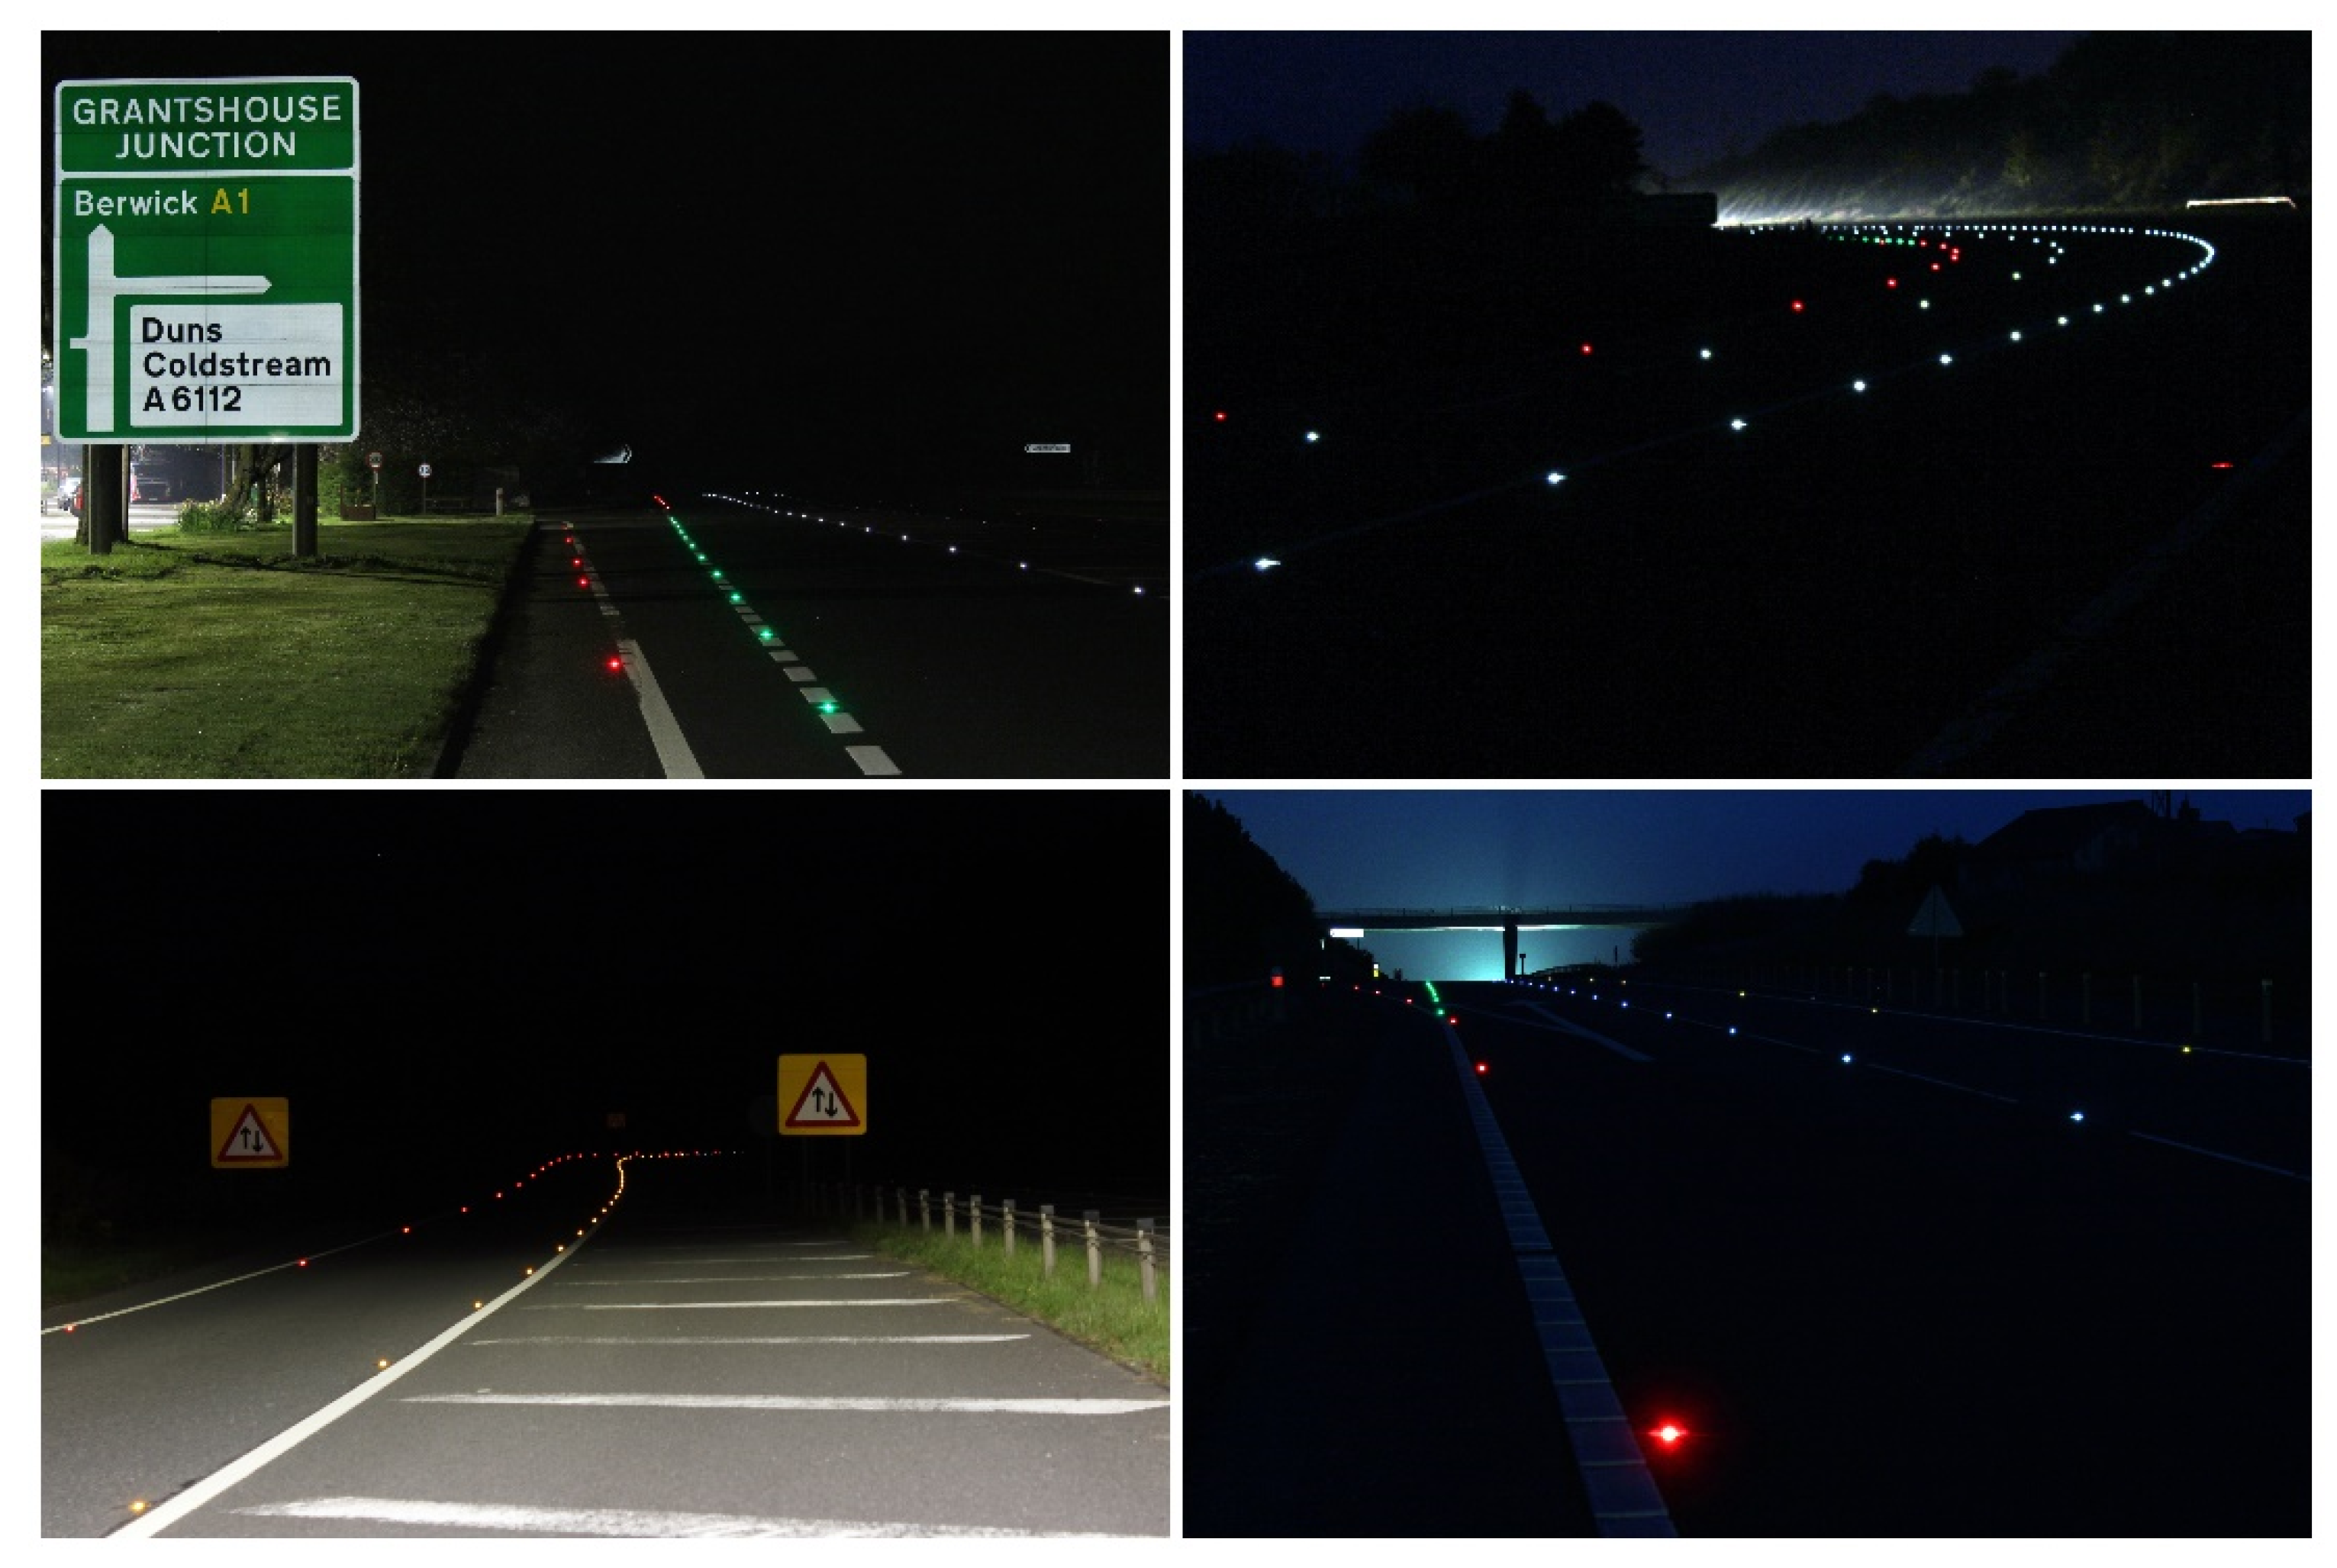
For several years, residents have campaigned for improvements to be made to address perceived issues of safety along the route. Despite this, a review by the national roads authority reported to local elected members that only two slight injury collisions had been recorded [39]. However, the review also found during hours of darkness, the visibility of junctions on the route could be perceived as poor and an improvement scheme was subsequently developed to address user concerns. The scheme comprised the use of LED Active Road Studs to highlight junctions and selected links with a view to improving the perception of safety and the experience of users. In total, over 4200 studs were installed at nine junctions, including two intermediate stretches of carriageway. The installation process for the studs and examples of their use in the scheme are shown in Figure 1 and Figure 2.
2.2. Population and Sample
The survey population of interest were the local users of the route. Longer distance and nonlocal users were not within the scope of this investigation. To focus on the experiences of the target group, a questionnaire survey was developed for distribution in the study area. Introductory text included with the survey provided details of the purpose of the study, along with contact details of the researchers for any further information. An optional prize draw was included to encourage response; however, respondents were informed that the survey was anonymous and that no personal details would be retained, being used only for the draw if they chose to participate. Approval of the survey and study approach was obtained in accordance with Edinburgh Napier University’s Code of Practice on Research Integrity.
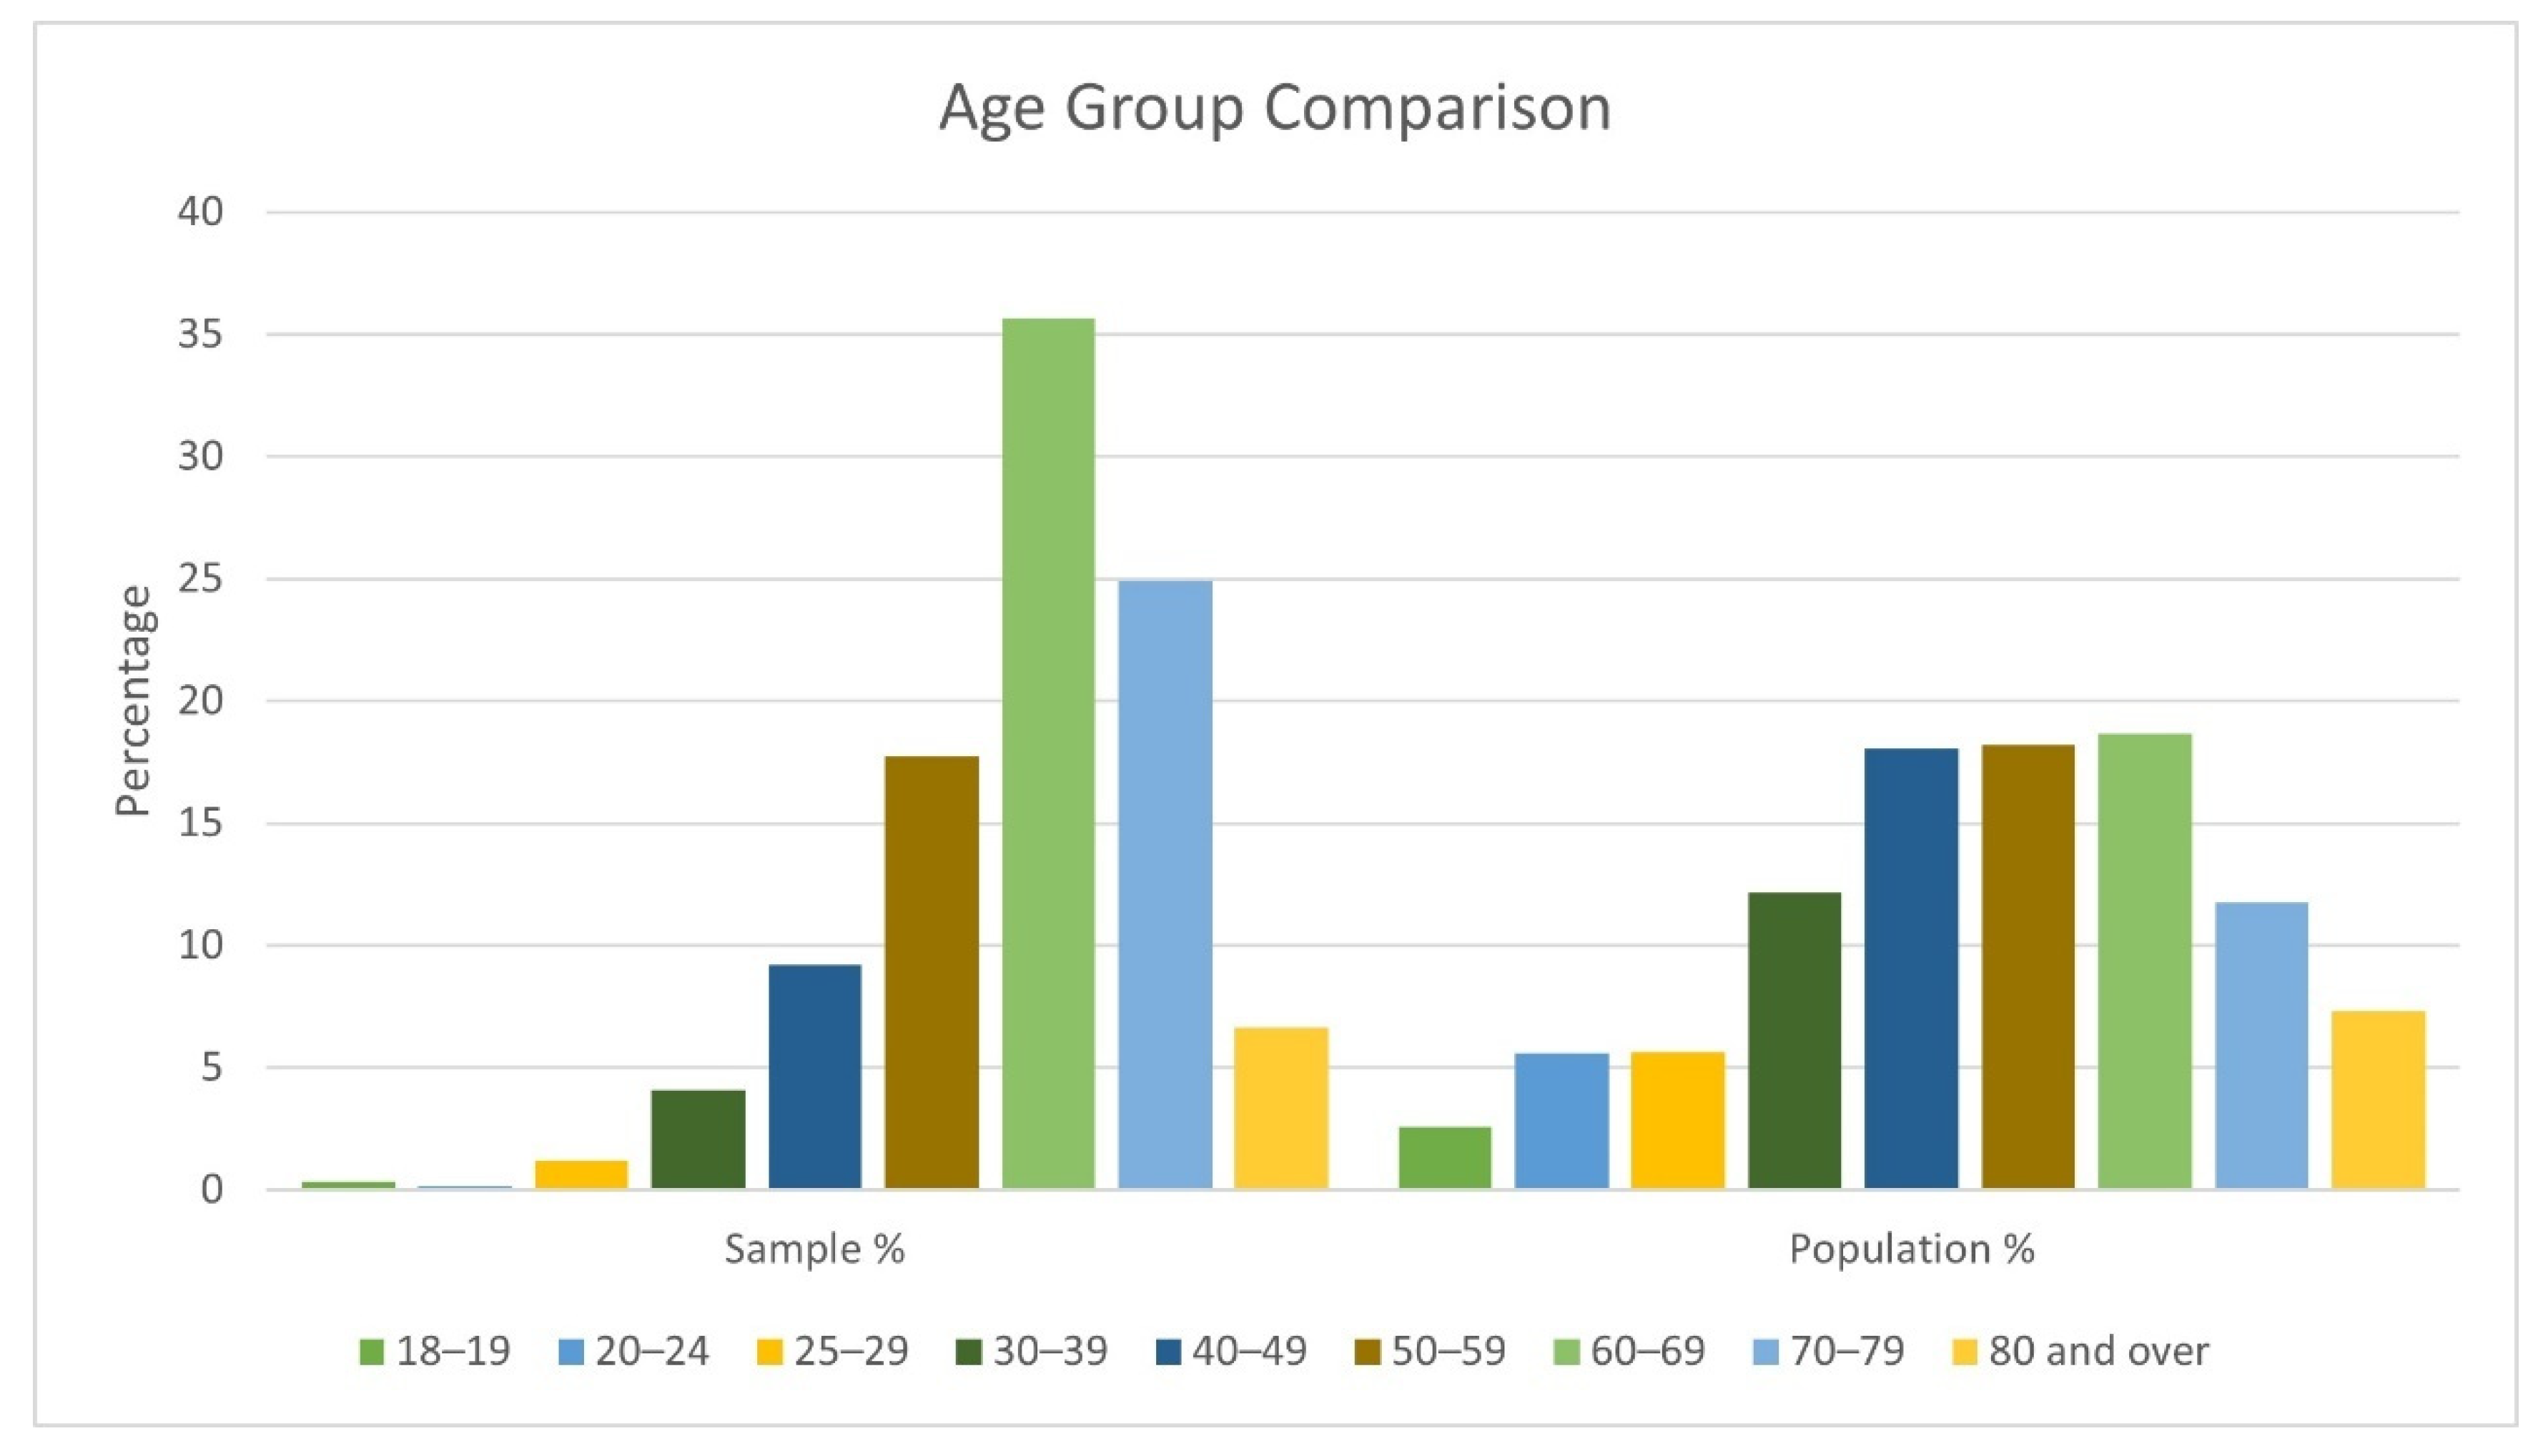
The distribution of the survey was non-discriminatory with a goal of sampling the widest cross-section of the population possible. In interpretation of the results, two factors are important to note. The first is that only one questionnaire per household was provided. This means where multiple drivers were resident at the address, the results could reflect the views of only one respondent and variations in confidence between household members may not be represented. The second relates to the age distribution of respondents. A comparison of the 2011 UK census data for the study area population with the sample obtained is shown in Figure 3. Although the population data represents residents rather than drivers, the proportion of younger respondents in the sample was notably lower. For the purposes of reliable statistical analysis, a single category of those between 18 and 39 years old was formed to represent the younger driver group.
2.3. Survey Content
The main goal of the questionnaire was to assess the importance of road features during hours of darkness and the opinion of active road studs in this context. Respondents were asked to rate on a five-point Likert scale varying from ‘not important’ through to ‘very important’ the following six features: street lighting at junctions; street lighting on curves; road studs at junctions; road studs on curves; solid white lines at edges of road; and white line markings in the centre of the road. They were also asked on a five-point scale from ‘strongly worsened’ through to ‘strongly improved’ whether the introduction of the active road stud had altered their opinion on seven themes: clarity of junctions; clarity of curves; clarity of lanes; their confidence driving in darkness; their opportunities for travel; overall safety; and incidence of speeding on the route.
To permit exploration of potential variation between groups, demographic information was asked regarding the age and gender of respondents. The age categories were defined in accordance with the bands used in UK national government reporting [40]; as previously described some lower age bands were latterly combined prior to analysis. All respondents were asked to rate their confidence driving on the A1 in daylight hours and during hours of darkness using a five-point Likert scale from ‘not confident’ through to ‘very confident’. An open-ended question invited comments on the views of the active road studs and their general perception of safety on the route. Using a five-point Likert scale (strongly disagree to strongly agree), respondents were asked to state whether active road studs should be more widely used.
A series of secondary questions were asked to investigate contributory factors to driver confidence. This included how many years they had held a driving licence; an estimation of their annual distance driven in miles to the nearest thousand; the number of road accidents they had been involved in during the five years prior to the survey and how many had been during hours of darkness. To validate previous answers, they were also asked if they were aware that active studs had been installed prior to receiving the survey. Finally, respondents were asked to provide the frequency they make specific journey types during hours of darkness, namely: travel to/from a place of work; travelling for work; taking children to school; carer responsibilities; hobbies and recreation; visiting friends or relatives; and shopping.
2.4. Survey Distribution
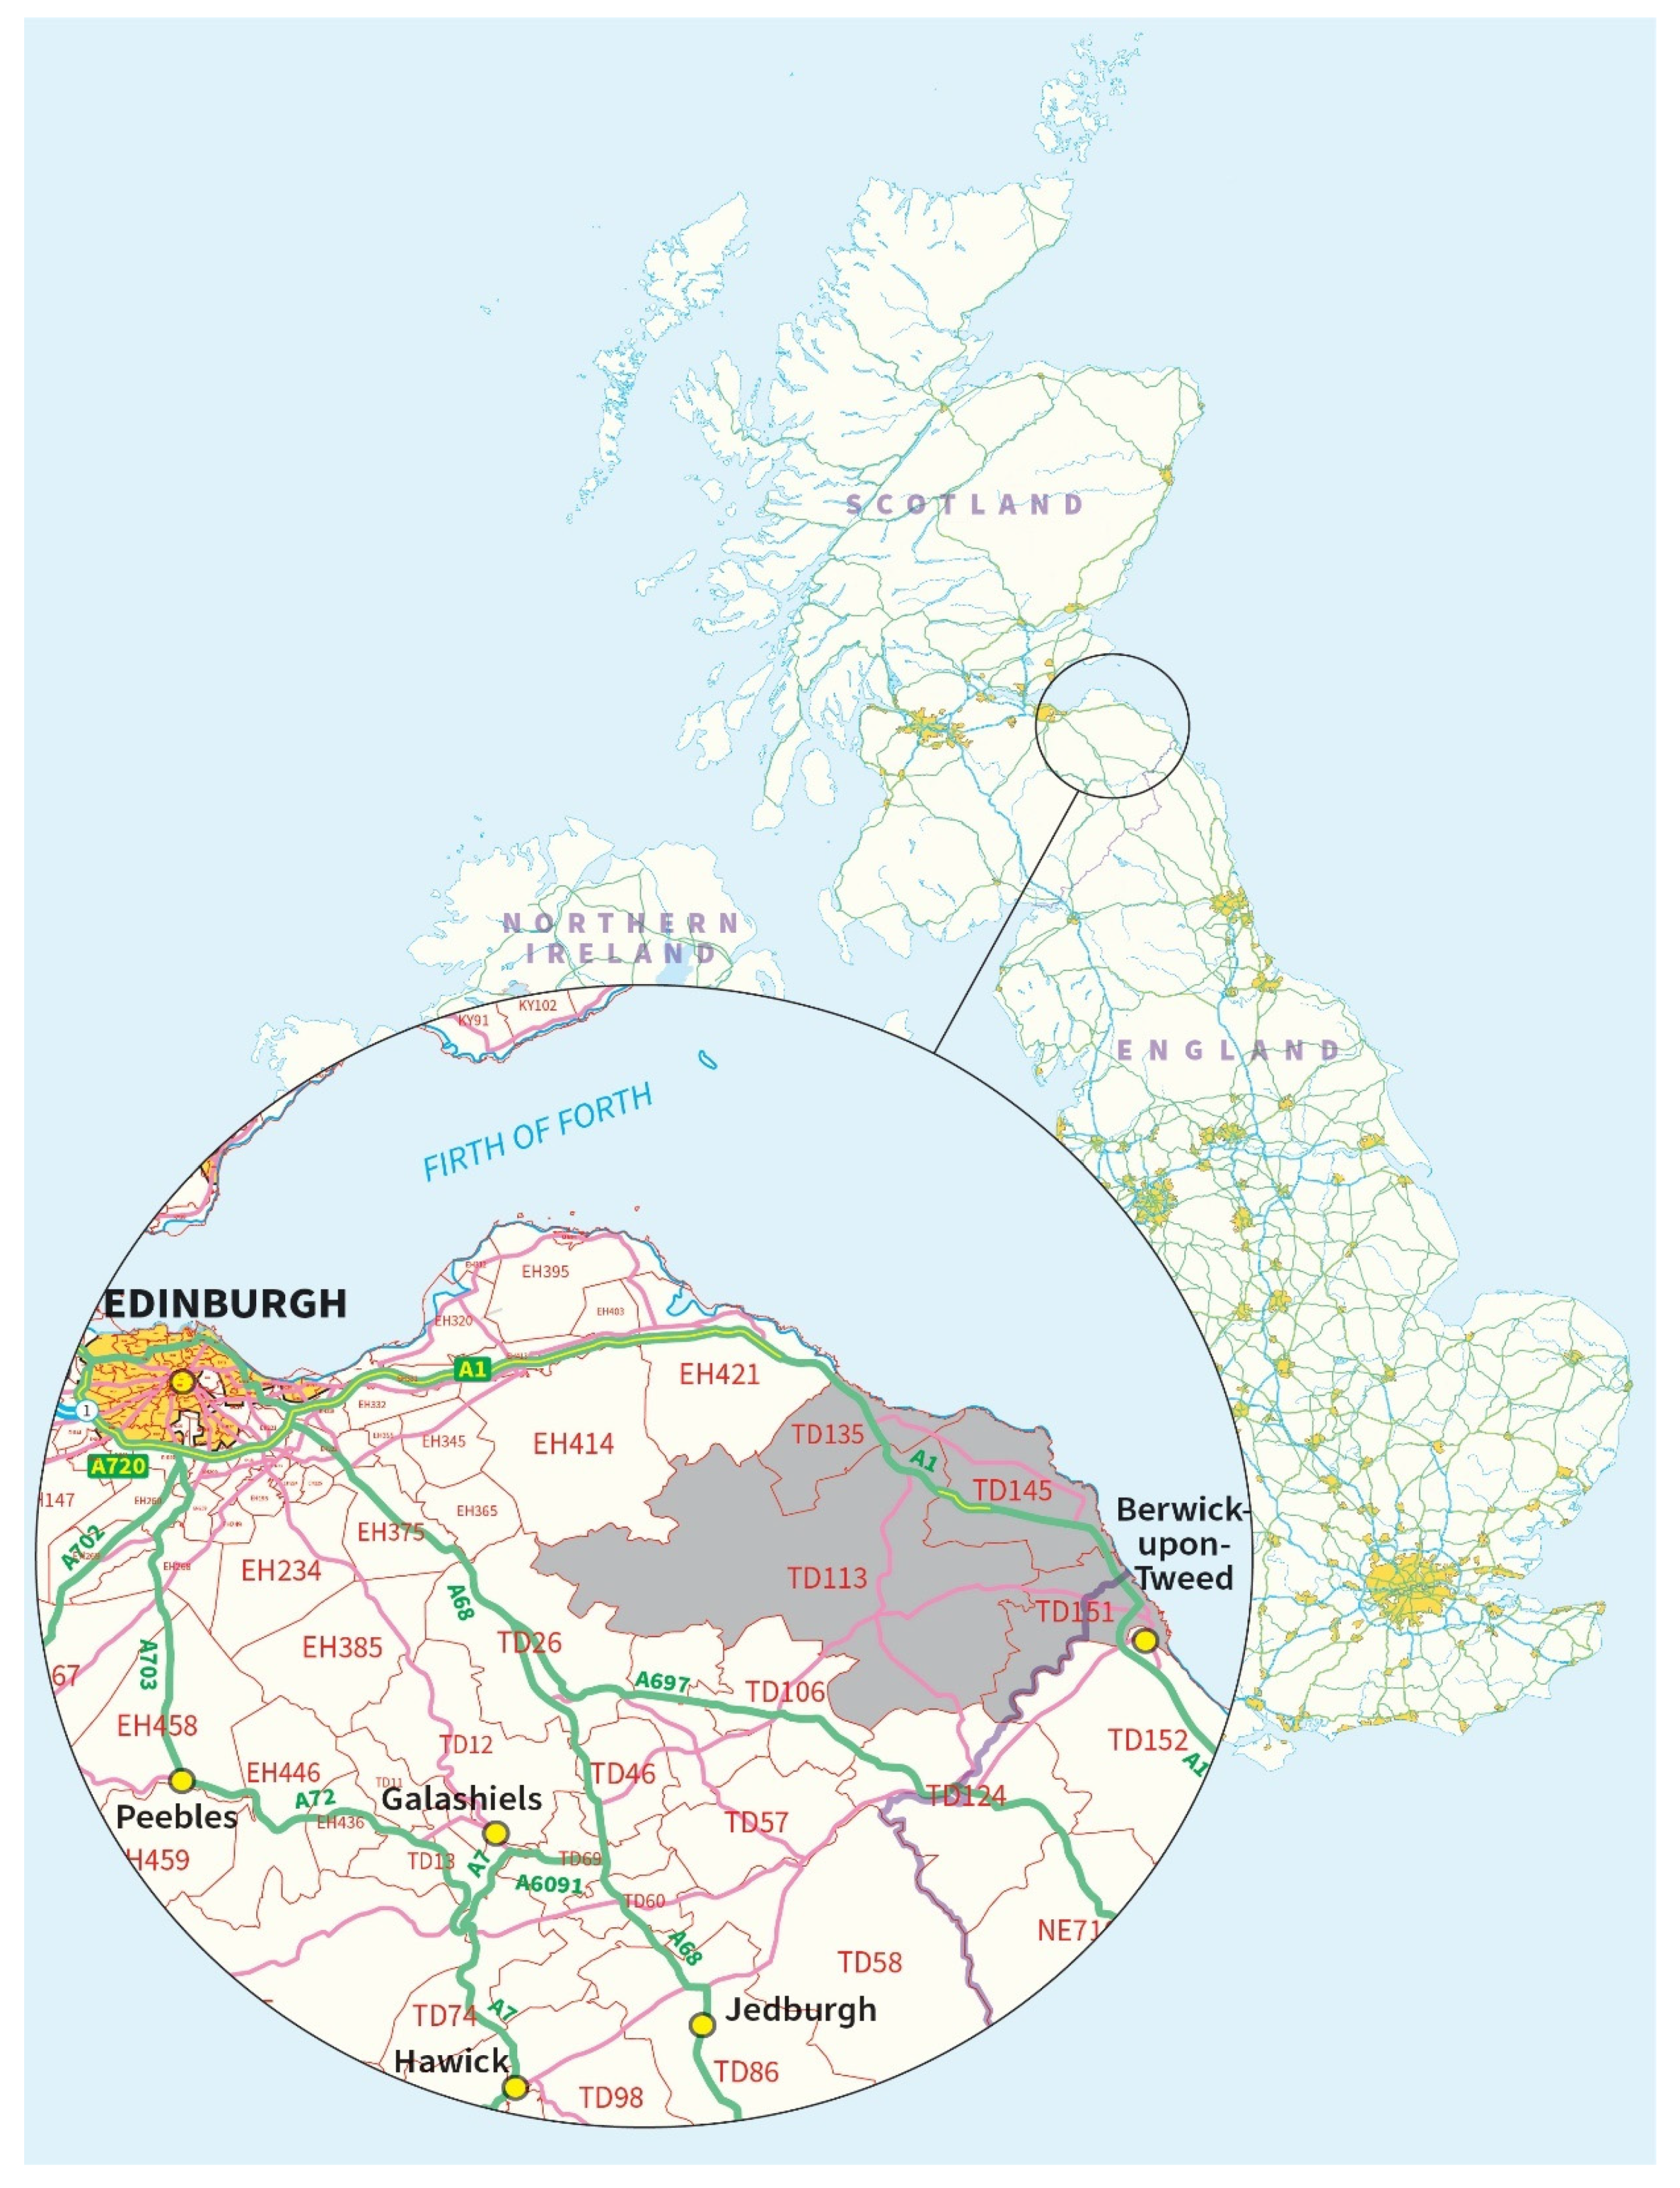
The target was to sample the widest possible range of respondents within the study area. A hand-delivered survey to all residential addresses in the study area was deemed the most effective option. Distribution of the survey was undertaken by the UK national postal service as part of its normal postal deliveries during the week commencing 20 November 2017. The survey was reported in two local newspaper articles during the week of distribution to raise awareness. A closing date for the survey was 22 December 2017, the day after the winter solstice. This was chosen to ensure respondents had specific familiarity with driving in dark conditions at the time of completion. In total, the survey leaflet was delivered to 10,817 residential postal addresses, comprising the TD113, TD135, TD145 and TD151 postcode sector areas as shown in Figure 4.
Each paper questionnaire could be returned directly through the UK postal service, with postage prepaid. Respondents were also given a link at which they could complete the survey online if they preferred. The online survey comprised identical questions and descriptive text to those shown on the paper survey and was hosted using the university’s secure online survey software. In total 652 paper questionnaires were returned with a further 46 completed online. The total of 698 returns represents a response rate of 6.5% against the distributed surveys. The paper surveys were manually coded; a numerical system was used for the quantitative questions and qualitative answers were fully transcribed. Every case was given a unique serial number for ease of reference. The electronic and paper responses were combined into a single master file for subsequent statistical analysis.
2.5. Statistical Analysis
Each question in the survey was assessed using appropriate descriptive statistics. For the Likert scale-based questions, percentages of respondents giving answers at the five points were reported. Mileage driven was converted into categorical bands and a median value calculated. Each question was tested against three groups: age, gender and reported confidence driving during hours of darkness. Further statistical analysis was undertaken to investigate potential relationships between driver confidence, mileage driven and journey frequency. For the open-ended questions, content analysis was undertaken and responses grouped by theme. Active road stud themes were identified and grouped into: psychological effects; physiological effects; operation and maintenance; potential for wider use and general opinions. Non-stud related themes were grouped into route upgrading; lighting at junctions; and sign clutter.
Quantitative statistical analysis of the returns was undertaken using Statistical Package for the Social Sciences (SPSS) v23 (IBM). Cronbach’s alpha was determined to validate the internal consistency of the scale questions, with values below 0.5 taken as unacceptable [41]. Association between variables was identified using Pearson’s chi-squared (χ2). The null hypothesis was that there is no association between the tested variables with the alternative hypothesis being that an association could be inferred. The significance level was set at 5%, meaning any variable pairs with p < 0.05 were taken to have associated inferred. Effect size was measured using Cramér’s V (φc), giving values between 0 (no association) and 1 (complete association). For the paired ranked ordinal variables, Spearman’s correlation coefficients (ρ) have also been calculated to determine the strength and type of association. Effect size definitions have been taken as +/−0.1 as small, +/−0.3 as moderate and +/−0.5 as large [42]. Qualitative content analysis of the open-ended question was undertaken using the software package NVivo Pro v12 (QSR International, Melbourne, Australia).
3. Results
3.1. Survey Demographics
The modal category of the sample was the 60–69 age group, with the variation ratio 0.671 showing a reasonable spread of data in the other categories. In response to the question on gender (n = 589), 64.2% were male with 35.8% female. This would seem consistent with the likely demographic of respondents; meta-analysis of studies has shown women are more than twice as likely as men to self-regulate their driving as they get older [43]. Overall, 8.2% of respondents stated they had been involved in at least one road accident within the last five years. 2.5% of respondents (n = 521) stated that at least one of the accidents they had been involved in within the last five years was during hours of darkness. The modal category for the number of miles driven per year was 10,000–14,999, with the overall majority (73.6%) driving fewer than 15,000 miles per year.
3.2. Levels of Driver Confidence
Respondents were asked to describe how they felt about driving on the A1. Overall, 87% reported positive levels of confidence during hours of daylight; this number fell to 52% when asked how they felt driving during hours of darkness. Internal consistency was relatively low in this case (α = 0.63), although this may be explained by the small number of items on this test. Analysis of confidence and activity against demographic is shown in Table 1, where no association was found between confidence and age. Previous involvement in a collision did not affect daytime driving confidence, but those that had had an accident reported a lower level of confidence at night (χ2(2) = 5.981, p = 0.05). Driving confidence in males was found to be higher than in females, particularly at night (χ2(2) = 24.343, p < 0.01). Confidence driving at night appeared to increase with overall mileage driven (χ2(8) = 19.035, p = 0.01) with small to moderate correlation (ρ = 0.131, p < 0.01). Those who are socially inactive were less confident driving at night (χ2(2) = 5.969, p = 0.05); less confident drivers appear twice as likely to be socially inactive than more confident ones.
3.3. Importance of Road Features at Night
Respondents were asked to rate the importance of six road features at night. Street lighting at junctions was rated as important or very important by 83% of respondents. A total of 52% believed that lighting was important or very important on curves. Internal consistency across responses was found to be acceptable (α = 0.72). An analysis of road feature importance against respondent demographic is shown in Table 2. There was a significant difference (χ2(1) = 12.752, p < 0.01) by gender; less than half of the male respondents felt it was important compared with two-thirds of female respondents. The importance of street lighting on curves decreased with increasing driver confidence with small to moderate correlation (ρ = 0.118, p < 0.01). The presence of road studs was rated as important or very important by 93% at junctions and 89% on curves. White lining was rated for the same categories as 95% in the centre and 85% at the edge of the road. No association was found between the importance of any of the road features at night and the age of respondent.
3.4. Effects of the Active Road Stud
Drivers reported a very positive response to the active road stud as a road feature at night. Overall, 93% of respondents reported an improvement in the clarity of junctions, curves and lanes on the route. Positive changes in safety perception were also found. A total of 80% believed the overall safety of the A1 route had improved, with a third of respondents stating that their opportunities for travel had increased. In total, 72% of respondents reported an improved level of confidence driving in darkness. The level of internal consistency across responses was good (α = 0.81). Improvement in confidence was greatest at the moderate level of confidence, with the most and least confident drivers reporting a lower level of change (χ2(4) = 18.268, p < 0.01) as shown in Table 3. An association was also found between perception of speeding and age; younger drivers were more likely to perceive speeding had been reduced than older drivers (χ2(5) = 11.169, p < 0.05).
3.5. Awareness and Views on Wider Use
The greatest level of awareness of active road studs was found in the 40–49 age category with awareness reducing with age of driver (χ2(5) = 11.169, p < 0.05), as shown in Table 4. A small to moderate negative correlation between awareness and confidence was also found (ρ = −0.143, p < 0.01). No significant variation in awareness was found by gender. Across all demographics, support for wider use of the active road stud was very strong, with 94% of respondents agreeing or strongly agreeing with this statement.
3.6. Reasons for Views on the Stud
In the open-ended part of the questionnaire survey (n = 320), insights were provided into the reasons behind the effects of the active road stud. Results were grouped into comment types and notable comment examples as shown in Table 5. From a psychological perspective, respondents reported a perception of greater clarity of junctions, lanes and curves. Notably, being able to perceive the road beyond oncoming headlights was reported as particularly beneficial. Physiologically, some respondents reported lower levels of stress and fatigue, with others highlighting a reduction in overall glare. Issues of visual disturbance due to a flicker effect were noted by some. Questions were expressed about the longevity and maintenance implications; associated with this were observations that the experience of the active stud sections made the traditionally studded sections feel much poorer by comparison. This perceived superiority was reflected in a significant number of respondents commenting they would like to see wider or universal use of the active stud; a negligible proportion expressed concerns over additional cost. The remainder of respondents, around a third overall, made more general positive or highly positive statements associated with their experience without citing a specific reason for their view.
Respondent views on other road issues are summarised in Table 6. Comments made in relation to the route itself suggested that whilst active studs were deemed beneficial, some users still desired additional street lighting. Physical improvements suggested included upgrade of the route to dual carriageway and improvement of general maintenance. Perceived road safety issues included speeding, dangerous overtaking, failure to give way and poor driver behaviour. Respondents also reported issues of sign clutter and excess glare from road signs at night.
4. Discussion
This investigation aimed to examine changes in the perception of drivers using rural road links and junctions at night, following the installation of active road studs. Of relevance was the importance of active road studs to drivers relative to other road features such as lines, street lighting and traditional reflective studs. The case study used centred around a route where the actual statistical chances of being involved in a collision were average, but the fear of involvement in one was high. This perception of safety is of particular concern for elderly and less-confident users who may self-regulate their driving as result, with the potential consequences being a loss of independence and overall health. The cost and environmental impact of traditional interventions such as street lighting made the active road stud an intervention worthy of investigation.
Significantly, the response to the use of the active road stud was found to be highly positive across all demographic groups, with strong support for wider use on the road network. Most notable was that users believed the safety of the route had been improved with a resulting increase in confidence. Driving at night is a situation where driver confidence is recognised as being lower, often to the point of potential avoidance altogether [44,45]. This issue may disproportionately disadvantage specific groups such as elderly drivers and thereby affect their quality of life [46,47]. In improving driver confidence, it is suggested that the active road stud may potentially contribute to addressing such concerns, particularly in situations where alternative travel options are limited, such as rural areas.
Both the quantitative and qualitative data presented suggest the first reason for the increase in driver confidence related to the studs is the improvement in clarity of road features, such as junctions and curves. This finding is intuitive; a typical European low beam headlight is at best only able to illuminate up to just under 100 m from the lateral centreline of the vehicle, with coverage at the edges of the road significantly less [48,49]. By contrast, an active road stud can potentially be seen to distances of over 600 m [50]. Difficulty in judging distances to junctions is cited in studies as being a reason for problems with driving at night by users [51,52]. In this regard, provision of active road studs would seem to potentially contribute to reducing this concern for rural drivers.
The responses to the survey also suggest that the active road stud not only assists in highlighting the road itself, but also in mitigating difficulties caused by the presence of other vehicles. Up to half of drivers across all demographic groups have previously reported the lights from other vehicles restricting their vision whilst driving at night [53,54]. Ultimately this issue can result in driving cessation, particularly in older females, where low-contrast acuity in glare has been found to be a contributory factor [55]. In the present study, users reported a benefit in being able to perceive the road beyond the headlights of approaching vehicles. By providing additional definition to the road alignment, the presence of active road studs would appear to be of assistance to all drivers, particularly those with higher levels of glare or contrast sensitivity.
Despite these apparent benefits, the survey also found a residual demand for further street lighting to be provided. This would support the suggestion that drivers rely most heavily on their photopic visual acuity, and that situations in which mesopic vision is important such as night driving are more problematic, particularly for elderly users [56,57]. Establishment of a fully lit road network would be impractical both in cost and environmental terms and in this regard compromises are inevitable. Provision of active road studs would appear to at the very least narrow the discomfort and anxiety changes experienced between the different night driving conditions. In this particular case study, a negligible number reported some visual distraction, but contrary to what has previously been reported [58], no significant evidence was found to suggest the studs would exacerbate glare and justify dimming.
On general confidence in driving in darkness, associations found here suggest differences between demographic groups are apparent. Drivers were found to be less confident at night in general, with female respondents being less confident than males. Confidence was also found to increase with mileage driven, echoing findings elsewhere [59]. No association was found between confidence and age, although this could be explained by the focus on a driver-based sample of the current study and the potential exclusion of some older drivers who are already self-restricting [46,53]. Previous involvement in a collision has been found to reduce driver confidence in various situations [25,60]; the results here suggest a greater significance on reduced driving confidence at night may be apparent.
There are several road features that could assist with driver confidence at night and this work found that effectiveness varies by situation. Street lighting was found to be important at junctions but less so on curves. This may be associated with the assertion that increased luminance has been shown to potentially reduce concentration and centreline adherence on curved sections of road [7,23]. Road studs were rated more highly than lighting at junctions, but particularly so for curves. This could be explained by the benefits that road studs provide in terms of increased preview time of the road ahead, which is of most importance when negotiating curved sections [61]. White lining at both the centre and edges of carriageway was deemed important by all groups. Overall, there was no association between importance of any feature and age. Female drivers found street lighting more important than male drivers and notably overall, the importance of lighting diminished with increasing confidence.
The diminishing of the importance of lighting with increasing confidence due to other road features, in particular the active road stud, is a key contribution to knowledge made by this study. In practice, what this may suggest is that in situations where lighting brings with it a high cost (either financial or environmental) or potential disbenefit (decreased concentration or increased speeds), the active road stud might be considered as a viable alternative by road engineers. In this way, the active road stud could contribute to increasing driver confidence at night and thereby potentially opening journey opportunities, particularly where alternative modes are limited. Given the issue of confidence driving at night is known to disproportionately affect female and elderly road users, use of such a measure could also address concerns of equality in access to transport, particularly in rural areas.
Whilst the results of this study are believed to be high in ecological validity, two limitations need to be noted. Firstly, the focus of the survey was on those who drive rather than those who do not. The distribution of one survey per postal address also means there is a possibility that the views of other household members, who may be less confident, might not have been captured. Consequently, in relative terms, the results presented here may not comprehensively represent the views of the lowest confidence drivers. The second limitation concerns the assumption that a change in confidence relates to a real change in behaviour. It has been suggested that in some situations, stated self-regulation has a limited relationship with actual objectively measured driving patterns [62,63]. In this regard, although this study shows significant potential for the translation of increased confidence into improved journey opportunities, this may be open to challenge. To address this, further work in this area such as longitudinal study of changes in travel patterns where active studs had been installed would seem appropriate.
Finally, it is worth reinforcing that this investigation has focused on the effect of active road studs specifically on the perception of safety of drivers. In this regard, it would appear from the results presented that the studs have a high level of benefit at a relatively low cost, particularly when compared with the installation of street lighting. Potentially, there may be even greater benefits arising from implementation of the studs, but these could only be quantified if the resultant actual changes in road safety are also accounted for. Whilst, for example, this study has suggested drivers may perceive a difference in the level of speeding on a treated route, user opinion alone does not mean there has been a real change. Any collision cost savings from improved speed limit compliance, better lane discipline and gap acceptance can only be ascertained through a trend analysis of night-time casualties before and after installation. Such analysis was beyond the scope of this study but is certainly worthy of further investigation.
5. Conclusions
This study is the first to investigate the effects of the use of active road studs on the confidence of drivers at night in a real-world case study. The evidence presented here contributes to understanding the importance of features to road users whilst driving in hours of darkness. This work suggested that whilst demand for street lighting may remain, active road studs have a significant positive effect on driver confidence where installed. This increase in confidence appears to be mainly due to an improved preview time of the road ahead, combined with assisting mitigation of the detrimental effects of glare from oncoming vehicles. Benefits can be expected across all user groups, with particular benefits for elderly and female drivers. It is suggested that positive improvements to journey opportunities may result, although further study may be required to confirm this. Nevertheless, it is anticipated the work here should provide confidence to roads engineers that the active road stud is likely to be of benefit to road users. On this basis, the stud may be considered a more sustainable intervention than street lighting, particularly in circumstances where driver safety perception is an issue. In this respect these findings are considered relevant and significant to practitioners.
Author Contributions
Conceptualization, R.L. and J.C.; methodology, R.L.; software, R.L.; validation, J.C., and M.M.; formal analysis, R.L.; investigation, R.L.; resources, R.L.; data curation, R.L.; writing—original draft preparation, R.L.; writing—review and editing, R.L., J.C. and M.M.; visualization, R.L.; supervision, J.C. and M.M.; project administration, R.L. All authors have read and agreed to the published version of the manuscript.
Funding
This research received no external funding.
Acknowledgments
The authors would like to thank Amey for facilitating inspection of the installation of the works during construction and Transport Scotland for provision of background information regarding the scheme.
Conflicts of Interest
The authors declare no conflict of interest.
References
- Beyer, F.R.; Ker, K. Street lighting for preventing road traffic injuries. Cochrane Database Syst. Rev. 2009. [Google Scholar] [CrossRef] [Green Version]
- Commission Internationale de L’Eclairage. Road Lighting as an Accident Countermeasure; Commission Internationale de L’Eclairage: Vienna, Austria, 1992; Volume 93, ISBN 978 3 900734 30 5. [Google Scholar]
- Elvik, R. Meta-analysis of evaluations of public lighting as accident countermeasure. Transp. Res. Rec. 1995, 1485, 113–123. [Google Scholar]
- Wanvik, P.O. Effects of road lighting: An analysis based on Dutch accident statistics 1987–2006. Accid. Anal. Prev. 2009, 41, 123–128. [Google Scholar] [CrossRef]
- Jackett, M.; Frith, W. Quantifying the impact of road lighting on road safety—A New Zealand Study. IATSS Res. 2013, 36, 139–145. [Google Scholar] [CrossRef] [Green Version]
- Anarkooli, A.J.; Hosseinlou, M.H. Analysis of the injury severity of crashes by considering different lighting conditions on two-lane rural roads. J. Saf. Res. 2016, 56, 57–65. [Google Scholar] [CrossRef] [PubMed]
- Assum, T.; Bjørnskau, T.; Fosser, S.; Sagberg, F. Risk compensation—The case of road lighting. Accid. Anal. Prev. 1999, 31, 545–553. [Google Scholar] [CrossRef]
- Jägerbrand, A.K.; Sjöbergh, J.; Martins, M.; Pereira, N.; Reis, R.; Tomaz, E.; Jägerbrand, A.K.; Sjöbergh, J. Effects of weather conditions, light conditions, and road lighting on vehicle speed. SpringerPlus 2016, 5, 505. [Google Scholar] [CrossRef]
- Bhagavathula, R.; Gibbons, R.B.; Edwards, C.J. Relationship between Roadway Illuminance Level and Nighttime Rural Intersection Safety. Transp. Res. Rec. J. Transp. Res. Board 2015, 2485, 8–15. [Google Scholar] [CrossRef]
- Bullough, J.D.; Donnell, E.T.; Rea, M.S. To illuminate or not to illuminate: Roadway lighting as it affects traffic safety at intersections. Accid. Anal. Prev. 2013, 53, 65–77. [Google Scholar] [CrossRef]
- Goswamy, A.; Hallmark, S.; Litteral, T.; Pawlovich, M. Safety Evaluation of Destination Lighting Treatment at Stop Controlled Cross-Intersections. Transp. Res. Rec. J. Transp. Res. Board 2018, 2672, 113–121. [Google Scholar] [CrossRef]
- Huang, H.; Chin, H.C.; Haque, M. Severity of driver injury and vehicle damage in traffic crashes at intersections: A Bayesian hierarchical analysis. Accid. Anal. Prev. 2008, 40, 45–54. [Google Scholar] [CrossRef] [PubMed]
- Donnell, E.T.; Porter, R.J.; Shankar, V.N. A framework for estimating the safety effects of roadway lighting at intersections. Saf. Sci. 2010, 48, 1436–1444. [Google Scholar] [CrossRef]
- Oxley, J.; Fildes, B.; Corben, B.; Langford, J. Intersection design for older drivers. Transp. Res. Part F Traffic Psychol. Behav. 2006, 9, 335–346. [Google Scholar] [CrossRef]
- Dissanayake, S.; Lu, J.J.; Yi, P.E.P. Driver Age Differences in Day and Night Gap Acceptance Capabilities. IATSS Res. 2002, 26, 71–79. [Google Scholar] [CrossRef] [Green Version]
- Shergold, I.; Lyons, G.; Hubers, C. Future mobility in an ageing society—Where are we heading? J. Transp. Heal. 2015, 2, 86–94. [Google Scholar] [CrossRef] [Green Version]
- Taylor, B.D.; Tripodes, S. The effects of driving cessation on the elderly with dementia and their caregivers. Accid. Anal. Prev. 2001, 33, 519–528. [Google Scholar] [CrossRef]
- Ryan, J.; Wretstrand, A. What’s mode got to do with it? Exploring the links between public transport and car access and opportunities for everyday activities among older people. Travel Behav. Soc. 2019, 14, 107–118. [Google Scholar] [CrossRef]
- Musselwhite, C.; Holland, C.; Walker, I. The role of transport and mobility in the health of older people. J. Transp. Heal. 2015, 2, 1–4. [Google Scholar] [CrossRef] [Green Version]
- Scheiner, J. Does the car make elderly people happy and mobile? Settlement structures, car availability and leisure mobility of the elderly. Eur. J. Transp. Infrastruct. Res. 2006, 6, 151–172. [Google Scholar]
- Shergold, I.; Parkhurst, G.; Musselwhite, C. Rural car dependence: An emerging barrier to community activity for older people. Transp. Plan. Technol. 2012, 35, 69–85. [Google Scholar] [CrossRef]
- Luiu, C.; Tight, M.; Burrow, M.P.N. An investigation into the factors influencing travel needs during later life. J. Transp. Heal. 2018, 11, 86–99. [Google Scholar] [CrossRef]
- Easa, S.M.; Reed, M.J.; Russo, F.; Dabbour, E.; Mehmood, A.; Curtis, K. Effect of increasing road light luminance on night driving performance of older adults. Int. J. Civ. Environ. Eng. 2010, 4, 201–208. [Google Scholar]
- Owens, D.A.; Wood, J.M.; Owens, J.M. Effects of age and illumination on night driving: A road test. Hum. Factors J. Hum. Factors Ergon. Soc. 2007, 49, 1115–1131. [Google Scholar] [CrossRef] [PubMed]
- Ball, K.K.; Owsley, C.; Stalvey, B.; Roenker, D.L.; Sloane, M.E.; Graves, M. Driving avoidance and functional impairment in older drivers. Accid. Anal. Prev. 1998, 30, 313–322. [Google Scholar] [CrossRef]
- Nordbakke, S.T.D.; Schwanen, T. Transport, unmet activity needs and wellbeing in later life: Exploring the links. Transportation 2014, 42, 1129–1151. [Google Scholar] [CrossRef]
- Escolar, S.; Carretero, J.; Marinescu, M.-C.; Chessa, S. Estimating Energy Savings in Smart Street Lighting by Using an Adaptive Control System. Int. J. Distrib. Sens. Netw. 2014, 10. [Google Scholar] [CrossRef]
- Shahzad, K.; Čuček, L.; Sagir, M.; Ali, N.; Rashid, M.I.; Nazir, R.; Nizami, A.S.; Al-Turaif, H.A.; Ismail, I.M.I. An ecological feasibility study for developing sustainable street lighting system. J. Clean. Prod. 2018, 175, 683–695. [Google Scholar] [CrossRef]
- Ciriminna, R.; Meneguzzo, F.; Albanese, L.; Pagliaro, M. Solar street lighting: A key technology en route to sustainability. Wiley Interdiscip. Rev. Energy Environ. 2016, 6, e218. [Google Scholar] [CrossRef]
- Gil-De-Castro, A.; Moreno-Munoz, A.; Larsson, A.; De La Rosa, J.; Bollen, M. LED street lighting: A power quality comparison among street light technologies. Light. Res. Technol. 2012, 45, 710–728. [Google Scholar] [CrossRef] [Green Version]
- Lyytimäki, J.; Tapio, P.; Assmuth, T. Unawareness in environmental protection: The case of light pollution from traffic. Land Use Policy 2012, 29, 598–604. [Google Scholar] [CrossRef]
- Fotios, S.; Price, T. Road lighting and accidents: Why lighting is not the only answer. Light J. 2017, 82, 22–26. [Google Scholar]
- Riendeau, J.A.; Maxwell, H.; Patterson, L.; Weaver, B.; Bédard, M. Self-rated confidence and on-road driving performance among older adults. Can. J. Occup. Ther. 2016, 83, 177–183. [Google Scholar] [CrossRef] [PubMed]
- Marottoli, R.A.; Richardson, E.D. Confidence in, and self-rating of, driving ability among older drivers. Accid. Anal. Prev. 1998, 30, 331–336. [Google Scholar] [CrossRef]
- Boys, J.T.; Green, A.W. Intelligent road-studs-lighting the paths of the future. Trans. Inst. Prof. Eng. New Zeal. Gen. Sect. 1997, 24, 33–40. [Google Scholar]
- Styles, T.; Cairney, P.; Studwick, G.; Purtill, S. Trial and Evaluation of Internally Illuminated Pavement Markers. In Proceedings of the Road Safety Research, Policing and Education Conference, Sydney, Australia, 24–26 September 2003; Volume 2, pp. 550–555. [Google Scholar]
- Shahar, A.; Brémond, R.; Villa, C. Can light emitting diode-based road studs improve vehicle control in curves at night? A driving simulator study. Light. Res. Technol. 2016, 50, 266–281. [Google Scholar] [CrossRef]
- Reed, N. PPR143 Driver Behaviour in Response to Actively Illuminated Road Studs: A Simulator Study; Transport Research Laboratory: Crowthorne, UK, 2006. [Google Scholar]
- Scottish Borders Council Minutes of the Berwickshire Area Forum-3 September 2015. Available online: https://scottishborders.moderngov.co.uk/ieListDocuments.aspx?CId=183&MID=252#AI2933 (accessed on 17 April 2020).
- Department for Transport Reported Road Casualties Great Britain 2017. Available online: https://assets.publishing.service.gov.uk/government/uploads/system/uploads/attachment_data/file/755698/rrcgb-2017.pdf (accessed on 17 April 2020).
- George, D.; Mallery, M. Using SPSS for Windows Step by Step: A Simple Guide and Reference; Allyn & Bacon: Boston, MA, USA, 2003. [Google Scholar]
- Cohen, J. Statistical Power Analysis for the Behavioural Sciences, 2nd ed.; Academic Press: New York, NY, USA, 1988. [Google Scholar]
- Ang, B.H.; Oxley, J.A.; Chen, W.S.; Yap, K.K.; Song, K.P.; Lee, S.W.H. To reduce or to cease: A systematic review and meta-analysis of quantitative studies on self-regulation of driving. J. Saf. Res. 2019, 70, 243–251. [Google Scholar] [CrossRef]
- Taylor, J.E. The extent and characteristics of driving anxiety. Transp. Res. Part F Traffic Psychol. Behav. 2018, 58, 70–79. [Google Scholar] [CrossRef]
- Charlton, J.; Oxley, J.; Fildes, B.; Oxley, P.; Newstead, S.; Koppel, S.; O’Hare, M. Characteristics of older drivers who adopt self-regulatory driving behaviours. Transp. Res. Part F Traffic Psychol. Behav. 2006, 9, 363–373. [Google Scholar] [CrossRef]
- Moták, L.; Gabaude, C.; Bougeant, J.-C.; Huet, N. Comparison of driving avoidance and self-regulatory patterns in younger and older drivers. Transp. Res. Part F Traffic Psychol. Behav. 2014, 26, 18–27. [Google Scholar] [CrossRef]
- Nordbakke, S.T.D.; Schwanen, T. Well-being and Mobility: A Theoretical Framework and Literature Review Focusing on Older People. Mobilities 2014, 9, 104–129. [Google Scholar] [CrossRef]
- Boyce, P.R. Lighting for Driving: Roads, Vehicles, Signs, and Signals; CRC Press: Boca Raton, FL, USA, 2009; ISBN 1420008153. [Google Scholar]
- Dumont, E.; Brémond, R.; Hautière, N. Night-time visibility as a function of headlamp beam pattern and pavement reflection properties. In Proceedings of the International Congress VISION, Satory, France, 7–8 October 2008; pp. 1–7. [Google Scholar]
- Migletz, J.; Graham, J. Long-Term Pavement-Marking Practices (NCHRP Synthesis of Highway Practice No. 306); Transportation Research Board: Washington, DC, USA, 2002. [Google Scholar]
- Owsley, C.; McGwin, G.; Scilley, K.; Kallies, K. Development of a Questionnaire to Assess Vision Problems under Low Luminance in Age-Related Maculopathy. Investig. Opthalmology Vis. Sci. 2006, 47, 528–535. [Google Scholar] [CrossRef] [PubMed] [Green Version]
- Kimlin, J.A.; Black, A.A.; Djaja, N.; Wood, J.M. Development and validation of a vision and night driving questionnaire. Ophthalmic Physiol. Opt. 2016, 36, 465–476. [Google Scholar] [CrossRef] [Green Version]
- Karali, S.; Gyi, D.E.; Mansfield, N.J. Driving a better driving experience: A questionnaire survey of older compared with younger drivers. Ergonomics 2016, 60, 533–540. [Google Scholar] [CrossRef] [PubMed]
- Mortimer, R.G.; Fell, J.C. Older drivers: Their night fatal crash involvement and risk. Accid. Anal. Prev. 1989, 21, 273–282. [Google Scholar] [CrossRef]
- Brabyn, J.A.; Schneck, M.E.; A Lott, L.; Haegerström-Portnoy, G. Night Driving Self-Restriction: Vision Function and Gender Differences. Optom. Vis. Sci. 2005, 82, 755–764. [Google Scholar] [CrossRef] [PubMed]
- Gruber, N.; Mosimann, U.P.; Müri, R.; Nef, T. Vision and Night Driving Abilities of Elderly Drivers. Traffic Inj. Prev. 2013, 14, 477–485. [Google Scholar] [CrossRef]
- Wood, J.M. Nighttime driving: Visual, lighting and visibility challenges. Ophthalmic Physiol. Opt. 2019, 40, 187–201. [Google Scholar] [CrossRef] [Green Version]
- Villa, C.; Brémond, R.; Jacques, E.S. Visibility and discomfort glare of LED road studs. Light. Res. Technol. 2014, 47, 945–963. [Google Scholar] [CrossRef]
- Naumann, R.B.; Dellinger, A.M.; Kresnow, M.-J. Driving self-restriction in high-risk conditions: How do older drivers compare to others? J. Saf. Res. 2011, 42, 67–71. [Google Scholar] [CrossRef]
- Mayou, R.; Simkin, S.; Threlfall, J. The effects of road traffic accidents on driving behaviour. Injury 1991, 22, 365–368. [Google Scholar] [CrossRef]
- Commission Internationale de L’Eclairage (CIE). Visual Aspects of Road Markings; Commission Internationale de L’Eclairage (CIE): Vienna, Austria, 1988. [Google Scholar]
- Thompson, J.P.; Baldock, M.R.J.; Mathias, J.L.; Wundersitz, L.N. A comparison of reported driving self-regulation by older adults and GPS-based measurements of their actual driving exposure. Road Transp. Res. J. Aust. N. Zeal. Res. Pract. 2016, 25, 16. [Google Scholar]
- Kaye, S.-A.; Lewis, I.; Freeman, J. Comparison of self-report and objective measures of driving behavior and road safety: A systematic review. J. Saf. Res. 2018, 65, 141–151. [Google Scholar] [CrossRef] [PubMed]
Figure 1.
Installation process for the active road stud.

Figure 2.
Examples of active road stud use on study route.

Figure 3.
Sample and population age group comparison.

Figure 4.
Postcode sectors covered by questionnaire survey along treated route.


Table 1.
Levels of driver confidence and activity.
| Driving Confidence and Activity Level | Respondent Demographic | n | χ2 (df) | p | φc | ρ |
|---|---|---|---|---|---|---|
| Confidence (day) | Age | 689 | 5.703(10) | 0.840 | 0.064 | −0.034 |
| Confidence (night) | Age | 677 | 7.702(10) | 0.658 | 0.075 | −0.003 |
| Confidence (day) | Collisions (all) | 690 | 0.860(2) | 0.650 | 0.035 | n/a |
| Confidence (night) | Collisions (all) | 677 | 5.981(2) | 0.050 * | 0.094 | n/a |
| Confidence (day) | Gender | 586 | 10.354(2) | 0.006 * | 0.133 | n/a |
| Confidence (night) | Gender | 577 | 24.343(2) | 0.000 * | 0.205 | n/a |
| Confidence (day) | Mileage | 661 | 10.604(8) | 0.225 | 0.090 | 0.095 |
| Confidence (night) | Mileage | 648 | 19.035(8) | 0.015 * | 0.121 | 0.131 |
| Socially Active | Age | 694 | 10.436(5) | 0.064 | 0.123 | n/a |
| Socially Active | Confidence (night) | 679 | 5.969(2) | 0.051 * | 0.094 | n/a |
* Denotes significant result (p < 0.05).
Table 2.
Importance of road features at night by respondent demographic.
| Road Feature | Respondent Demographic | n | χ2 (df) | p | φc | ρ |
|---|---|---|---|---|---|---|
| Street lighting (junctions) | Age | 681 | 2.945(5) | 0.708 | 0.066 | 0.052 |
| Street lighting (curves) | Age | 681 | 1.188(5) | 0.864 | 0.053 | −0.007 |
| Road studs (junctions) | Age | 683 | 2.522(5) | 0.773 | 0.061 | −0.009 |
| Road studs (curves) | Age | 681 | 2.394(5) | 0.792 | 0.059 | −0.017 |
| White lines (road edge) | Age | 682 | 8.072(5) | 0.152 | 0.109 | 0.074 |
| White lines (road centre) | Age | 682 | 4.061(5) | 0.541 | 0.077 | 0.034 |
| Street lighting (junctions) | Gender | 578 | 0.011(1) | 0.917 | 0.004 | n/a |
| Street lighting (curves) | Gender | 562 | 12.752(1) | 0.000 * | 0.151 | n/a |
| Road studs (junctions) | Gender | 580 | 0.066(1) | 0.797 | 0.011 | n/a |
| Road studs (curves) | Gender | 576 | 0.203(1) | 0.652 | 0.019 | n/a |
| White lines (road edge) | Gender | 579 | 2.569(1) | 0.109 | 0.067 | n/a |
| White lines (road centre) | Gender | 578 | 0(1) | 1.000 | 0.000 | n/a |
| Street lighting (junctions) | Confidence (night) | 669 | 3.345(4) | 0.502 | 0.071 | −0.062 |
| Street lighting (curves) | Confidence (night) | 650 | 11.596(4) | 0.021 * | 0.134 | −0.121 |
| Road studs (junctions) | Confidence (night) | 671 | 2.605(4) | 0.626 | 0.062 | −0.004 |
| Road studs (curves) | Confidence (night) | 669 | 3.626(4) | 0.459 | 0.074 | −0.056 |
| White lines (road edge) | Confidence (night) | 670 | 4.508(4) | 0.342 | 0.082 | −0.077 |
| White lines (road centre) | Confidence (night) | 671 | 6.842(4) | 0.144 | 0.101 | 0.016 |
* Denotes significant result (p < 0.05).
Table 3.
Changes due to the active road stud by respondent demographic.
| Change Resulting from Active Road Stud | Respondent Demographic | n | χ2 (df) | p | φc | ρ |
|---|---|---|---|---|---|---|
| Clarity of junctions | Age | 654 | 7.357(5) | 0.195 | 0.106 | 0.037 |
| Clarity of curves/bends | Age | 649 | 4.202(5) | 0.521 | 0.080 | 0.045 |
| Clarity of lanes | Age | 648 | 1.382(5) | 0.926 | 0.046 | 0.011 |
| Confidence driving in darkness | Age | 656 | 2.887(5) | 0.717 | 0.066 | 0.042 |
| My opportunities for travel | Age | 591 | 3.943(5) | 0.558 | 0.082 | 0.052 |
| Overall safety of the A1 | Age | 657 | 1.197(5) | 0.945 | 0.043 | 0.033 |
| Incidence of speeding on the A1 | Age | 630 | 11.169(5) | 0.048 * | 0.133 | 0.021 |
| Clarity of junctions | Gender | 556 | 1.327(1) | 0.249 | 0.049 | n/a |
| Clarity of curves/bends | Gender | 552 | 1.072(1) | 0.301 | 0.044 | N/a |
| Clarity of lanes | Gender | 550 | 0.610(1) | 0.435 | 0.033 | N/a |
| Confidence driving in darkness | Gender | 558 | 0.041(1) | 0.839 | 0.009 | N/a |
| My opportunities for travel | Gender | 498 | 0.031(1) | 0.860 | 0.008 | N/a |
| Overall safety of the A1 | Gender | 561 | 0.031(1) | 0.860 | 0.007 | N/a |
| Incidence of speeding on the A1 | Gender | 536 | 1.648(1) | 0.199 | 0.055 | N/a |
| Clarity of junctions | Confidence (night) | 642 | 6.519(4) | 0.164 | 0.101 | 0.048 |
| Clarity of curves/bends | Confidence (night) | 638 | 3.698(4) | 0.448 | 0.076 | −0.003 |
| Clarity of lanes | Confidence (night) | 637 | 8.611(4) | 0.072 | 0.116 | 0.022 |
| Confidence driving in darkness | Confidence (night) | 645 | 18.268(4) | 0.001 * | 0.168 | −0.044 |
| My opportunities for travel | Confidence (night) | 582 | 1.846(4) | 0.764 | 0.056 | −0.034 |
| Overall safety of the A1 | Confidence (night) | 644 | 7.808(4) | 0.099 | 0.110 | 0.087 |
| Incidence of speeding on the A1 | Confidence (night) | 618 | 3.289(4) | 0.511 | 0.073 | −0.009 |
* Denotes significant result (p < 0.05).
Table 4.
Awareness of stud and views on wider use by respondent demographic
| Awareness and View on Use | Respondent Demographic | n | χ2 (df) | p | φc | ρ |
|---|---|---|---|---|---|---|
| Awareness of studs | Age | 680 | 13.211(5) | 0.021 * | 0.139 | 0.067 |
| Awareness of studs | Gender | 579 | 0.594(1) | 0.441 | 0.032 | n/a |
| Awareness of studs | Confidence (night) | 667 | 14.732(4) | 0.001 * | 0.148 | −0.143 |
| More widely used? | Age | 684 | 5.549(5) | 0.353 | 0.090 | 0.058 |
| More widely used? | Gender | 582 | 3.198(1) | 0.074 | 0.074 | n/a |
| More widely used? | Confidence (night) | 669 | 2.125(4) | 0.713 | 0.056 | 0.029 |
* Denotes significant result (p < 0.05).
Table 5.
Comment type and frequency on active road studs.
| Type of Comment | Freq. | Notable Comment |
|---|---|---|
| Psychological effects | ||
| Benefit junction perception | 31 | It is much clearer where the junction is to turn off the A1 now in the dark. |
| Benefit forward lane visibility | 18 | Excellent visibility of lanes, most strikingly visibility behind the [oncoming] vehicle |
| Assist in adverse conditions | 10 | It is much clearer to drive in the dark, especially in bad weather conditions. |
| Benefit curve perception | 7 | Ability to see studs beyond range of headlights very useful, especially where road curves. |
| Confusion over colours | 3 | I haven’t yet worked out what the colours mean. Need to be in Highway Code. |
| Unexpected benefit | 2 | These studs allowed me to see the outline of a deer! Which in turn allowed me to slow down sooner. |
| Physiological effects | ||
| Improved visual acuity | 9 | Give a good reference point for oncoming vehicles at junctions. |
| Reduces stress or fatigue | 7 | LED road studs have made it less stressful driving in the dark on A1 |
| Distraction or disturbance | 7 | I sometimes find them a bit “flickery”—maybe because it is so dark around them. |
| Reduces full beam glare | 3 | I don’t like driving with full-beam (too many signs, too much glare) so the LED road studs really make a difference to my experience |
| Operation and maintenance | ||
| Stud maintenance | 14 | They are great. Only problem I can see is if they fail, there will be no light. I hope they also have reflectors. |
| Continuity of use | 13 | The improved stretches of road make the original lengths appear much less satisfactory |
| Green credentials | 4 | An excellent use of green technology. |
| Wider use potential | ||
| Wider or universal use | 58 | They should be installed on all roads which have studs, being far superior to previous examples. |
| Cost concerns | 4 | I don’t feel it’s necessary to replace them. It’s an additional unnecessary cost. |
| Overall view | ||
| General positive statement | 105 | Find them excellent. Great improvement. |
| Lack of awareness | 6 | Not aware of any LED road studs. |
Table 6.
Comment type and frequency on other road issues.
| Type of Comment | Freq. | Notable Comment |
|---|---|---|
| More lighting | 40 | It is far better but junctions should be all lit up. |
| Dual carriageway upgrade | 38 | The A1 should be dual carriageway throughout. |
| Speed or safety enforcement | 15 | More needs to be done about speeding motorists and dangerous overtaking. |
| General road safety | 14 | The biggest problem is road rage and over/undertaking. I have had some scary experiences of angry drivers! |
| Improve general maintenance | 14 | Road surfacing in general—very bad in places. |
| Junction improvements | 12 | Less roundabouts—seen too many near accidents because of people not giving way to traffic. |
| Sign clutter and glare | 5 | At night too many road signs in one place give too much glare back to driver. |
Publisher’s Note: MDPI stays neutral with regard to jurisdictional claims in published maps and institutional affiliations. |
© 2020 by the authors. Licensee MDPI, Basel, Switzerland. This article is an open access article distributed under the terms and conditions of the Creative Commons Attribution (CC BY) license (http://creativecommons.org/licenses/by/4.0/).
Share and Cite
MDPI and ACS Style
Llewellyn, R.; Cowie, J.; Maher, M. Active Road Studs as an Alternative to Lighting on Rural Roads: Driver Safety Perception. Sustainability 2020, 12, 9648. https://0-doi-org.brum.beds.ac.uk/10.3390/su12229648
AMA Style
Llewellyn R, Cowie J, Maher M. Active Road Studs as an Alternative to Lighting on Rural Roads: Driver Safety Perception. Sustainability. 2020; 12(22):9648. https://0-doi-org.brum.beds.ac.uk/10.3390/su12229648
Chicago/Turabian StyleLlewellyn, Richard, Jonathan Cowie, and Mike Maher. 2020. "Active Road Studs as an Alternative to Lighting on Rural Roads: Driver Safety Perception" Sustainability 12, no. 22: 9648. https://0-doi-org.brum.beds.ac.uk/10.3390/su12229648
Note that from the first issue of 2016, this journal uses article numbers instead of page numbers. See further details here.