Estimation of the Non-Greenhouse Gas Emissions Inventory from Ships in the Port of Incheon


1
Graduate School of Logistics, Incheon National University, Incheon 22012, Korea
2
Department of Transportation Engineering, Unversity of Seoul, Seoul 02504, Korea
3
Department of Urban Design & Planning, Hongik University, Seoul 02504, Korea
*
Author to whom correspondence should be addressed.
Sustainability 2020, 12(19), 8231; https://0-doi-org.brum.beds.ac.uk/10.3390/su12198231
Submission received: 14 August 2020
/
Revised: 29 September 2020
/
Accepted: 29 September 2020
/
Published: 6 October 2020
(This article belongs to the Special Issue Sustainable Green Freight System Management)
Abstract
:Nowadays, maritime air pollution is regarded as a severe threat to coastal communities’ health. Therefore, many policies to reduce air pollution have been established worldwide. Moreover, there has been a shift in policy and research attention from greenhouse gases, especially CO2, to other air pollutants. To address the current local environmental challenges, this research analyzes the non-greenhouse gas emissions inventory (CO, NOx, SOx, PM, VOC, and NH3) from ships in the second biggest port in Korea, the Port of Incheon (POI). A bottom-up activity-based methodology with real-time vessel activity data produced by the Vessel Traffic Service (VTS) is applied to obtain reliable estimations. NOx and SOx dominated the amount of emission emitted from ships. Tankers, general cargo ships, cruise ships, and container ships were identified as the highest sources of pollution. Based on the above results, this study discusses the need for long-term policies, such as the designation of a local emission control area (ECA) and the establishment of an emission management platform to reduce ship-source emissions. Furthermore, this study elucidates that significant emissions come from the docking process, ranging from 33.9% to 42.0% depending on the type of pollutant when only the auxiliary engines were being operated. Therefore, short-term solutions like applying exhausted gas cleaning systems, using on-shore power supplies, reducing docking time, or using greener alternative fuels (e.g., liquefied natural gas or biofuels) should be applied and motivated at the POI. These timely results could be useful for air quality management decision-making processes for local port operators and public agencies.
1. Introduction
Although maritime transportation is generally accepted as a more environmentally friendly mode of transport, the enormous amount of pollutants emitted by international trade and the growth of port traffic have raised an increasing awareness of the shipping trade’s heavy influence on air pollution [1]. Greenhouse gases (GHGs), carbon monoxide (CO), nitrogen oxides (NOx), sulphur oxides (SOx), and particulate matter (PM, especially PM10—Particles with 10 microns and below—And PM2.5—Particles with 2.5 microns and below) are frequently considered the main pollutants from the combustion of ship engines. Experts expect that there will be a serious hike in ship emissions in the next 10–40 years due to the quick development of the e-commerce market and global trade [2]. In 2010, the amount of NOx emissions released from ships was assessed to be 15% of the total worldwide anthropogenic emissions, while the amount of sulphur dioxide (SO2, which accounted for 98% of emitted SOx) from ships was reported at 4–9% of the global total [3].
It is estimated that almost 70% of ship emissions in global routes are emitted within 400 km of the coast, of which 60–90% came from auxiliary engine operation during berthing [1,2,3,4]. After that, the emitted pollutants could travel toward the mainland, interconnecting with, and affecting, coastal environment conditions [5]. Therefore, in recent decades, close-to-land ship emissions, especially in-port emissions, and their serious impacts on the local atmosphere and the community’s health have received increasing attention from the public sector and research fields [6,7,8]. Researchers have proved that emissions can disturb climate (GHGs drive the radiative imbalance of the atmosphere), the coastal air quality (NOx and SOx contribute to acidification; NOx enhances surface ozone formation), and community health (NOx, SOx, PM, and CO decrease cardiovascular and cardiopulmonary functions and increase the rate of lung cancer and respiratory diseases) [5,6,9,10,11,12,13].
Several strong actions and policies have been contrived and conducted to cut down and limit non-GHG pollution, especially NOx and SOx, from ocean-going vessels. One of the most important decisions from the International Convention for the Prevention of Pollution for Ships in 1973 (MARPOL 73/78), proposed by the International Maritime Organization (IMO), regarded limiting ship pollutants from operations and accidents at sea. In 1997, Annex VI of MARPOL was adopted firstly in an effort to minimize ship pollution and emissions in light of technological improvements. IMO revised this annex to stringently regulate the marine fuel sulphur content for the entire fleet in 2008 and established four emission control areas (ECAs) on the Baltic Sea, North Sea, North America Sea, and the Caribbean Sea with no heavy fuel oil which includes over 0.1% of sulphur content by weight after 2015. In other oceans, the maximum level of sulphur content was 3.5% by weight from 2012 [14]. However, from 1 January 2020, a new rule set the maximum sulphur level down to 0.5% by weight [15]. Other than this, in the revised Annex VI, the IMO also released new standards for NOx emissions. However, they only apply to ships equipped with new engines [16].
To follow international regulations, the European Union (EU), the United States (US), and China also promulgated their emission standards and other technical documents. Beyond establishing ECAs, in a document known as “Sulphur Directive”, the EU also settled other limitations for sulphur content in fuels in 2016, such as (1) 1.5% by weight for passenger ships moving outside ECAs; and (2) 0.1% by weight for ships berthing or anchored within EU ports [17]. In the US, the Environmental Protection Agency (EPA) adopted the fourth federal standard (also known as Tier 4) in 2014, which required the maximum sulphur content to be at 0.0015% by mass from 2012 for the maritime sector [18]. The Chinese Ministry of Transport issued new regulations from 2019. The sulphur limit in burned marine fuel was set at 0.5% for all ships operating within 12 nautical miles from the baseline of Chinese territorial waters. Looking further ahead, a new sulphur limit of 0.1% will be set for two inland ECAs (the Yangtze River and the Xi Jiang River) from 1 January 2020, and then in the Hainan coastal area from 1 January 2022 [19].
In recent decades, the Korean government has made significant efforts to improve national air quality through 10-year comprehensive plans. The Ministry of Land, Infrastructure, and Transport established the “Air Quality Management Basic Plan” for the years 2015–2024 to establish and manage an integrated air management system. However, an effort to develop a reliable and continuous integrated national emission inventory under the Clean Air Policy Support System (CAPSS), that applied a top-down approach with the national average assumptions, showed inconsistencies and uncertainty with regard to other local studies [20]. This demonstrated the importance of estimation approach choice and the accuracy of traffic data used in estimations. Recently, the Korean government has also shown interest in other non-greenhouse gas emissions through the updated “Comprehensive Plan of Particular Matter Management”, in 2017, which detailed the new government’s target of a 30% reduction in PM emissions and a stricter standard for volatile organic compounds (VOCs) until 2022 [21].
The POI is located in Incheon (37.41841° N and 126.51175° E), the third-largest city in Korea. It is the gateway port of the north-west of Korea and the world’s 27th busiest port in terms of total cargo volume, as well as the 50th biggest container port [22]. A dense network of supporting transportation networks located around the POI could damage the local environment and threaten the community’s health. Thus, to address the current local environmental challenges, a reliable in-port ship emission inventory at the POI is required to examine the link between in-port ship emissions and local anthropogenic pollution, and then promote appropriate public policies related to the management of air pollution at ports and surrounding areas. Moreover, until now, the CAPSS has only updated national emission inventories until 2016, and most of the local academic studies focused only on CO2 emissions. Therefore, this study has attempted to apply a bottom-up approach with real-time traffic data in 2017, obtained from a new data source named Vessel Traffic Service (VTS) system, to examine non-GHG emissions emitted from ships, especially NOx, SOx, and PM emissions. Data on 17,316 ship calls from 2583 vessels were collected at the POI in 2017. As a result, 375.24 tons of CO, 4918.96 tons of NOx, 1454.55 tons of SOx, 170.64 tons of PM10 (including PM2.5), 156.84 tons of PM2.5, 177.78 tons of VOC, and 0.52 tons of NH3 were estimated. Then, based on the estimated emission inventory, available long-term and short-term policies for the POI port operators and local authorities will be suggested and discussed.
2. Literature Review
To meet the demand of developing a sustainable climate or air quality management system, it is necessary to create a detailed inventory of emissions, especially for high traffic maritime areas, such as seaports, to assess the environmental impacts from shipping activities [20,23]. Over the years, several different models have been developed to estimate port emission inventories, which vary greatly depending on the availability of the time and input data required. Since it is still extremely expensive for practical onboard investigation, theoretical methods are widely accepted in estimating in-port ship emissions [24]. There are two common approaches to assess ship emission inventories: the (1) top-down methodology (fuel-based) and (2) bottom-up methodology (activity-based).
2.1. Top-Down Approach
The top-down methodology is formed mainly based on the quantity and type of marine fuel sales and fuel-related emission factors (EFs) [23]. It is generally used in preparing emission inventories at both the national and global levels [25]. This method is applied when it is impossible to practically collect detailed traffic data. Therefore, this method was popularly applied in the late 1990s and 2000s [9,26,27,28]. Fuel consumption could be estimated:
The top-down approach was officially accepted by national agencies like the EU and US, and published in Tier 1 of the EEA Guidebook and US EPA’s Tier 1 and Tier 2 (Tier 2 replaced default EFs to US-specific EFs). Although this method could be applied widely, especially in developing countries, it is considered inaccurate because it does not take into account the real movement of ships [25,32].
2.2. Bottom-Up Approach
In contrast, when detailed information about ship specifications (e.g., ship type, engine characteristics, fuel type) and ship operational records (e.g., travel distances, speed, ship tracking, activity time) are available, it is better to use the bottom-up methodology [25]. Hence, with this method, specific amounts of air pollutants generated by a specific ship at a specific duration can be precisely estimated and then aggregated together to find out the total emitted amount of pollutants. In addition, it is normally agreed that the bottom-up methodology has higher accuracy because it requires detailed and exhaustive input such as ship specifications and ship-by-ship operational data [1,23]. However, for large- or global-scale studies, a bottom-up approach using the average inputs for calculations (e.g., engine load factors [LFs], fuel consumption rates, EFs) may result in uncertainties due to gaps in the data between ships or geographical regions [6,25].
Like the top-down approach, the bottom-up approach was also suggested by the EEA and US EPA in their publications [25,33], followed by various studies in different countries and ports all over the world. In Turkey, C. Deniz and A. Kilic identified NOx, SO2, CO2, HC, and PM emissions in the Izmit Gulf and Candarli Gulf [34,35,36]. In Greece, detailed NOx, SO2, and PM2.5 emissions from 18 cruise ports were examined in 2013 [3,37,38], while in the Port of Piraeus, emissions from ship calls in container terminals were discovered [39]. On the opposite side of the Mediterranean Sea, PM2.5, SO2, NOx, and VOC inventories in the Spanish port system [40], in general, a GHG inventory in the Port of Barcelona [41], and NOx, SOx, PM2.5, CO, and CO2 inventories in Las Palmas Port [42], in particular, were reported. Concerning the ports of northern Europe, while the meteorological method is popular in Danish ports, only an inventory and economic valuation of emissions from ships in the Port of Bergen, Norway, was estimated [43]. In Asia, studies are concentrated in the North Asia region, where the busiest ports in the world are located. In Chinas’ mainland, NOx, SO2, and PM2.5 emission inventories were calculated in the Yangtze River Delta port cluster (including the Port of Shanghai) [44]. Moreover, focused on the Yangshan port of Shanghai only, a comprehensive in-port ship emission inventory (GHGs, PM10, PM2.5, NOx, SOx, CO, and HC) and emission-associated social costs were estimated [1]. In Hong Kong, non-GHG emission inventories and policy change to control and regulate marine emissions were discussed [45,46]. In the case of Taiwan, as in the Yangsan Port, the comprehensive emission inventory at the Port of Kaohsiung and the environmental costs also were analyzed [47].
The common equation accepted generally through the bottom-up approach is expressed as:
where E is the volume of air pollutants emitted from a ship’s engine combustion, EF is the emission factor, and CF is the control factor from emission reduction technologies equipped on-board. There are two key methods to generate energy demand: as the energy output of the engine over the activity time [13,25,33,34,43,46,47], using Equation (2):
or as the fuel consumption of the engine over the activity time [48,49,50,51,52], as represented below:
where P is the engine power, LF is the load factor of the considered engine, T is the activity time, and FC is the fuel consumption per unit of time.
E = Energy demand. EF. CF
Energy demand = P. LF. T
Energy demand = FC. LF. T
2.3. Research Demand
The amount of detail in the data used in bottom-up approach studies can be enhanced by combining tracking systems such as the automatic identification system (AIS), to improve the final estimation and making it more reliable [23]. AIS was suggested by IMO and aims to improve safety and efficient navigation at sea. Therefore, it is required to be installed on all passenger ships and commercial ships greater than 300 gross tonnages (GT) [42]. Researchers discovered that AIS movement data could also be a reliable input for ship emission estimation studies using the bottom-up approach.
AIS is applied widely to improve estimation [1,17,42,44,45,46,47]. Recent years continue to see the dominance of AIS as the best data source for the bottom-up approach estimation. Chen et al. [53] invested in emissions emitted from merchant and fishing ships in the Bohai Rim during 2014, with data from AIS. Chen et al. [54] also examined the impact of PM2.5 emissions and the deposition of nitrogen and sulphur in the Yangtze River Delta, China. Next, Mao et al. [55] studied the impact of NOx, SO2, and PM2.5 emissions from ships, obtained from AIS, on the quality of coastal air at the Yangtze River Delta, China. Chen et al. [56] suggested the application of clean energy sources in the Pearl River Delta with AIS-based emission assessment. Based on the integrated AIS-based method, Li et al. [57] made a decadal assessment for Chinese ship emissions from 2004 to 2013. AIS big data was also applied to calculate ship emissions in the Port of Rio de Janeiro, Brazil [58].
However, AIS is not installed on ships with less than 300 GT. Furthermore, in several cases, the time gap and data gap, due to temporary signal disruption, may affect the accuracy of estimation. Huang et al. [59] introduced the dynamic way of obtaining, arranging, and accessing real-time AIS data with the spark streaming method. Besides, the full AIS database is not opened freely for public access, especially in the East Asia region. The AIS data before 2012 was also not good due to the lack of satellites and shore-based radars [57]. Sun [60] suggested the application of big data analysis technology to overcome the limitations of AIS.
Besides national emission inventories, few estimations of in-port ship emissions have been conducted in Korea. Cheong et al. [61] reported that emissions from ship movements in the Port of Busan (POB) accounted for 32% of all GHG transportation emissions in Busan. Shin and Cheong [62] calculated the GHG emission inventory using a fuel-based approach and data from POB. Chang et al. [50] applied the bottom-up approach using data related to fuel consumption and activity time to estimate emissions based on the characteristics and activities of individual ships in the Port of Incheon (POI). Chang et al. [51] assessed the potential of the ECA at the POI by focusing on the amount of NOx and SOx emissions. Khan et al. [52] applied the AIS to collect ship movement data and then estimated GHG emissions from ships at the POI in October 2014. Kwon et al. [63] developed an AIS-based software to track the CO, NOx, SO2, and PM10 emissions emitted from ships in the POI, but their data was only from December 2015.
Reviewing the literature, it is clear that both policy-makers and researchers have been gradually focusing on how to reduce non-GHGs like NOx, SOx, and PM. However, in Korea, among the above local studies, only Chang et al. [51] considered non-GHG emissions like NOx and SOx in their study. Moreover, using the national emission inventory with a top-down approach in the regional policy-making process is inappropriate because inaccuracy results could lead to misunderstandings about the outside environment. In addition, although several regional emission inventories were conducted for the Incheon case before [50,51,52,63], not all of them cover the annual amount of emissions or all types of ships operated at the POI. Several studies suggested the use of AIS for better estimation, but these studies did not cover all ships operating at the POI at that time, due to the lack of data in the AIS for ships with gross tonnage (GT) smaller than 300. Furthermore, their data sets are backward, and therefore it is worth investigating a new reliable comprehensive annual non-GHG emission inventory from ship operation at the POI with a better data set and a more appropriate approach.
In this study, the author suggests the application of an integrated VTS-based data, which is free for the public, as input for estimation. VTS is another ship tracking system, operated by the local coast guard or port operator in a limited geographical area surrounding the ports, but could cover the entire ship operation in that area. The emitted amount of the six non-GHG target pollutants according to CAPSS [64]: CO, NOx, SOx, PM (including PM10 and PM2.5), VOCs, and ammonia (NH3), are sophistically estimated for different geographical areas, operational phases, and ship types, employing a bottom-up approach with VTS-based data to cover all ships which were operated at the POI in 2017. Thus, this study provides an up-to-date and accurate emission inventory for the POI. It also helps close the gap in the literature concerning the estimation of non-GHG emissions in Korea, resulting in a complete review of the POI’s ship emissions.
3. Methodologies
3.1. Data Report
3.1.1. Geographical Region
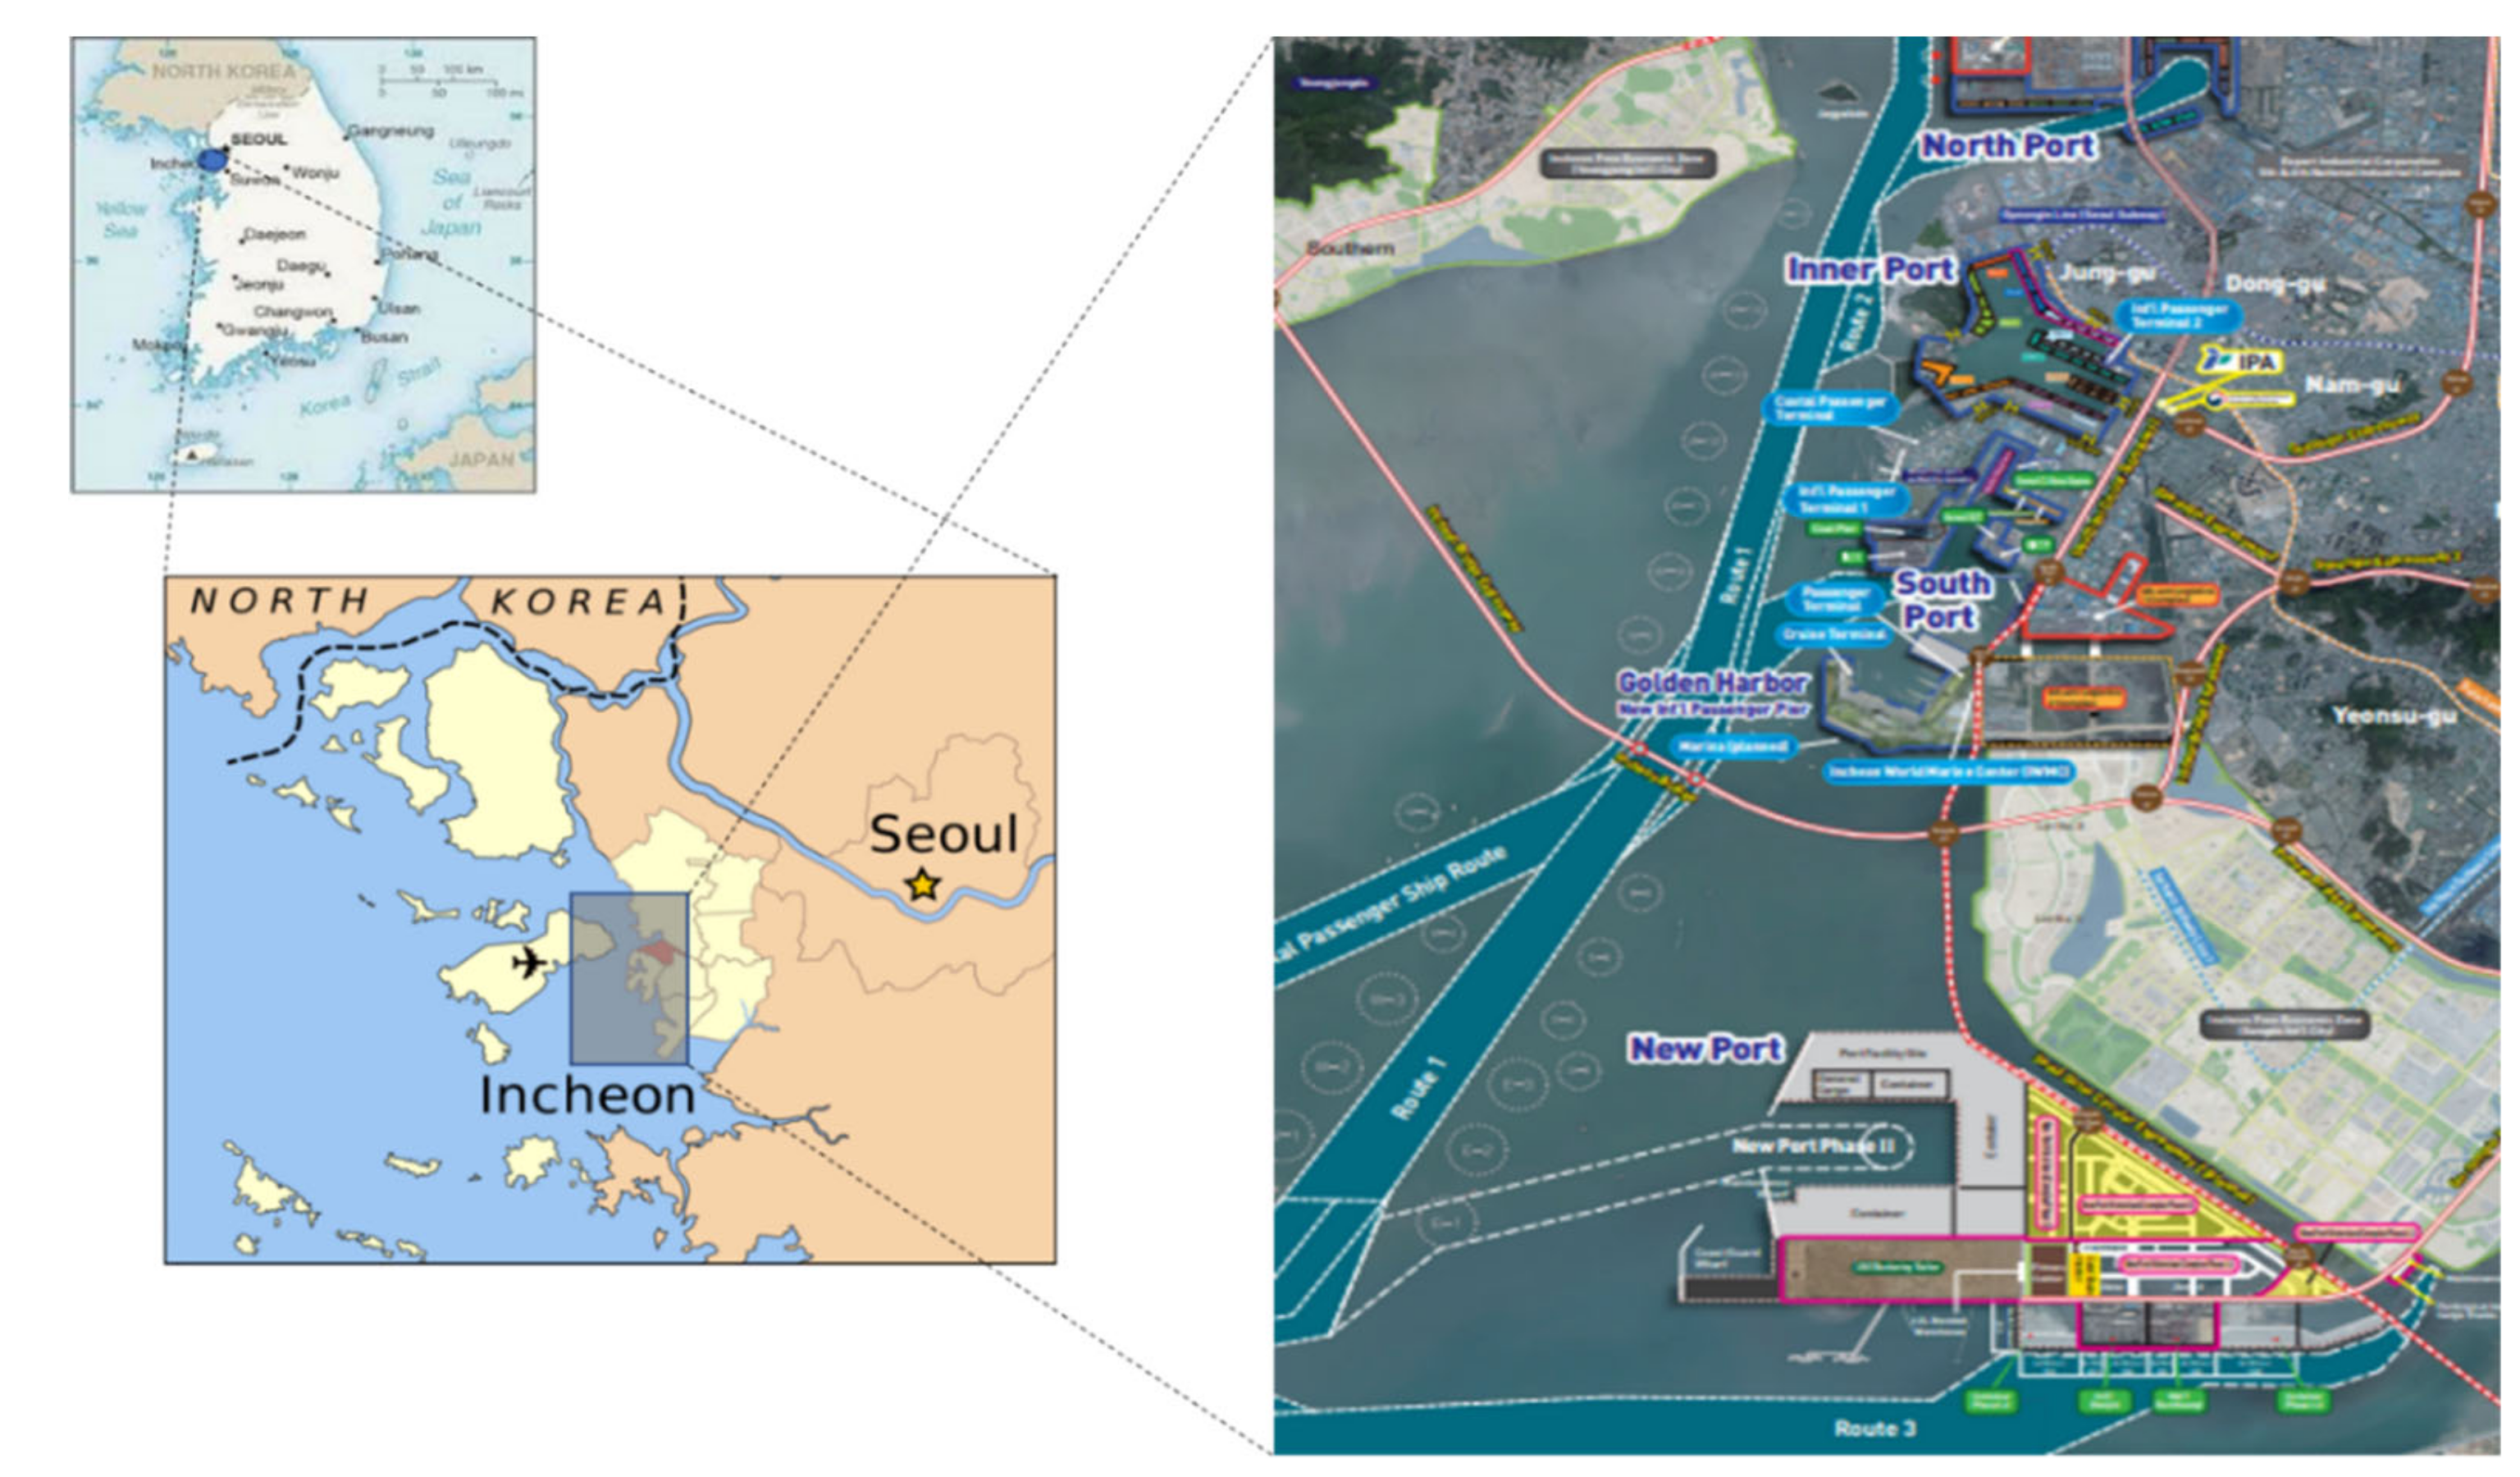
POI consists of a total of 128 berths with a total berth length of 28,735 m. It has five main component ports: North Port (NoP), Inner Port (IP), Coastal Port (CP), South Port (SP), and New Port (NeP); and three smaller specialized ports: Geocheom-do Port (GC), Song-do Port (SD), and Yeongheung-do Port (YH), which are located around the five main ones. NoP primarily handles raw industrial materials, such as timber and steel, and supplementary materials for foodstuff, with 17 berths that can serve a maximum of 50,000 DWT class vessels. The Inner Port is designed with a lock-gate to maintain a calm water level and destined for semi-conductor equipment, automobiles, and precision machine parts. The other main items handled here are grains, fruits, and general cargo. The Inner Port enables the concurrent berthing of 48 vessels with the maximum 50,000 DWT. The South Port and New Port were created to handle containers. The South Port, with seven berths, is used exclusively for small and medium containers from a maximum of 4000 TEU vessels, whereas the New Port, which is currently undergoing construction, is an exclusive hub port for handling medium and large containers from a maximum of 12,000 TEU vessels. Geocheom-do Port is used for handling sand, while Songdo Port is for oil products. Finally, Yeongheung-do Port is developed to serve the Yeongheung thermal power plants. The capacity of the POI and its component ports are described in Table 1, below.
The geographical segments of the POI are shown in Figure 1. The POI’s boundary line was defined by the IPA [65]. The study covered all ship activities inside the port boundary and “affected zone” (within 5 km from the port boundary) to examine the movement of pollutants close to the port following the guidelines from the EPA [66].
3.1.2. VTS-Based Data Collection and Cleaning
This study aims to cover and consider all ship activities in 2017 at the POI using data obtained from the VTS system. 17,316 ship calls from the 2583 ships which were operated at the POI were reported from the VTS-based Korean Port Management Information System (Port-MIS). The ship call’s statistical information is shown in Table 2.
Most of the ship calls at the POI in 2017 came from the tanker fleet at 38.6% of the total ship calls. This was followed by the general cargo fleet (28.1%), and the container ship fleet (16.4%). In contrast, only 12 reefers visited the port, accounting for 0.07% of the total number of ships.
A total of 46,874 rows of ship statuses was recorded in 2017 at the POI. However, this port traffic data was collected and stored in order of occurrence inside the POI, not corresponding with the timeline of ship calls. The next activity phase of a ship call often happens after a long period, usually several days. Moreover, a large number of incoming and outgoing vessels greatly exaggerated the complexity of the collected data. A code, including a call sign and time, was applied to rearrange the entire data set corresponding to the timeline of the ship call.
In the collected data, the waypoints are widely spaced. A typical ship call includes the following waypoints: (1) arrival at, and departure from, port boundaries; (2) anchorage and anchor collecting; (3) docking and undocking; and (4) moving to other wharves (if needed). A combination of two waypoints identifies the activity phase of a ship call. The time of an activity phase is calculated as the subtraction of two corresponding waypoints’ in time. If only the arrival at, and departure from, port boundary waypoints are reported for a ship call, the representative moving distance and time for the cruise and maneuver phases in a respective port and the hotel time are subtracted from the total reported time. In addition, when multi-berthing happens, the moving process between wharves in the same port is considered as a maneuver.
3.1.3. Ship Characteristics Data Collection and Analysis
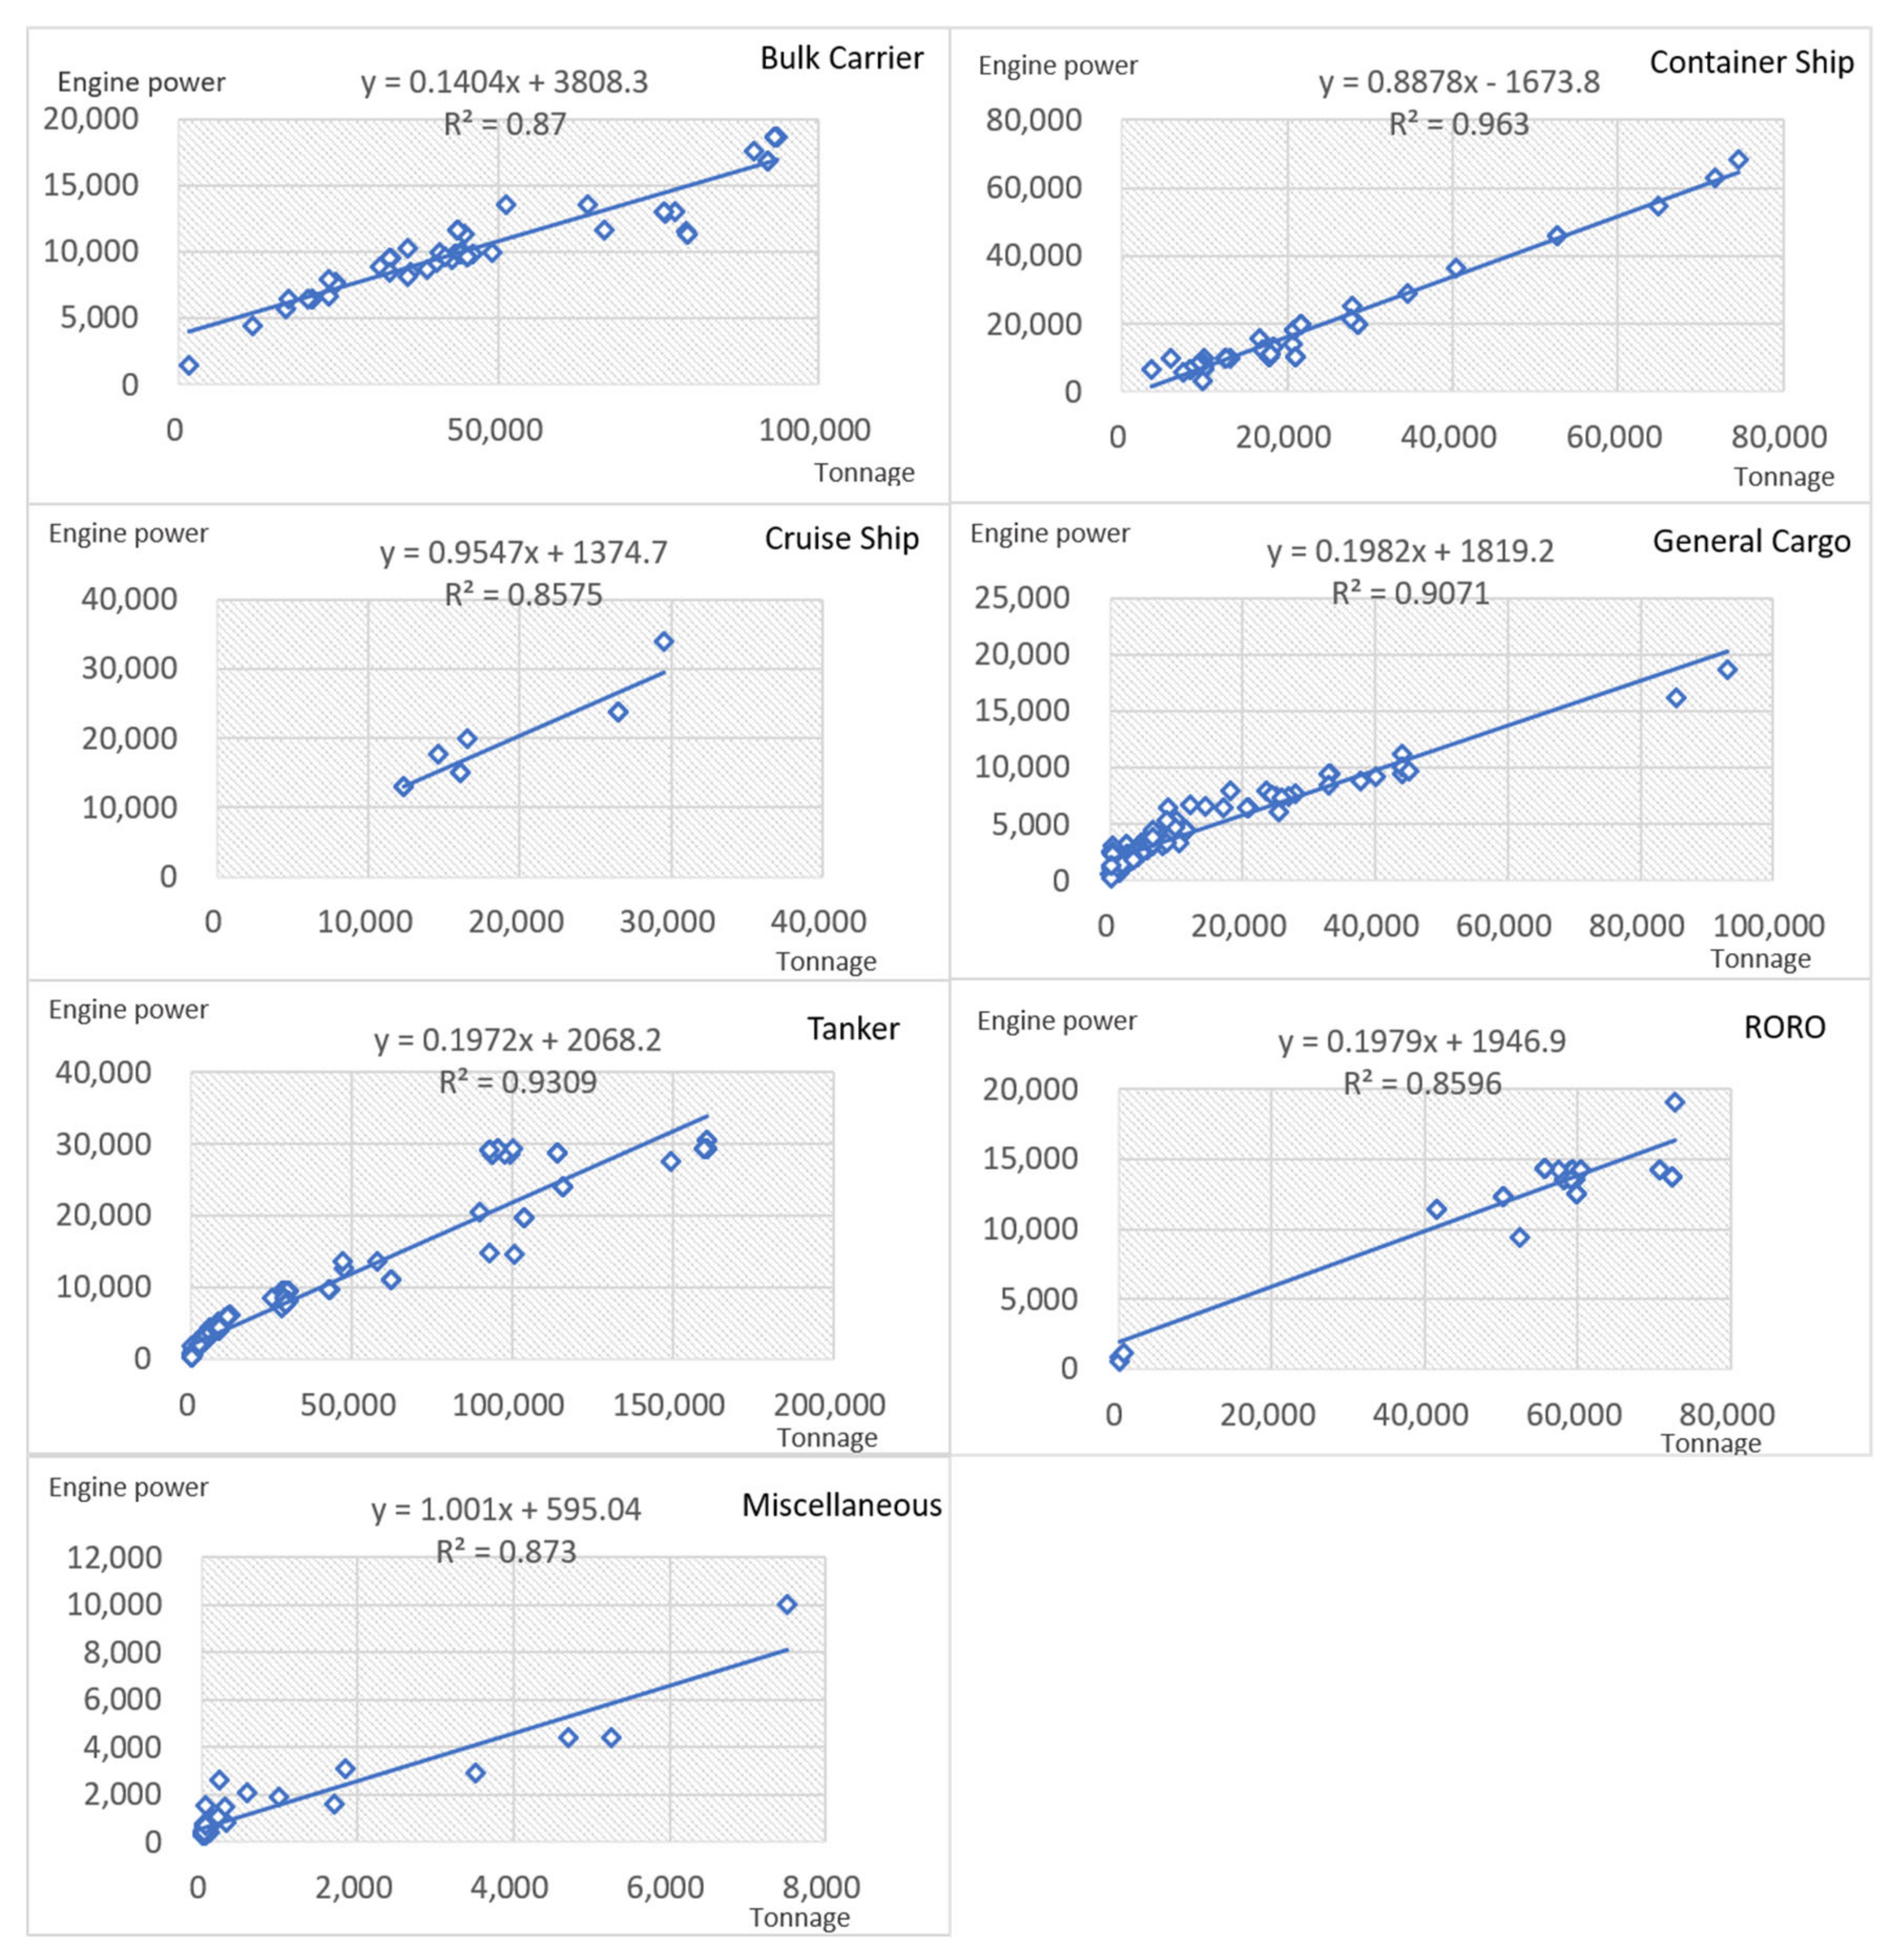
The ship characteristics data, including the vessel name, vessel type, engine type, main engine power, weight tonnage, design speed, and max speed, were collected from the Korea Ship Safety Technology Authority. In several cases, if the main engine information was missing, simple linear regression analyses by ship type between ship tonnage and what powered the main engine were used to estimate what generated the main engine power for each ship. The linear regression analyses for missing cases are shown in Figure 2. The high values of the coefficient of determination (R2 > 0.85) present a strong positive relationship between ship tonnage and main engine power as well as a high level of reliability of the estimated values.
Information on the installed auxiliary engine power (Pa) was not completely provided because the manufacturer does not need to provide it. Another problem lies in identifying the actual level of use of the auxiliary engines during a ship call. There is no relationship between the actual Pa and ship speed [13]. Therefore, the Pa estimation is commonly based on the given total propulsion engine [13,33]. The information of that ratio, which is provided by the EPA [33], is noted in Table 3.
In addition, real revolutions per minute (RPM) of both propulsion and auxiliary engines were collected. In several times, when data gaps happen, the missing values are supplemented by using the average values as shown in Table 4.
3.2. Activity Phase Determination
A typical ship call is often broken down into different activity phases that include a series of continuous actions sharing similar characteristics, as shown in Table 5, which summarizes the shipping activity phase information at the POI [1]. However, in practice, the regulations for speed-reduction zones are not implemented at the POI. As defined by the EPA [33], at the “Cruise” phase, ships move from the port boundary to the breakwater at service speed and both the propulsion and auxiliary engines are in operation. In the “maneuver” phase, ships transit inside the zone of the breakwater and berth at a slower speed. Even receiving assistance from tugs, the propulsion engines are kept in operation. “Anchorage” happens when a ship is waiting for a berth call, and “Hotel” means ships are docking for loading/unloading cargoes at the berth. In both the “Anchorage” and “Hotel” phases, the propulsion engines are turned off while the auxiliary engines are still running to provide power on-board. The actual speed and travel distance of the ship in each phase were collected by interviewing local pilot companies.
3.3. Ship Classification
Ship characteristics (e.g., speed, engine size) differ greatly based on the ship type. An abundant amount of studies classifies ship types differently. This study follows the EPA classification [33], which classifies ships into 11 types. However, based on the situation and availability of the data, this study only considered eight types: bulk carriers, container ships, cruise ships, general cargo ships, miscellaneous ships, reefers, roll-on/roll-off (RORO) ships, and tankers.
3.4. Emission Estimation
3.4.1. Ship Emission
An activity-based methodology with complete VTS-based ship movement data was used for the analyses in this study to accurately assess ship emissions. The methodology was established by improving the equation to measure ship emissions suggested by the EPA [33] and EEA Tier 3 [25]. The total emission of a ship call is the sum of emissions from all phases from both the propulsion engines and auxiliary engines, as shown in Equation (4) below:
where E denotes the emission from a complete ship call (g), T denotes time (hour), P denotes engine power (kW), LF denotes the load factor (%), EF denotes emission factor (g/kWh), s denotes the ship call, i denotes the pollutant, ph denotes the ship phase (anchorage, cruise, maneuvering, or docking), and j denotes the engine type (propulsion or auxiliary).
Es,i,ph = ∑j [Tph∑Pj.LFj.EFi,j,ph],
The equation parameters were collected or calculated from sample ship data and then applied to the equation above to find out the ship call emissions. A detailed explanation of the equation parameters as well as their values and sources are described in the following sections. Finally, the results regarding emissions from ship calls were summed up to reach the amount of total in-port ship emissions at the POI in 2017.
3.4.2. LF
The propulsion engine LF (LFm) is defined by the Propeller Law [33], as shown in Equation (5) below:
where LFm is the LF for the propulsion engine (%), AS is the ship’s actual speed (knots), and MS is the ship’s maximum speed (knots) as defined by the manufacturer. The auxiliary engine LF (LFa) remains ill-defined and varies by ship type and activity phase with no relationship to ship speed. Due to limited information related to onboard auxiliary engines, the default values were often applied for LFa. In this study, the assumptions of LFa followed the guidelines by the EPA [33] and are shown in Table 6 below.
LFm = (AS/MS)3
3.4.3. EFs
As mentioned above, the sources for EF data in global studies are still limited because the cost of testing emissions onboard is reasonably high [33]. There is also no study estimating local EFs for the Incheon case. Therefore, in this research, EFs were determined and calculated based on studies published by the EPA. In addition, the fuel characteristics (fuel type and sulphur content in fuel) and engine speed category help determine the exact EFs were applied. When entering the POI, the use of marine gas oil is mandatory. The sulphur content in fuel played a direct and decisive role in the amount of SOx and PM emissions. The new ISO 8217:2017 updated the new requirements for marine distillate fuels [67]. The maximum sulphur content in MGO was reduced to 1.0% by mass from 1.5% in ISO 8217:2010. Therefore, in this study, a value sulphur limit of 1.0% for the fuel that was used was applied to look up the appropriate SOx and PM EFs. In addition, marine diesel propulsion engines are classified into high-speed diesel (HSD), medium-speed diesel (MSD), and slow-speed diesel (SSD) based on the speed designation of the engine. The classification is shown in Table 7 below.
In detail, EPA [34] (1) referred EFs from several well-known data set, like Entec [68] and Cooper and Gustafsson [69], for CO, NOx, and HC emissions, and specific fuel consumption (SFC); and (2) suggested equations based on fuel sulphur fraction and specific fuel consumption for SOx, PM10, and PM2.5 emissions:
- SOx EF = SFC. 2. 0.97753. Fuel Sulphur Fraction,
- PM10 EF = 0.23 + SFC. 7. 0.02247. (Fuel Sulphur Fraction—0.0024),
- PM2.5 EF is assumed to be equal to 0.92 times the PM10 EF,
where 2 is the molecular weight difference between SOx and sulphur; 0.97753 means 97.753% of sulphur in fuel used will be converted to SOx; 7 is the molecular weight different between PM10 and sulphur; 0.02247 means 2.247% of sulphur in fuel used will be converted to PM10 sulfate.
In addition, due to the broad category, VOC EF is assumed to be equal to 1.053 times the HC EF [70]. However, the EPA does not provide an EF estimation method for NH3 emissions. Therefore, the EF for NH3 emissions was estimated in reference to the European Environment Agency [25] as 7 g per ton of fuel used. This was then converted to g/kWh by applying SFC. Table 8 shows the EFs that were applied in this study by engine type and activity phase.
4. Results
4.1. Ship Transit Time
The data for actual activity time at each phase of a ship call was estimated from Port-MIS. A total of 46,874 rows of ship statuses were collected, cleaned, classified, and analyzed. The ship transit time was calculated by the ship speed and travel distance between the border and berth. For a general view, the average transit time by port is shown in Table 9, below. The Inner Port showed the greatest transit time because of its lock gate.
4.2. Ship Docking Time
The actual times for hoteling and anchoring were obtained. A maximum of seven days (168 h) for anchoring and 14 days (336 h) for hoteling at the berth was considered to avoid anomalies. The average docking time by ship type is shown in Table 10, below.
4.3. Ship Emissions
This section describes the in-port ship emission inventory at the POI in 2017, the results of which were calculated following the methodologies mentioned above. This inventory was performed for six geographical areas (five main ports and other specialized ports), seven types of air pollutants, and four ship activity phases. The total amount of emitted in-port ship emissions was revealed and includes 375.24 tons of CO, 4918.96 tons of NOx, 1454.55 tons of SOx, 170.64 tons of PM10 (including PM2.5), 156.84 tons of PM2.5, 177.78 tons of VOCs, and 0.52 tons of NH3. NOx was the most apparent air pollutant at the POI in 2017, covering 67.8% of the total amount of emissions. This was followed by SOx at over 20%. In contrast, NH3 just accounted for nearly 0.01% of the total amount of emissions. The proportion of CO, PM, and VOCs was 5.17%, 2.35%, and 2.45%, respectively.
Table 11 shows a summary of the ship emissions by geographical area during the analysis period, including the five main component ports and three smaller specialized ports (emitted from berthing activities) as well as ships at sea (emitted from ship movements) in tons. The at-sea ships accounted for the largest share of emissions, at around 58.0% of CO, 59.5% of NOx, 58.2% of SOx, 58.8% of PM, 66.1% of VOCs, and 58.2% of NH3. Among the component ports, the Inner Port was the most polluted, contributing around 8.1% of the total amount of emissions. This was followed by the North Port and the Coastal Port, with ratios of 6.3% and 6.0%, respectively. The New Port shared the smallest proportion, at almost 3.4% of the total amount of emissions.
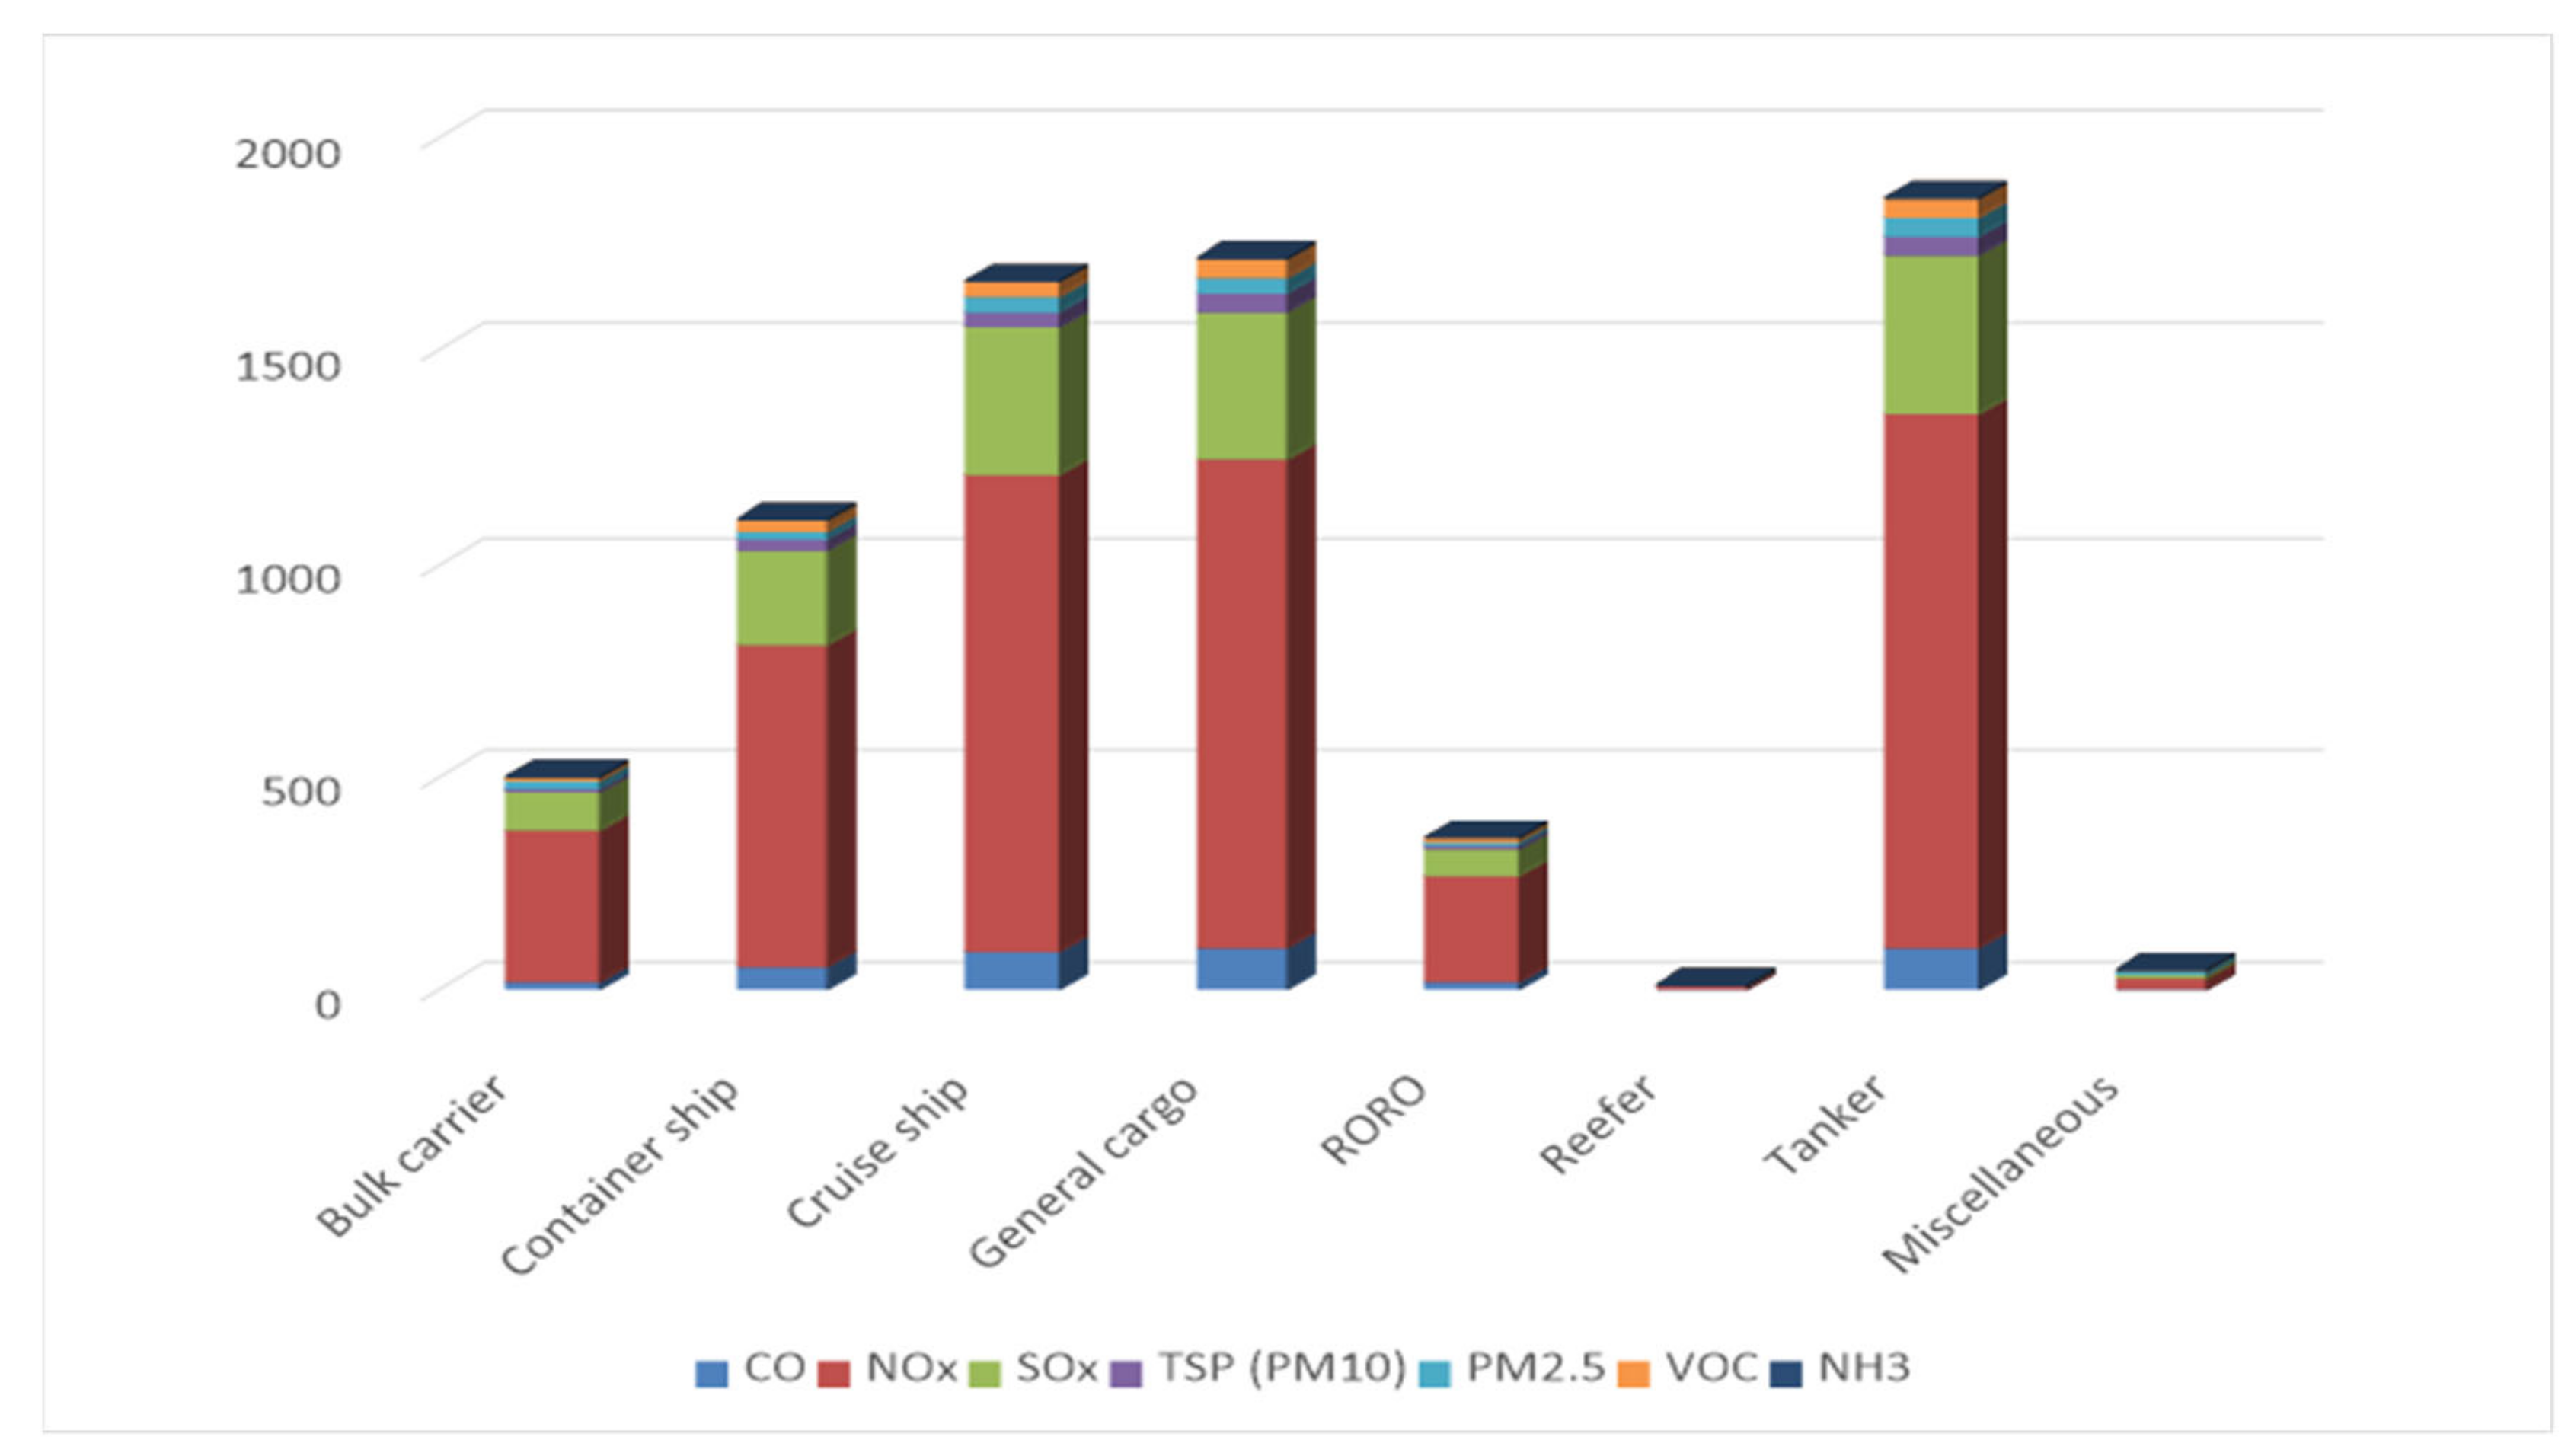
Figure 3 illustrates the emission contribution by ship type at the POI in 2017. Tankers and general cargo ships contributed the most emissions. Tankers contributed 26.1% of CO, 25.5% of NOx, 25.7% of SOx, 25.7% of PM (PM10 and PM2.5), 26.3% of VOCs, and 25.7% of NH3, whereas the corresponding percentages for general cargo ships were 24.9%, 23.4%, 23.9%, 24.0%, 25.9%, and 23.9%, respectively. Cruise ships and container ships also accounted for a significant amount of emissions. The top four ship types contributed over 87.5% of the total in-port ship emissions.
Table 12 presents the ship emission inventory by activity phase. The largest share of total emissions was from the “Cruise” phase, with 49.9% of CO, 51.7% of NOx, 50.2% of SOx, 50.9% of PM10, 51.0% of PM2.5, 59.6% of VOCs, and 50.2% of NH3. The “Hotel” phase ranked second, with contributions of 42.0%, 40.5%, 41.8%, 41.2%, 41.2%, 33.9%, and 41.5%, respectively. These two phases took up the majority of the total in-port ship emissions at over 92% of the proportion at the POI in 2017. The ship phase “Maneuver” contributed to the least amount of emissions compared to the others.
5. Discussion
The high estimated values of NOx and SOx at sea emphasize the necessity of implementing ECAs soon to reduce these emissions. With a 0.1% sulphur content in fuel now applied in the ECA, it is expected that the amount of SOx will be reduced by 10 times the current amount. The busiest seaports are located in Asia, especially in north-eastern Asian coastal regions. These regions also have highly concentrated populations and no official guidelines and efforts to protect their residents. The ECA at the POI is expected to pioneer the path striving for a greener and better life for the local community.
Again, the top four ship groups causing the most pollution—The tanker, general cargo ship, cruise ship, and container ship—Comprised over 87.5% of the total amount of emissions. Tankers and general cargo ships were the dominant polluters at the Inner Port, which is the most polluted component port of the POI. The North Port ranked second mainly due to the emission contributions from tankers. The Central Port covers the smallest area. However, significant emissions from cruise ships turned it into the third most polluted port. Therefore, the IPA should focus more on cruise ships, general cargo ships, and tankers when considering future green policies. This is especially true since a new international cruise terminal is coming to accommodate bigger cruise ships [71]. The implication is that the emissions from cruise ships could become an even larger pollutant source to the inventory.
In addition, this study shows that significant emissions came from the docking process, with a percentage range from 33.9% to 42.0%, according to the type of pollutant when only the auxiliary engines were being operated. It also shows that besides the establishment of the ECA, to reduce the environmental impact from ships, the IPA also needs to consider the implementation of other green actions during the docking process which has already been applied in ports in the EU. This includes the application of exhausted gas cleaning systems (EGCS) (also known as scrubbers), the use of on-shore power supplies, a reduction in docking time, or the use of greener alternative fuels, such as liquefied natural gas (LNG) or biofuels [72].
These days, the greatest potential of the internet is to achieve better information visibility and facilitate better decision-making regardless of place and time [73]. With the innovation of the internet and technology, the Fourth Industrial Revolution is starting to change the way people work and communicate, “facilitating new interactions among a network of users throughout the industry” [74]. This phenomenon is possible through the prevalence of a network effect enabled by a “platform”. The application of the platform industry to access environmental effects in port areas by establishing systematic and standardized procedures monitoring port-related harmful air pollutants from ships has shown great research potential.
In the case of Korea, the proposed in-port emission management platform would be integrated with the national Port-MIS to ofter functions:
- data collection and processing, as well as cleaning;
- estimation, modification, visualization; and
- prediction.
The above three functions are suggested to make sure the standard ship emission inventory is applied through a systematic approach for better emission assessment and management. By directly linking to Port-MIS, the daily data are automatically collected and processed. The required input data set, including the average speed of each time-in-mode, ship characteristics, engine operation information, and traffic data is mainly obtained from pilot data and port authority data through the Port-MIS system. The integrated data could then be immediately estimated to provide timely environment indexes, in order to promptly adjust or re-plan port operations to minimize or keep the negative impacts on the local community at a safe and controllable level. The modification function would offer input data adjustment to assess the performance of green management policies or the actions being conducted which will be adopted in the port. Predictions using the power of statistical and machine-learning algorithms and statistical analyses would better predict the future emissions based on historically reported data. Then, artificial intelligence algorithms could help visualize performance predictions via a dashboard. Thus, the suggested platform would provide the researcher/port operator with a way to transform information into recommended actions almost instantaneously.
6. Conclusions
As a result of growing international trade, port-related emissions have become a critical issue for urban areas located near ports, especially hub port cities, which often have concentrated and dense populations. The awareness of environmental issues caused by rapidly increasing port traffic has motivated the necessity of a complete assessment of the negative environmental impacts caused by shipping fleet activities. The proposed bottom-up approach with real-time VTS data for ship activities provided a detailed and reliable non-GHG ship emissions inventory at the POI in 2017. NOx was a dominant source of air pollution, comprising 67.8% of the total amount of emissions in tons. This was followed by SOx at 20%, while NH3 contributed a negligible amount of emissions.
Besides using the AIS data system in port emission studies, this study also contributes to the literature by showing that the VTS data system is a free, useful, and reliable data source, especially when considering small ship emissions (fewer than 300 GT). Moreover, there is no doubt that these up-to-date results could be meaningful and reliable for the air quality management decision-making process of local port operators and public agencies.
However, applying the average inputs (e.g., EFs, auxiliary characteristics data, and engine LFs) from international studies in the estimation process with different spatial and temporal scopes may lead to uncertainty. Unfortunately, the local data is limited and inaccurate. Therefore, it compromised the confidence level of the estimations. Thus, it is necessary to develop a system to simultaneously investigate local-specific input values, leading to an integrated platform. Besides, for missing data in ships’ engine power, although the R2 values of simple linear regression applied in this study are relatively high, it is interesting to search for more relationships between ship’s engine power and other factors, and then examining them through polynomial regression to achieve better estimation results.
In addition, the policies released by public agencies and port operators can seriously affect the strategic decision-making process on ship routing and the scheduling of shipping liners [75]. For example, the use of less-sulphur-content fuel in the local ECA may increase the fuel cost and directly impact the price of services. Therefore, the public authorities and port operators should also consider responses from shipping liners. Moreover, with the cold ironing policy, the ship has to use on-shore electricity provided by the port. Thus, the optimal price for this service should be taken into account carefully to ensure benefits for both port operators and liners. The application of game theory [76] to look at pricing strategies of the port operators and liners, as well as changes in ship routing and scheduling when considering sustainability policies, would be interesting topics for further research.
Last but not least, other port-related land-based emission sources (e.g., cargo handling equipment, rails, trucks) should be considered in the near future to improve the complete in-port emissions inventory. They have also distributed a significant amount of emissions around ports. By combining them with emission inventories from other land-based sources, a complete annual port emissions inventory can be achieved. This comprehensive inventory could be considered a good base resource for data comparison and a full evaluation of the effectiveness of policies cutting down emissions at ports.
Author Contributions
Conceptualization, H.L., D.P. and S.C.; methodology, H.L. and S.C.; formal analysis, H.L. and H.T.P.; data curation, D.P.; writing—Original draft preparation, H.L. and S.C.; writing—Review and editing, H.T.P.; supervision, S.C. All authors have read and agreed to the published version of the manuscript.
Funding
This work was supported by an Incheon National University Research Grant in 2018.
Conflicts of Interest
The authors declare no conflict of interest.
References
- Song, S. Ship emissions inventory, social cost and eco-efficiency in Shanghai Yangshan port. Atmos. Environ. 2014, 82, 288–297. [Google Scholar] [CrossRef]
- Eyring, V.; Köhler, H.W.; van Aardenne, J.; Lauer, A. Emissions from international shipping: 1. The last 50 years. J. Geophys. Res. Atmos. 2005, 110. [Google Scholar] [CrossRef]
- Tzannatos, E. Ship emissions and their externalities for the port of Piraeus–Greece. Atmos. Environ. 2010, 44, 400–407. [Google Scholar] [CrossRef]
- Ballini, F.; Bozzo, R. Air pollution from ships in ports: The socio-economic benefit of cold-ironing technology. Res. Transp. Bus. Manag. 2015, 17, 92–98. [Google Scholar] [CrossRef]
- Endresen, Ø.; Sørgård, E.; Sundet, J.K.; Dalsøren, S.B.; Isaksen, I.S.; Berglen, T.F.; Gravir, G. Emission from international sea transportation and environmental impact. J. Geophys. Res. Atmos. 2003, 108. [Google Scholar] [CrossRef]
- Eyring, V.; Isaksen, I.S.; Berntsen, T.; Collins, W.J.; Corbett, J.J.; Endresen, O.; Grainger, R.G.; Moldanova, J.; Schlager, H.; Stevensoni, D.S. Transport impacts on atmosphere and climate: Shipping. Atmos. Environ. 2010, 44, 4735–4771. [Google Scholar] [CrossRef]
- Saxe, H.; Larsen, T. Air pollution from ships in three Danish ports. Atmos. Environ. 2004, 38, 4057–4067. [Google Scholar] [CrossRef]
- Corbett, J.J.; Winebrake, J.J.; Green, E.H.; Kasibhatla, P.; Eyring, V.; Lauer, A. Mortality from ship emissions: A global assessment. Environ. Sci. Technol. 2007, 41, 8512–8518. [Google Scholar] [CrossRef]
- Corbett, J.J.; Fischbeck, P. Emissions from ships. Science 1997, 278, 823–824. [Google Scholar] [CrossRef]
- World Health Organization. Air Quality Guidelines for Europe, 2nd ed.; European Series No. 91; WHO Regional Publications: Copenhagen, Denmark, 2000. [Google Scholar]
- Bailey, D.; Solomon, G. Pollution prevention at ports: Clearing the air. Environ. Impact Assess. Rev. 2004, 24, 749–774. [Google Scholar] [CrossRef]
- Merico, E.; Donateo, A.; Gambaro, A.; Cesari, D.; Gregoris, E.; Barbaro, E.; Dinoi, A.; Giovanelli, G.; Masieri, S.; Contini, D. Influence of in-port ships emissions to gaseous atmospheric pollutants and to particulate matter of different sizes in a Mediterranean harbour in Italy. Atmos. Environ. 2016, 139, 1–10. [Google Scholar] [CrossRef]
- Goldsworthy, L.; Goldsworthy, B. Modelling of ship engine exhaust emissions in ports and extensive coastal waters based on terrestrial AIS data–An Australian case study. Environ. Model. Softw. 2015, 63, 45–60. [Google Scholar] [CrossRef]
- Marine Environment. Available online: http://www.imo.org/en/OurWork/Environment/Pages/Default.aspx (accessed on 6 August 2020).
- Sulphur 2020—Cutting Sulphur Oxide Emissions. Available online: http://www.imo.org/en/MediaCentre/HotTopics/Pages/Sulphur-2020.aspx (accessed on 6 August 2020).
- Prevention of Air Pollution from Ships. Available online: http://www.imo.org/en/OurWork/Environment/PollutionPrevention/AirPollution/Pages/Air-Pollution.aspx (accessed on 6 August 2020).
- Directive (EU) 2016/802 of the European Parliament and of the Council of 11 May 2016 Relating to a Reduction in the Sulphur Content of Certain Liquid Fuels. Available online: https://eur-lex.europa.eu/eli/dir/2016/802/oj (accessed on 6 August 2020).
- EPA, U. Control of Emissions of Air Pollution from Nonroad Diesel Engines and Fuel; Final Rule. Fed. Regist. 2004, 69, 38958–39273. [Google Scholar]
- China: Emission Control Areas Update. Available online: https://www.nepia.com/industry-news/china-emission-control-areas-update/ (accessed on 6 August 2020).
- Song, S.K.; Shon, Z.H. Current and future emission estimates of exhaust gases and particles from shipping at the largest port in Korea. Environ. Sci. Pollut. Res. 2014, 21, 6612–6622. [Google Scholar] [CrossRef] [PubMed]
- Korea Ministry of Environment. Comprehensive Plan on Fine Dust Management. In Korea Environmental Policy Bulletin; Korea Environment Institute: Sejong, Korea, 2018; Volume 15. [Google Scholar]
- World Port Rankings 2016. Available online: https://www.aapa-ports.org/unifying/content.aspx?ItemNumber=21048 (accessed on 6 August 2020).
- Nunes, R.A.O.; Alvim-Ferraz, M.C.M.; Martins, F.G.; Sousa, S.I.V. The activity-based methodology to assess ship emissions-A review. Environ. Pollut. 2017, 231, 87–103. [Google Scholar] [CrossRef]
- Liu, T.K.; Sheu, H.Y.; Tsai, J.Y. Sulfur dioxide emission estimates from merchant vessels in a port area and related control strategies. Aerosol Air Qual. Res. 2013, 14, 413–421. [Google Scholar] [CrossRef] [Green Version]
- European Environment Agency. EMEP/EEA Air Pollutant Emission Inventory Guidebook 2019 (Report No. 13/2019); Publications Office of the European Union: Luxembourg, 2019. [Google Scholar]
- Corbett, J.J.; Koehler, H.W. Updated emissions from ocean shipping. J. Geophys. Res. Atmos. 2003, 108. [Google Scholar] [CrossRef]
- Corbett, J.J.; Winebrake, J.J.; Chapman, D.; Woods, P. An Evaluation of Public-Private Incentives to Reduce Emissions from Regional Ferries; Synthesis Report (No. FTA Project ID: NJ-42-0002-00); Voorhees Transportation Center, U.S. Department of Transportation and Federal Transit Administration: New Jersey, NJ, USA, 2005. [Google Scholar]
- Endresen, Ø.; Bakke, J.; Sørgård, E.; Berglen, T.F.; Holmvang, P. Improved modelling of ship SO2 emissions—A fuel-based approach. Atmos. Environ. 2005, 39, 3621–3628. [Google Scholar] [CrossRef]
- Psaraftis, H.N.; Kontovas, C.A. CO2 emission statistics for the world commercial fleet. WMU J. Marit. Aff. 2009, 8, 1–25. [Google Scholar] [CrossRef]
- Olivier, J.G.; van Aardenne, J.A.; Dentener, F.J.; Pagliari, V.; Ganzeveld, L.N.; Peters, J.A. Recent trends in global greenhouse gas emissions: Regional trends 1970–2000 and spatial distributionof key sources in 2000. Environ. Sci. 2005, 2, 81–99. [Google Scholar] [CrossRef] [Green Version]
- Kesgin, U.; Vardar, N. A study on exhaust gas emissions from ships in Turkish Straits. Atmos. Environ. 2001, 35, 1863–1870. [Google Scholar] [CrossRef]
- U.S. Environmental Protection Agency. Control of Emissions of Air Pollution from New Marine CompressionIgnition Engines at or above 37 kW; Office of Transportation Air Quality: Ann Arbor, MI, USA, 1999. [Google Scholar]
- U.S. Environmental Protection Agency. Current Methodologies in Preparing Mobile Source Port-Related Emission Inventories; Final Report April 2009; Office of Transportation Air Quality: Ann Arbor, MI, USA, 2009. [Google Scholar]
- Deniz, C.; Kilic, A.; Cıvkaroglu, G. Estimation of shipping emissions in Candarli Gulf, Turkey. Environ. Monit. Assess. 2010, 171, 219–228. [Google Scholar] [CrossRef] [PubMed]
- Kiliç, A.; Deniz, C. Inventory of shipping emissions in Izmit Gulf, Turkey. Environ. Prog. Sustain. Energy 2010, 29, 221–232. [Google Scholar] [CrossRef]
- Saraçoğlu, H.; Deniz, C.; Kılıç, A. An investigation on the effects of ship sourced emissions in Izmir Port, Turkey. Sci. World J. 2013, 2013. [Google Scholar] [CrossRef] [PubMed]
- Maragkogianni, A.; Papaefthimiou, S. Evaluating the social cost of cruise ships air emissions in major ports of Greece. Transp. Res. Part D Transp. Environ. 2015, 36, 10–17. [Google Scholar] [CrossRef]
- Papaefthimiou, S.; Maragkogianni, A.; Andriosopoulos, K. Evaluation of cruise ships emissions in the Mediterranean basin: The case of Greek ports. Int. J. Sustain. Transp. 2016, 10, 985–994. [Google Scholar] [CrossRef]
- Kilic, A.; Tzannatos, E. Ship Emissions and Their Externalities at the Container Terminal of Piraeus–Greece. Int. J. Environ. Res. 2014, 8, 1329–1340. [Google Scholar] [CrossRef]
- Castells-Sanabra, M.; Usabiaga-Santamaría, J.J.; Martínez de Osés, F.X. Manoeuvring and hotelling external costs: Enough for alternative energy sources? Marit. Policy Manag. 2014, 41, 42–60. [Google Scholar] [CrossRef] [Green Version]
- Villalba, G.; Gemechu, E.D. Estimating GHG emissions of marine ports—The case of Barcelona. Energy Policy 2011, 39, 1363–1368. [Google Scholar] [CrossRef]
- Tichavska, M.; Tovar, B. Port-city exhaust emission model: An application to cruise and ferry operations in Las Palmas Port. Transp. Res. Part A Policy Pract. 2015, 78, 347–360. [Google Scholar] [CrossRef]
- McArthur, D.P.; Osland, L. Ships in a city harbour: An economic valuation of atmospheric emissions. Transp. Res. Part D Transp. Environ. 2013, 21, 47–52. [Google Scholar] [CrossRef]
- Fan, Q.; Zhang, Y.; Ma, W.; Ma, H.; Feng, J.; Yu, Q.; Yang, X.; Ng, S.K.; Fu, Q.; Chen, L. Spatial and seasonal dynamics of ship emissions over the Yangtze River Delta and East China Sea and their potential environmental influence. Environ. Sci. Technol. 2016, 50, 1322–1329. [Google Scholar] [CrossRef] [PubMed]
- Yau, P.S.; Lee, S.C.; Corbett, J.J.; Wang, C.; Cheng, Y.; Ho, K.F. Estimation of exhaust emission from ocean-going vessels in Hong Kong. Sci. Total Environ. 2012, 431, 299–306. [Google Scholar] [CrossRef] [PubMed]
- Ng, S.K.; Loh, C.; Lin, C.; Booth, V.; Chan, J.W.; Yip, A.C.; Li, Y.; Lau, A.K. Policy change driven by an AIS-assisted marine emission inventory in Hong Kong and the Pearl River Delta. Atmos. Environ. 2013, 76, 102–112. [Google Scholar] [CrossRef]
- Berechman, J.; Tseng, P.H. Estimating the environmental costs of port related emissions: The case of Kaohsiung. Transp. Res. Part D Transp. Environ. 2012, 17, 35–38. [Google Scholar] [CrossRef]
- Corbett, J.J.; Wang, H.; Winebrake, J.J. The effectiveness and costs of speed reductions on emissions from international shipping. Transp. Res. Part D Transp. Environ. 2009, 14, 593–598. [Google Scholar] [CrossRef]
- Chang, C.C.; Wang, C.M. Evaluating the effects of green port policy: Case study of Kaohsiung harbor in Taiwan. Transp. Res. Part D Transp. Environ. 2012, 17, 185–189. [Google Scholar] [CrossRef]
- Chang, Y.T.; Song, Y.; Roh, Y. Assessing greenhouse gas emissions from port vessel operations at the Port of Incheon. Transp. Res. Part D Transp. Environ. 2013, 25, 1–4. [Google Scholar] [CrossRef]
- Chang, Y.T.; Roh, Y.; Park, H. Assessing noxious gases of vessel operations in a potential Emission Control Area. Transp. Res. Part D Transp. Environ. 2014, 28, 91–97. [Google Scholar] [CrossRef]
- Khan, S.; Chang, Y.T.; Lee, S.; Choi, K.S. Assessment of greenhouse gas emissions from ships operation at the Port of Incheon using AIS. J. Korea Port Econ. Assoc. 2018, 34, 65–79. [Google Scholar] [CrossRef]
- Chen, D.; Zhao, N.; Lang, J.; Zhou, Y.; Wang, X.; Li, Y.; Zhao, Y.; Guo, X. Contribution of ship emissions to the concentration of PM2. 5: A comprehensive study using AIS data and WRF/Chem model in Bohai Rim Region, China. Sci. Total Environ. 2018, 610, 1476–1486. [Google Scholar] [CrossRef] [PubMed]
- Chen, D.; Tian, X.; Lang, J.; Zhou, Y.; Li, Y.; Guo, X.; Wang, W.; Liu, B. The impact of ship emissions on PM2. 5 and the deposition of nitrogen and sulfur in Yangtze River Delta, China. Sci. Total Environ. 2019, 649, 1609–1619. [Google Scholar] [CrossRef] [PubMed]
- Mao, J.; Zhang, Y.; Yu, F.; Chen, J.; Sun, J.; Wang, S.; Zou, Z.; Zhou, J.; Yu, Q.; Ma, W.; et al. Simulating the impacts of ship emissions on coastal air quality: Importance of a high-resolution emission inventory relative to cruise-and land-based observations. Sci. Total Environ. 2020, 728, 138454. [Google Scholar] [CrossRef] [PubMed]
- Chen, D.; Zhang, Y.; Lang, J.; Zhou, Y.; Li, Y.; Guo, X.; Wang, W.; Liu, B. Evaluation of different control measures in 2014 to mitigate the impact of ship emissions on air quality in the Pearl River Delta, China. Atmos. Environ. 2019, 216, 116911. [Google Scholar] [CrossRef]
- Li, C.; Borken-Kleefeld, J.; Zheng, J.; Yuan, Z.; Ou, J.; Li, Y.; Wang, Y.; Xu, Y. Decadal evolution of ship emissions in China from 2004 to 2013 by using an integrated AIS-based approach and projection to 2040. Atmos. Chem. Phys. 2018, 18, 6075–6093. [Google Scholar] [CrossRef] [Green Version]
- Cepeda, M.A.; Monteiro, G.P.; de Oliveira-Moita, J.V.; Caprace, J.D. Estimating ship emissions based on AIS big data for the port of Rio de Janeiro. In Proceedings of the 17th Conference on Computer and IT Applications in the Maritime Industries, Pavone, Italy, 14–16 May 2018; Volume 1, p. 189. Available online: https://www.researchgate.net/profile/Jean_Caprace/publication/325578581_Estimating_Ship_Emissions_Based_on_AIS_Big_Data_for_the_Port_of_Rio_de_Janeiro/links/5b16c3b7aca272d24cc38328/Estimating-Ship-Emissions-Based-on-AIS-Big-Data-for-the-Port-of-Rio-de-Janeiro.pdf (accessed on 6 August 2020).
- Huang, L.; Wen, Y.; Zhang, Y.; Zhou, C.; Zhang, F.; Yang, T. Dynamic calculation of ship exhaust emissions based on real-time AIS data. Transp. Res. Part D Transp. Environ. 2020, 80, 102277. [Google Scholar] [CrossRef]
- Sun, X.; Tian, Z.; Malekian, R.; Li, Z. Estimation of Vessel Emissions Inventory in Qingdao Port Based on Big data Analysis. Symmetry 2018, 10, 452. [Google Scholar] [CrossRef] [Green Version]
- Cheong, J.; Kim, H.; Lee, S.M.; Lee, S.H.; Jang, Y. Greenhouse Gas Emissions Inventory in Busan Metropolitan City; Kyungsung University: Busan, Korea, 2007. [Google Scholar]
- Shin, K.W.; Cheong, J.P. Estimating transportation-related greenhouse gas emissions in the Port of Busan, S. Korea. Asian J. Atmos. Environ. 2011, 5, 41–46. [Google Scholar] [CrossRef] [Green Version]
- Kwon, Y.; Lim, H.; Lim, Y.; Lee, H. Implication of activity-based vessel emission to improve regional air inventory in a port area. Atmos. Environ. 2019, 203, 262–270. [Google Scholar] [CrossRef]
- Air Pollutants. Available online: http://airemiss.nier.go.kr/mbshome/mbs/airemiss/subview.do?id=airemiss_020200000000 (accessed on 6 August 2020).
- Incheon Port Authority Introduction. Available online: https://www.icpa.or.kr/content/view.do?menuKey=114&contentKey=44 (accessed on 6 August 2020).
- U.S. Environmental Protection Agency. National Port Strategy Assessment: Reducing Air Pollution and Greenhouse Gases at U.S. Ports (EPA-420-R-16-011); Office of Transportation Air Quality: Ann Arbor, MI, USA, 2016. [Google Scholar]
- ISO 8217:2017. Available online: https://www.iso.org/standard/64247.html (accessed on 6 August 2020).
- Entec UK Limited. Quantification of Emissions from Ships Associated with Ship Movements between Ports in the European Community, Prepared for the European Commission; Entec UK Limited: Cheshire, England, 2002. [Google Scholar]
- Cooper, D.; Gustafsson, T. Methodology for calculating emissions from ships: 1. Update of emission factors. In Swedish Methodology for Environmental Data; SMHI Swedish Meteorological and Hydrological Institute: Norrköping, Sweden, 2004. [Google Scholar]
- U.S. Environmental Protection Agency. Emission Factors for Locomotive (EPA-420-F-09-025); Office of Transportation Air Quality: Ann Arbor, MI, USA, 2009. [Google Scholar]
- Golden Harbor Project. Available online: https://www.icpa.or.kr/eng/content/view.do?menuKey=1851&contentKey=404 (accessed on 6 August 2020).
- Emission Abatement Methods. Available online: http://www.emsa.europa.eu/main/air-pollution/emission-abatement-methods.html (accessed on 6 August 2020).
- Creating Information Visibility in the Chain. Available online: https://scm.ncsu.edu/scm-articles/article/creating-information-visibility-in-the-chain (accessed on 6 August 2020).
- Gezinus, J.H.; Williams, J.; Sviokla, J. How platform leaders win. J. Bus. Strategy 2011, 32, 29–37. [Google Scholar] [CrossRef]
- De, A.; Wang, J.; Tiwari, M.K. Fuel bunker management strategies within sustainable container shipping operation considering disruption and recovery policies. IEEE Trans. Eng. Manag. 2019. [Google Scholar] [CrossRef] [Green Version]
- Ray, A.; De, A.; Mondal, S.; Wang, J. Selection of best buyback strategy for original equipment manufacturer and independent remanufacturer–game theoretic approach. Int. J. Prod. Res. 2020, 1–30. [Google Scholar] [CrossRef]
Figure 1.
Geographical locations of POI. Note: Images were downloaded from the internet and the IPA website and were then modified.
Figure 1.
Geographical locations of POI. Note: Images were downloaded from the internet and the IPA website and were then modified.

Figure 2.
Linear regressions of the main engine power by ship type.

Figure 3.
POI ship emission inventory by ship type in 2017 (unit: ton).


Table 1.
Summary of POI and its component port capacities.
| No. | Port | Berth Length (m) | Handling Capacity | Main Products | |
|---|---|---|---|---|---|
| Ship DWT | Berths | ||||
| 1 | Inner Port | 9838 | 2000–50,000 | 46 | General Cargo, Iron, Grains |
| 2 | South Port | 3841.5 | 2000–100,000 | 28 | Chemicals, Cement, Sand |
| 3 | Coastal Port | 1429 | 500–50,000 | 9 | Passengers, Oil, LPG |
| 4 | North Port | 6421 | 5000–100,000 | 26 | Oil, General Cargo, Wood Products |
| 5 | Song-do | 1300 | 3000–75,000 | 4 | LPG, Oil |
| 6 | Yeongheung-do | 1126 | 1000–200,000 | 5 | Bituminous coal, Limestone |
| 7 | Geocheom-do | 675 | 5000 | 4 | Sand |
| 8 | New Port | 1600 | 2000–3000 | 6 | Containers |
| 9 | Mooring facilities | 2505 | - | - | - |
| Summary | 28,735.5 | - | 128 | - | |
Source: Incheon Port Authority [65].
Table 2.
Ship call statistics (unit: ship call).
| Ship type | North Port | Inner Port | Coastal Port | South Port | New Port | Others | Total |
|---|---|---|---|---|---|---|---|
| Bulk Carrier | 231 | 267 | - | 43 | - | 158 | 699 |
| Container Ship | 17 | 24 | 6 | 1119 | 1683 | - | 2849 |
| Cruise Ship | 1 | 503 | 777 | 7 | 2 | - | 1290 |
| General Cargo | 975 | 1288 | 154 | 2263 | 7 | 176 | 4863 |
| RORO | - | 362 | - | 227 | - | - | 589 |
| Reefer | - | 6 | - | 6 | - | - | 12 |
| Tanker | 3701 | 475 | 673 | 678 | 131 | 1021 | 6679 |
| Miscellaneous | 15 | 71 | 25 | 210 | - | 14 | 335 |
| Total | 4940 | 2996 | 1635 | 4553 | 1823 | 1369 | 17,316 |
Source: Port-MIS.
Table 3.
The ratio for estimating auxiliary engine power (Pa).
| Ship Type | Auxiliary to Propulsion Ratio |
|---|---|
| Bulk Carrier | 0.222 |
| Container Ship | 0.220 |
| Cruise Ship | 0.278 |
| General Cargo | 0.191 |
| RORO | 0.259 |
| Reefer | 0.406 |
| Tanker | 0.211 |
| Others | 0.100 |
Source: EPA [33].
Table 4.
Average RPM.
| Ship Type | Average RPM of Propulsion Engine | Average RPM of Auxiliary Engine |
|---|---|---|
| Bulk Carrier | 103 | 843 |
| Container Ship | 131 | 847 |
| Cruise Ship | 484 | 895 |
| General Cargo | 271 | 1225 |
| RORO | 105 | 787 |
| Reefer | 311 | 1043 |
| Tanker | 286 | 1147 |
| Miscellaneous | 490 | 1037 |
Table 5.
Ship activity phases at POI.
| Phase Category | Propulsion Engine | Auxiliary Engine | Actual avg. Speed (Knots) | Travel Distance (nm) | |
|---|---|---|---|---|---|
| 1 | Anchorage | Off | On | 0 | 0 |
| 2 | Cruise | On | On | 12 | Varies by berth |
| 3 | Maneuver | On | On | Around 3.5 | 1 |
| 4 | Hotel | Off | On | 0 | 0 |
Table 6.
Auxiliary engine LF.
| Ship Type | Cruise | Maneuver | Hotel |
|---|---|---|---|
| Bulk Carrier | 0.17 | 0.45 | 0.10 |
| Container Ship | 0.13 | 0.48 | 0.19 |
| Cruise Ship | 0.80 | 0.80 | 0.64 |
| General Cargo | 0.17 | 0.45 | 0.22 |
| Miscellaneous | 0.17 | 0.45 | 0.22 |
| RORO | 0.15 | 0.45 | 0.26 |
| Reefer | 0.20 | 0.67 | 0.32 |
| Tanker | 0.24 | 0.33 | 0.26 |
Source: EPA [33].
Table 7.
Marine engine speed designations.
| Speed Category | Engine RPM |
|---|---|
| SSD | <130 |
| MSD | 130–1400 |
| HSD | >1400 |
Source: EPA [33].
Table 8.
EFs by engine type and activity phase (unit: g/kWh).
| Engine Type | Phase | CO 1 | NOx 2 | SOx | PM10 | PM2.5 | VOCs | NH3 |
|---|---|---|---|---|---|---|---|---|
| Propulsion-HSD | Cruise | 1.1 | 12.0 | 3.97 | 0.47 | 0.43 | 0.21 | 0.0014 |
| Propulsion-MSD | Cruise | 1.1 | 13.2 | 3.97 | 0.47 | 0.43 | 0.63 | 0.0014 |
| Propulsion-SSD | Cruise | 0.5 | 17.0 | 3.62 | 0.45 | 0.42 | 0.53 | 0.0013 |
| Propulsion-HSD | Maneuver | 2.2 | 9.6 | 4.36 | 0.50 | 0.46 | 0.63 | 0.0016 |
| Propulsion-MSD | Maneuver | 2.2 | 10.6 | 4.36 | 0.50 | 0.46 | 1.58 | 0.0016 |
| Propulsion-SSD | Maneuver | 1.0 | 13.6 | 3.99 | 0.47 | 0.44 | 1.90 | 0.0014 |
| Auxiliary 3 | All | 1.1 | 13.9 | 4.24 | 0.49 | 0.45 | 0.42 | 0.0015 |
Table 9.
Average transit time in POI 2017 (unit: hour).
| Port | Average Transit Time |
|---|---|
| North Port | 2.2 |
| Inner Port | 2.9 |
| Coastal Port | 1.7 |
| South Port | 1.7 |
| New Port | 1.5 |
| Song-do | 1.4 |
| Geocheom-do | 2.5 |
| Yeongheung-do | 0.75 |
Table 10.
Average docking time in POI 2017 (unit: hour).
| Types of Ship | Average Docking Time |
|---|---|
| Bulk Carrier | 69.7 |
| Container Ship | 13.9 |
| Cruise Ship | 11.0 |
| General Cargo | 34.2 |
| RORO | 33.1 |
| Reefer | 15.2 |
| Tanker | 18.0 |
| Miscellaneous | 31.6 |
Table 11.
POI ship emission inventory by geographical area in 2017 (unit: ton).
| Area | CO | NOx | SOx | PM10 | PM2.5 | VOCs | NH3 |
|---|---|---|---|---|---|---|---|
| North Port | 31.18 | 394.04 | 120.20 | 13.89 | 12.76 | 11.91 | 0.04 |
| Inner Port | 49.81 | 629.44 | 192.00 | 22.19 | 20.38 | 19.02 | 0.07 |
| Central Port | 24.58 | 310.65 | 94.76 | 10.95 | 10.06 | 9.39 | 0.03 |
| South Port | 23.05 | 291.28 | 88.85 | 10.27 | 9.43 | 8.80 | 0.03 |
| New Port | 13.18 | 166.58 | 50.81 | 5.87 | 5.39 | 5.03 | 0.02 |
| Others | 15.96 | 201.70 | 61.53 | 7.11 | 6.53 | 6.09 | 0.02 |
| At-sea | 217.47 | 2925.27 | 846.41 | 100.36 | 92.29 | 117.54 | 0.30 |
| Total | 375.24 | 4918.96 | 1454.55 | 170.64 | 156.84 | 177.78 | 0.52 |
Table 12.
POI ship inventory by ship activity phase in 2017 (unit: ton).
| Phase | CO | NOx | SOx | PM10 | PM2.5 | VOCs | NH3 |
|---|---|---|---|---|---|---|---|
| Anchorage | 22.90 | 289.40 | 88.28 | 10.20 | 9.37 | 8.74 | 0.03 |
| Maneuver | 7.28 | 91.78 | 28.01 | 3.23 | 2.97 | 2.79 | 0.01 |
| Cruise | 187.29 | 2544.09 | 730.12 | 86.93 | 79.95 | 106.01 | 0.26 |
| Hotel | 157.77 | 1993.69 | 608.15 | 70.28 | 64.54 | 60.24 | 0.22 |
| Total | 375.24 | 4918.96 | 1454.55 | 170.64 | 156.84 | 177.78 | 0.52 |
© 2020 by the authors. Licensee MDPI, Basel, Switzerland. This article is an open access article distributed under the terms and conditions of the Creative Commons Attribution (CC BY) license (http://creativecommons.org/licenses/by/4.0/).
Share and Cite
MDPI and ACS Style
Lee, H.; Park, D.; Choo, S.; Pham, H.T. Estimation of the Non-Greenhouse Gas Emissions Inventory from Ships in the Port of Incheon. Sustainability 2020, 12, 8231. https://0-doi-org.brum.beds.ac.uk/10.3390/su12198231
AMA Style
Lee H, Park D, Choo S, Pham HT. Estimation of the Non-Greenhouse Gas Emissions Inventory from Ships in the Port of Incheon. Sustainability. 2020; 12(19):8231. https://0-doi-org.brum.beds.ac.uk/10.3390/su12198231
Chicago/Turabian StyleLee, Hyangsook, Dongjoo Park, Sangho Choo, and Hoang T. Pham. 2020. "Estimation of the Non-Greenhouse Gas Emissions Inventory from Ships in the Port of Incheon" Sustainability 12, no. 19: 8231. https://0-doi-org.brum.beds.ac.uk/10.3390/su12198231
Note that from the first issue of 2016, this journal uses article numbers instead of page numbers. See further details here.