Article

Framework for Greenhouse Gas Emissions Calculations in the Context of Road Freight Transport for the Automotive Industry

1
Department of Transport Management, Marketing and Logistics, Faculty of Transport Engineering, University of Pardubice, 532 10 Pardubice, Czech Republic
2
Department of Informatics and Mathematics in Transport, Faculty of Transport Engineering, University of Pardubice, 532 10 Pardubice, Czech Republic
3
OLTIS Group a.s., 533 51 Pardubice-Rosice, Czech Republic
*
Author to whom correspondence should be addressed.
Sustainability 2021, 13(7), 4068; https://0-doi-org.brum.beds.ac.uk/10.3390/su13074068
Submission received: 28 February 2021 / Revised: 24 March 2021 / Accepted: 31 March 2021 / Published: 6 April 2021
(This article belongs to the Special Issue Sustainable Green Freight System Management)

Abstract

:
The topic of greenhouse gas emissions calculations in the context of freight transport is very current. This topic is very interesting for many stakeholders, such as companies, suppliers, employees, customers, residents, etc. The automotive industry is a major producer of greenhouse gas emissions from logistic processes. Due to this fact, it is necessary to search for and create frameworks for the calculation of greenhouse gas emissions in this sector. The requirements for the calculation of greenhouse gas emissions from road freight transport in the automotive industry were identified using semi-structured interviews. Available emission freight calculators were analyzed using the content and comparative analysis. The proposed frameworks for greenhouse gas emissions calculations in the context of road freight transport of material and finished manufactured passenger cars for the automotive industry were applied in the form of an interpretative case study. The main result of the article is the proposal of the frameworks for greenhouse gas (carbon and sulfur dioxide) emissions calculations in the context of road freight transport of the material and finished manufactured passenger cars for the automotive industry. The proposed frameworks were applied and verified. The use of the proposed frameworks can be expected in logistic planning and decision-making.

1. Introduction

As a result of global warming, increasing attention is being paid to one of its causes, and that is the constant increase in greenhouse gases (hereinafter GHG) due to various human activities [1]. The authors of the article focus on GHG emissions from road freight transport in the automotive industry with the aim to calculate them.
The transport sector is the second most important sector contributing to the production of CO2 emissions worldwide [2]. It is responsible for more than 30% of the total energy consumption within the country members of the European Environment Agency [3].
According to the IEA (International Energy Agency) [4], global transport emissions increased by less than 0.5% in 2019 (compared with 1.9% annually since 2000) owing to efficiency improvements, electrification, and greater use of biofuels (Figure 1). Nevertheless, transport is still responsible for 24% of direct CO2 emissions from fuel combustion [4]. In terms of transport modes, road vehicles account for nearly 75% of global transport emissions [5], and emissions from aviation and shipping continue to increase, but more emphasis on greater international policy focuses on these hard-to-abate subsectors [4].
The automotive industry has long been the most important sector of the economy in the Czech Republic, but also in the European Union. In the Czech Republic, it accounts for approximately 10% of the gross domestic product (GDP) [6]. Many global and domestic suppliers are linked to the automotive industry. Suppliers involved in the production chain of the automotive industry of the Czech Republic participate 23% of the industrial production of the Czech Republic [6]. Large material flows (for example, components, finished cars) are associated with the automotive industry, which means a large amount of transport, and this creates GHG emissions.
Low emission logistics have become an expected and desired goal in all fields of transport, particularly in the European Union (EU) [7]. The EU is already on track to meet its GHG emissions reduction target for 2020 and has put forward a plan to further reduce emissions by at least 55% in 2030 [8].
Road transport is one of the main sources of air pollutants [9]. Emissions from road freight transport continue to rise [4]. This is illustrated in Figure 1.
Since 2019, the growth rate of emissions has continued to decline, with the forecast that emissions from transport will decrease in the near future. The emissions are also connected with freight volume and roadway infrastructure, which can be analyzed to assist the policymakers in reducing global emissions [10].
Figure 1. Transport sector CO2 emissions by mode in the Sustainable Development Scenario, 2000–2030 [11].
Sustainability 13 04068 g001
Matthias et al. [12] focus on modelling road transport emissions in Germany until 2040 for the sustainable development of transport. Craglia and Cullen [13] deal with modeling transport emissions in Great Britain. Each country must ensure the sustainability of transport. For example, Poland must face the inevitable transition to renewable energy sources, which will decrease the consumption of fossil fuels and, consequently, GHG emissions from road transport [14].
European standard EN 16258 Methodology for the calculation and declaration of energy consumption and GHG emissions of transport services (freight and passengers) was approved by the European Committee for Standardization in 2012 [15,16]. Nowadays, there are three main approaches to measuring energy consumption and produced emissions—Well-to-Wheel (hereinafter also referred to as WtW), Well-to-Tank (hereinafter also referred to as WtT), and Tank-to-Wheel (hereinafter also referred to as TtW):
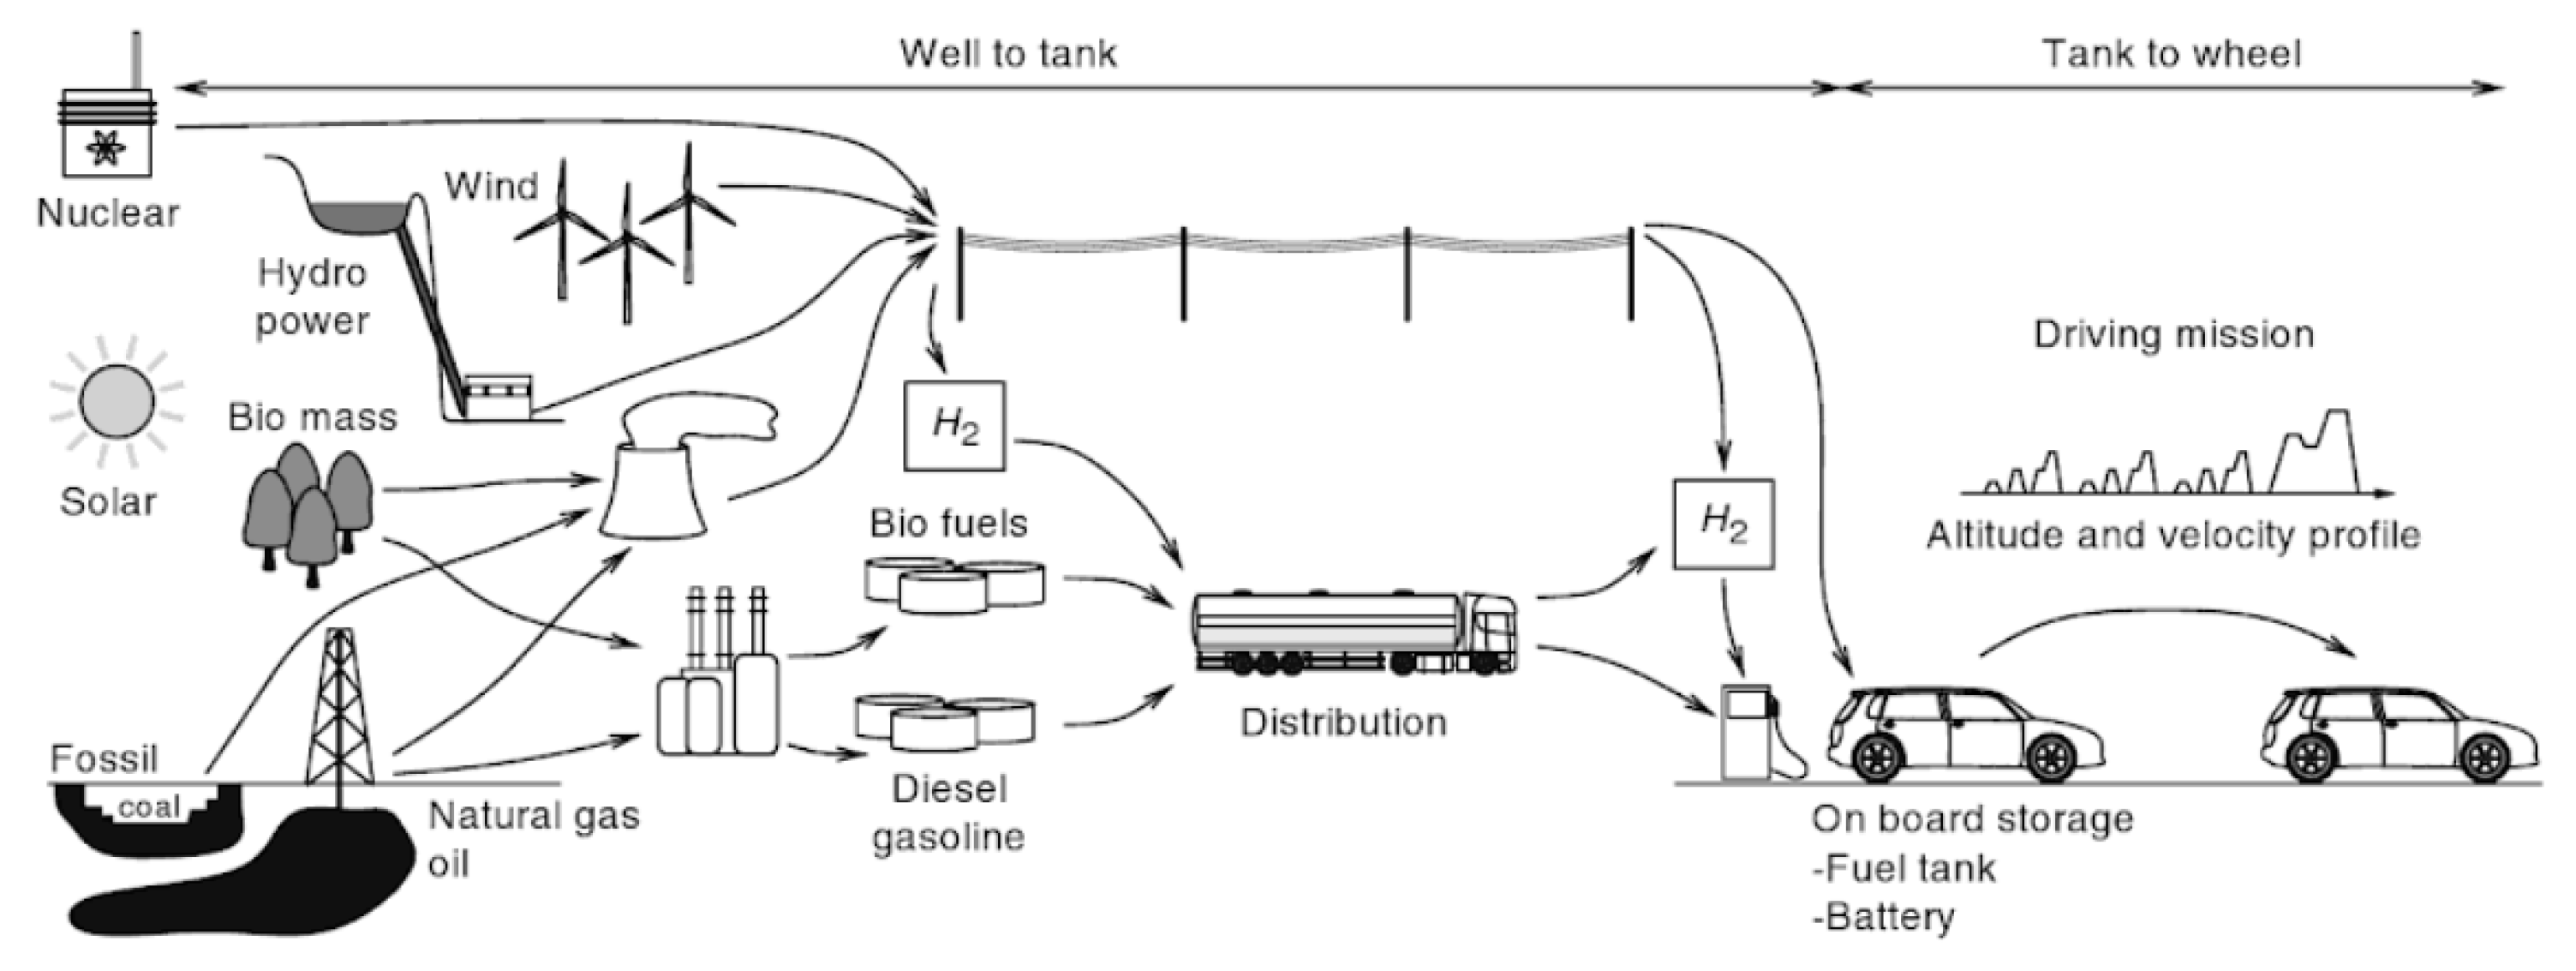
  • Well-to-Wheel (total Well-to-Tank together with Tank-to-Wheel): An approach based on the monitoring of energy consumption and associated emissions production that covers the whole process from the generation of electricity or fuel, through the supply to the appropriate transport means through the distribution network, to the consumption associated with the operation of the means of transport. This approach is based on the sum of Tank-to-Wheel and Well-to-Tank values (Figure 2) [16].
  • Well-to-Tank: Energy consumption and production of emissions related to the production of energy or fuel—the indicator covers all activities from the extraction of raw materials through the production of energy or fuel, up to the supply to the respective means of transport through the distribution network. The indicator does not include the transport mode (Figure 2) [16].
  • Tank-to-Wheel: Energy consumption and production of emissions related to the operation of the means of transport. The indicator does not include the next life cycle of the fuel or transport means (Figure 2) [16].
The framework for GHG emissions calculations in the context of road freight transport should identify the relationship between the financial aspect and the level of generated GHG emissions [17]. Important user inputs for GHG emissions calculation are the type of vehicle, emission standard, load weight and transport distance. Longer transport distances lead to increased vehicle emissions on transportation routes, resulting in a greater carbon footprint [18].
A reduction in GHG emissions from freight transport can be achieved by pooling supply chains [19].
Calculators of GHG emissions are important tools for estimating GHG emissions and for providing information that can lead to behavioral and policy change [20,21].
The aim of this article is to propose a framework for greenhouse gas emissions calculations in the context of road freight transport for the automotive industry.

2. Materials and Methods

The processing procedure consists of five steps (Figure 3). The requirements for the calculation of GHG emissions from road freight transport in the automotive industry are identified in the first step using the scientific method of semi-structured interviews (theoretically described in Section 2.1). Available emission freight calculators are analyzed in the second step using the scientific method of content and comparative analysis (theoretically described in Section 2.2 and Section 2.3). The frameworks for GHG emissions calculations in the context of road freight transport of the material and finished manufactured passenger cars (hereinafter FMPC) for the automotive industry are proposed in the third step. The frameworks for carbon and sulfur dioxide emissions calculations in the context of road freight transport for the automotive industry are proposed in the fourth step.
The frameworks for GHG emissions calculations in the context of road freight transport of the material and FMPC for the automotive industry are applied in the fifth step using the scientific method of interpretative case study (theoretically described in Section 2.4). The processing procedure is shown in Figure 3.
The scientific methods used in this research are theoretically defined in the following sections.

2.1. Semi-Structured Interviews

The scientific method of semi-structured interviews is used to identify requirements for the calculation of GHG emissions from road freight transport with respondents from a leading company in the automotive industry operating on the market in the Czech Republic.
The method of semi-structured interviews is highly recommended in the situation where researchers were able to narrow down some areas or topics of the research because a completely unstructured interview has the risk of not eliciting the topics or themes more closely related to the research questions under consideration [22]. The sample size in qualitative studies may vary, but within semi-structured interviews, a small sample is sufficient [23].
The method of semi-structured interviews was, for example, used by Naghavi et al. [24] for data collection from pilots and safety personnel, Aljohani and Thompson [25] for the examination of last mile delivery practices of freight carriers servicing business receivers in inner-city areas, Nakanishi and Black [26] for travel habit creation of the elderly and the transition to sustainable transport, and Hilgarter and Granig [27] to obtain the public perception of autonomous vehicles after riding an autonomous shuttle.

2.2. Content Analysis

The scientific method of content analysis is used to analyze available emission freight calculators. The method of content analysis is based on the depth examination of sources [28]. This allows the collection and analysis of whatever user-generated content as electronic information [29]. The abundance of text available in the online space builds the basis for content analysis [30]. Content analysis is one of the most commonly used methods to deal with qualitative data [31].
This method was, for example, used by Leung et al. for the research processing in the area of fuel price changes and their impacts on urban transport, Zhou and Wang to explore the logistic market, Gao et al. to explore the public participation in smart-city governance in Urban China, and Fu and Zhang to analyze master plans of eco, low-carbon and conventional new towns in China [28,32,33,34].

2.3. Comparative Analysis

The scientific method of comparative analysis is used to analyze and compare available emission freight calculators. The method of comparative analysis is a data analysis technique for determining which logical conclusions a data set supports [35]. The method begins with listing all the combinations of variables observed in the data set, followed by applying the rules of logical inference to determine which descriptive inferences or implications the data support [35].
The method of comparative analysis was, for example, used by Carvalho and Medeiros to evaluate two models (SERVQUAL and SERVPERF) to investigate the factors that influence the formation of perceived quality in airline services, Shah et al. to compare and analyze both conventional fuel and hybrid bus systems for the Multan city of Pakistan, Zitricky et al. to assess railway and air passenger transport operation in terms of environmental impact, and Mintzia et al. to investigate the CO2 impact of the construction and operation of the main highway and railway line infrastructure in Greece [36,37,38,39].

2.4. Interpretative Case Study

The scientific method of interpretative case study is used to demonstrate and verify the proposed framework for GHG emissions (carbon and sulfur dioxide) calculations in the context of road freight transport of the material and FMPC for the automotive industry.
Using interpretive case studies is therefore perfectly justified for exploratory research [40]. The emerging nature of research in companies is best suited to an interpretative qualitative approach that can yield a rich understanding of key issues by minimizing the distance between the researcher and the key decision-maker, the owner/manager, in order to develop the practical and theoretical understanding and generate new and alternative theories and concepts [41]. The approach can be used regardless of the size of the company. When using interpretative case studies for exploratory research, key decisions for the researcher concern the role of prior theory, the unit(s) of analysis, the number and selection of cases, the techniques to be used for data collection, and the method(s) by which the collected data will be analyzed [42].
The method of interpretative case study was, for example, used by Melo et al. for investigation factors that affect agile team productivity in three large companies in Brazil [43].

3. Results

The Results chapter consists of these sections: identification of requirements for the calculation of greenhouse gas emissions from road freight transport (Section 3.1), analysis of available emission freight calculators (Section 3.2), framework for greenhouse gas emissions calculations in the context of road freight transport of material and finished manufactured passenger cars for the automotive industry proposal (Section 3.3 and Section 3.4), framework for carbon dioxide and sulfur dioxide emissions calculations in the context of road freight transport for the automotive industry proposal (Section 3.5 and Section 3.6), framework for greenhouse gas emissions calculations in the context of road freight transport of material and finished manufactured passenger cars for the automotive industry application (Section 3.7 and Section 3.8).

3.1. Identification of Requirements for the Calculation of Greenhouse Gas Emissions from Road Freight Transport

Two independent researchers used the two-round semi-structured interview in October 2020 with three respondents from a leading company in the automotive industry operating on the market in the Czech Republic [44,45,46].
The semi-structured interview covered the following areas:
  • Calculating GHG emissions from road transport;
  • Using GHG emissions calculators;
  • Cargo types;
  • Vehicle types and their specifications;
  • Transport restrictive conditions and limitations;
  • GHG emissions calculation requirements.
The specific questions used in the semi-structured interview are in Appendix A. The aggregated answers are shown in Appendix B. An overview of the specifications and parameters of the vehicles used for road freight transport is shown in Table 1. The overview is divided into vehicles for the transport of FMPC and material.
The most important conclusions obtained from the semi-structured interview are as follows: this issue is very current for the leading company in the automotive industry operating on the market in the Czech Republic. The company does not currently use any road transport emissions freight calculators because there is no suitable emission freight calculator available to meet the company’s requirements. The logistic processes of the company are very extensive and specific with many conditions. Currently, there is no freight emission calculator that contains all specifics.

3.2. Analysis of Available Emission Freight Calculators

Three independent researchers used the content analysis and comparative analysis of emission freight calculators available in December 2020 based on the outputs of the semi-structured interview. These emission freight calculators were considered:
  • No. 1—CO2 emission calculator—EECA Business [47];
  • No. 2—Emission calculator and carbon offset—SAS [48];
  • No. 3—Emissions Calculator—Cargolux [49];
  • No. 4—Business CO2 emissions calculator—ClimateCare [50];
  • No. 5—Freight Emissions Calculator [51];
  • No. 6—Emission Calculators—Sustainable Freight [52];
  • No. 7—EcoTransIT World—Calculation [53];
  • No. 8—Van Donge & De Roo calculator [54];
  • No. 9—OOCL Carbon Calculator [55];
  • No. 10—Carbon Calculator—cn.ca [56].
The results of the content analysis of emission freight calculators are presented in Table 2. If the emission freight calculator did not allow the calculation of emissions from road freight transport (emission freight calculator no. 2, 3, 6, 8 and 9), it was not further analyzed, respectively, not part of Table 2. Monitored parameters, which are important for the research, are shown in the columns.
None of the analyzed emission freight calculators allow the transport of FMPC or material and none of the analyzed emission freight calculators allow the implementation of restrictive conditions according to the required specification. Only one emission freight calculator (no. 7) allows you to enter the vehicle parameters according to your specification, calculate emissions for one-way and round trip transport, calculate the emissions produced as CO2e and SO2e outputs and use three different calculation approaches; but it does not meet other important requirements. Only one emission freight calculator (no. 4) allows you to monetize produced emissions, but it does not meet other important requirements.
In conclusion, it can be stated that none of the analyzed emission freight calculators are suitable for use in companies in the automotive industry because they do not meet all the conditions and requirements (specified in Table 2). This statement was also confirmed by the results of semi-structured interviews (Appendix A and Appendix B). Based on these facts, a market gap was identified.

3.3. Framework for Greenhouse Gas Emissions Calculations in the Context of Road Freight Transport of the Material for the Automotive Industry Proposal

The framework for GHG emissions calculations in the context of road freight transport for the automotive industry proposal is presented in Figure 4. The calculation of GHG emissions from road freight transport starts with the selection of the vehicle (the first step in Figure 4). The vehicle is selected by the user from a predefined menu. In the second step, the user selects the emission standard of the vehicle from a predefined menu of emission standards. Based on the selected vehicle and the emission standard, related parameters and specifications are retrieved from the database. In the third step, the user enters either the weight of the transported material or the number of transported FMPC according to their types. Based on the entered inputs, predefined restrictive conditions and limitations are checked. If they are not met, it is necessary to modify the entered inputs. If they are met, the next step proceeds. In the fourth and fifth step, the transport distance and the type of transport are entered (whether it is a round trip or one-way transport). Furthermore, the vehicle load factor is also calculated and the emission coefficients are searched in the database. Finally, emissions are calculated and the results are presented. Further in the text, the restrictive conditions and limitations and the method of searching for emission coefficients in the database are given.
Concerning the transported weight of the material, the following restrictive conditions and limitations must be respected:
for V4 to V7: W ≤ Wmax ≤ 24,000 [kg],
for V8: W ≤ Wmax ≤ 12,000 [kg],
for V9: W ≤ Wmax ≤ 3350 [kg],
where V4–9 represent vehicles for the transportation of material (the specification and parameters of the vehicles are shown in Table 1), W is the weight of the material and Wmax is the maximum load weight of the vehicle.
Concerning the transported volume of material, the following restrictive conditions and limitations must be respected:
for V4: LV ≤ LVmax ≤ 150 [m3],
for V5: LV ≤ LVmax ≤ 100 [m3],
for V6: LV ≤ LVmax ≤ 120 [m3],
for V7: LV ≤ LVmax ≤ 80 [m3],
for V8: LV ≤ LVmax ≤ 120 [m3],
for V9: LV ≤ LVmax ≤ 38 [m3],
where V4–9 represent vehicles for the transportation of material (the specification and parameters of the vehicles are shown in Table 1), LV is the load volume of the material and LVmax is the maximum load volume of the vehicle.
The vehicle load factor is calculated as follows:
LFi = round up [W/Wmax] [−], LFi ∈ <0;1>, i = <1; ∞),
where LFi is the vehicle load factor of vehicle i, i is the type of the vehicle, W is the weight of the material and Wmax is the maximum load weight of the vehicle.
The emission coefficients are searched in the database according to the following algorithmic procedures from the perspective of the maximum load weight of the vehicle:
IF vehicle V4 to V7 THEN emission coefficients for 24 t vehicles,
IF vehicle V8 THEN emission coefficients for 12 t vehicles,
IF vehicle V9 THEN emission coefficients for 3.35 t vehicles,
where V4–9 represent vehicles for the transportation of the material.
The emission coefficients are searched in the database according to the following algorithmic procedures from the perspective of the emission standard of the vehicle:
IF emission standard “EURO 3” THEN emission coefficients for “EURO 3”,
IF emission standard “EURO 4” THEN emission coefficients for “EURO 4”,
IF emission standard “EURO 5” THEN emission coefficients for “EURO 5”,
IF emission standard “EURO 6” THEN emission coefficients for “EURO 6”,
where EURO 3–6 are emission standards.
The emission coefficients are searched in the database according to the following algorithmic procedures (Equation (6)) after the aggregation of conditions (Equations (4) and (5)):
IF vehicle V4 to V7 AND emission standard “EURO 3” THEN emission
coefficients for “EURO 3” 24 t vehicles,
IF vehicle V4 to V7 AND emission standard “EURO 4” THEN emission
coefficients for “EURO 4” 24 t vehicles,
:
IF vehicle V4 to V7 AND emission standard “EURO 6” THEN emission
coefficients for “EURO 6” 24 t vehicles,
where V4–7 represent vehicles for the transportation of material.
The emission coefficients are searched in the database according to the following algorithmic procedures (Equation (7)) after the aggregation of conditions (Equations (4) and (5)):
IF vehicle V8 AND emission standard “EURO 3” THEN emission
coefficients for “EURO 3” 12 t vehicles,
IF vehicle V8 AND emission standard “EURO 4” THEN emission
coefficients for “EURO 4” 12 t vehicles,
:
IF vehicle V8 AND emission standard “EURO 6” THEN emission
coefficients for “EURO 6” 12 t vehicles,
where V8 is the vehicle for the transportation of material.
The emission coefficients are searched in the database according to the following algorithmic procedures (Equation (8)) after the aggregation of conditions (Equations (4) and (5)):
IF vehicle V9 AND emission standard “EURO 3” THEN emission
coefficients for “EURO 3” 3.35 t vehicles,
IF vehicle V9 AND emission standard “EURO 4” THEN emission
coefficients for “EURO 4” 3.35 t vehicles,
:
IF vehicle V9 AND emission standard “EURO 6” THEN emission
coefficients for “EURO 6” 3.35 t vehicles,
where V9 is the vehicle for the transportation of material.
The emission coefficients are further searched in the database according to the following algorithmic procedures concerning the type of transport:
IF one-way transport THEN find values of emission coefficients
for ECWtTb, ECWtTf, ECTtWb, ECTtWf, EC0WtTb, EC0WtTf, EC0TtWb and EC0TtWf,
IF round trip transport THEN find values of emission coefficients
for ECWtTb, ECWtTf, ECTtWb and ECTtWf,
where ECWtTb is the relevant emission coefficient of the biogenic origin calculated using the WtT approach, ECWtTf is the relevant emission coefficient of the fossil origin calculated using the WtT approach, ECTtWb is the relevant emission coefficient of the biogenic origin calculated using the TtW approach, ECTtWf is the relevant emission coefficient of the fossil origin calculated using the TtW approach, EC0WtTb is the relevant emission coefficient for the zero load of the biogenic origin calculated using the WtT approach, EC0WtTf is the relevant emission coefficient for the zero load of the fossil origin calculated using the WtT approach, EC0TtWb is the relevant emission coefficient for the zero load of the biogenic origin calculated using the TtW approach, and EC0TtWf is the relevant emission coefficient for the zero load of the fossil origin calculated using the TtW approach.
The application of the framework for GHG emissions calculations in the context of road freight transport of the material for the automotive industry is presented in Section 3.7.

3.4. Framework for Greenhouse Gas Emissions Calculations in the Context of Road Freight Transport of Finished Manufactured Passenger Cars for the Automotive Industry Proposal

The framework for GHG emissions calculations in the context of road freight transport for the automotive industry proposal is presented in Figure 4. Concerning the transported weight of FMPC, the following restrictive conditions and limitations must be respected:
for V1: W ≤ Wmax ≤ 20,000 [kg],
for V2: W ≤ Wmax ≤ 11,500 [kg],
for V3: W ≤ Wmax ≤ 8000 [kg],
where V1–3 represent vehicles for the transportation of FMPC (the specification and parameters of the vehicles are shown in Table 1), W is the weight of the FMPC and Wmax is the maximum load weight of the vehicle.
Concerning the transported volume of FMPC, the following restrictive conditions and limitations must be respected:
IF V1 AND (PC1 + PC2) < 3 THEN for V1: LV ≤ LVmax ≤ 8 [−],
IF V1 AND (PC1 + PC2) ≥ 3 THEN for V1: LV ≤ LVmax ≤ 9 [−],
IF V2 THEN LV ≤ LVmax ≤ 4 [−],
IF V3 THEN LV ≤ LVmax ≤ 2 [−],
where V1–3 represent vehicles for the transportation of FMPC (the specification and parameters of the vehicles are shown in Table 1), LV is the load volume of the FMPC and LVmax is the maximum load volume of the vehicle.
The required number of vehicles LKW for FMPC transport is calculated as follows:
IF1 V2 THEN round up [∑ PCj/LVmax] = LKW [−], j = <1; ∞), LKW ∈ N,
IF1 V3 THEN round up [∑ PCj/LVmax] = LKW [−], j = <1; ∞), LKW ∈ N,
IF1 V1 AND (PC1 + PC2) < 3 THEN for V1: round up [∑ PCj/LVmax] = LKW [−], j = <1; ∞), LKW ∈ N,
IF1 V1 AND (PC1 + PC2) ≥ 3 THEN round down [(PC1 + PC2)/3] = LKW9, LKW9 · 9 = PLKW9 [−],
IF2 PLKW9 = ∑ PCj THEN LKW9 = LKW, LKW ∈ N,
IF2 PLKW9 < ∑ PCj THEN [round up (∑ PCj − PLKW9)/8] + LKW9 = LKW, LKW ∈ N,
IF2 PLKW9 > ∑ PCj AND IF3 PLKW9 − ∑ PCj ≥ 9 THEN
LKW9 − [{round down (PLKW9 − ∑ PCj)}/9] = LKW, LKW ∈ N,
IF2 PLKW9 > ∑ PCj AND IF3 PLKW9 − ∑ PCj < 9 THEN LKW9 = LKW,
LKW ∈ N,
where V1–3 represent vehicles for the transportation of FMPC (the specification and parameters of the vehicles are shown in Table 1), PCj is the number of FMPC type j, j is the type of transported FMPC, LVmax is the maximum load volume of the vehicle, LKW is the number of vehicles for FMPC transport, LKW9 is the number of vehicles for nine FMPC transport and PLKW9 is the number of places in the LKW9 vehicle for FMPC transport.
Then, the average vehicle load factor is calculated as follows:
LFi = round up [∑ W/∑ Wmax] [−], LFi ∈ <0;1>, i = <1; ∞),
where LFi is the average vehicle load factor of vehicle i, i is the type of vehicle, W is the weight of the FMPC and Wmax is the maximum load weight of the vehicle.
The emission coefficients are searched in the database according to the following algorithmic procedures from the perspective of the maximum load weight of the vehicle:
IF vehicle V1 THEN emission coefficients for 20 t vehicles,
IF vehicle V2 THEN emission coefficients for 11.5 t vehicles,
IF vehicle V3 THEN emission coefficients for 8 t vehicles,
where V1–3 represent vehicles for the transportation of FMPC.
The emission coefficients are searched in the database according to the following algorithmic procedures from the perspective of the emission standard of the vehicle:
IF emission standard “EURO 3” THEN emission coefficients for “EURO 3”,
IF emission standard “EURO 4” THEN emission coefficients for “EURO 4”,
IF emission standard “EURO 5” THEN emission coefficients for “EURO 5”,
IF emission standard “EURO 6” THEN emission coefficients for “EURO 6”,
where EURO 3–6 are emission standards.
The emission coefficients are searched in the database according to the following algorithmic procedures (Equation (16)) after the aggregation of conditions (Equations (14) and (15)):
IF vehicle V1 AND emission standard “EURO 3” THEN emission
coefficients for “EURO 3” 20 t vehicles,
IF vehicle V1 AND emission standard “EURO 4” THEN emission
coefficients for “EURO 4” 20 t vehicles,
:
IF vehicle V1 AND emission standard “EURO 6” THEN emission
coefficients for “EURO 6” 20 t vehicles,
where V1 is the vehicle for the transportation of FMPC.
The emission coefficients are searched in the database according to the following algorithmic procedures (Equation (17)) after the aggregation of conditions (Equations (14) and (15)):
IF vehicle V2 AND emission standard “EURO 3” THEN emission
coefficients for “EURO 3” 11.5 t vehicles,
IF vehicle V2 AND emission standard “EURO 4” THEN emission
coefficients for “EURO 4” 11.5 t vehicles,
:
IF vehicle V2 AND emission standard “EURO 6” THEN emission
coefficients for “EURO 6” 11.5 t vehicles,
where V2 is the vehicle for the transportation of FMPC.
The emission coefficients are searched in the database according to the following algorithmic procedures (Equation (18)) after the aggregation of conditions (Equations (14) and (15)):
IF vehicle V3 AND emission standard “EURO 3” THEN emission
coefficients for “EURO 3” 8 t vehicles,
IF vehicle V3 AND emission standard “EURO 4” THEN emission
coefficients for “EURO 4” 8 t vehicles,
:
IF vehicle V3 AND emission standard “EURO 6” THEN emission
coefficients for “EURO 6” 8 t vehicles,
where V3 is the vehicle for the transportation of FMPC.
The emission coefficients are further searched in the database according to the following algorithmic procedures concerning the type of transport:
IF one-way transport THEN find values of emission coefficients
for ECWtTb, ECWtTf, ECTtWb, ECTtWf, EC0WtTb, EC0WtTf, EC0TtWb and EC0TtWf,
IF round trip transport THEN find values of emission coefficients
for ECWtTb, ECWtTf, ECTtWb and ECTtWf,
where ECWtTb is the relevant emission coefficient of the biogenic origin calculated using the WtT approach, ECWtTf is the relevant emission coefficient of the fossil origin calculated using the WtT approach, ECTtWb is the relevant emission coefficient of the biogenic origin calculated using the TtW approach, ECTtWf is the relevant emission coefficient of the fossil origin calculated using the TtW approach, EC0WtTb is the relevant emission coefficient for the zero load of the biogenic origin calculated using the WtT approach, EC0WtTf is the relevant emission coefficient for the zero load of the fossil origin calculated using the WtT approach, EC0TtWb is the relevant emission coefficient for the zero load of the biogenic origin calculated using the TtW approach, and EC0TtWf is the relevant emission coefficient for the zero load of the fossil origin calculated using the TtW approach.
The application of the framework for GHG emissions calculations in the context of road freight transport of FMPC for the automotive industry is presented in Section 3.8.

3.5. Framework for Carbon Dioxide Emissions Calculations in the Context of Road Freight Transport for the Automotive Industry Proposal

Carbon dioxide emissions are calculated for a specific shipment. In the case of round trip transportation, Equations (20)–(27) are used. In the case of one-way transportation, Equations (28)–(36) are used.
The total carbon dioxide emissions produced by round trip transportation are calculated as:
E = E1 [kgCO2e],
where E represents the total carbon dioxide emissions produced by transportation and E1 are the total carbon dioxide emissions produced by the round trip transportation.
E1 are calculated using the WtW approach:
E1 = E1WtT + E1TtW [kgCO2e],
where E1WtT are the carbon dioxide emissions calculated using the WtT approach and E1TtW are the carbon dioxide emissions calculated using the TtW approach.
E1WtT are the carbon dioxide emissions calculated using the WtT approach and consisting of two components:
E1WtT = E1WtTb + E1WtTf [kgCO2e],
where E1WtTb are the carbon dioxide emissions of biogenic origin calculated using the WtT approach and E1WtTf are the carbon dioxide emissions of fossil origin calculated using the WtT approach.
E1TtW are the carbon dioxide emissions calculated using the TtW approach and consisting of two components:
E1TtW = E1TtWb + E1TtWf [kgCO2e],
where E1TtWb are the carbon dioxide emissions of biogenic origin calculated using the TtW approach and E1TtWf are the carbon dioxide emissions of fossil origin calculated using the TtW approach.
E1WtTb are calculated as follows:
E1WtTb [kgCO2e] = ECWtTb [kgCO2e/tkm] · W [t] · D1 [km],
where ECWtTb is the relevant emission coefficient, W is the weight of the load and D1 is the transport distance.
E1WtTf are calculated as follows:
E1WtTf [kgCO2e] = ECWtTf [kgCO2e/tkm] · W [t] · D1 [km],
where ECWtTf is the relevant emission coefficient, W is the weight of the load and D1 is the transport distance.
E1TtWb are calculated as follows:
E1TtWb [kgCO2e] = ECTtWb [kgCO2e/tkm] · W [t] · D1 [km],
where ECTtWb is the relevant emission coefficient, W is the weight of the load and D1 is the transport distance.
E1TtWf are calculated as follows:
E1TtWf [kgCO2e] = ECTtWf [kgCO2e/tkm] · W [t] · D1 [km],
where ECTtWf is the relevant emission coefficient, W is the weight of the load and D1 is the transport distance.
The total carbon dioxide emissions produced by one-way transportation are calculated as:
E = E1 + E2 [kgCO2e],
where E represents the total carbon dioxide emissions produced by transportation, E1 are the total carbon dioxide emissions produced by the one-way transportation and E2 are the additional carbon dioxide emissions (the penalty for an unloaded vehicle).
E2 are calculated using the WtW approach:
E2 = E2WtT + E2TtW [kgCO2e],
where E2WtT are the carbon dioxide emissions calculated using the WtT approach and E2TtW are the carbon dioxide emissions calculated using the TtW approach.
E2WtT are the carbon dioxide emissions calculated using the WtT approach and consisting of two components:
E2WtT = E2WtTb + E2WtTf [kgCO2e],
where E2WtTb are the carbon dioxide emissions of biogenic origin calculated using the WtT approach and E2WtTf are the carbon dioxide emissions of fossil origin calculated using the WtT approach.
E2TtW are the carbon dioxide emissions calculated using the TtW approach and consisting of two components:
E2TtW = E2TtWb + E2TtWf [kgCO2e],
where E2TtWb are the carbon dioxide emissions of biogenic origin calculated using the TtW approach and E2TtWf are the carbon dioxide emissions of fossil origin calculated using the TtW approach.
The additional distance D2 as a penalty for an unloaded vehicle is calculated as follows:
D2 [km] = D1 [km] · cd [−],
where D1 is the transport distance and cd is the internal coefficient defined by the company.
E2WtTb are calculated as follows:
E2WtTb [kgCO2e] = EC0WtTb [kgCO2e/km] · D2 [km],
where EC0WtTb is the relevant emission coefficient for the zero load and D2 is the additional transport distance.
E2WtTf are calculated as follows:
E2WtTf [kgCO2e] = EC0WtTf [kgCO2e/km] · D2 [km],
where EC0WtTf is the relevant emission coefficient for the zero load and D2 is the additional transport distance.
E2TtWb are calculated as follows:
E2TtWb [kgCO2e] = EC0TtWb [kgCO2e/km] · D2 [km],
where EC0TtWb is the relevant emission coefficient for the zero load and D2 is the additional transport distance.
E2TtWf are calculated as follows:
E2TtWf [kgCO2e] = EC0TtWf [kgCO2e/km] · D2 [km],
where EC0TtWf is the relevant emission coefficient for the zero load and D2 is the additional transport distance.

3.6. Framework for Sulfur Dioxide Emissions Calculations in the Context of Road Freight Transport for the Automotive Industry Proposal

Sulfur dioxide emissions are calculated for a specific shipment. In the case of round trip transportation, Equations (37)–(44) are used. In the case of one-way transportation, Equations (45)–(53) are used.
The total sulfur dioxide emissions produced by round trip transportation are calculated as:
E = E1 [kgSO2e],
where E represents the total sulfur dioxide emissions produced by transportation and E1 are the total sulfur dioxide emissions produced by the round trip transportation.
E1 are calculated using the WtW approach:
E1 = E1WtT + E1TtW [kgSO2e],
where E1WtT are the sulfur dioxide emissions calculated using the WtT approach and E1TtW are the sulfur dioxide emissions calculated using the TtW approach.
E1WtT are the sulfur dioxide emissions calculated using the WtT approach and consisting of two components:
E1WtT = E1WtTb + E1WtTf [kgSO2e],
where E1WtTb are the sulfur dioxide emissions of biogenic origin calculated using the WtT approach and E1WtTf are the sulfur dioxide emissions of fossil origin calculated using the WtT approach.
E1TtW are the sulfur dioxide emissions calculated using the TtW approach and consisting of two components:
E1TtW = E1TtWb + E1TtWf [kgSO2e],
where E1TtWb are the sulfur dioxide emissions of biogenic origin calculated using the TtW approach and E1TtWf are the sulfur dioxide emissions of fossil origin calculated using the TtW approach.
E1WtTb are calculated as follows:
E1WtTb [kgSO2e] = ECWtTb [kgSO2e/tkm] · W [t] · D1 [km],
where ECWtTb is the relevant emission coefficient, W is the weight of the load and D1 is the transport distance.
E1WtTf are calculated as follows:
E1WtTf [kgSO2e] = ECWtTf [kgSO2e/tkm] · W [t] · D1 [km],
where ECWtTf is the relevant emission coefficient, W is the weight of the load and D1 is the transport distance.
E1TtWb are calculated as follows:
E1TtWb [kgSO2e] = ECTtWb [kgSO2e/tkm] · W [t] · D1 [km],
where ECTtWb is the relevant emission coefficient, W is the weight of the load and D1 is the transport distance.
E1TtWf are calculated as follows:
E1TtWf [kgSO2e] = ECTtWf [kgSO2e/tkm] · W [t] · D1 [km],
where ECTtWf is the relevant emission coefficient, W is the weight of the load and D1 is the transport distance.
The total sulfur dioxide emissions produced by one-way transportation are calculated as:
E = E1 + E2 [kgSO2e],
where E represents the total sulfur dioxide emissions produced by transportation, E1 are the total sulfur dioxide emissions produced by the one-way transportation and E2 are the additional sulfur dioxide emissions (the penalty for an unloaded vehicle).
E2 are calculated using the WtW approach:
E2 = E2WtT + E2TtW [kgSO2e],
where E2WtT are the sulfur dioxide emissions calculated using the WtT approach and E2TtW are the sulfur dioxide emissions calculated using the TtW approach.
E2WtT are the sulfur dioxide emissions calculated using the WtT approach and consisting of two components:
E2WtT = E2WtTb + E2WtTf [kgSO2e],
where E2WtTb are the sulfur dioxide emissions of biogenic origin calculated using the WtT approach and E2WtTf are the sulfur dioxide emissions of fossil origin calculated using the WtT approach.
E2TtW are the sulfur dioxide emissions calculated using the TtW approach and consisting of two components:
E2TtW = E2TtWb + E2TtWf [kgSO2e],
where E2TtWb are the sulfur dioxide emissions of biogenic origin calculated using the TtW approach and E2TtWf are the sulfur dioxide emissions of fossil origin calculated using the TtW approach.
The additional distance D2 as a penalty for an unloaded vehicle is calculated as follows:
D2 [km] = D1 [km] · cd [−],
where D1 is the transport distance and cd is the internal coefficient defined by the company.
E2WtTb are calculated as follows:
E2WtTb [kgSO2e] = EC0WtTb [kgSO2e/km] · D2 [km],
where EC0WtTb is the relevant emission coefficient for the zero load and D2 is the additional transport distance.
E2WtTf are calculated as follows:
E2WtTf [kgSO2e] = EC0WtTf [kgSO2e/km] · D2 [km],
where EC0WtTf is the relevant emission coefficient for the zero load and D2 is the additional transport distance.
E2TtWb are calculated as follows:
E2TtWb [kgSO2e] = EC0TtWb [kgSO2e/km] · D2 [km],
where EC0TtWb is the relevant emission coefficient for the zero load and D2 is the additional transport distance.
E2TtWf are calculated as follows:
E2TtWf [kgSO2e] = EC0TtWf [kgSO2e/km] · D2 [km],
where EC0TtWf is the relevant emission coefficient for the zero load and D2 is the additional transport distance.

3.7. Framework for Greenhouse Gas Emissions Calculations in the Context of Road Freight Transport of the Material for the Automotive Industry Application

The application of the framework for GHG emissions calculations in the context of road freight transport of the material for the automotive industry is presented in the form of the interpretative case study in a leading company in the automotive industry operating on the market in the Czech Republic.
Produced GHG emissions are, for example, calculated for the road freight transport with the following parameters:
  • Transportation of the material;
  • Vehicle V4 (Wmax = 24,000 kg, LVmax = 150 m3);
  • Emission standard—EURO 6;
  • Weight of the material W = 21,120 kg;
  • Volume of the material LV = 125 m3;
  • Transport distance D1 = 275 km;
  • Type of transport—round trip transport.
Concerning the transported weight of the material, the following restrictive condition and limitation must be respected (according to Equation (1)):
for V4: 21,120 ≤ Wmax ≤ 24,000 [kg],
where V4 is the vehicle for the transportation of material and Wmax is the maximum load weight of the vehicle. The restrictive condition and limitation are met.
Concerning the transported volume of the material, the following restrictive condition and limitation must be respected (according to Equation (2)):
for V4: 125 ≤ LVmax ≤ 150 [m3],
where V4 is the vehicle for the transportation of material and LVmax is the maximum load volume of the vehicle. The restrictive condition and limitation are met.
The vehicle load factor is calculated (according to Equation (3)) as follows:
LF4 = round up [21,120/24,000] = 0.88 [−], LF4 ∈ <0;1>,
where LF4 is the vehicle load factor of vehicle V4.
The emission coefficients are searched in the database according to the following algorithmic procedure (Equation (6)):
IF vehicle V4 to V7 AND emission standard “EURO 6” THEN emission
coefficients for “EURO 6” 24 t vehicles,
where V4–7 represent vehicles for the transportation of the material.
The emission coefficients are further searched in the database according to the following algorithmic procedures (Equation (9)) concerning the type of transport:
IF round trip transport THEN find values of emission coefficients
for ECWtTb, ECWtTf, ECTtWb and ECTtWf,
where ECWtTb is the relevant emission coefficient of the biogenic origin calculated using the WtT approach, ECWtTf is the relevant emission coefficient of the fossil origin calculated using the WtT approach, ECTtWb is the relevant emission coefficient of the biogenic origin calculated using the TtW approach, and ECTtWf is the relevant emission coefficient of the fossil origin calculated using the TtW approach.
Emission coefficients were searched for LF4 = 0.88 in the database [57] of carbon dioxide emission coefficients (based on Equations (56)–(58)):
  • ECWtTb = 0.00033206 [kgCO2e/tkm];
  • ECWtTf = 0.00741130 [kgCO2e/tkm];
  • ECTtWb = 0.00310000 [kgCO2e/tkm];
  • ECTtWf = 0.04240000 [kgCO2e/tkm].
Emission coefficients were searched for LF4 = 0.88 in the database [57] of sulfur dioxide emission coefficients (based on Equations (56)–(58)):
  • ECWtT = 0.00003268 [kgSO2e/tkm];
  • ECTtW = 0.00000996 [kgSO2e/tkm].
Carbon dioxide emissions are calculated for a specific transportation with defined parameters. In this case, it is round trip transportation and Equations (20)–(27) are used.
E1WtTb are calculated as follows (based on Equation (24)):
E1WtTb = 0.00033206 [kgCO2e/tkm] · 21.12 [t] · 275 [km] = 1.92860448 [kgCO2e].
E1WtTf are calculated as follows (based on Equation (25)):
E1WtTf = 0.00741130 [kgCO2e/tkm] · 21.12 [t] · 275 [km] = 43.04483040 [kgCO2e].
E1TtWb are calculated as follows (based on Equation (26)):
E1TtWb = 0.00310000 [kgCO2e/tkm] · 21.12 [t] · 275 [km] = 18.00480000 [kgCO2e].
E1TtWf are calculated as follows (based on Equation (27)):
E1TtWf = 0.04240000 [kgCO2e/tkm] · 21.12 [t] · 275 [km] = 246.25920000 [kgCO2e].
E1WtT are the carbon dioxide emissions calculated using the WtT approach and consisting of two components (based on Equation (22)):
E1WtT = 1.92860448 + 43.04483040 = 44.97343488 [kgCO2e].
E1TtW are the carbon dioxide emissions calculated using the TtW approach and consisting of two components (based on Equation (23)):
E1TtW = 18.00480000 + 246.25920000 = 264.26400000 [kgCO2e].
E1 are calculated using the WtW approach (based on Equation (21)):
E1 = 44.97343488 + 264.26400000 = 309.23743488 [kgCO2e].
The total carbon dioxide emissions produced by round trip transportation are calculated as (based on Equation (20)):
E = 309.23743488 [kgCO2e],
where E represents the total carbon dioxide emissions produced by transportation.
Sulfur dioxide emissions are calculated for a specific transportation with defined parameters. In this case, it is round trip transportation and Equations (37)–(44) are used.
E1WtT are calculated as follows (based on aggregated Equations (39), (41) and (42)):
E1WtT = 0.00003268 [kgSO2e/tkm] · 21.12 [t] · 275 [km] = 0.18980544 [kgSO2e].
E1TtW are calculated as follows (based on aggregated Equations (40), (43) and (44)):
E1TtW = 0.00000996 [kgSO2e/tkm] · 21.12 [t] · 275 [km] = 0.05784768 [kgSO2e].
E1 are calculated using the WtW approach (based on Equation (38)):
E1 = 0.18980544 + 0.05784768 = 0.24765312 [kgSO2e].
The total sulfur dioxide emissions produced by round trip transportation are calculated as (based on Equation (37)):
E = 0.24765312 [kgSO2e],
where E represents the total sulfur dioxide emissions produced by the transportation.
The results are presented in accordance with the requirements of the company in the following form:
  • Total carbon dioxide emissions = 309.23743488 [kgCO2e];
  • Average carbon dioxide emissions per 1 km = 1.1244997632 [kgCO2e/km];
  • Average carbon dioxide emissions per 1 t = 14.641924 [kgCO2e/t];
  • Average carbon dioxide emissions per 1 tonne-kilometer = 0.05324336 [kgCO2e/tkm];
  • Total sulfur dioxide emissions = 0.24765312 [kgSO2e];
  • Average sulfur dioxide emissions per 1 km = 0.0009005568 [kgSO2e/km];
  • Average sulfur dioxide emissions per 1 t = 0.011726 [kgSO2e/t];
  • Average sulfur dioxide emissions per 1 tonne-kilometer = 0.00004264 [kgSO2e/tkm].
The proposed framework for GHG emissions calculations in the context of road freight transport of the material for the automotive industry (Section 3.3) has been applied and verified.

3.8. Framework for Greenhouse Gas Emissions Calculations in the Context of Road Freight Transport of Finished Manufactured Passenger Cars for the Automotive Industry Application

The application of the framework for GHG emissions calculations in the context of road freight transport of FMPC for the automotive industry is presented in the form of the interpretative case study in a leading company in the automotive industry operating on the market in the Czech Republic.
Produced GHG emissions are, for example, calculated for road freight transport with the following parameters:
  • Transportation of FMPC;
  • Number of FMPC (PC1 = 4, PC2 = 2, PC3 = 1, PC4 = 5, PC5 = 4, PC6 = 2, ∑ PCj = 18);
  • Vehicle V1 (Wmax = 20,000 kg, LVmax = 8 or 9 FMPC by type);
  • Emission standard—EURO 6;
  • Weight of the FMPC W = 31,200 kg;
  • Transport distance D1 = 530 km;
  • Type of transport—round trip transport.
Concerning the transported weight of FMPC, the following restrictive condition and limitation must be respected (according to Equation (10)):
for V1: W ≤ Wmax ≤ 20,000 [kg],
where V1 is the vehicle for the transportation of FMPC and Wmax is the maximum load weight of the vehicle.
Concerning the transported volume of FMPC, the following restrictive condition and limitation (according to Equation (11)) must be respected:
IF V1 AND (4 + 2) ≥ 3 THEN for V1: LV ≤ LVmax ≤ 9 [−],
where V1 is the vehicle for the transportation of FMPC, LV is the load volume of the FMPC and LVmax is the maximum load volume of the vehicle.
The required number of vehicles LKW for FMPC transport is calculated as follows (according to Equation (12)):
IF1 V1 AND (PC1 + PC2) ≥ 3 THEN round down [(PC1 + PC2)/3] = LKW9, LKW9 · 9 = PLKW9 [−],
IF1 V1 AND (4 + 2) ≥ 3 THEN round down [(4 + 2)/3] = 2,
2 · 9 = 18 [−],
IF2 PLKW9 = ∑ PCj THEN LKW9 = LKW, LKW ∈ N,
IF2 18 = 18 THEN 2 = 2, LKW ∈ N,
where V1 is the vehicle for the transportation of FMPC, PCj is the number of FMPC type j, j is the type of transported FMPC, LKW is the number of vehicles for FMPC transport, LKW9 is the number of vehicles for nine FMPC transport and PLKW9 is the number of places in the LKW9 vehicle for FMPC transport. Due to the fact that two vehicles V1 will be used for transport, the restrictive condition and limitation are met (according to Equations (72) and (73)):
for V1: 31,200 ≤ Wmax ≤ (2 · 20,000) [kg],
IF V1 AND (4 + 2) ≥ 3 THEN for V1: 18 ≤ LVmax ≤ (2 · 9) [−],
where V1 is the vehicle for the transportation of FMPC, Wmax is the maximum load weight of the vehicle and LVmax is the maximum load volume of the vehicle.
The average vehicle load factor is calculated (according to Equation (13)) as follows:
LF1 = round up [31,200/40,000] = 0.78 [−], LF1 ∈ <0;1>, i = <1; ∞),
where LF1 is the average vehicle load factor of vehicle V1.
The emission coefficients are searched in the database according to the following algorithmic procedure (Equation (16)):
IF vehicle V1 AND emission standard “EURO 6” THEN emission
coefficients for “EURO 6” 20 t vehicles,
where V1 is the vehicle for the transportation of FMPC.
The emission coefficients are further searched in the database according to the following algorithmic procedures (Equation (19)) concerning the type of transport:
IF round trip transport THEN find values of emission coefficients
for ECWtTb, ECWtTf, ECTtWb and ECTtWf,
where ECWtTb is the relevant emission coefficient of the biogenic origin calculated using the WtT approach, ECWtTf is the relevant emission coefficient of the fossil origin calculated using the WtT approach, ECTtWb is the relevant emission coefficient of the biogenic origin calculated using the TtW approach, and ECTtWf is the relevant emission coefficient of the fossil origin calculated using the TtW approach.
Emission coefficients were searched for LF1 = 0.78 in the database [57] of carbon dioxide emission coefficients (based on Equations (75)–(77)):
  • ECWtTb = 0.00034244 [kgCO2e/tkm];
  • ECWtTf = 0.00802115 [kgCO2e/tkm];
  • ECTtWb = 0.00340000 [kgCO2e/tkm];
  • ECTtWf = 0.04580000 [kgCO2e/tkm].
Emission coefficients were searched for LF1 = 0.78 in the database [57] of sulfur dioxide emission coefficients (based on Equations (75)–(77)):
  • ECWtT = 0.00003540 [kgSO2e/tkm];
  • ECTtW = 0.00001160 [kgSO2e/tkm].
Carbon dioxide emissions are calculated for a specific transportation with defined parameters. In this case, it is round trip transportation and Equations (20)–(27) are used.
E1WtTb are calculated as follows (based on Equation (24)):
E1WtTb = 0.00034244 [kgCO2e/tkm] · 31.2 [t] · 530 [km] = 5.66258784 [kgCO2e].
E1WtTf are calculated as follows (based on Equation (25)):
E1WtTf = 0.00802115 [kgCO2e/tkm] · 31.2 [t] · 530 [km] = 132.63773640 [kgCO2e].
E1TtWb are calculated as follows (based on Equation (26)):
E1TtWb = 0.00340000 [kgCO2e/tkm] · 31.2 [t] · 530 [km] = 56.22240000 [kgCO2e].
E1TtWf are calculated as follows (based on Equation (27)):
E1TtWf = 0.04580000 [kgCO2e/tkm] · 31.2 [t] · 530 [km] = 757.34880000 [kgCO2e].
E1WtT are the carbon dioxide emissions calculated using the WtT approach and consisting of two components (based on Equation (22)):
E1WtT = 5.66258784 + 132.63773640 = 138.30032424 [kgCO2e].
E1TtW are the carbon dioxide emissions calculated using the TtW approach and consisting of two components (based on Equation (23)):
E1TtW = 56.22240000 + 757.34880000 = 813.57120000 [kgCO2e].
E1 are calculated using the WtW approach (based on Equation (21)):
E1 = 138.30032424 + 813.57120000 = 951.87152424 [kgCO2e].
The total carbon dioxide emissions produced by round trip transportation are calculated as (based on Equation (20)):
E = 951.87152424 [kgCO2e],
where E represents the total carbon dioxide emissions produced by transportation.
Sulfur dioxide emissions are calculated for a specific transportation with defined parameters. In this case, it is round trip transportation and Equations (37)–(44) are used.
E1WtT are calculated as follows (based on aggregated Equations (39), (41) and (42)):
E1WtT = 0.00003540 [kgSO2e/tkm] · 31.2 [t] · 530 [km] = 0.58537440 [kgSO2e].
E1TtW are calculated as follows (based on aggregated Equations (40), (43) and (44)):
E1TtW = 0.00001160 [kgSO2e/tkm] · 31.2 [t] · 530 [km] = 0.19181760 [kgSO2e].
E1 are calculated using the WtW approach (based on Equation (38)):
E1 = 0.58537440 + 0.19181760 = 0.77719200 [kgSO2e].
The total sulfur dioxide emissions produced by round trip transportation are calculated as (based on Equation (37)):
E = 0.77719200 [kgSO2e],
where E represents the total sulfur dioxide emissions produced by transportation.
The results are presented in accordance with the requirements of the company in the following form:
  • Total carbon dioxide emissions = 951.87152424 [kgCO2e];
  • Average carbon dioxide emissions per 1 km = 1.795984008 [kgCO2e/km];
  • Average carbon dioxide emissions per 1 t = 30.5087027 [kgCO2e/t];
  • Average carbon dioxide emissions per 1 tonne-kilometer = 0.05756359 [kgCO2e/tkm];
  • Total sulfur dioxide emissions = 0.77719200 [kgSO2e];
  • Average sulfur dioxide emissions per 1 km = 0.0014664 [kgSO2e/km];
  • Average sulfur dioxide emissions per 1 t = 0.02491000 [kgSO2e/t];
  • Average sulfur dioxide emissions per 1 tonne-kilometer = 0.00004700 [kgSO2e/tkm].
The proposed framework for GHG emissions calculations in the context of road freight transport of FMPC for the automotive industry (Section 3.4) has been applied and verified.

4. Discussion

The issue of global warming is an increasingly discussed topic due to various human activities. The transport sector is ambivalent because it is indispensable for the state’s economy, but on the other hand has negative environmental impacts (emissions, noise, vibration, land use). The transport sector is the second most important sector contributing to the production of CO2 emissions worldwide. Globally, the largest producer of emissions is road transport in terms of transport modes, and emissions from road freight transport continue to rise.
The aim of this article was to propose a framework for greenhouse gas emissions calculations in the context of road freight transport for the automotive industry. The automotive industry has long been the most important sector of the economy in the Czech Republic, but also in the European Union. A global and extensive supply chain with many links is characteristic for the automotive industry. The automotive industry is completely dependent on a large number of suppliers and on transport. Most transports are carried out using road freight transport. This also implies the production of GHG emissions. However, companies in the automotive industry are trying to reduce the negative impact on the environment through logistic processes. Companies take into account the production of GHG emissions in logistic planning and decision-making, but there are no suitable tools for this. Calculators of GHG emissions are important tools for estimating GHG emissions. However, current calculators of GHG emissions do not cover all the transport restrictive conditions and limitations used in the automotive industry. This statement was also confirmed by these results: identification of requirements for the calculation of GHG emissions from road freight transport (Section 3.1), analysis of available emission freight calculators (Section 3.2), and semi-structured interviews (Appendix A and Appendix B). A market gap was identified.
The frameworks were proposed based on the results of semi-structured interviews, content analysis and comparative analysis. The framework for GHG emissions calculations in the context of road freight transport of material for the automotive industry was proposed (Section 3.3). The framework for GHG emissions calculations in the context of road freight transport of FMPC for the automotive industry was proposed (Section 3.4). The framework for carbon dioxide emissions calculations in the context of road freight transport for the automotive industry was proposed (Section 3.5). The framework for sulfur dioxide emissions calculations in the context of road freight transport for the automotive industry was proposed (Section 3.6).
The proposed framework for GHG emissions calculations in the context of road freight transport of material for the automotive industry has been applied and verified (Section 3.7). The proposed framework for GHG emissions calculations in the context of road freight transport of FMPC for the automotive industry has been applied and verified (Section 3.8).
The verification of the proposed frameworks was performed using real transportation of FMPC and material. GHG emissions were calculated for the transport of FMPC with the following parameters: vehicle V1, emission standard EURO 6, weight of the cargo 31,200 kg, transport distance 530 km, round trip transport. Total GHG emissions were calculated for this transportation as follows: 951.871 kgCO2e and 0.777 kgSO2e (Table 3). GHG emissions were calculated for the transport of material with the following parameters: vehicle V4, emission standard EURO 6, weight of the cargo 21,120 kg, transport distance 275 km, round trip transport. Total GHG emissions were calculated for this transportation as follows: 309.237 kgCO2e and 0.247 kgSO2e (Table 3).
The proposed frameworks can be used to implement a GHG emissions calculator suitable for the automotive industry because the proposed frameworks include all the road freight transport restrictive conditions and limitations used in the automotive industry, unlike other available calculators. Automotive industry companies could better take into account the production of GHG emissions in logistic planning and decision-making.
This approach is necessary because there is no approach or available emission calculator suitable for GHG emissions calculations from road freight transport customized for the automotive industry. This was also confirmed by the results of semi-structured interviews and the results of the analysis of available emission freight calculators. The most important conclusions were as follows: the company does not currently use any road transport emissions freight calculators because there is no suitable solution available to meet the company’s requirements. The logistic processes of the company are very extensive and specific with many conditions. Currently, there is no freight emission calculator that contains all specifics. This approach and the proposed frameworks fully respect the three main approaches to measuring energy consumption and produced emissions—WtW, WtT and TtW.
There can be some possible limitations in our approach. The processed theoretical backgrounds do not cover all available sources in connection with the given issue, but significant sources in the given area were selected using the method of literary research.
Another potential limitation of the processed approach is the identification of requirements for the calculation of GHG emissions from road freight transport in the automotive industry. These requirements were identified by two independent researchers using the two-round semi-structured interview with three respondents from a leading company in the automotive industry operating on the market in the Czech Republic. On the one hand, the limitation may lie in the number of respondents, and on the other hand, the limit may be the use of all respondents from one company. However, this approach is relevant because important experts in the field were chosen as respondents. At the same time, the respondents were selected from the leading company in the automotive industry operating on the market in the Czech Republic, where the interpretative case study was also processed. This approach is also relevant due to the fact that automotive industry companies have the same or very similar inbound, in-house and outbound processes.
Another limiting fact may be the selection of emission freight calculators for analysis because not all existing emission freight calculators were affected. It must be stated that the selection of emission freight calculators was made objectively using Google search by three independent researchers. On the other hand, there could be other emission freight calculators that have not been analyzed.
The limitation of this article can also lie in the proposed frameworks (Framework for greenhouse gas emissions calculations in the context of road freight transport of the material and FMPC for the automotive industry; Framework for carbon dioxide and sulfur dioxide emissions calculations in the context of road freight transport for the automotive industry proposal). The idea of proposed frameworks is based on the literature background and the results are influenced by the results of semi-structured interviews for the identification of requirements for the calculation of GHG emissions from road freight transport in the automotive industry. These frameworks can therefore be used to calculate GHG emissions from road freight transport in the automotive industry, but they can also be appropriated for other companies in the sector to customize these frameworks.

5. Conclusions

Today, it is quite clear that the issue of global warming is a key issue for this millennium. Thanks to this, it is also necessary to pay attention to the GHG emissions and human activities that cause global warming. Transport, as a key sector of the national economy, causes economic growth but also negative environmental effects. Thanks to this, it is necessary to pay great attention to transport, especially road freight transport, in terms of the volume of GHG emissions produced.
The issue of greenhouse gas emissions is also related to the automotive industry. This industry is characterized by an extensive and global supply chain. This fact also brings with it a large number of transports, usually carried out by road freight transport. Automotive industry companies, on the other hand, strive to behave sustainably and responsibly and to take GHG emissions into account in logistic decisions and planning. Given that the issue of calculating GHG emissions from transport is constantly evolving, in the future it will be necessary to look for new tools to support logistic planning and decision-making. This area of scientific interest is expected to expand further.
The aim of this article was to propose a framework for greenhouse gas emissions calculations in the context of road freight transport for the automotive industry. First, the requirements for the calculation of greenhouse gas emissions from road freight transport were identified; second, available emission freight calculators were analyzed; third, a framework for greenhouse gas emissions calculations in the context of road freight transport of material and finished manufactured passenger cars for the automotive industry was proposed; fourth, a framework for carbon dioxide and sulfur dioxide emissions calculations in the context of road freight transport for the automotive industry was proposed; and fifth, a framework for greenhouse gas emissions calculations in the context of road freight transport of material and finished manufactured passenger cars for the automotive industry was applied.
This research clearly demonstrated the non-existence of an approach or available emission freight calculators suitable for GHG emissions calculations from road freight transport customized for the automotive industry. Furthermore, all significant specifications, parameters, restrictive conditions or limitations related to the road freight transport within the automotive industry were identified. At the same time, frameworks were proposed that respect both the approaches to calculating GHG emissions and all the essential specifics of the automotive industry.
Future research steps will concern the field of rail transport in relation to the produced GHG emissions and their calculations because rail transport is also widely used for transport within the automotive industry, especially for outbound logistic processes. At the same time, there is no customized approach or emission calculator for the GHG emissions calculations in the context of railway freight transport for the automotive industry. Another area of future research is the proposal of customized frameworks for other sectors or industries, which monitor, evaluate and make decisions depending on the volume of GHG emissions produced, e.g., chemical and pharmaceutical industries.

Author Contributions

Conceptualization, R.H. and S.M.; methodology, J.C. and D.S.; validation, S.M. and P.S.; formal analysis, D.S.; resources, R.H. and D.S.; writing—original draft preparation, J.C.; writing—review and editing, R.H. and S.M.; visualization, S.M.; project administration, J.C. All authors have read and agreed to the published version of the manuscript.

Funding

This research was funded by the project “Cooperation in Applied Research between the University of Pardubice and Companies, in the Field of Positioning, Detection and Simulation Technology for Transport Systems (PosiTrans)”, registration No.: CZ.02.1.01/0.0/0.0/17_049/0008394.

Institutional Review Board Statement

Not applicable.

Informed Consent Statement

Not applicable.

Data Availability Statement

Data are contained within the article.

Acknowledgments

This article is published within the realization of the project “Cooperation in Applied Research between the University of Pardubice and Companies, in the Field of Positioning, Detection and Simulation Technology for Transport Systems (PosiTrans)”, registration No.: CZ.02.1.01/0.0/0.0/17_049/0008394.

Conflicts of Interest

The authors declare no conflict of interest.

Appendix A

Questions used in semi-structured interviews:
  • Is the issue of calculating GHG emissions from road transport relevant for you?
  • Do you use a GHG emissions calculator?
  • In what logistic processes do you monitor the GHG emissions produced by road transport (inbound logistics, in-house logistics and outbound logistics)?
  • What type of cargo do you transport using road freight transport (e.g., products, materials, containers, etc.)?
  • What types of vehicles do you use for transport?
  • What are the specifications and parameters of the vehicles used for transport?
  • What are the other restrictive conditions or limitations for transport?
  • What type of transport do you carry out (one-way transport, round trip (return) transport)?
  • What GHG emissions do you monitor in logistic processes?
  • How do you want to present the resulting GHG emissions (e.g., total emissions, average emissions per 1 km, average emissions per 1 t and average emissions per 1 tonne-kilometer)?
  • Do you use the conversion (monetization) of produced emissions into financial value?

Appendix B

Aggregated answers obtained from semi-structured interviews:
  • Is the issue of calculating GHG emissions from road transport relevant for you?
  • Yes, this issue is very current and crucial for our company. We strive to be a "green company and factory".
  • Do you use a GHG emissions calculator?
  • We do not currently use any road transport emissions freight calculators, as there is no suitable calculator available to meet our requirements. Our logistic processes are very extensive and specific with many conditions. Currently, there is no freight emission calculator that contains all specifics.
  • In what logistic processes do you monitor the GHG emissions produced by road transport (inbound logistics, in-house logistics and outbound logistics)?
  • We monitor GHG emissions produced by road freight transport in inbound logistic processes, in-house logistic processes and outbound logistic processes.
  • What type of cargo do you transport using road freight transport (e.g., products, materials, containers, etc.)?
  • We transport finished products (FMPC) using road freight transport and many other items that can be included in the material.
  • What types of vehicles do you use for transport?
  • We use two groups of vehicles. The first group of vehicles is used for the transportation of FMPC. The second group of vehicles is used for the transportation of material. An overview of these vehicles is shown in Table 1.
  • What are the specifications and parameters of the vehicles used for transport?
  • An overview of the specifications and parameters of the vehicles used for road freight transport is shown in Table 1.
  • What are the other restrictive conditions or limitations for transport?
  • The maximum load weight of the vehicle, the maximum load volume of the vehicle and vehicle selection by type of cargo must be respected. Specific conditions apply to the transport of FMPC. We transport a total of 8 types of FMPC (PC1–PC8). The following restrictions apply to the FMPC:
    • If the FMPC are transported in a vehicle (V1) and at least 3 cars (PC1–PC2) are loaded at the same time, then it is possible to load a total of 9 FMPC;
    • If the condition above is not met, it is possible to load in a vehicle (V1) a total of 8 FMPC;
    • If the FMPC are transported in a vehicle (V2), then it is possible to load a total of 4 FMPC;
    • If the FMPC are transported in a vehicle (V3), then it is possible to load a total of 2 FMPC.
  • What type of transport do you carry out (one-way transport, round trip (return) transport)?
    We provide one-way transport and round trip (return) transport. In the case of one-way transport, we multiply the produced emissions by an internal coefficient because it is a penalty for an unloaded vehicle.
  • What GHG emissions do you monitor in logistic processes?
    We monitor carbon dioxide (CO2) and sulfur dioxide (SO2) emissions as part of logistics processes.
  • How do you want to present the resulting GHG emissions (e.g., total emissions, average emissions per 1 km, average emissions per 1 t and average emissions per 1 tonne-kilometer)?
    We work with the following emission values: total emissions, average emissions per 1 km, average emissions per 1 t and average emissions per 1 tonne-kilometer. We further distinguish emissions according to the calculation approach (Well-to-Wheel, Well-to-Tank and Tank-to-Wheel approach) and according to the origin of emissions (fossil and biogenic origin).
  • Do you use the conversion (monetization) of produced emissions into financial value?
    We use the conversion (monetization) of produced emissions into financial value by the internal price of produced emissions as part of internal company calculations.

References

  1. Cichozs, M.; Pluta-Zaremba, A. How to improve freight transport emissions´ management? LogForum 2019, 15, 93–105. [Google Scholar] [CrossRef]
  2. Georgatzi, V.V.; Stamboulis, Y.; Vetsikas, A. Examining the determinants of CO2 emissions caused by the transport sector: Empirical evidence from 12 European countries. Econ. Anal. Policy 2020, 65, 11–20. [Google Scholar] [CrossRef]
  3. Solaymani, S. CO2 emissions patterns in 7 top carbon emitter economies: The case of transport sector. Energy 2019, 168, 989–1001. [Google Scholar] [CrossRef]
  4. IEA. Available online: https://www.iea.org/topics/transport (accessed on 1 February 2021).
  5. World Resources Institute. Available online: https://www.wri.org/blog/2019/10/everything-you-need-know-about-fastest-growing-source-global-emissions-transport (accessed on 1 February 2021).
  6. AutoSAP. Available online: https://autosap.cz/zakladni-prehledy-automotive/obecne-zakladni-prehledy/ (accessed on 10 February 2021).
  7. Inkinen, T.; Hämäläinen, E. Reviewing Truck Logistics: Solutions for Achieving Low Emission Road Freight Transport. Sustainability 2020, 12, 6714. [Google Scholar] [CrossRef]
  8. EU Climate Action. Available online: https://ec.europa.eu/clima/policies/eu-climate-action_en (accessed on 15 February 2021).
  9. Marinello, S.; Lolli, F.; Gamberini, R. Roadway tunnels: A critical review of air pollutant concentrations and vehicular emissions. Transp. Res. Part. D 2020, 86. [Google Scholar] [CrossRef]
  10. Alina, J.; McGrath, R.; Faltová Leitmanová, I.; Petrách, F. Using Constraints in Freight Volume to Identify Regional Needs for Roadway Infrastructure. Promet—TrafficTransp. 2020, 32, 237–246. [Google Scholar] [CrossRef] [Green Version]
  11. IEA. Transport Sector CO2 Emissions by Mode in the Sustainable Development Scenario, 2000–2030; IEA: Paris, France; Available online: https://www.iea.org/data-and-statistics/charts/transport-sector-co2-emissions-by-mode-in-the-sustainable-development-scenario-2000-2030 (accessed on 10 February 2021).
  12. Matthias, V.; Bieser, J.; Mocanu, T.; Pregger, T.; Quante, M.; Ramacher, M.O.P.; Seum, S.; Winkler, C. Modelling road transport emissions in Germany—Current day situation and scenarios for 2040. Transp. Res. Part. D 2020, 87. [Google Scholar] [CrossRef]
  13. Craglia, M.; Cullen, J. Modelling transport emissions in an uncertain future: What actions make a difference? Transp. Res. Part. D 2020, 89. [Google Scholar] [CrossRef]
  14. Bebkiewicz, K.; Chlopek, Z.; Lasocki, J.; Szczepański, K.; Zimakowska-Laskowska, M. Analysis of Emission of Greenhouse Gases from Road Transport in Poland between 1990 and 2017. Atmosphere 2020, 11, 387. [Google Scholar] [CrossRef] [Green Version]
  15. Petro, F.; Konečný, V. Calculation of Emissions from Transport Services and Their Use for the Internalisation of External Costs in Road Transport. TRANCOM 2017: International Scientific Conference on Sustainable. Mod. Safe Transp. 2017, 192, 677–682. [Google Scholar]
  16. Eriksson, L.; Nielsen, L. Modelling and Control of Engines and Drivelines; John Wiley and Sons: Chennai, India, 2014. [Google Scholar]
  17. Mubarak, A.; Zainal, F. Development of a framework for the calculation of CO2 emissions in transport and logistics in southeast asia. Int. J. Technol. 2018, 4, 787–796. [Google Scholar] [CrossRef] [Green Version]
  18. Elhedhli, S.; Merrick, R. Green supply chain network design to reduce carbon emissions. Transp. Res. Part. D 2012, 17, 370–379. [Google Scholar] [CrossRef]
  19. Pan, S.; Ballot, E.; Fontane, F. The reduction of greenhouse gas emissions from freight transport by pooling supply chains. Int. J. Prod. Econ. 2013, 143, 86–94. [Google Scholar] [CrossRef]
  20. Padgett, J.P.; Steinemann, A.C.; Clarke, J.H.; Vandenbergh, M.P. A comparison of carbon calculators. Environ. Impact Assess. Rev. 2008, 28, 106–115. [Google Scholar] [CrossRef]
  21. Weigel, B.A.; Southworth, F.; Meyer, M.D. Calculators to Estimate Greenhouse Gas Emissions from Public Transit Vehicles. Transp. Res. Rec. J. Transp. Res. Board 2010, 2143, 125–133. [Google Scholar] [CrossRef]
  22. Rabionet, S.E. How I learned to design and conduct semi-structured interviews: An ongoing and continuous journey. Wkly. Qual. Rep. 2009, 35, 203–206. [Google Scholar]
  23. Qu, S.Q.; Dumay, J. The qualitative research interview. Qual. Res. Account. Manag. 2011, 8, 238–264. [Google Scholar] [CrossRef]
  24. Naghavi, K.Z.; Mortazavi, S.B.; Asilian, M.H.; Hajizadeh, E. Exploring the Contributory Factors of Confined Space Accidents Using Accident Investigation Reports and Semistructured Interviews. Saf. Health Work 2019, 10, 305–313. [Google Scholar] [CrossRef]
  25. Aljohani, K.; Thompson, R.G. An Examination of Last Mile Delivery Practices of Freight Carriers Servicing Business Receivers in Inner-City Areas. Sustainability 2020, 12, 2837. [Google Scholar] [CrossRef] [Green Version]
  26. Nakanishi, H.; Black, J.A. Travel Habit Creation of the Elderly and the Transition to Sustainable Transport: An Exploratory Research Based on a Retrospective Survey. Int. J. Sustain. Transp. 2016, 10, 604–616. [Google Scholar] [CrossRef]
  27. Hilgarter, K.; Granig, P. Public perception of autonomous vehicles: A qualitative study based on interviews after riding an autonomous shuttle. Transp. Res. Part. F 2020, 72, 226–243. [Google Scholar] [CrossRef]
  28. Leung, A.; Burke, M.; Cui, J.; Perl, A. Fuel price changes and their impacts on urban transport–A literature review using bibliometric and content analysis techniques, 1972–2017. Transp. Rev. 2018, 39, 463–484. [Google Scholar] [CrossRef] [Green Version]
  29. Yoon, S.; Elhadad, N.; Bakken, S. A practical approach for content mining of tweets. Am. J. Prev. Med. 2013, 45, 122–129. [Google Scholar] [CrossRef] [Green Version]
  30. Stemler, S. An overview of content analysis. Pract. Assess. Res. Eval. 2001, 7, 137–146. [Google Scholar] [CrossRef]
  31. Mayring, P. Qualitative content analysis. In A Companion to Qualitative Research; Flick, U., Kardoff, E.v., Steinke, I., Eds.; SAGE Publications: Chennai, India, 2004; pp. 159–176. [Google Scholar]
  32. Zhou, J.; Wang, Y. Understanding the Roles of Different Transport Modes in Logistics Market: Content Analysis for an Online Logistics Forum. WHICEB 2019 Proceedings 2019. Available online: http://whiceb.cug.edu.cn/wp-content/uploads/2019/07/Full-Proceedings-of-WHICEB2019.pdf (accessed on 19 February 2021).
  33. Gao, Z.; Wang, S.; Gu, J. Public Participation in Smart-City Governance: A Qualitative Content Analysis of Public Comments in Urban China. Sustainability 2020, 12, 8605. [Google Scholar] [CrossRef]
  34. Fu, Y.; Zhang, X. Planning for sustainable cities? A comparative content analysis of the master plans of eco, low-carbon and conventional new towns in China. Habitat Int. 2017, 63, 55–66. [Google Scholar] [CrossRef]
  35. Ragin, C.C. The Comparative Method: Moving Beyond Qualitative and Quantitative Strategies; University of California Press: Oakland, CA, USA, 1987. [Google Scholar]
  36. Carvalho, R.C.d.; Medeiros, D.D.d. Assessing quality of air transport service: A comparative analysis of two evaluation models. Curr. Issues Tour. 2020. [Google Scholar] [CrossRef]
  37. Shah, S.A.R.; Shahzad, M.; Ahmad, N.; Zamad, A.; Hussan, S.; Aslam, M.A.; Khan, A.R.; Asif, M.A.; Shahzadi, G.; Waseem, M. Performance Evaluation of Bus Rapid Transit System: A Comparative Analysis of Alternative Approaches for Energy Efficient Eco-Friendly Public Transport System. Energies 2020, 13, 1377. [Google Scholar] [CrossRef] [Green Version]
  38. Zitricky, V.; L’uptak, V.; Stopka, O.; Stopkova, M. Comparative analysis in terms of environmental impact assessment between railway and air passenger transport operation: A case study. Int. J. Sustain. Aviat. 2020, 6, 21–35. [Google Scholar] [CrossRef]
  39. Mintzia, D.; Kehagia, F.; Tsakalidis, A.; Zervas, E. A Methodological Framework for the Comparative Analysis of the Environmental Performance of Roadway and Railway Transport. Promet Traffic Transp. 2018, 30, 721–731. [Google Scholar] [CrossRef]
  40. Ponelis, S.R. Using interpretive qualitative case studies for exploratory research in doctoral studies: A case of Information Systems research in small and medium enterprises. Int. J. Dr. Stud. 2015, 10, 535–550. [Google Scholar] [CrossRef] [Green Version]
  41. Bygrave, W.D. The entrepreneurship paradigm (I): A philosophical look at its research methodologies. Entrep. Theory Pract. 1989, 14, 7–26. [Google Scholar]
  42. Eisenhardt, K.M. Building theories from case study research. Acad. Manag. Rev. 1989, 14, 532–550. [Google Scholar] [CrossRef]
  43. Melo, C.d.O.; Cruzes, D.S.; Kon, F.; Conradi, R. Interpretative case studies on agile team productivity and management. Inf. Softw. Technol. 2013, 55, 412–427. [Google Scholar] [CrossRef]
  44. Respondent 1; Leading company in the automotive industry, Czech Republic, CR. Personal communication, 2020.
  45. Respondent 2; Leading company in the automotive industry, Czech Republic, CR. Personal communication, 2020.
  46. Respondent 3; Leading company in the automotive industry, Czech Republic, CR. Personal communication, 2020.
  47. EECA Business: CO2 Emission Calculator. Available online: https://www.eecabusiness.govt.nz/tools/wood-energy-calculators/co2-emission-calculator/ (accessed on 7 December 2020).
  48. Emission Calculator and Carbon offset–SAS. Available online: https://www.flysas.com/en/sustainability/emission-calculator/ (accessed on 7 December 2020).
  49. Emissions Calculator–CargoLux. Available online: https://www.cargolux.com/Our-Expertise/e-services/Emissions-Calculator (accessed on 8 December 2020).
  50. Climatecare: Business CO2 Emissions Calculator. Available online: https://climatecare.org/calculator/ (accessed on 8 December 2020).
  51. Freight Emissions Calculator. Available online: http://www.freightemissionscalculator.com/ (accessed on 9 December 2020).
  52. Sustainable Freight: Ship Type Carbon Emissions Calculator. Available online: http://www.sustainablefreight.com.au/tools-and-programs/emission-calculators/ship-type-carbon-emissions-calculator (accessed on 9 December 2020).
  53. EcoTransit: Calculation. Available online: https://www.ecotransit.org/calculation.en.html (accessed on 10 December 2020).
  54. Van Donge & De Roo Group: CO2 Calculator. Available online: https://www.vandongederoo.com/co2-calculator/ (accessed on 10 December 2020).
  55. OOCL Carbon Calculator. Available online: https://www.oocl.com/eng/aboutoocl/Environmentalcare/ooclcarboncalculator/Pages/default.aspx (accessed on 11 December 2020).
  56. Canadian National Railway company: Carbon Calculator. Available online: https://www.cn.ca/en/delivering-responsibly/environment/emissions/carbon-calculator/ (accessed on 11 December 2020).
  57. Logistic Emissions Calculator. Available online: https://kalogemis.upce.cz/ (accessed on 24 January 2021).
Figure 2. Well-to-Tank and Tank-to-Wheel [16].
Sustainability 13 04068 g002
Figure 3. Processing procedure [authors].
Sustainability 13 04068 g003
Figure 4. Framework for greenhouse gas emissions calculations in the context of road freight transport for the automotive industry [authors].
Sustainability 13 04068 g004
Table 1. An overview of the specifications and parameters of the vehicles used for road freight transport [authors].
Type of CargoVehicleMaximum Load WeightMaximum Load Volume
Finished
manufactured
passenger cars (FMPC)
V120,000 kg8 or 9 cars by type
V211,500 kg4 cars
V38000 kg2 cars
MaterialV424,000 kg150 m3
V524,000 kg100 m3
V624,000 kg120 m3
V724,000 kg80 m3
V812,000 kg120 m3
V93350 kg38 m3
Table 2. The results of the content analysis of emission freight calculators (authors based on [47,48,49,50,51,52,53,54,55,56]).
No.SourceRoad TransportTransport of FMPC and
Material
Own
Vehicle
Implementation of Restrictive ConditionsOne-Way and Round Trip
Transport
CO2e
and SO2e
Outputs
Total and Average Emissions OutputsWtW, WtT and TtW Calculation ApproachMonetization of Produced Emissions
1[47]YNANANAOnly one-wayOnly CO2Only total emissionsNANA
4[50]YNANANAOnly one-wayOnly CO2Only total emissionsNAY
5[51]YNANANAOnly one-wayOnly CO2Only total emissionsNANA
7[53]YNAYNAYYOnly total emissionsYNA
10[56]YNANANAOnly one-wayOnly CO2Only total emissionsNANA
Notes: FMPC—finished manufactured passenger cars, CO2e—carbon dioxide equivalent, SO2e—sulfur dioxide equivalent, WtW—Well-to-Wheel approach, WtT—Well-to-Tank approach, TtW—Tank-to-Wheel approach, Y—Yes, N—No, NA—not available, NFA—not further analyzed due to inapplicability to road transport.
Table 3. Summary of results [authors].
Type
of Cargo
VehicleEmission StandardWeight
[kg]
Distance
[km]
Total CO2 Emissions [kgCO2e]Total SO2
Emissions [kgSO2e]
FMPCV1EURO 631,200530951.8710.777
MaterialV4EURO 621,120275309.2370.247
Publisher’s Note: MDPI stays neutral with regard to jurisdictional claims in published maps and institutional affiliations.

