Assessing Renewable Resources at the Saronikos Gulf for the Development of Multi-Generation Renewable Systems


1
Department of Civil Engineering and Geosciences, Delft University of Technology, 2628 CN Delft, The Netherlands
2
Department of Mechanical Engineering, University of West Attica, 12243 Aigaleo, Greece
*
Authors to whom correspondence should be addressed.
Sustainability 2020, 12(21), 9169; https://0-doi-org.brum.beds.ac.uk/10.3390/su12219169
Submission received: 9 September 2020
/
Revised: 20 October 2020
/
Accepted: 26 October 2020
/
Published: 4 November 2020
(This article belongs to the Special Issue Applications, Integration and Trends of Renewable Energy Technologies)
Abstract
:Decarbonisation of any energy system implies that more renewables will have to be incorporated into the grid. This requires a thorough assessment of available resources to properly estimate potential contributions and identify opportunities. This work focuses on the Saronikos Gulf, which is part of the most crowded urban coastline in Greece. Solar, wind and wave resources are analysed, and the long-term characteristics affecting power production are discussed. Solar resources provide ≥250 Wh· with small long-term changes. Wind resources at coastal and onshore regions are ≥50 W·; however, it has higher annual volatility. Finally, the wave resources of the region are from 130 to 170 W/m with a positive resource rate of change ≈2.5 W·/year. It is expected that multi-generation by different resources, especially with temporal overlaps of wind and waves, will reduce intermittent production, hence accelerating the energy transition.
1. Introduction
The European Commission (EC) has set out ambitious targets for decarbonisation of the energy, building and service sectors, aiming to mitigate the impacts of climate change. The European Green New Deal [1] and the Strategic Energy Technology Plan (SET-Plan) [2], which represent some EC initiatives for carbon-neutral societies [3], are especially advancing diverse sectoral transformations.
Greece is a European Member State located in the eastern part of the Mediterranean. Climate change effects such as high temperature and sea level rise will put significant pressure on commercial and civil operations around the region [4]. More specifically, one of Greece’s major ports, the port of Piraeus, is located in the prefecture of Attica. The area is characterised by densely populated coastal regions and numerous commercial activities [5]. Greece is making strides in trying to decarbonise its energy sector, which has been heavily dominated by fossil fuels, predominately coal [6]. However, recent developments have underlined the commitment of the Greek government to close down conventional high-polluting power plants and increase sustainable development. The National Climate and Energy Plan of the Greek government has ambitious goals, by 2030, of ≥35% contribution in gross electricity by renewable energy sources and ≥55% reduction of emission compared with 2005 [6]. Achieving these targets will require a better understanding of available resources and the utilisation of all indigenous renewable energies, with a goal to mitigate variability.
Another important topic that needs to be addressed is emission-heavy commercial and industrial applications, which will need multiple renewables to ensure unhindered operations. Ports and harbours, in general, are energy-intensive industries that require massive amounts of electricity to provide power for ships while berthing, loading/unloading and conducting maintenance [7,8]. The power issues with several sub-sectors within the maritime industry have been underlined by various studies [9,10,11,12] and recently the International Maritime Organization (IMO) [13].
Multi-generation renewable energy systems can be solutions that can also increase the “green” power generation consumption and assist decarbonisation. Energy consumption is high at urban centres and ports. For the latter, ports comprise several power-intensive operations that will need to be decarbonised without jeopardising operation capacity [14]. Several solutions have been highlighted for ports based on existing wind (onshore/offshore) and solar photovoltaics [15], and novel solutions are emerging such as integrated wave energy at ports and breakwaters [16,17,18]. Such diverse generation systems have benefits in overlapping power production, hence reducing intermittency [19], but they can also reduce and be economically viable in under 10 years, as it was shown to be the case in the Aeolian Islands [20].
In order to have valid and useful information for such potential renewable opportunities, resource assessments are vital and should not be overlooked. Such information can be obtained via three methods: (i) in situ measurements, (ii) satellites and (iii) numerical models, with each having distinct positive and negative attributes [21,22]. However, a factor that is universally important is the temporal duration of the data, which regardless of the source has to cover at least 10 years. While some resources may have smaller spatio-temporal variations (e.g., solar), others such as wind are highly volatile and need better information in order to comprehensively assess expected power production and associated sensitivities.
For the Greek area, Kotroni et al. [23] used a numerical model to downscale wind data from the European Centre for Medium-Range Weather Forecasts (ECMWF), and they analysed wind resources (onshore and offshore) by developing a Typical Meteorological Year (TMY) dataset. The authors utilised data from 1989 to 2008, with six-hour intervals and 80 km spatial resolution. The TMY showed locations in Euboia, Southern Peloponissos and South Crete have the highest onshore potential, and it also displayed the highest offshore wind energy density in the central Aegean Sea with values ≥700 W·. Soukissian et al. [24] developed a higher-resolution wind resource model though use of hindcast data from 1995 to 2009, by downscaling ECMWF data via the POSEIDON system. The dataset has a spatial resolution of ≈10 km and analyses energy density and wind parameters scaled at vertical height of 80 m, suitable for the proper assessment of offshore wind potential. They identified high resources in the central Aegean Sea (around the Cyclades Islands) and the Ionian Sea, with mean wind power density of 885 W· in the central Aegean Sea. They concluded that offshore wind power production can be a good alternative, as most areas are characterised by wind speeds usually below the operational cut-off of wind turbines.
Solar resource assessments have seen a mixture of model- and observation-based analyses. Katopodis et al. [25] used the Weather Research and Forecasting (WRF) model, which produces solar resource data both in hindcast and future projection modes. Their data were based on the six-hour reanalysis ERA-Interim from 1980 to 2004. Their findings indicated that Global Horizontal Irradiance (GHI) in the Greek region is consistently ≥1600 Wh·, with its highest levels in Central-Southern Greece and the Ionian Sea with ≥1800 Wh·.
Wave energy resource assessments have seen increased interest during the past decades, with oceanic and nearshore modelling studies increasing. One of the most recent highly spatio-temporal datasets was presented in Lavidas and Venugopal [26] covering 35 years across the whole Hellenic Sea space. The study found the highest wave energy density in the central and southern Aegean Sea with mean potential from 6 kW· to ≥10 kW· in the winter months. In the region around Athens and the Saronikos Gulf, regardless of season, the energy density was consistently below 1.5 kW·. Belibassakis and Karathanasi [27] also provided a high-resolution circulation study in the Saronicos Gulf, between January and February 2013. They underlined the counter-clockwise circulation and the fact that high waves did not exceed 3 m and wave power was ≤2 kW·.
This manuscript aids in the problem of decarbonising parts of the energy system near Athens by identifying and quantifying three available renewable resources in the Saronikos Gulf. The area is important as it is the host of numerous commercial, industrial and civil activities, and proper development of renewable energies will allow comprehensive evidence-based solutions. Three resources have been identified: solar (onshore and offshore), wind (onshore and offshore) and waves (offshore). It is the first time that high-resolution wave resources are estimated for this area, and the characteristics of offshore solar and wind resources are characterised. This is highly important and can be applied globally, as recent offshore wind-solar developments can support higher-capacity deployments away from residential areas where local opposition can cease a project.
The focus is more on locations that can contribute to multi-generation potential around the Port of Piraeus. A detailed climate and resource assessment for all three resources is estimated with hindcast data spanning 2000 to 2017. Measurements were taken at hourly intervals, ensuring that the assessment adheres to international standards, and it builds upon them with detailed analysis of expected variations. Climate persistence, energy density and changes in all resources are quantified and discussed. This information is vital. Besides energy potential, this study also examines the changes in the resources.
This manuscript is separated into the following sections: Section 2 presents in detail the underlying datasets and estimations, and Section 3 gives the analysis for all resources, their temporal variability and differentiation per offshore and onshore location. In Section 4 and Section 5, remarks and final remarks on the work’s importance are discussed.
2. Material and Methods
Three types of renewable resources were examined and analysed in this study: solar, wind and waves. For solar and wind the primary data were obtained from the European Centre for Medium-Range Weather Forecasts (ECMWF), accessing the ERA-5 dataset. The dataset uses a 4-dimensional (4D) data assimilation method with an Integrated Forecasting System (IFS) based on the Cycle 41r2 [28]. ERA-5 represents the state-of-the-art in climate re-analysis data, improving upon several previous iterations (i.e., ERA-Interim). Significant improvements have been made in database validation and increasing the resolution with past databases. Another important element that makes ERA5 useful for preliminary analysis is the good temporal resolution (1 h) and the long duration of years that is covers. Offering more than 30 years of data ensures that any resource estimation and further power production analysis can be highly realistic. Furthermore, ERA5 has been improved and has several parameters that are vital for renewable energies; this is evident in the derivation of atmospheric quantities useful for solar analysis. The typical irradiation values also represent, with accurate ambient temperatures, a parameter very important for the determination of photovoltaic power production. The spatial resolution for solar and wind is 0.1° both for latitude and longitude. Taking into account that the spatial domain size is relatively small, the original resolution is very coarse; hence, a cubic interpolation based on the nearest neighbour approach was applied to improve the spatial resolution to ≈900 m.
In terms of the wave data, the resolution and underlying model of the ERA-5 were not suitable for wave energy applications due to its coarseness, and it is a known fact that at nearshore locations there are limited capabilities to estimate complex wave non-linear effects efficiently [29]. Therefore, a specific dataset has been developed for the Saronikos Gulf area. The dataset was built with a high-resolution nearshore wave model and is based on a third-generation spectral model the Simulating WAves Nearshore (SWAN), which has been previously calibrated and validated in Lavidas et al. [30] for the Mediterranean Sea and Lavidas and Venugopal [26] for the Aegean Sea. The spatial resolution of this dataset is high, with ≈900 m per longitude and latitude. To ensure appropriateness, all resources were measured in hindcast mode for 18 years, from 2000 to 2017, and resource elements were estimated at hourly intervals, making them useful for energy analysis [31,32].
The analyses of solar, wind and wave resources () were based on annual observation; hence, this allows us to determine the year-per-year expected change and coefficient of variation. For all timesteps (N), the maxima (), mean (), standard deviation (see Equation (1)) and coefficient of variation (see Equation (2)) were estimated. When it comes to wind resource assessment, CoV is also known as turbulence intensity (TI), and it represents the wind fluctuations which underline resource volatility.
In particular, CoV allows us to examine the level of differentiation by detaching the mean value from the population; a high CoV value implies more volatility, which in turn can affect energy production.
2.1. Solar Resource
To estimate the solar potential and obtain useful parameters for calculating the subsequent energy production by solar panels, the incident solar radiation at plane level and the ambient temperature at 2 m were isolated. The ERA5 database measures solar irradiance in Joules per square meter (J/). To make the resource useful, units have been converted into watts (Wh/), describing the theoretical potential that reaches the horizontal plane. Subsequently, temperature at a 2 m vertical has been converted to Celsius (°C).
2.2. Wind Resource
Meridional and zonal wind characteristics are obtained by ERA5 are at a vertical level of 10 m () above sea level every 1 h. However, most turbines are at higher heights; hence, vertical levels had to be adjusted. The power law allows us to adjust the current profile wind () at two different heights () of 80 and 100, with roughness length () given as 0.14, and we obtain can the new wind resource () (see Equation (3)) [33]. Roughness depends on elevation, time of day, season, nature of the terrain, wind speed, temperature and various thermal and mechanical mixing parameters. Our area of investigation is diverse, covering ≥12,000 and including different zones that have variable terrain and climatological characteristics with which to conduct such a detailed estimation of . The roughness coefficient was applied to the whole domain, as suggested by Manwell et al. [33]. This means that lower-roughness areas (i.e., water bodies) may be under-estimated, and for a more accurate scaling of such a large area, mesoscale modelling would be beneficial. However, given that the locations of interest are close to nearshore high-density building areas (i.e., Port of Pireaus), the roughness coefficient we used was representative.
Based on wind speeds, the mean wind energy density is estimated for all the grid points along the domain in (W/) [24], see
where is the wind density, 1.2258 Kg/, and is the wind resource at different vertical levels.
2.3. Wave Resource
Wave energy is calculated for the wider area of Saronikos Gulf based on a high-resolution, validated spectral nearshore model Lavidas and Venugopal [26], Lavidas et al. [30]. To estimate wave energy the spectral formulation was utilised (see Equation (5)), expressing the energy contained per width of wave crest (kW/m) [26].
where g is gravitational acceleration, are wave group velocities in longitude and latitude, f is frequency and is the wave direction. In addition, several other spectral parameters were calculated, mainly the significant wave height (), peak wave period () and wavelength () that is dependent on and f.
3. Results
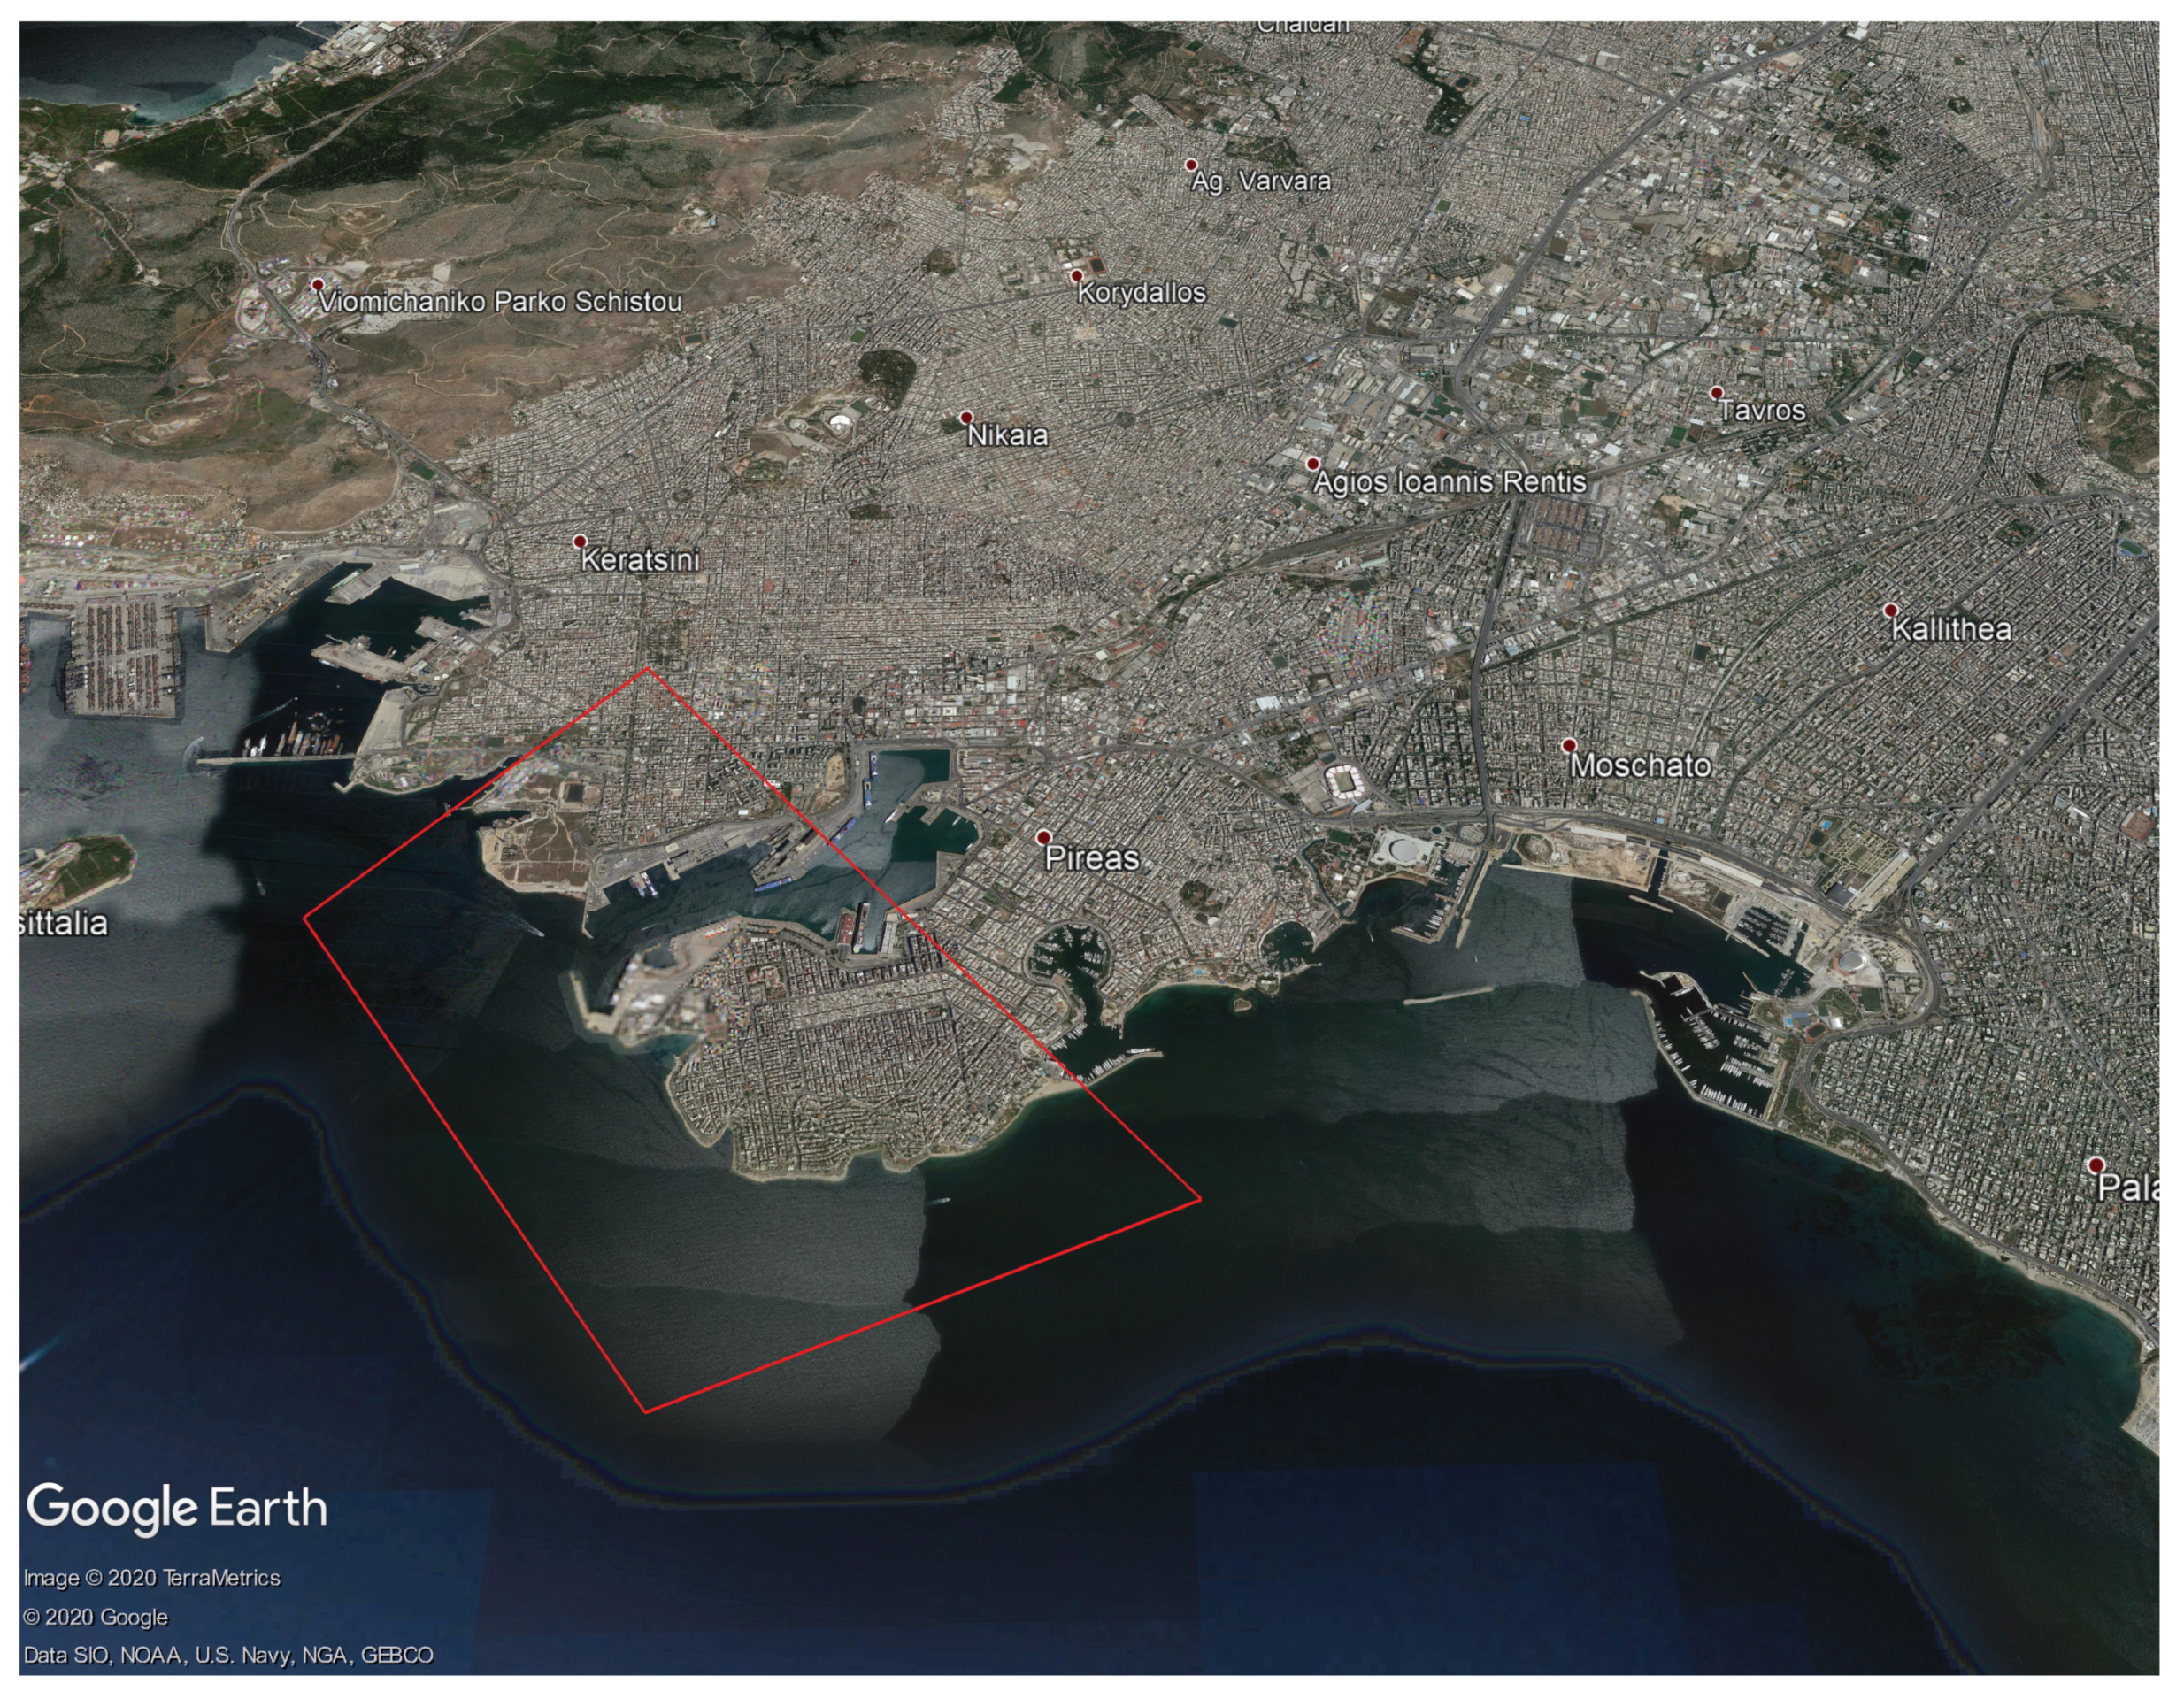
The temporal duration of the analysis was from 2000 until 2017, and part of the domain and subsequent focus area is given in Figure 1. This study focused on the surrounding areas of Piraeus Port to provide a comprehensive resource analysis for heavy industrial processes at a later stage. However, the first steps were to determine the resource availability, their expected variation and characteristics.
3.1. Solar Resource
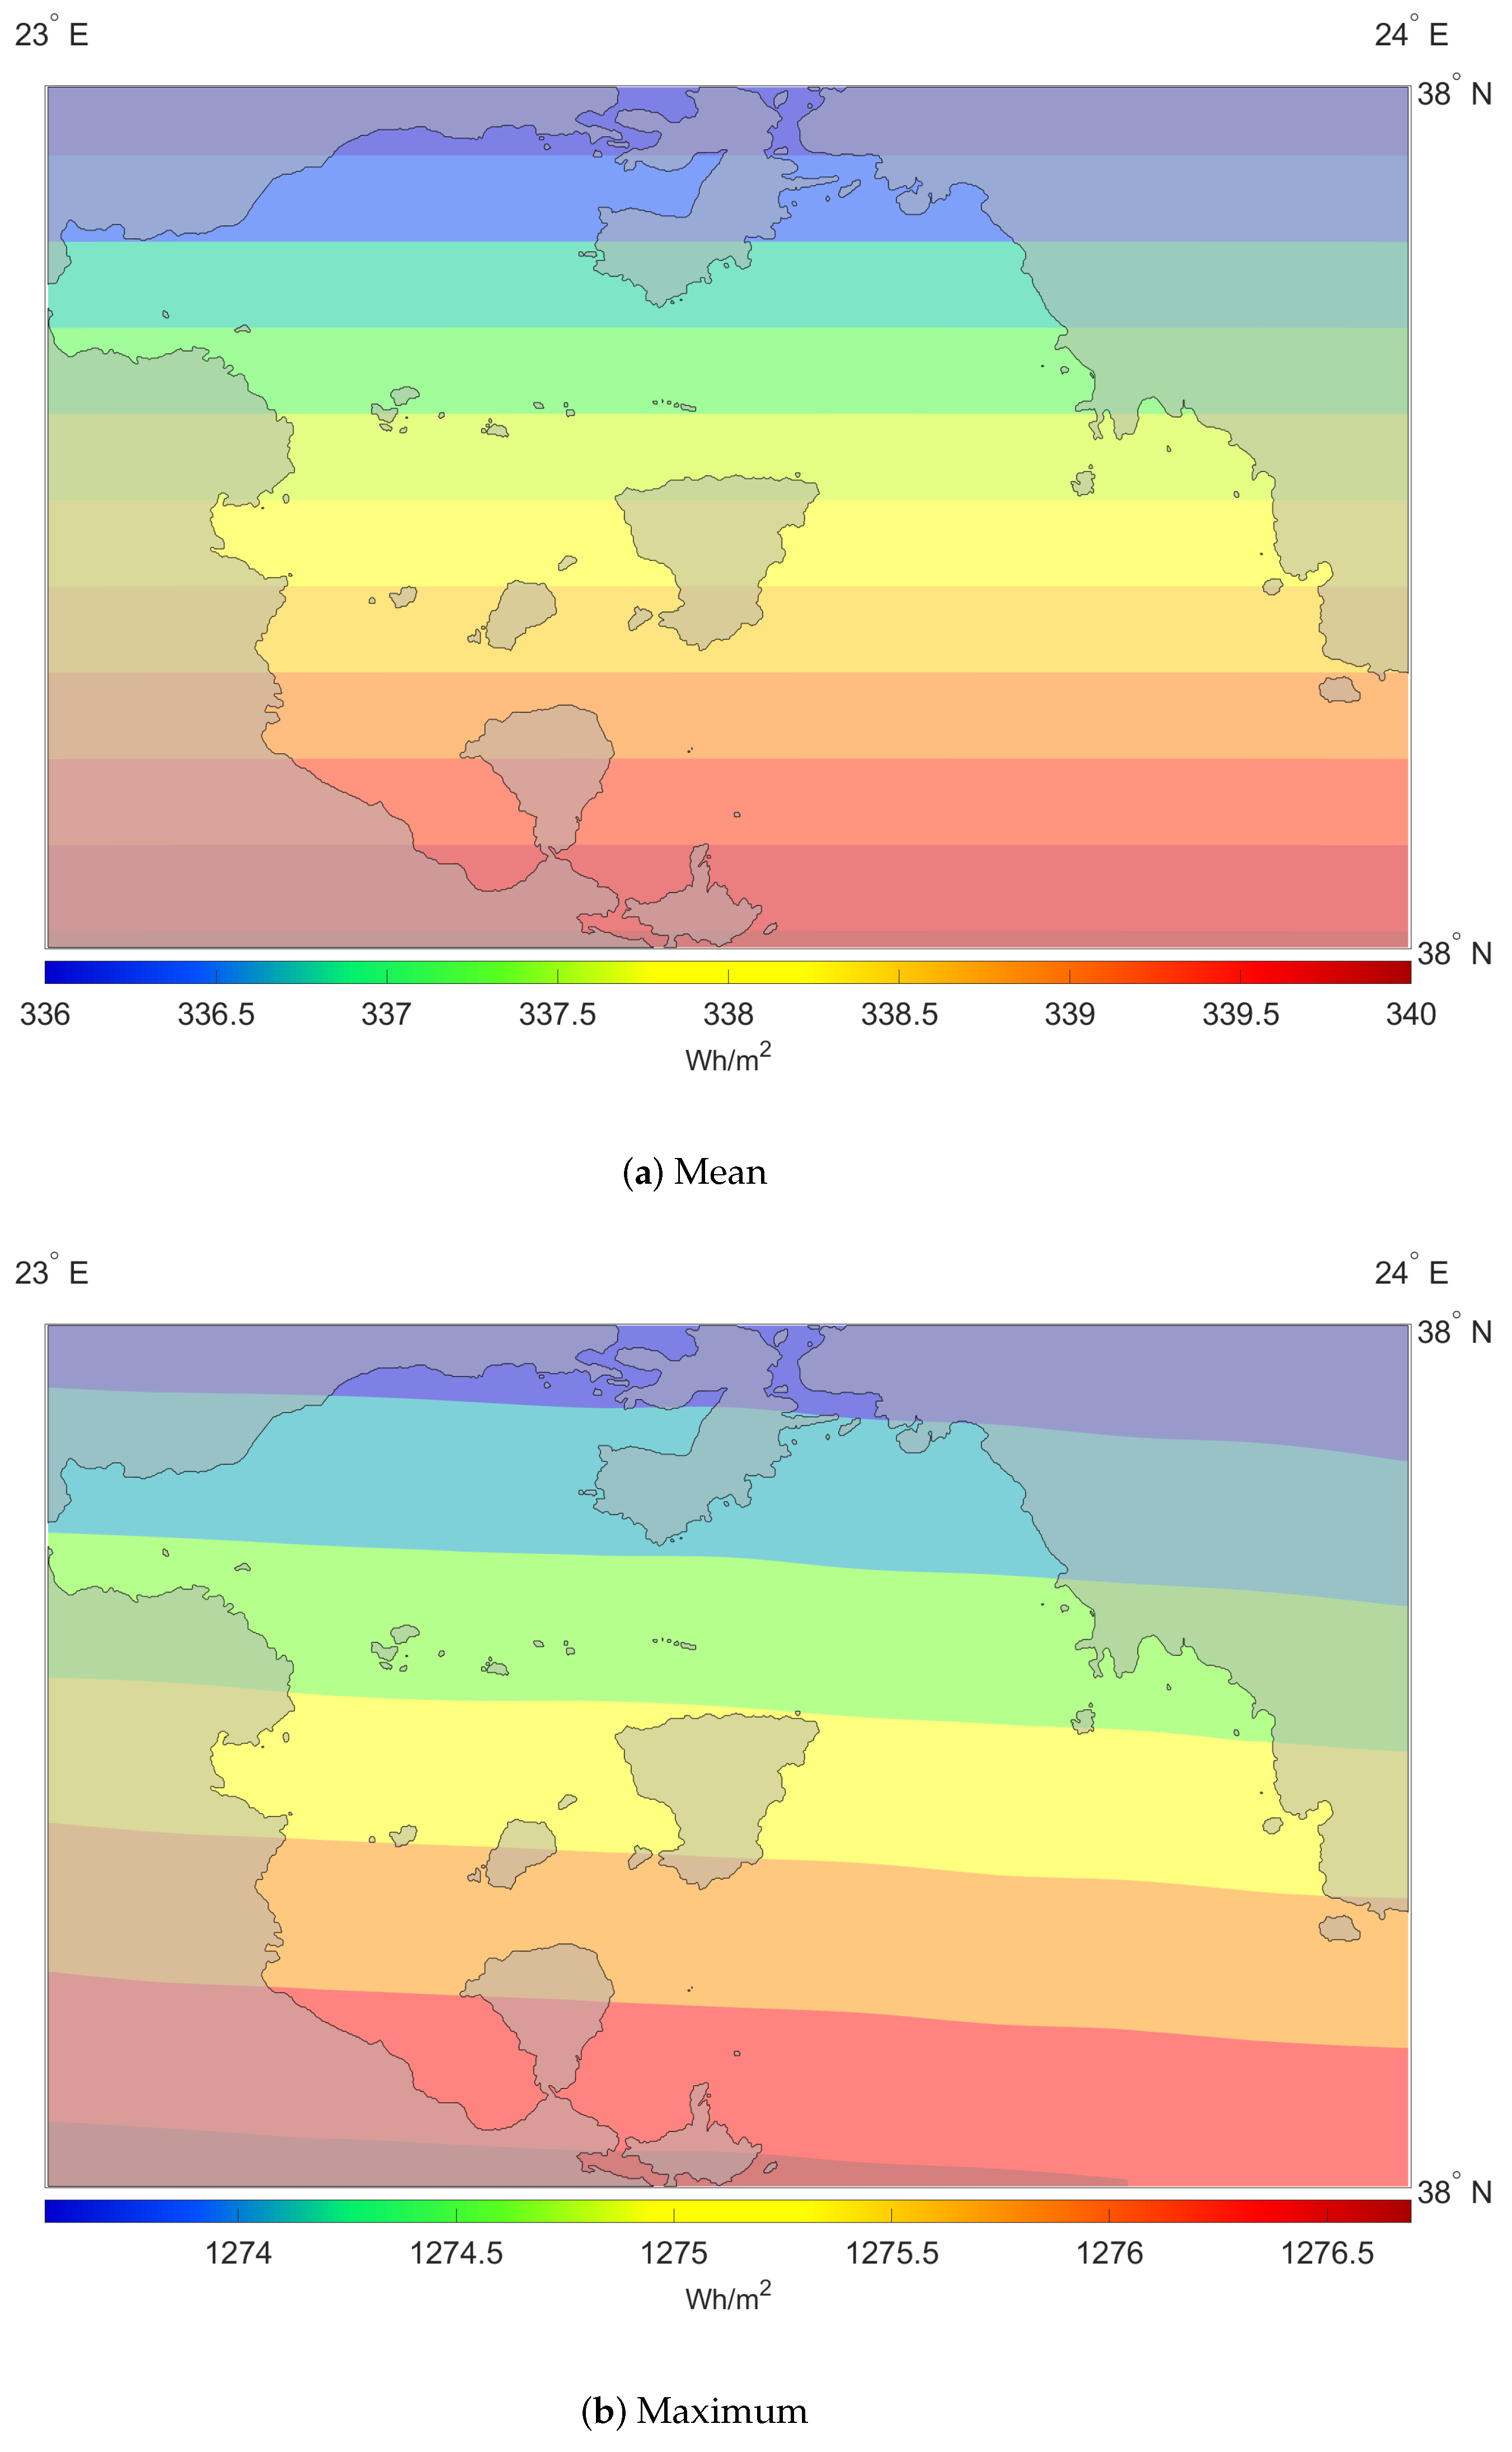
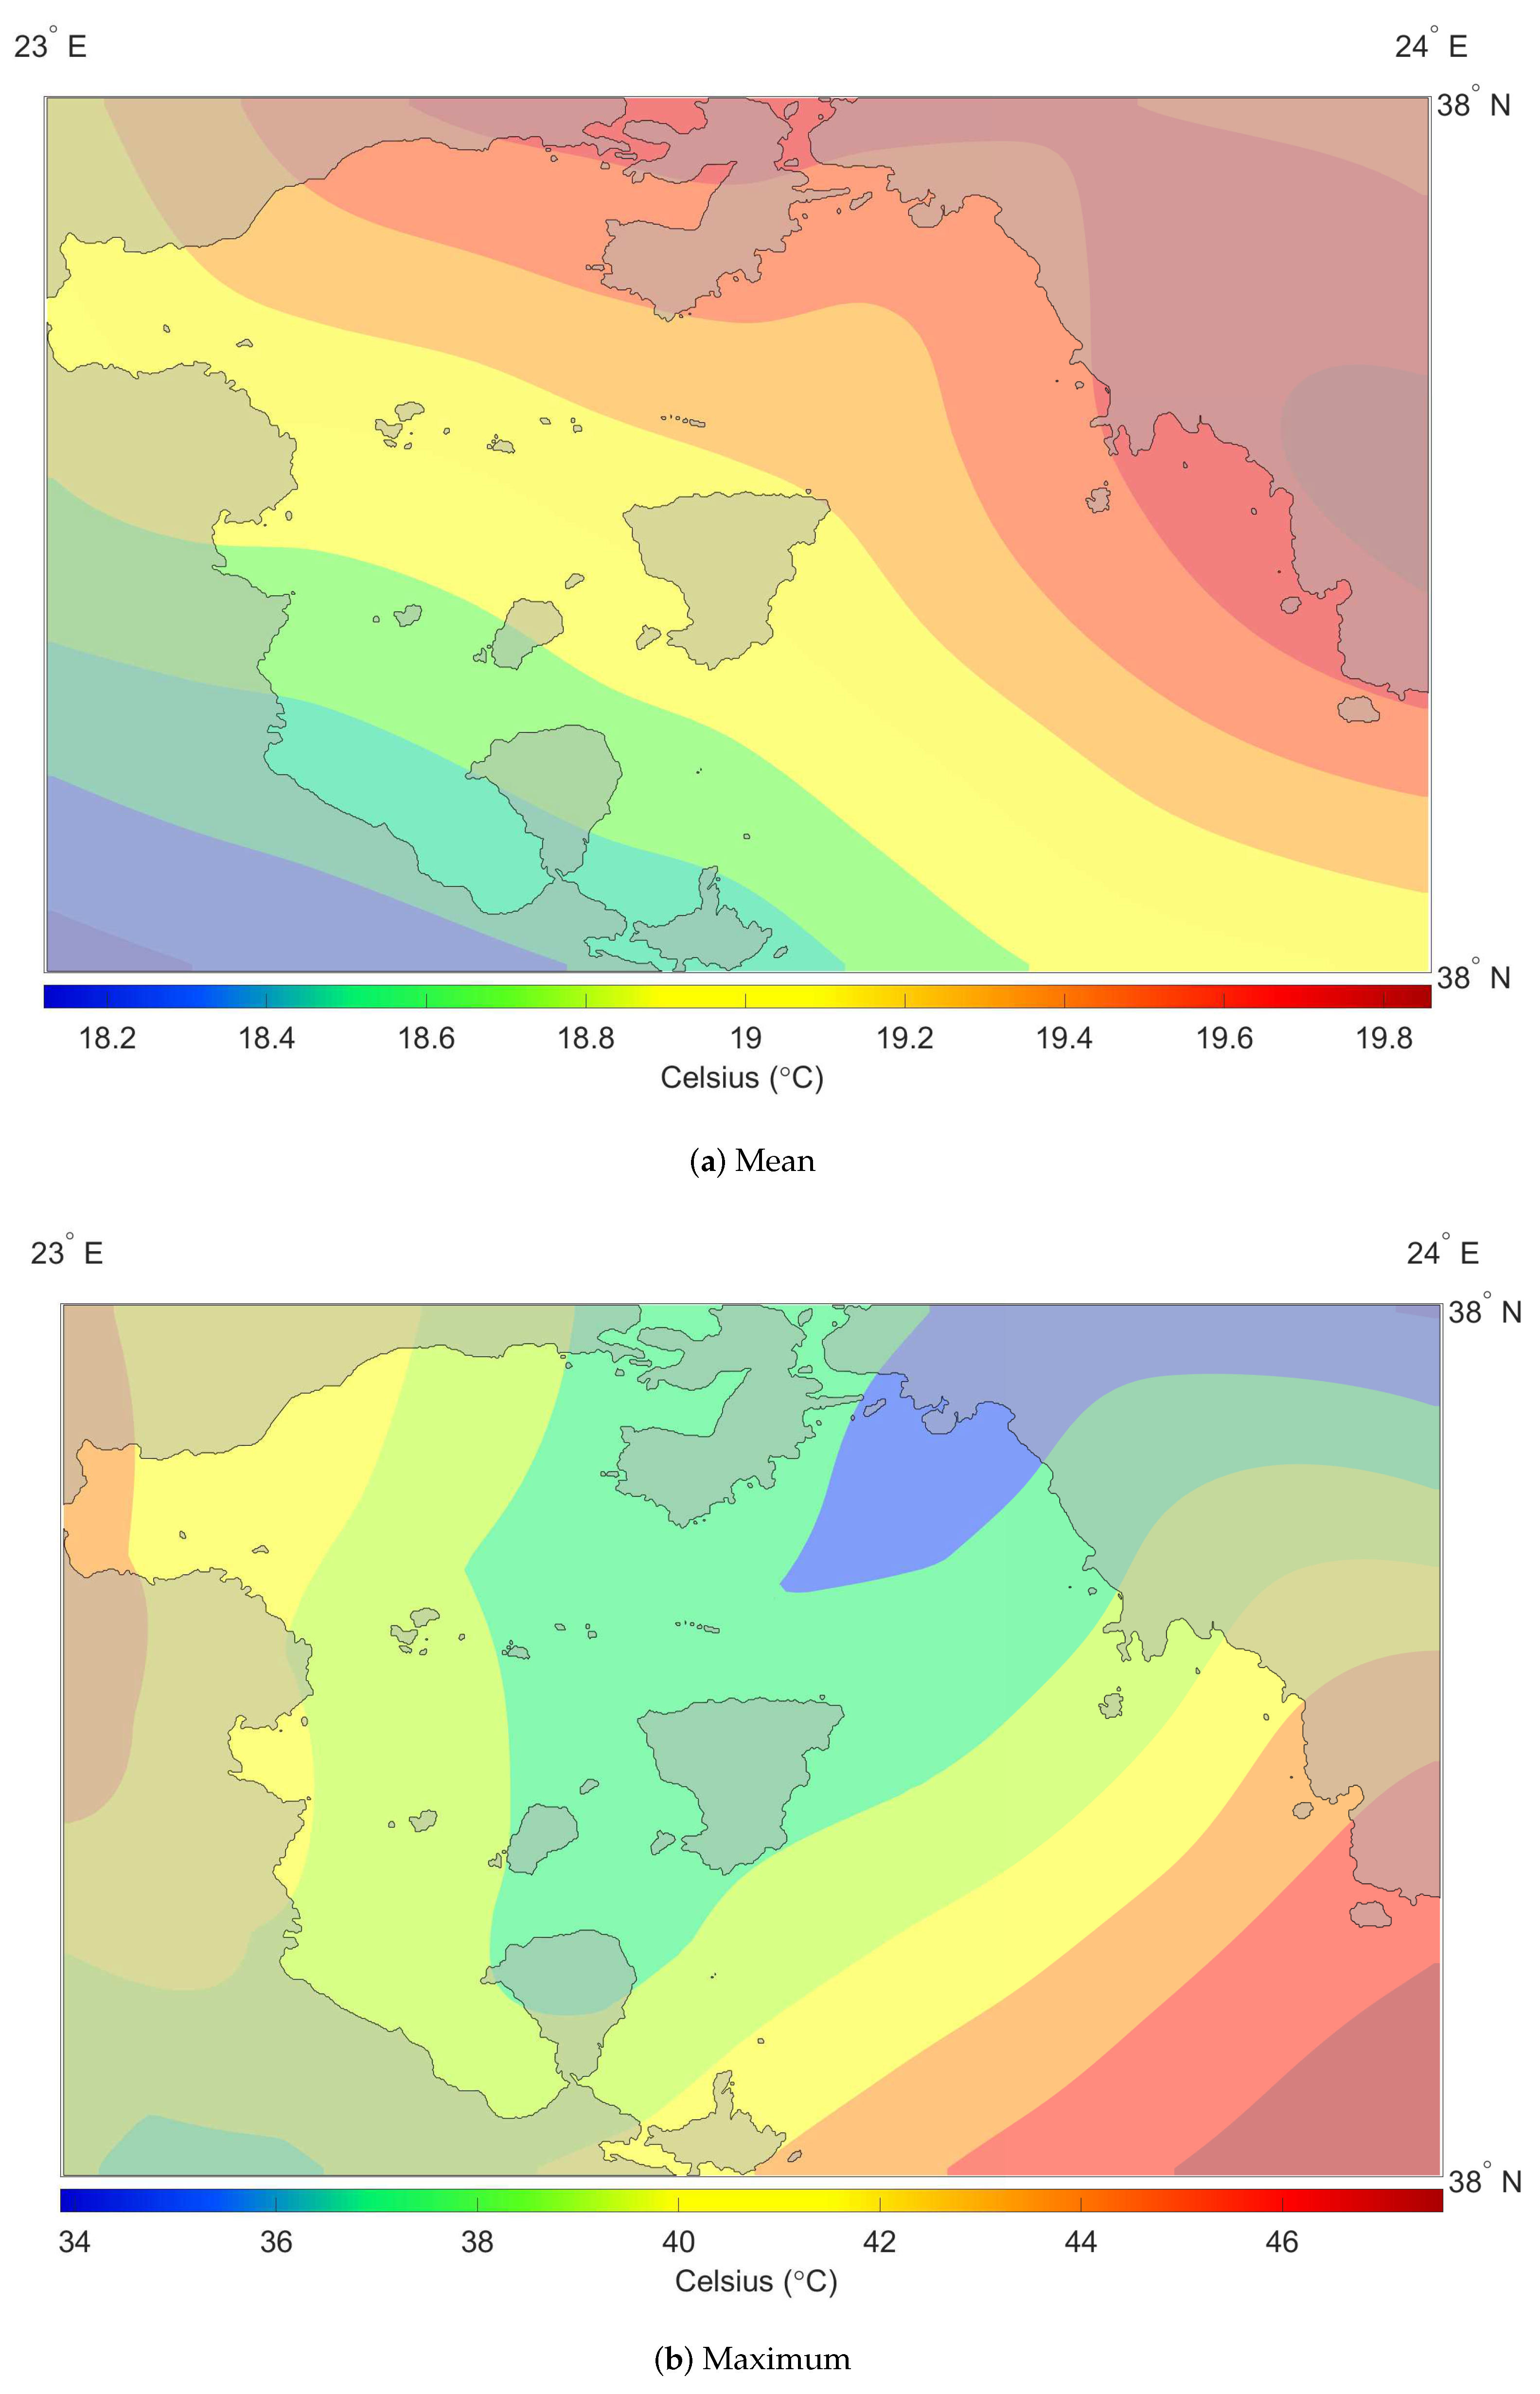
Solar energy, given its less volatile nature and smaller spatial differentiation, has a more uniform distribution. The potential is higher towards southern locations, with highest values per square meter up to 1200 Wh/ in the summer period. In terms of the mean resource, this area was exposed to ≈250–340 Wh/ throughout most of the domain. Onshore locations from Piraeus to Glyfada recorded good levels of this resource, with maximum values in summer months ≥1000 Wh/, see Figure 2. At the same time, mean temperatures were ≥17 °C, and especially in the summer period these could reach ≥40 °C. The region of interest, mainly the length between Piraeus to Glyfada, had mean temperatures around 15 °C and maximum ≥25 °C, see Figure 3.
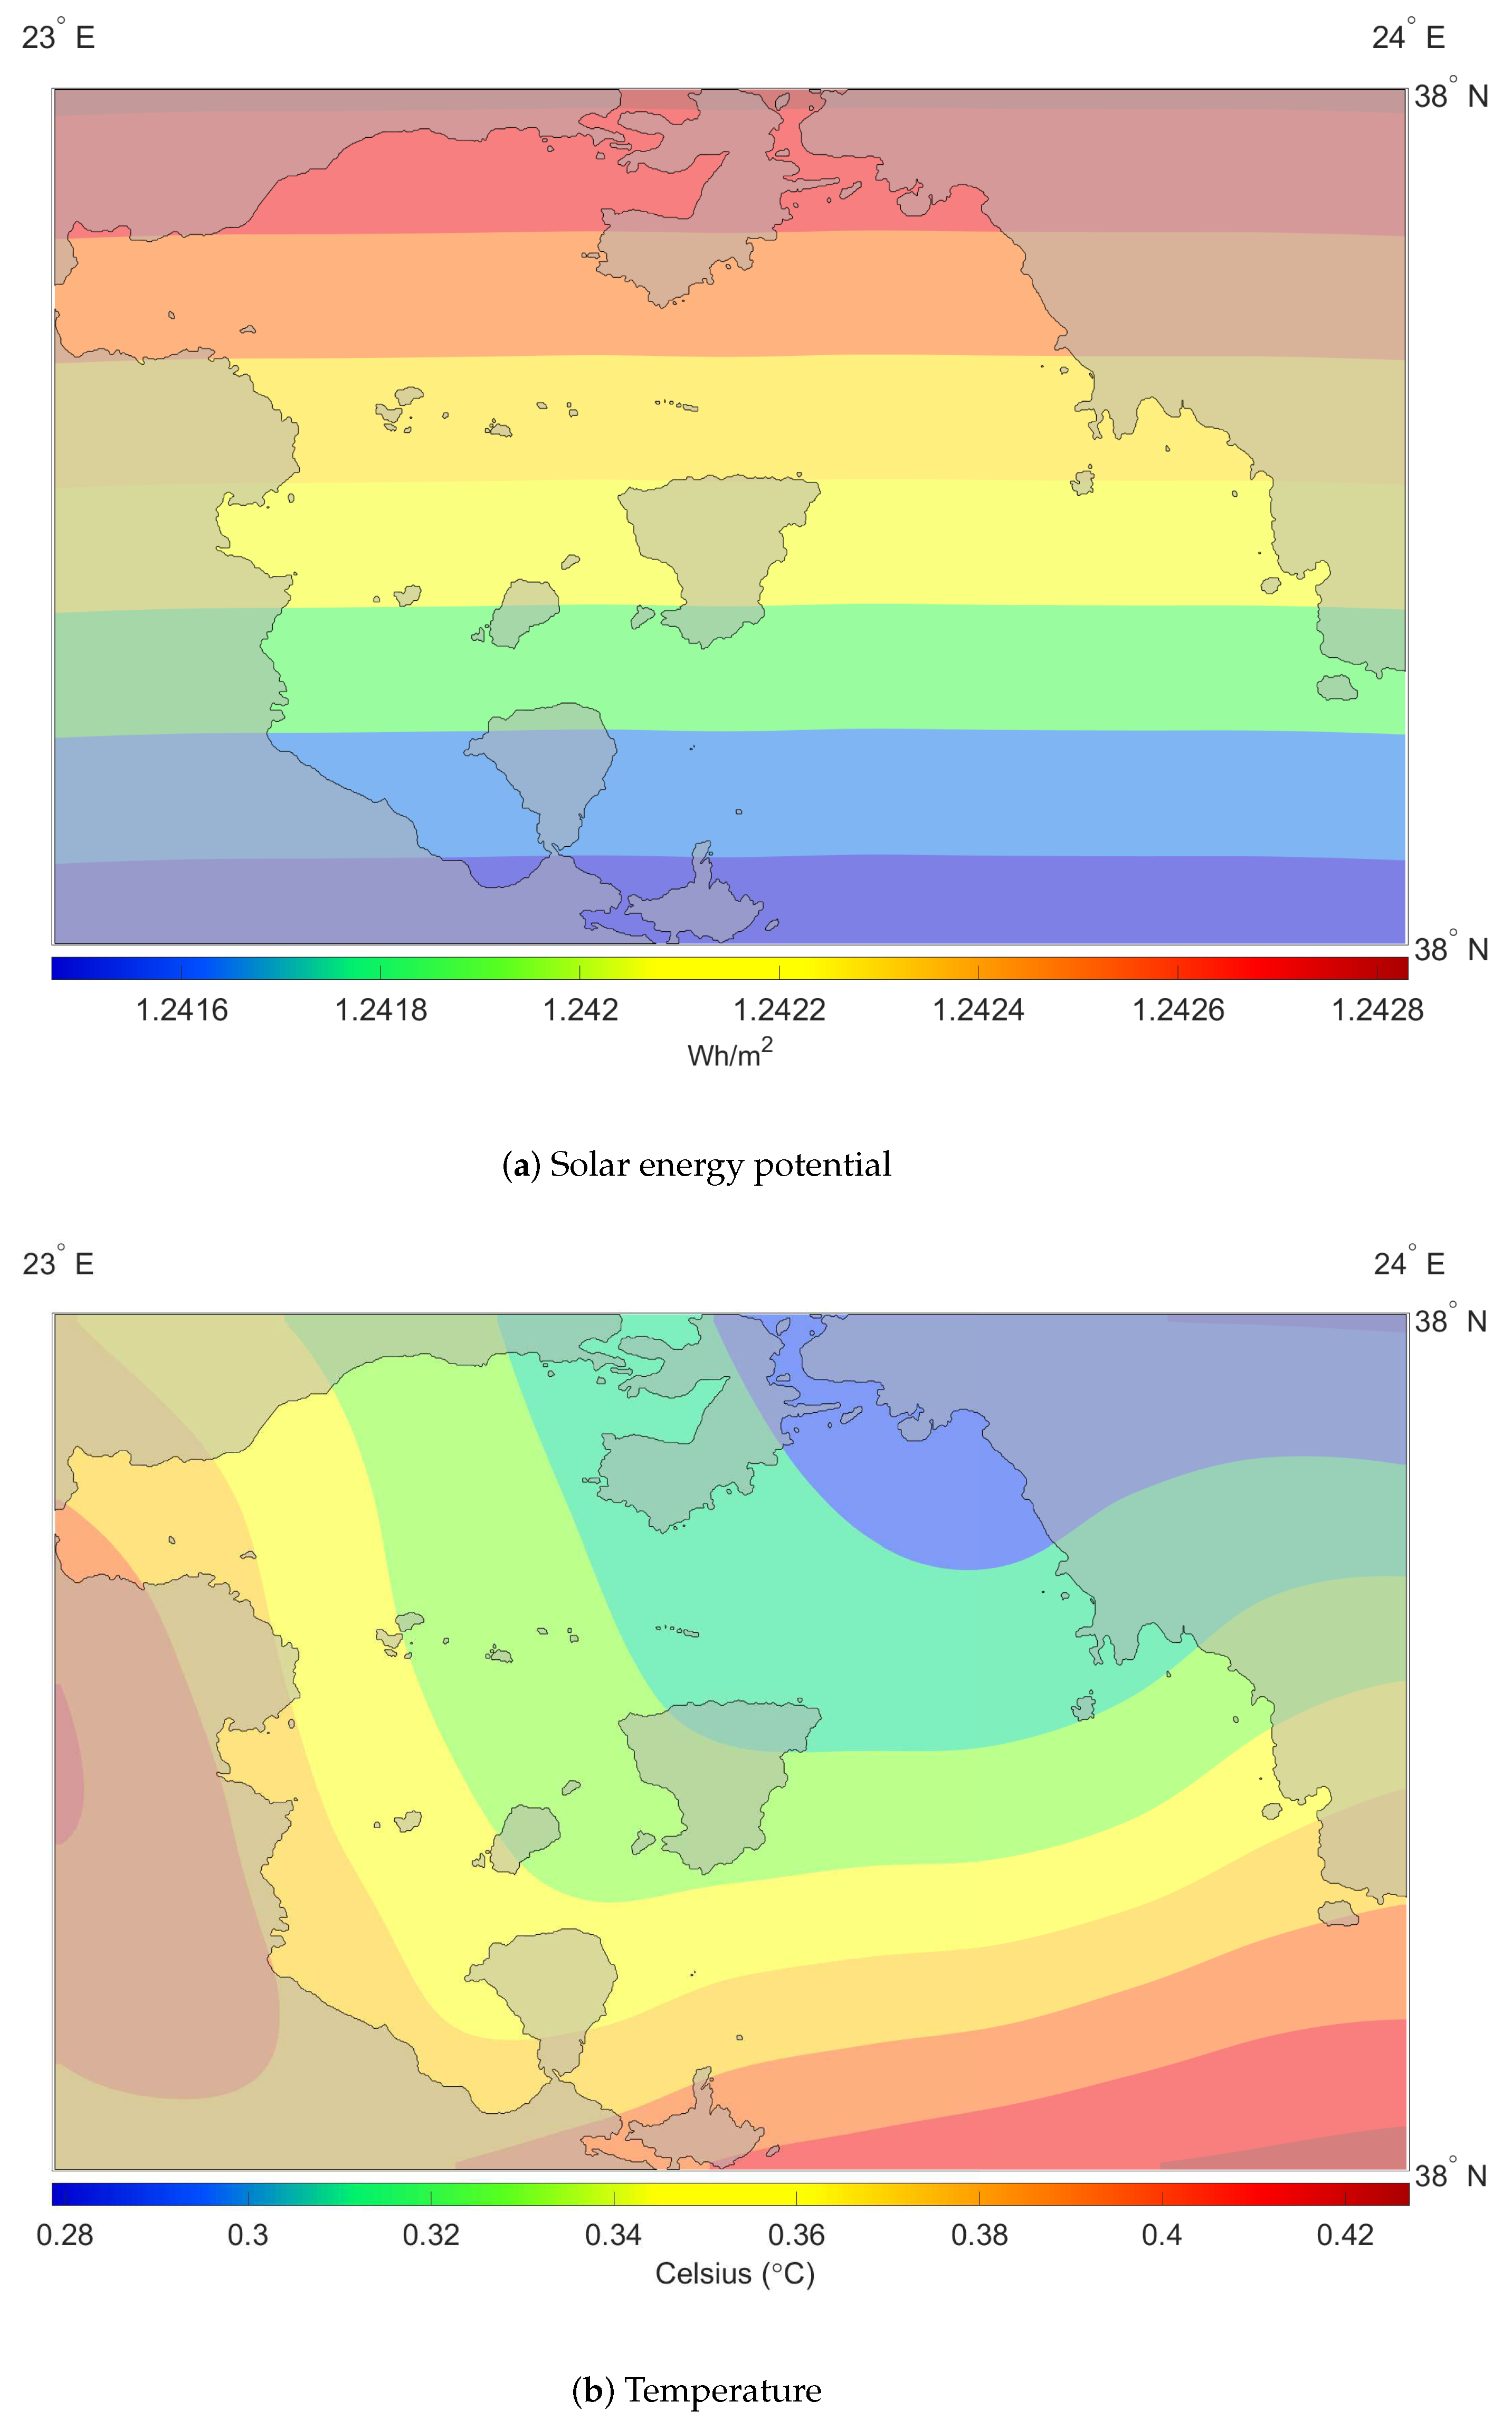
Variation, as expressed by CoV, both for temperature and resource, indicates small expected annual differences. Variation for energy potential was from 1 to 1.2 Wh/, indicating a highly persistent resource. Similarly, expected variation from the mean in temperature was almost negligible, with highest values at 0.2–0.4 °C, see Figure 4
3.2. Wind Resource
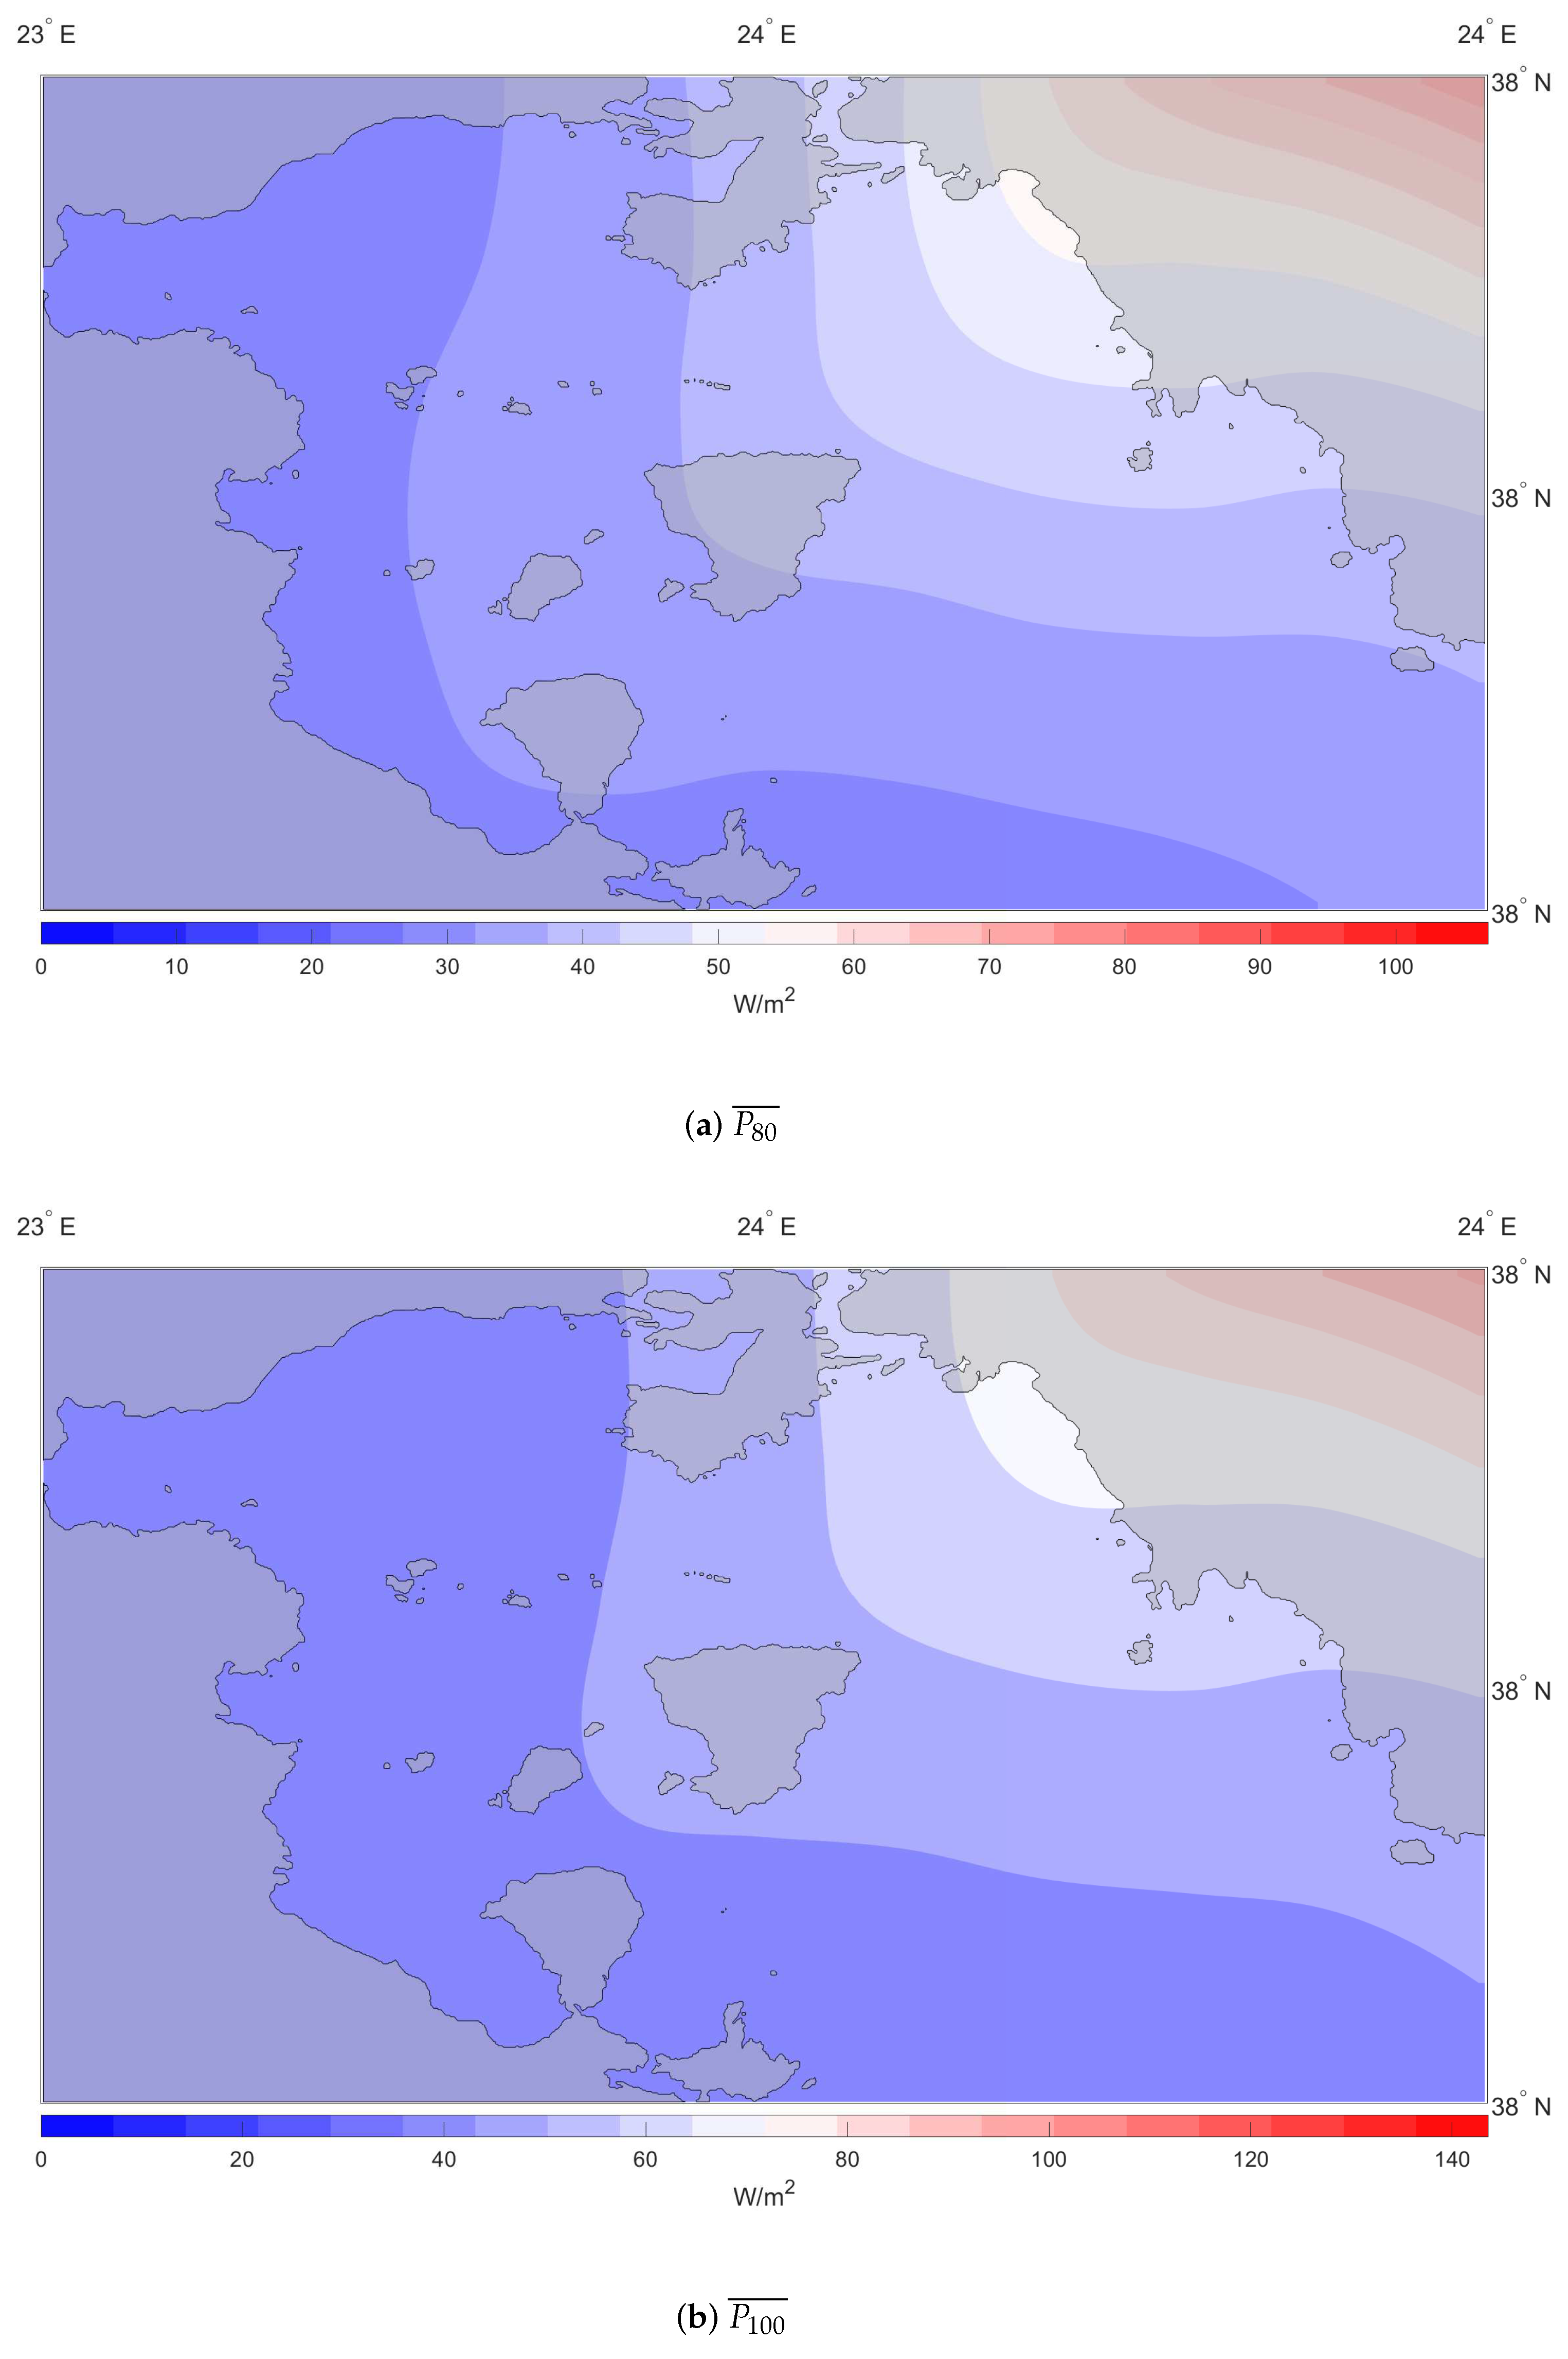
The wind resource was higher over the eastern part of the domain, both at 80 and 100 m, and the energy density was from 90 to 140 W/. In the coastal region of Piraeus, the energy density was 50 W/ and 70 W/ for 80 m and 100 m vertical heights, respectively, see Figure 5.
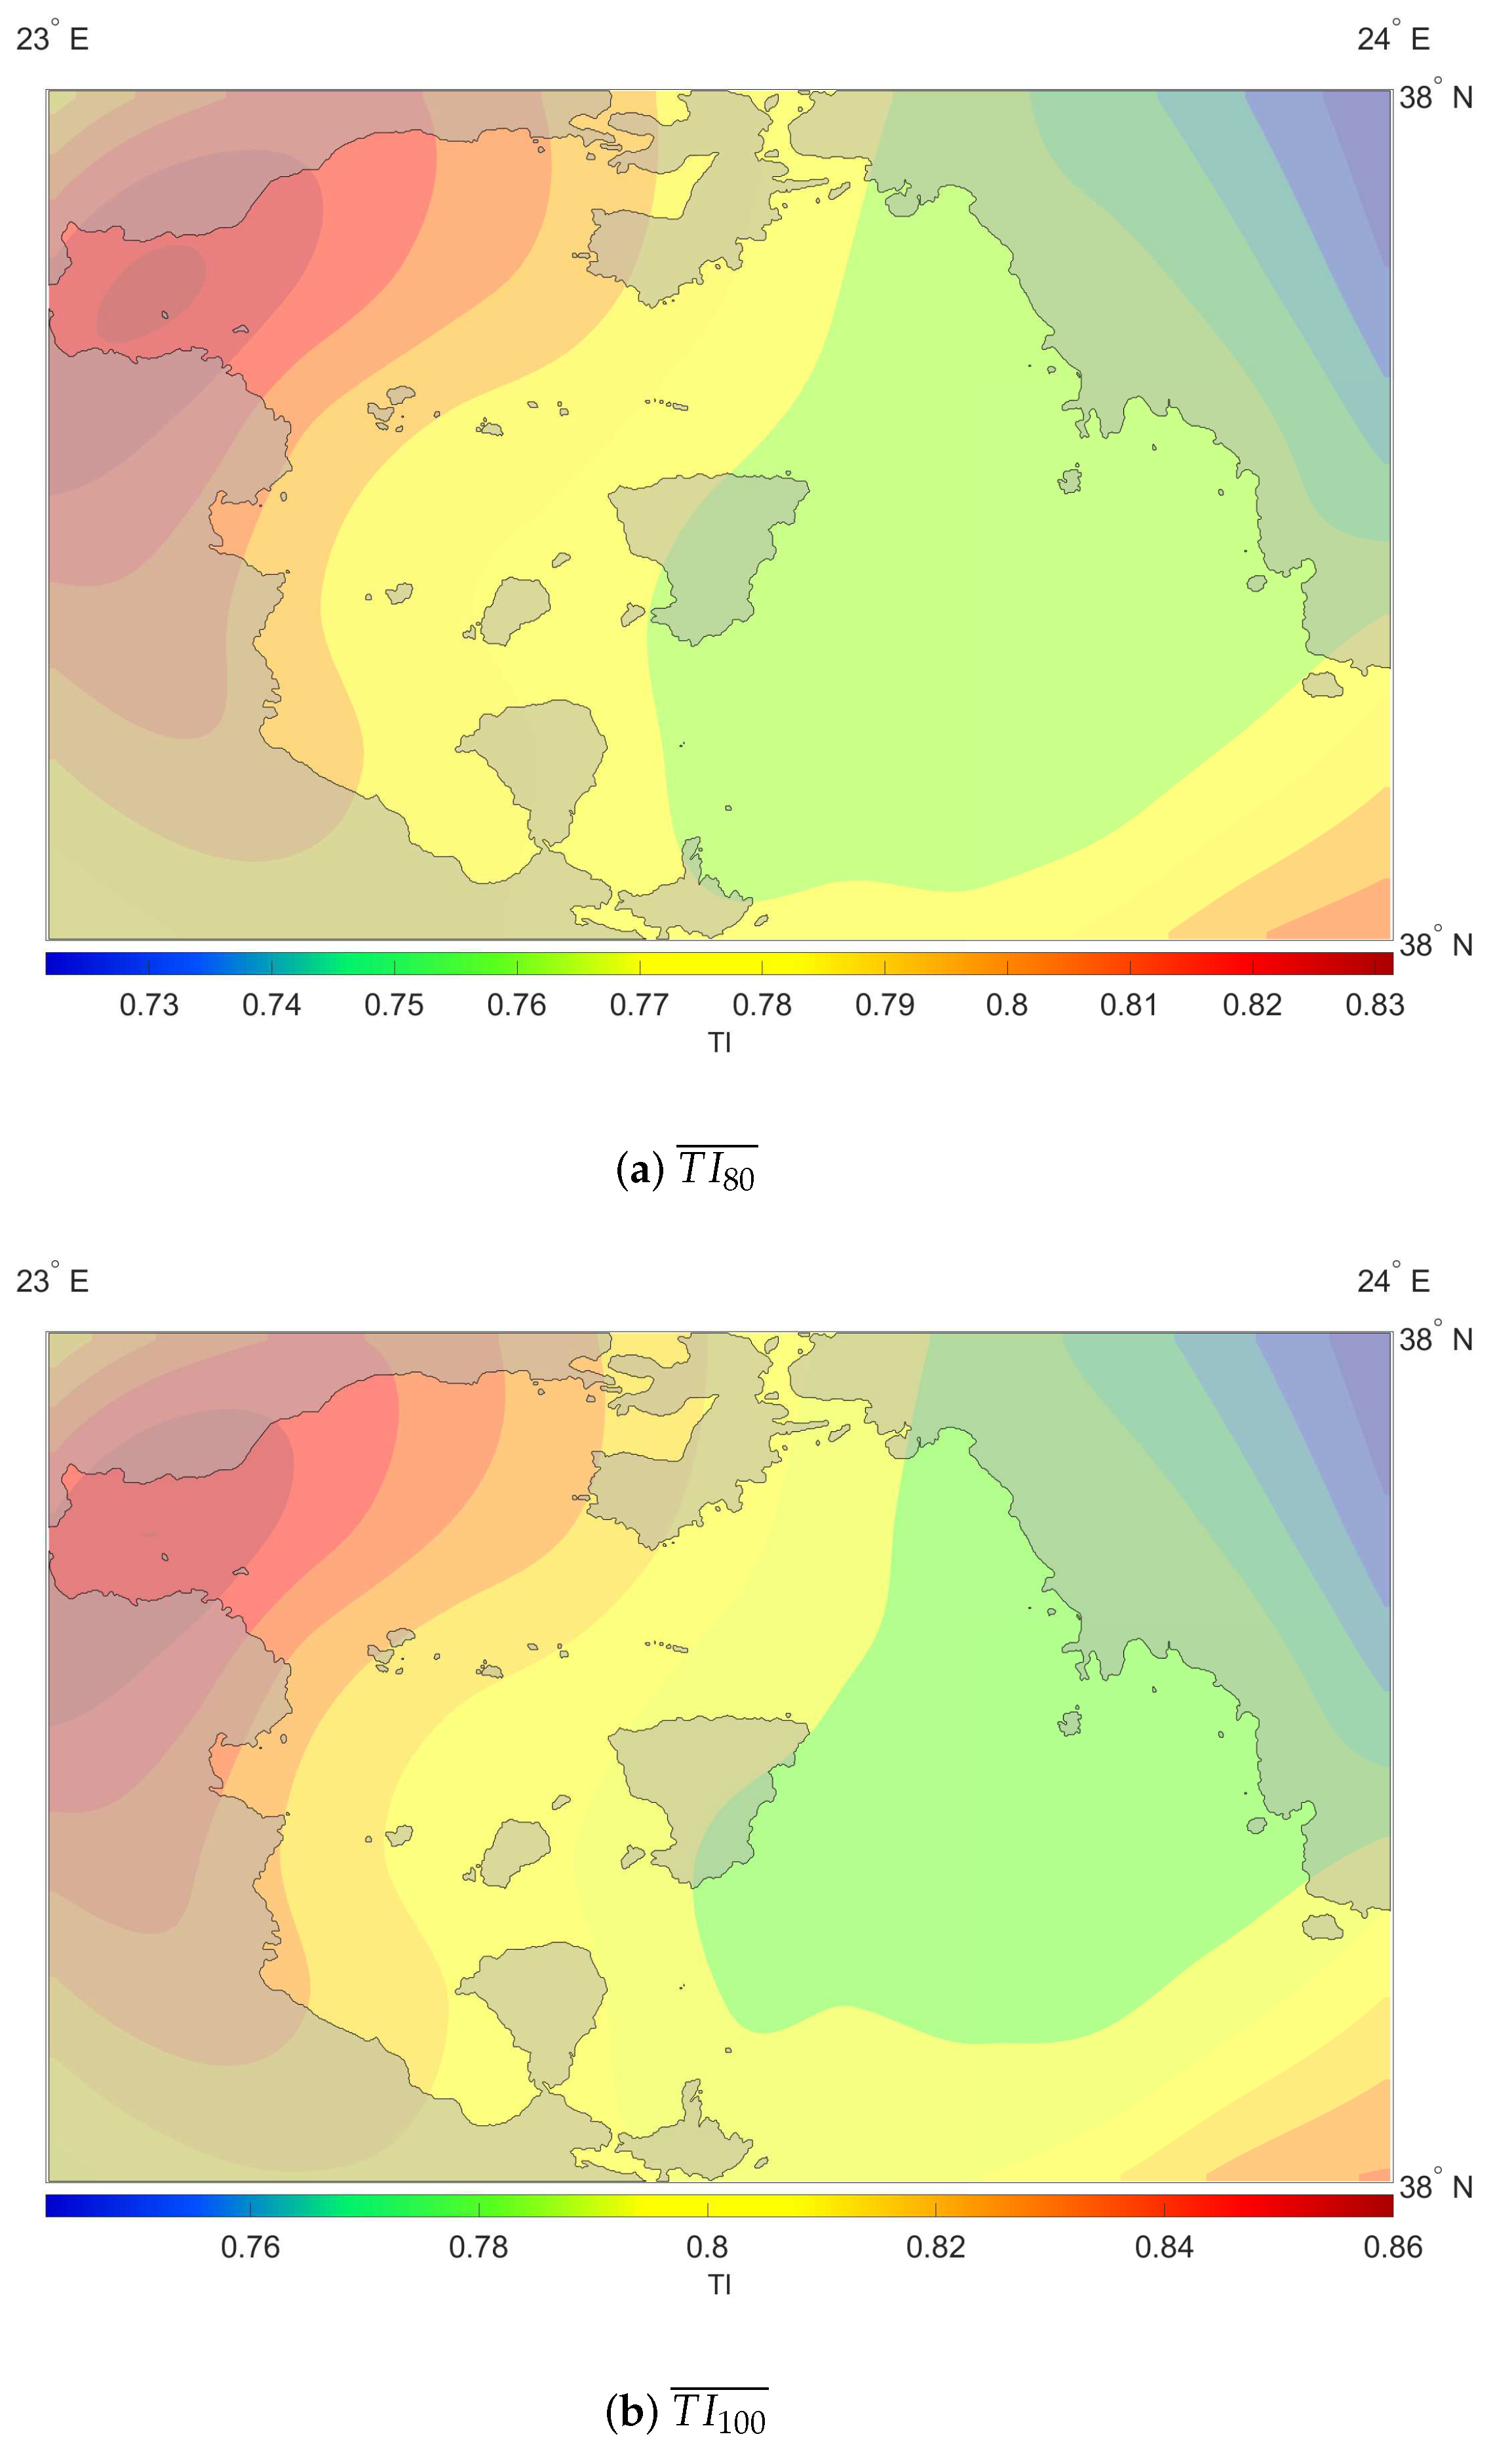
The location of interest is one of the most populated coastal fronts in Greece, with a large number of buildings and coastal developments. In addition, the mountains of Hymettos and Lycabettus are natural obstacles, reducing eastern winds. The combination of mountains and large building density increases wind friction in the area, which yielded higher turbulence intensity (TI) values ≈0.80, indicating a higher volatility for the wind resource, see Figure 6.
3.3. Wave Resource
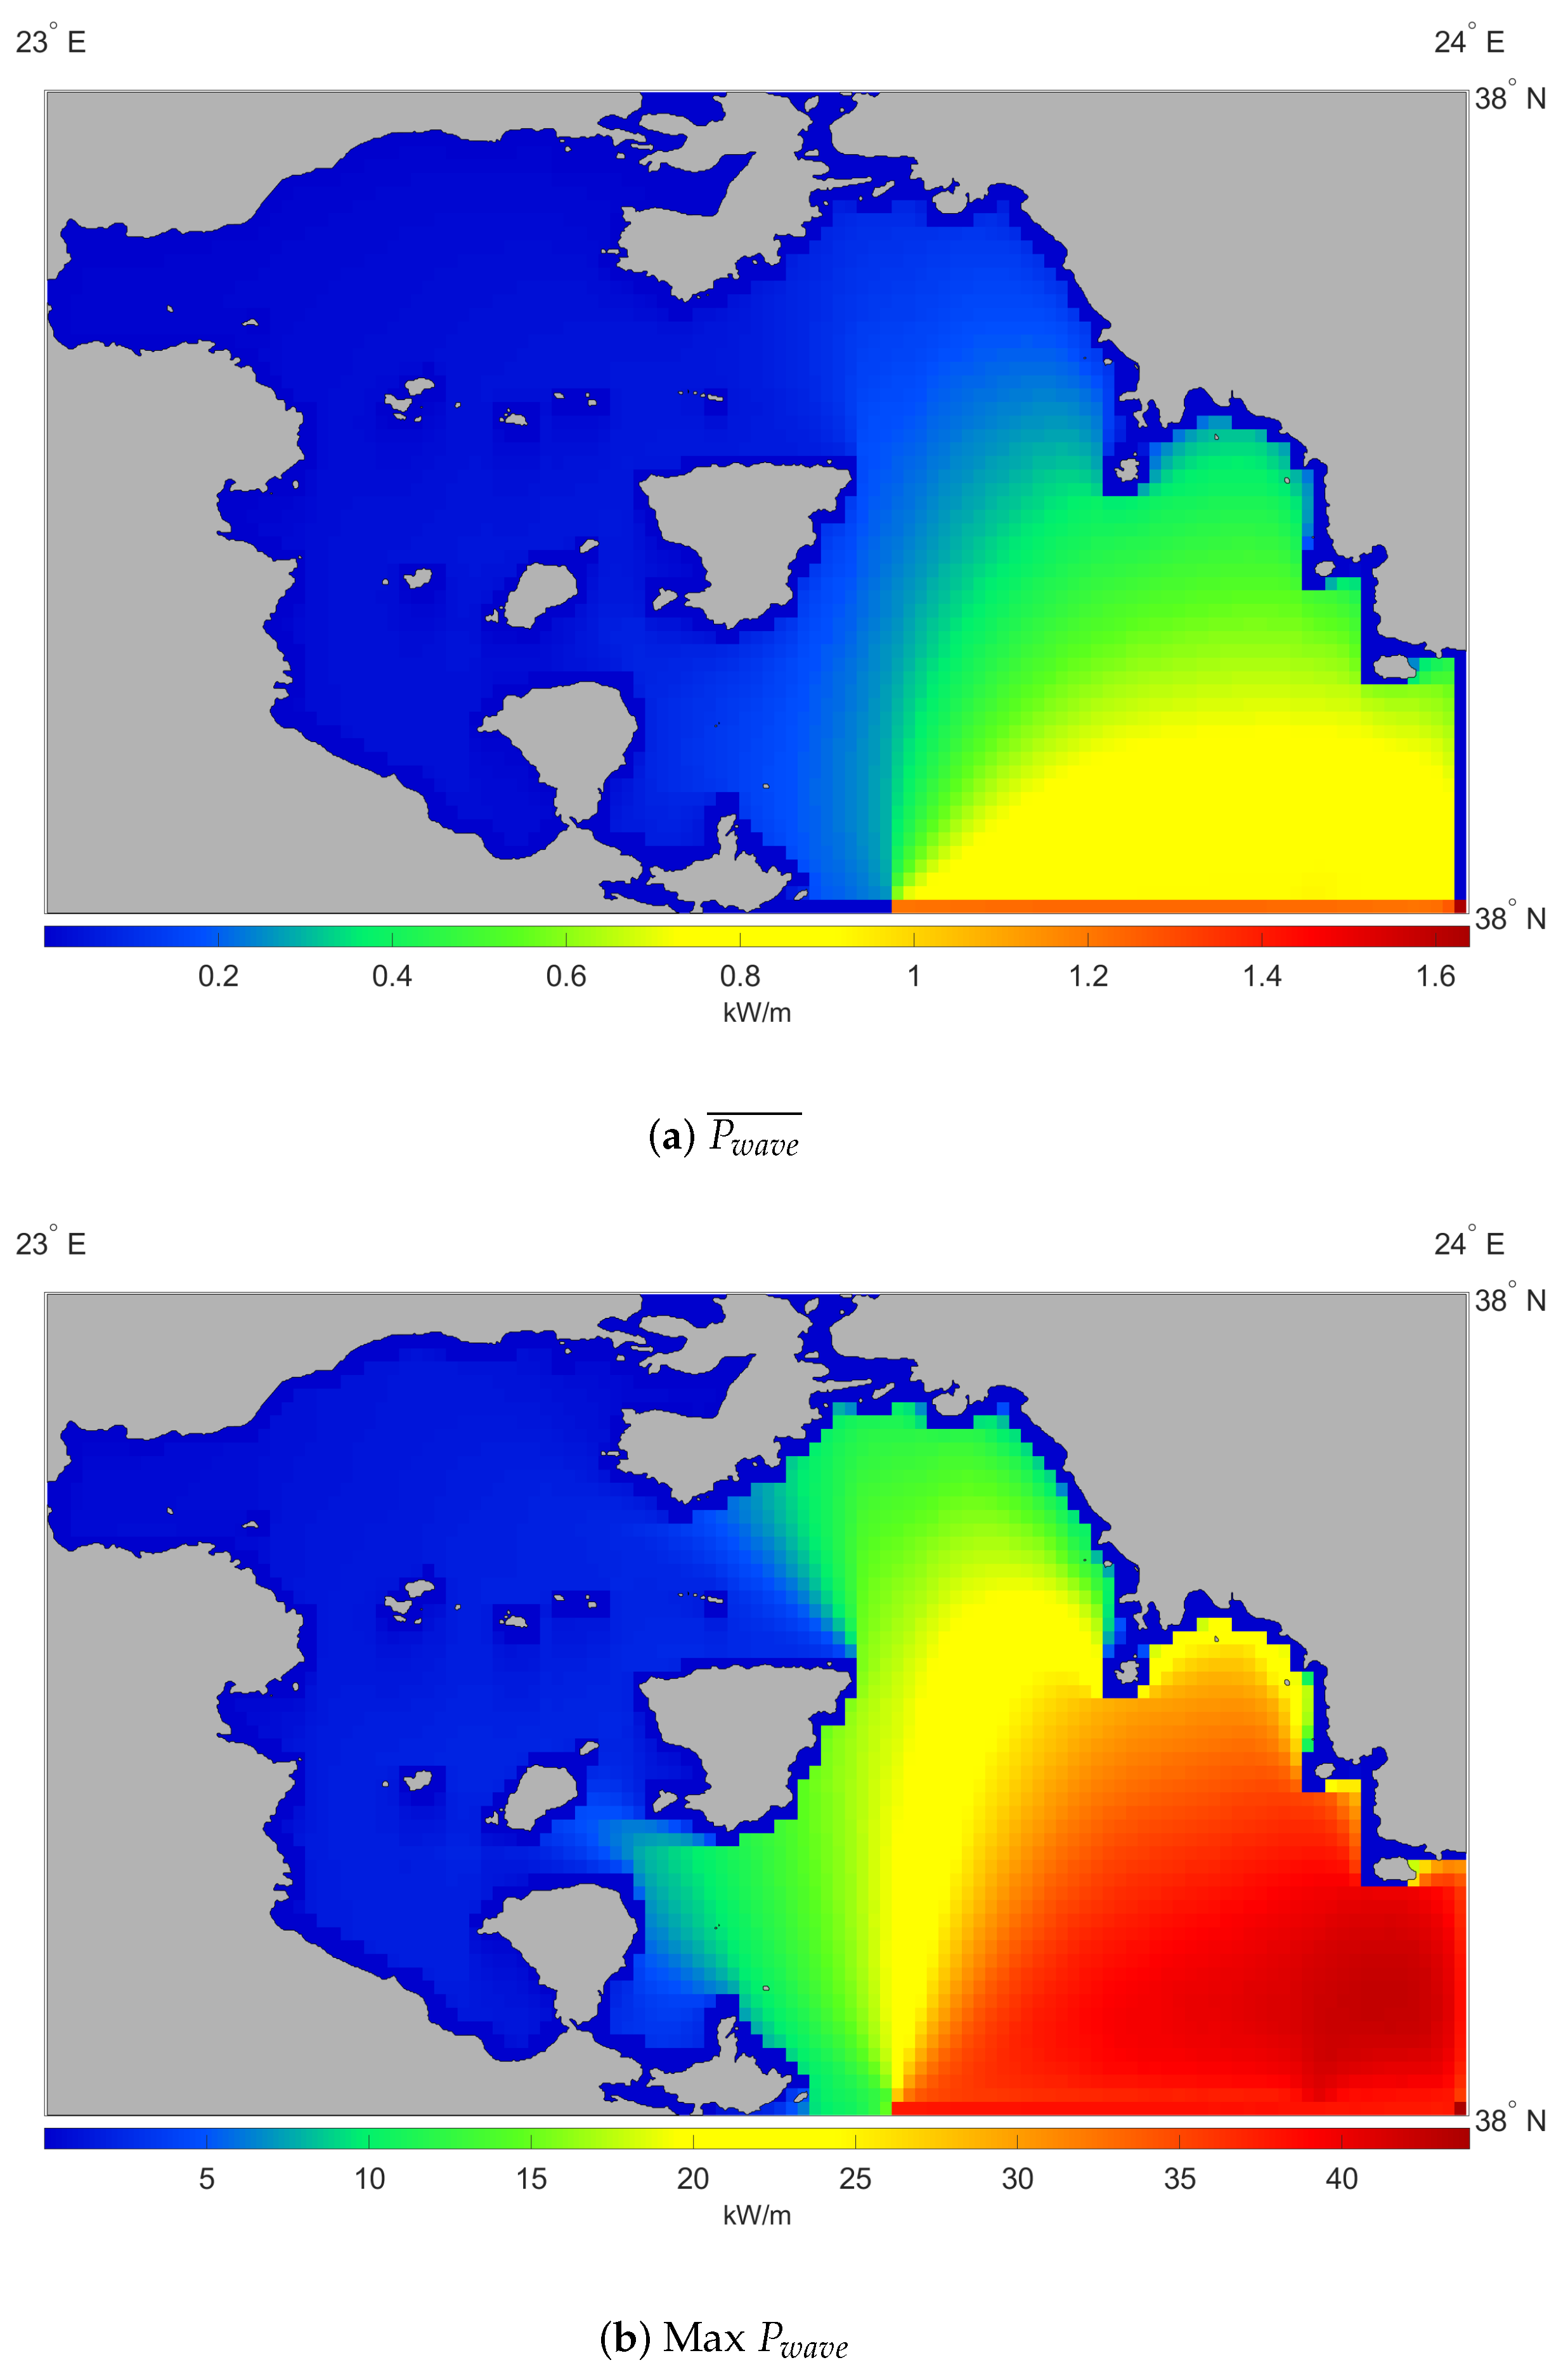
Wave energy is the most under-utilised form for the Greek region. The area has a low energy density resource potential, due to its sheltered characteristics and changes in bathymetry. However, even in such an area, the mean wave energy resource was 0.13–0.17 kW/m (130–170 W/m), which can be harnessed efficiently and contribute to local power production [34,35]. As waves propagate further into the Gulf, the islands of Aigina and Salamina are the main natural elements (obstacles) that reduce waves. Regional bathymetry is from 400 m at its deepest to 10 m at its shallowest. As a general observation there were sharp gradients and bathymetry changes that indicated the breaking of swell waves from the southern boundary, due to interaction at the bottom, and increased impacts of non-linear triad interactions responsible for wave transformations nearshore. While the mean overall wave energy was low, higher values were found predominately in winter months, with energy density from 12 to 20 kW/m (12,000–20,000 W/m) at accessible depths, see Figure 7.
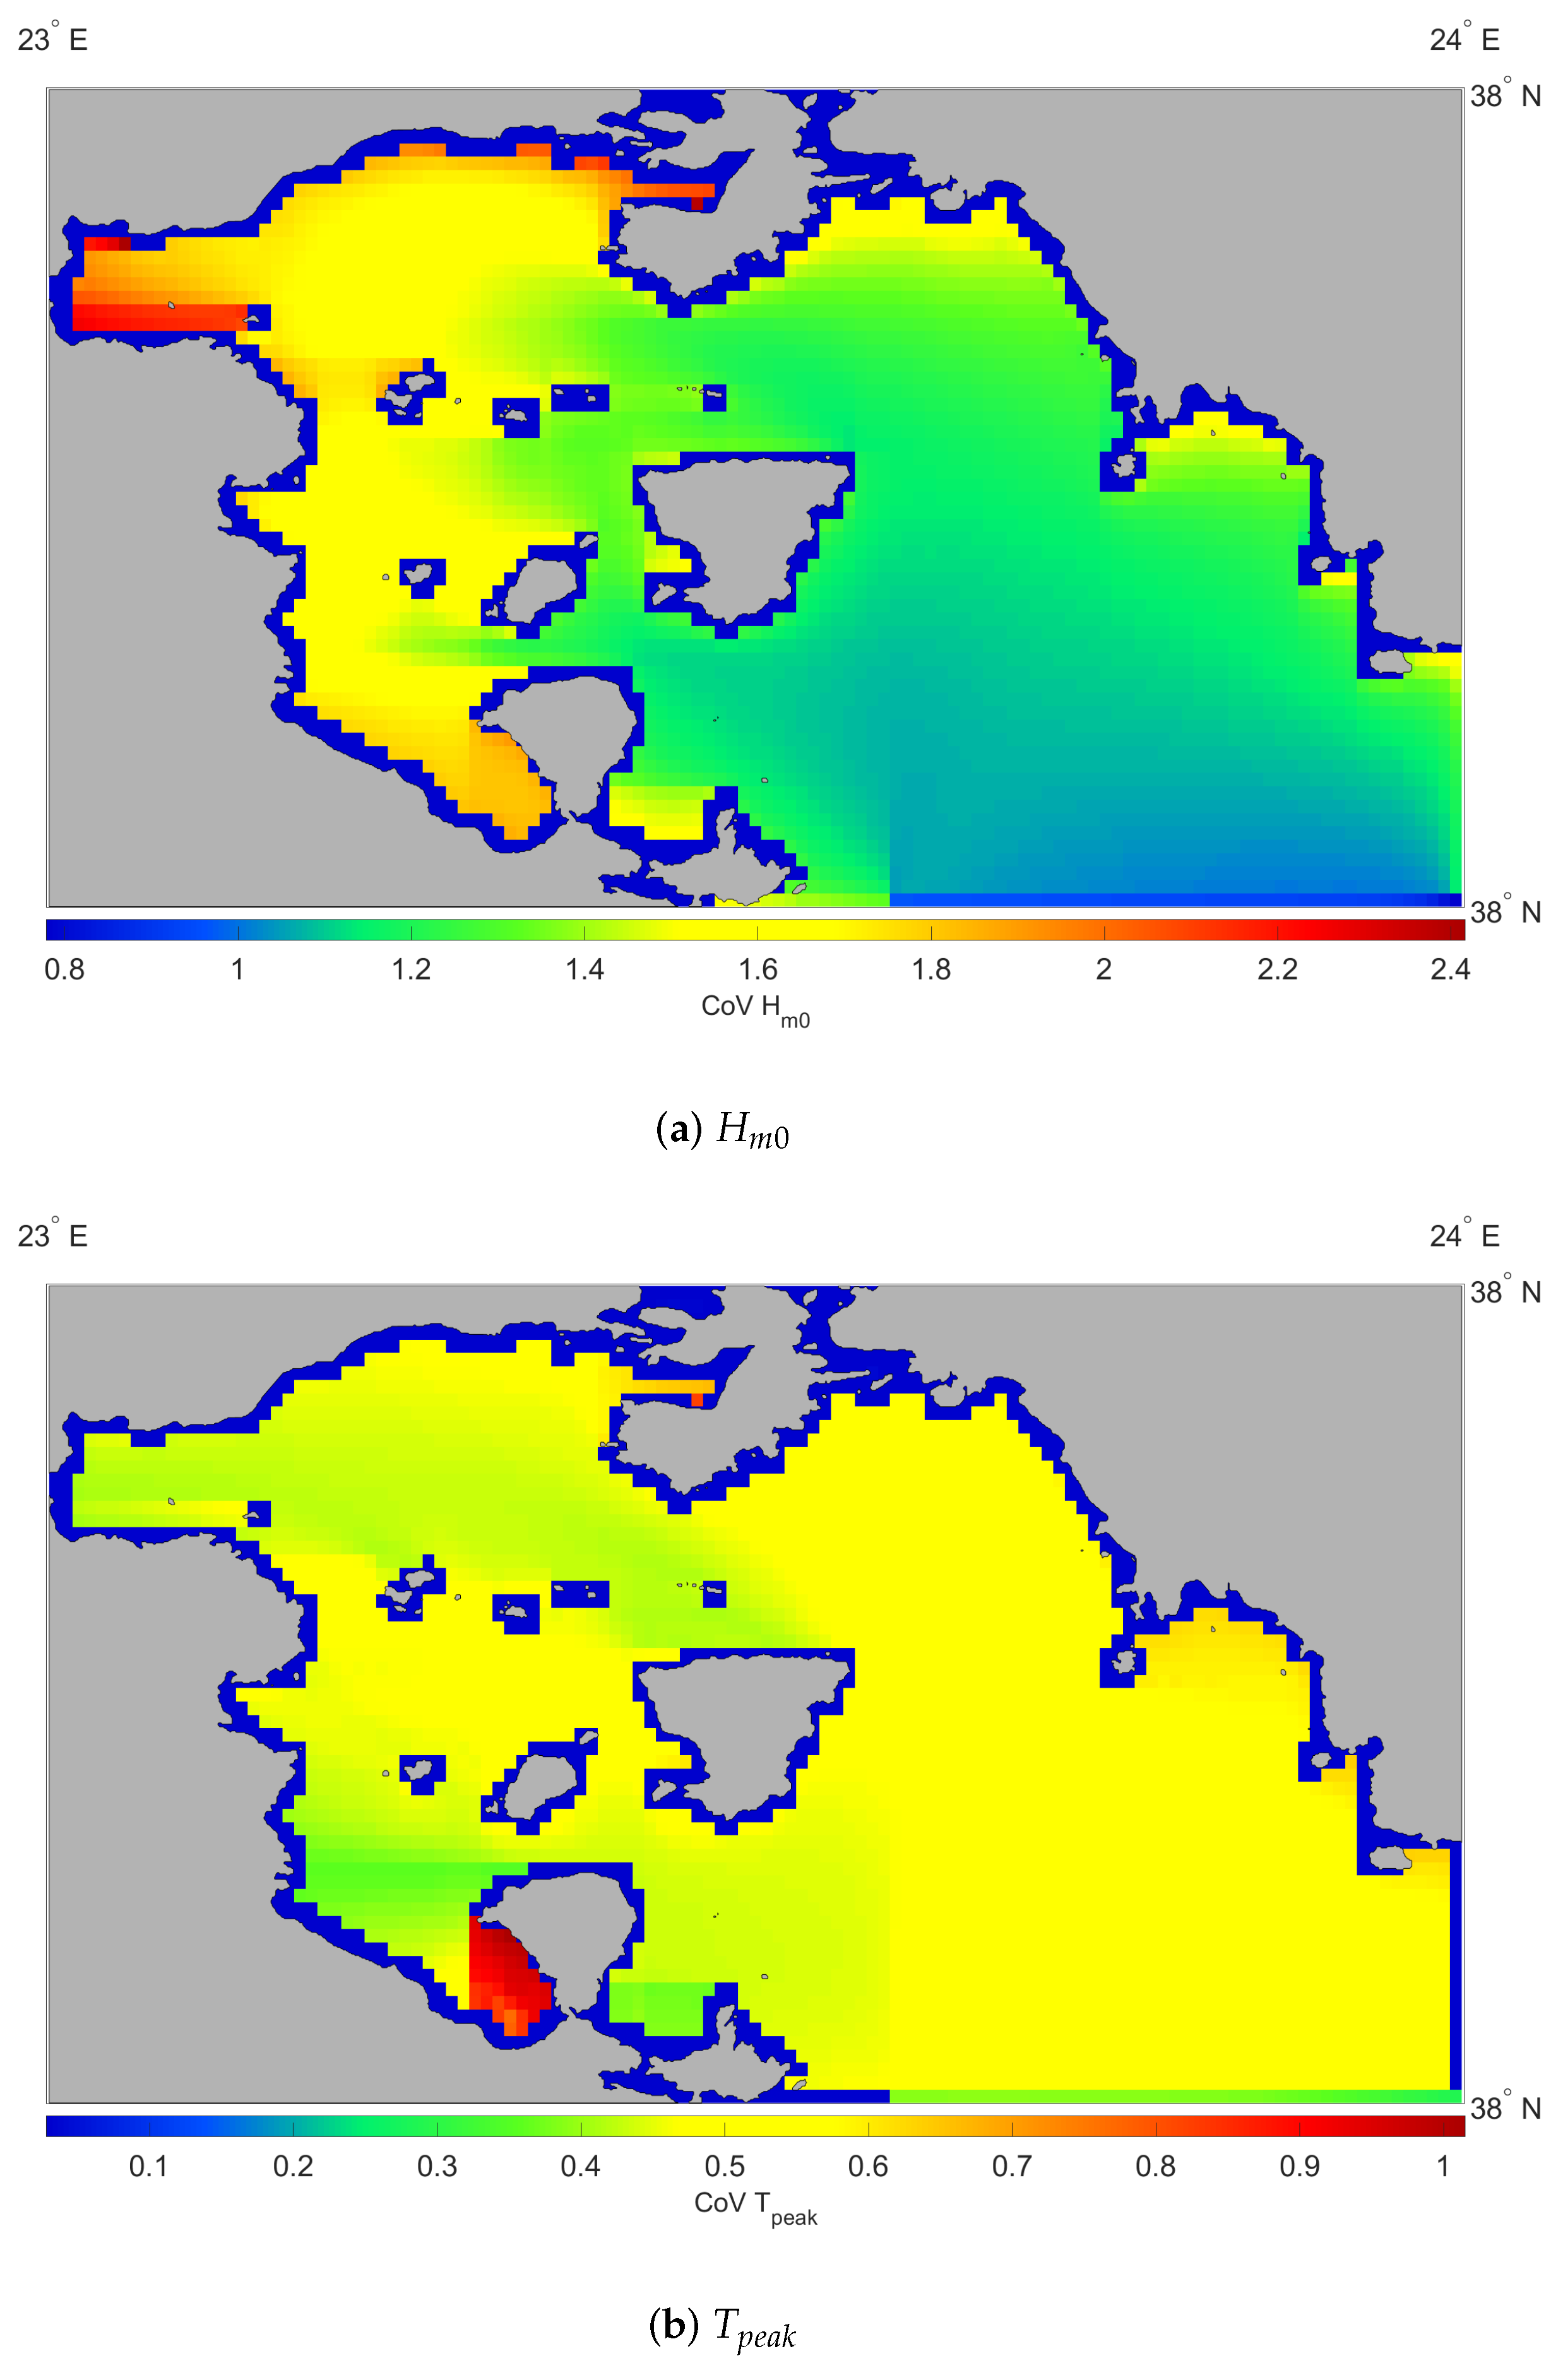
The CoV, and hence expected differentiation of the resource, can be expressed both in the mean and also from the terms that constitute the spectral expression of wave energy. Specifically, the frequency is represented by the wave peak period and the “amplitude”/disturbance by the significant wave height (). The parameter with a moderate variation was , surrounding the Port of Piraeus, and CoV values were ≈0.5 with deeper regions expressing less variation. The highest volatility was concentrated behind the island of Methana (in the western part of the domain), see Figure 8.
The main reason for this volatility is the large resource differences that occur, in part due to diffracted waves, and the occurrence of mostly wind-generated waves. Areas behind the island are dominated by high-frequency (low-period) waves; however, during winter months, the incoming southern swells propagated in the domain and were diffracted due to the local orography, as waves tend to travel to areas with less energy. Subsequently, in this area there are larger discrepancies between maxima and minima frequencies, which in turn affect the standard deviation and statistical characteristics.
3.4. Renewable Potential along the Saronikos Gulf
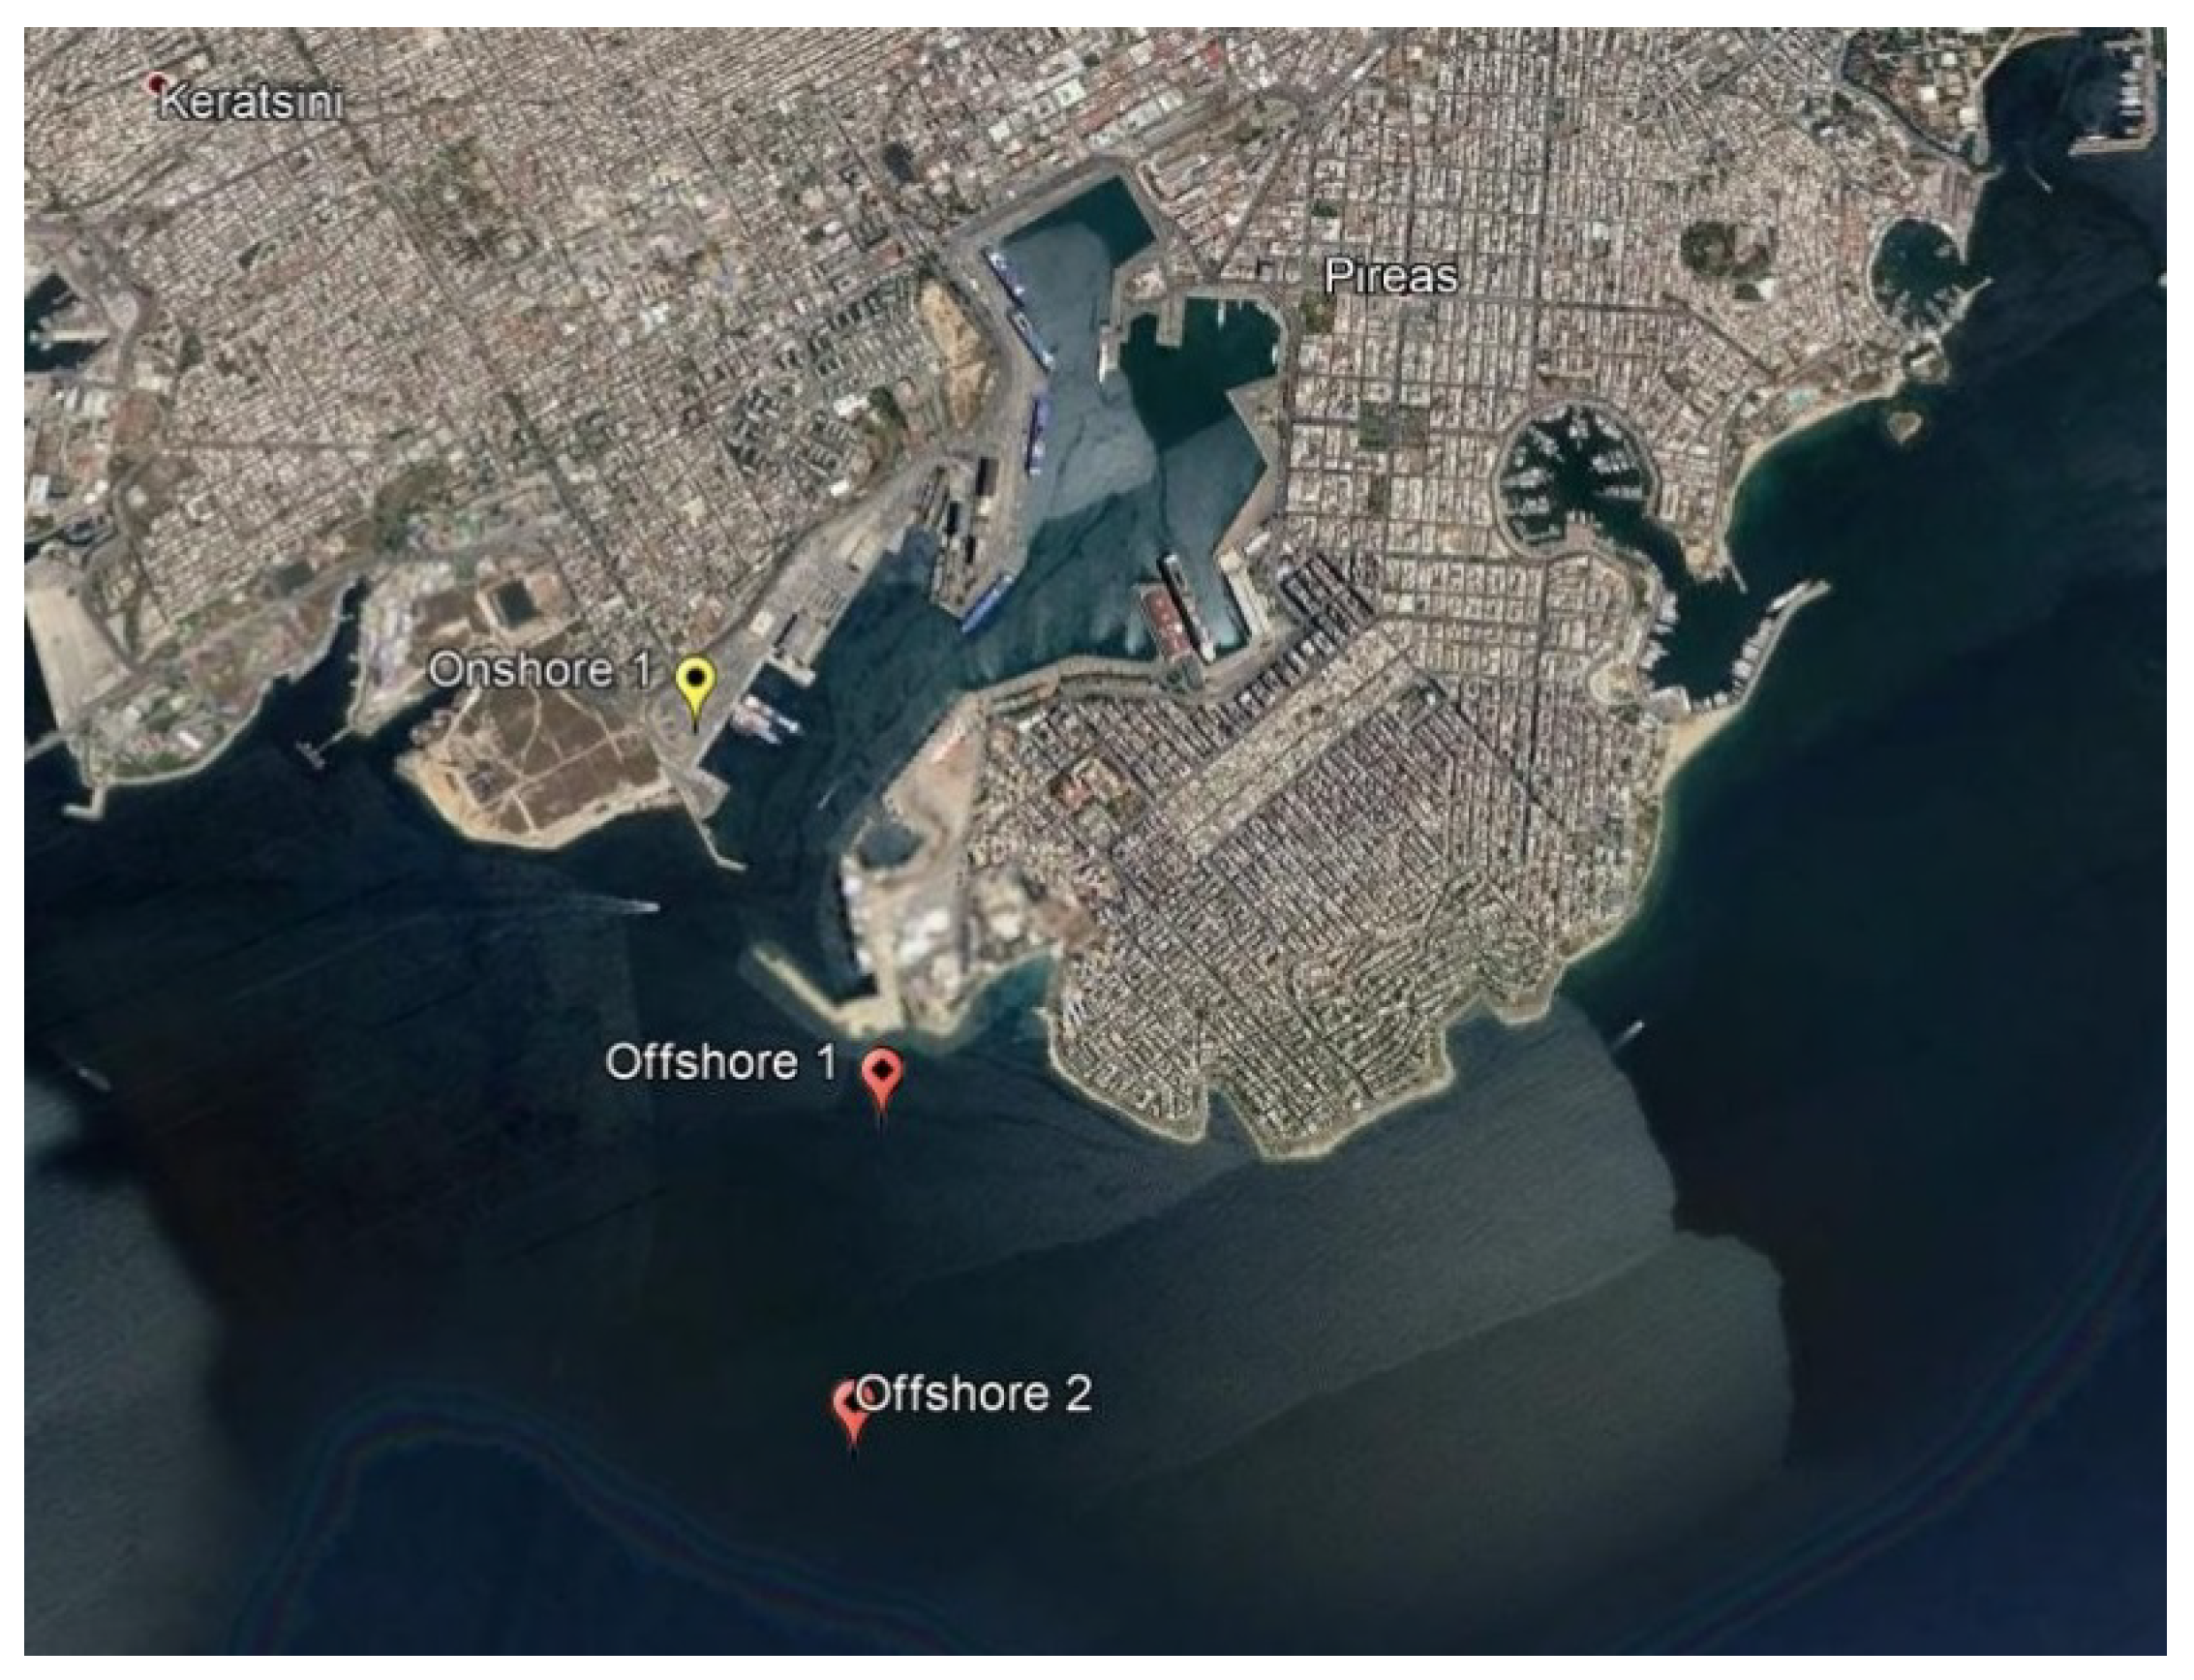
Our focus is on locations, both onshore and offshore, in the Saronikos Gulf aiming to determine the availability of resources near and around the Port of Piraeus, see Figure 9. Given the latest developments in renewables, onshore and offshore data are important to estimate resources, as the probability of utilising offshore wind, floating solar and wave energy has increased. The locations chosen represent potential areas that can accommodate all three renewable energy sources, and they are in close proximity to the Port Authority and the commercial port zone: Onshore 1 ( North, East), Offshore 1 ( North, East), Offshore 2 ( North, East), see Figure 9.
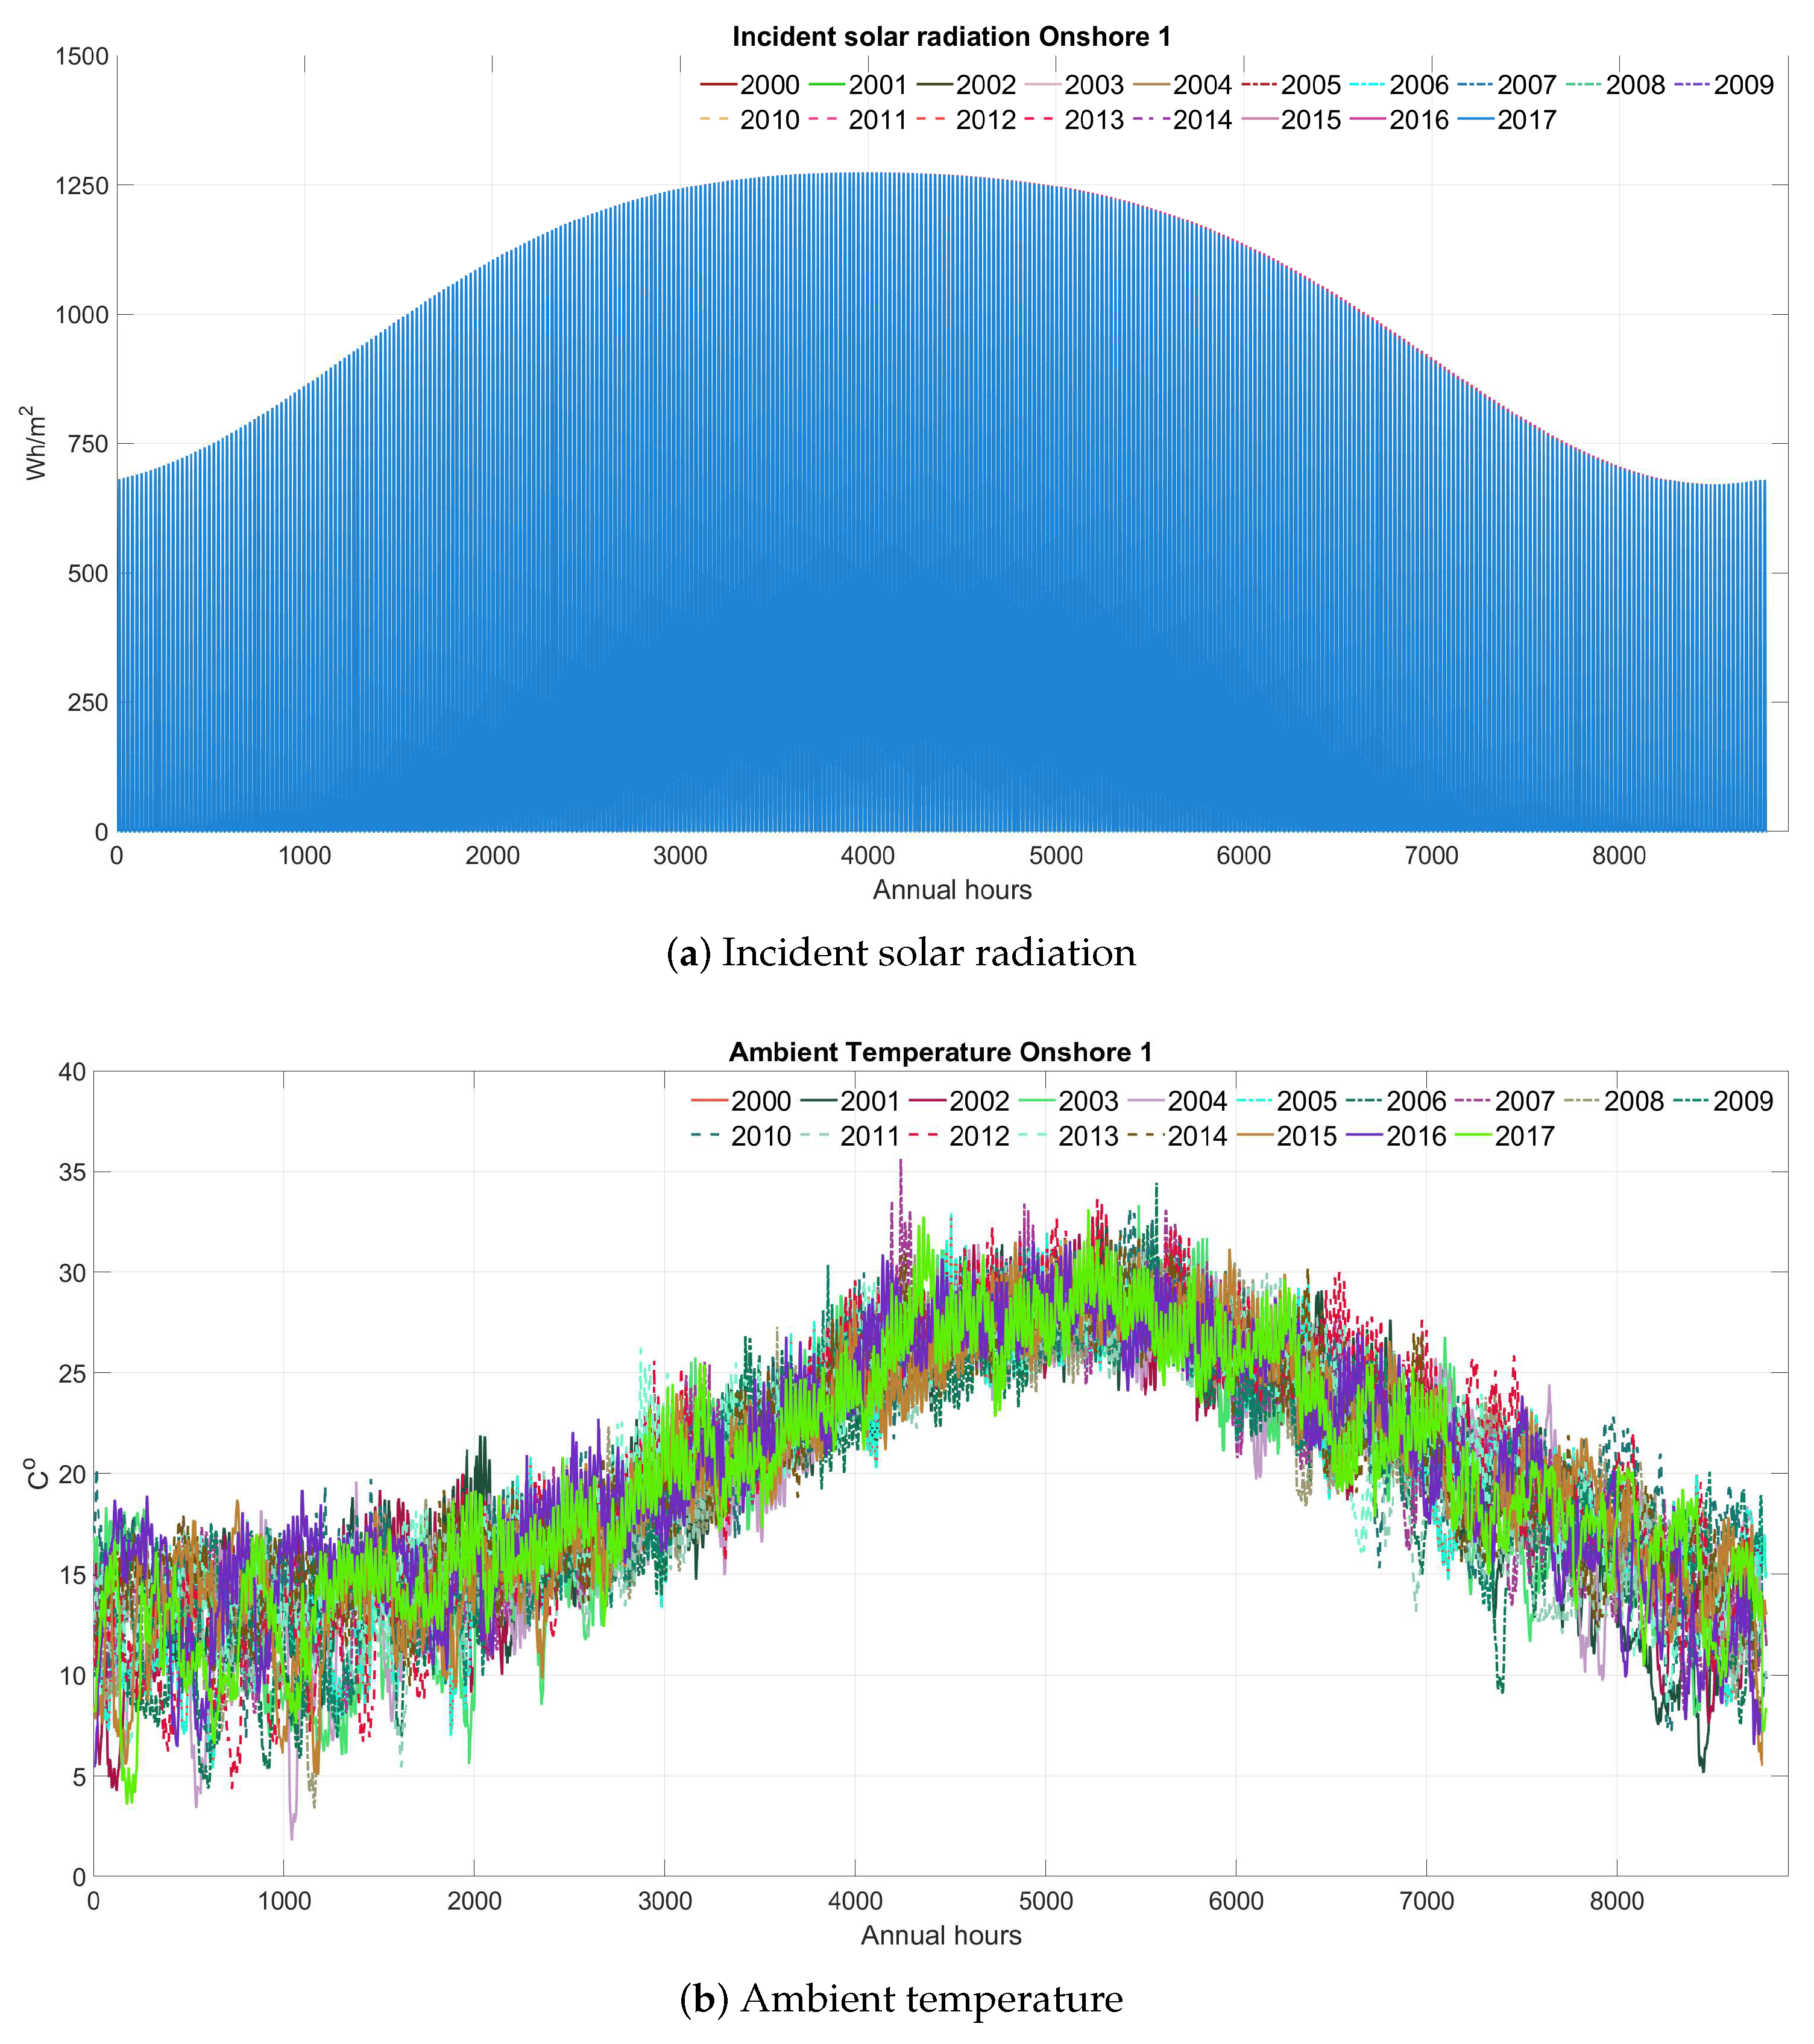
First the solar resource was analysed. Higher potential throughout the years occurred in summer months (from May to September), with consistent values at Onshore 1 ≥800 Wh·. Similarly, ambient temperatures were ≥20 °C, with the highest value in 2007 at 35.6 °C and the lowest temperature recorded in February 2004 at 1.9 °C, see Figure 10. Due to the spatial proximity of Offshore 1 and 2, similar values for solar radiation and ambient temperature were recorded and had a negligible difference, with the offshore locations being “cooler” by 0.05 °C.
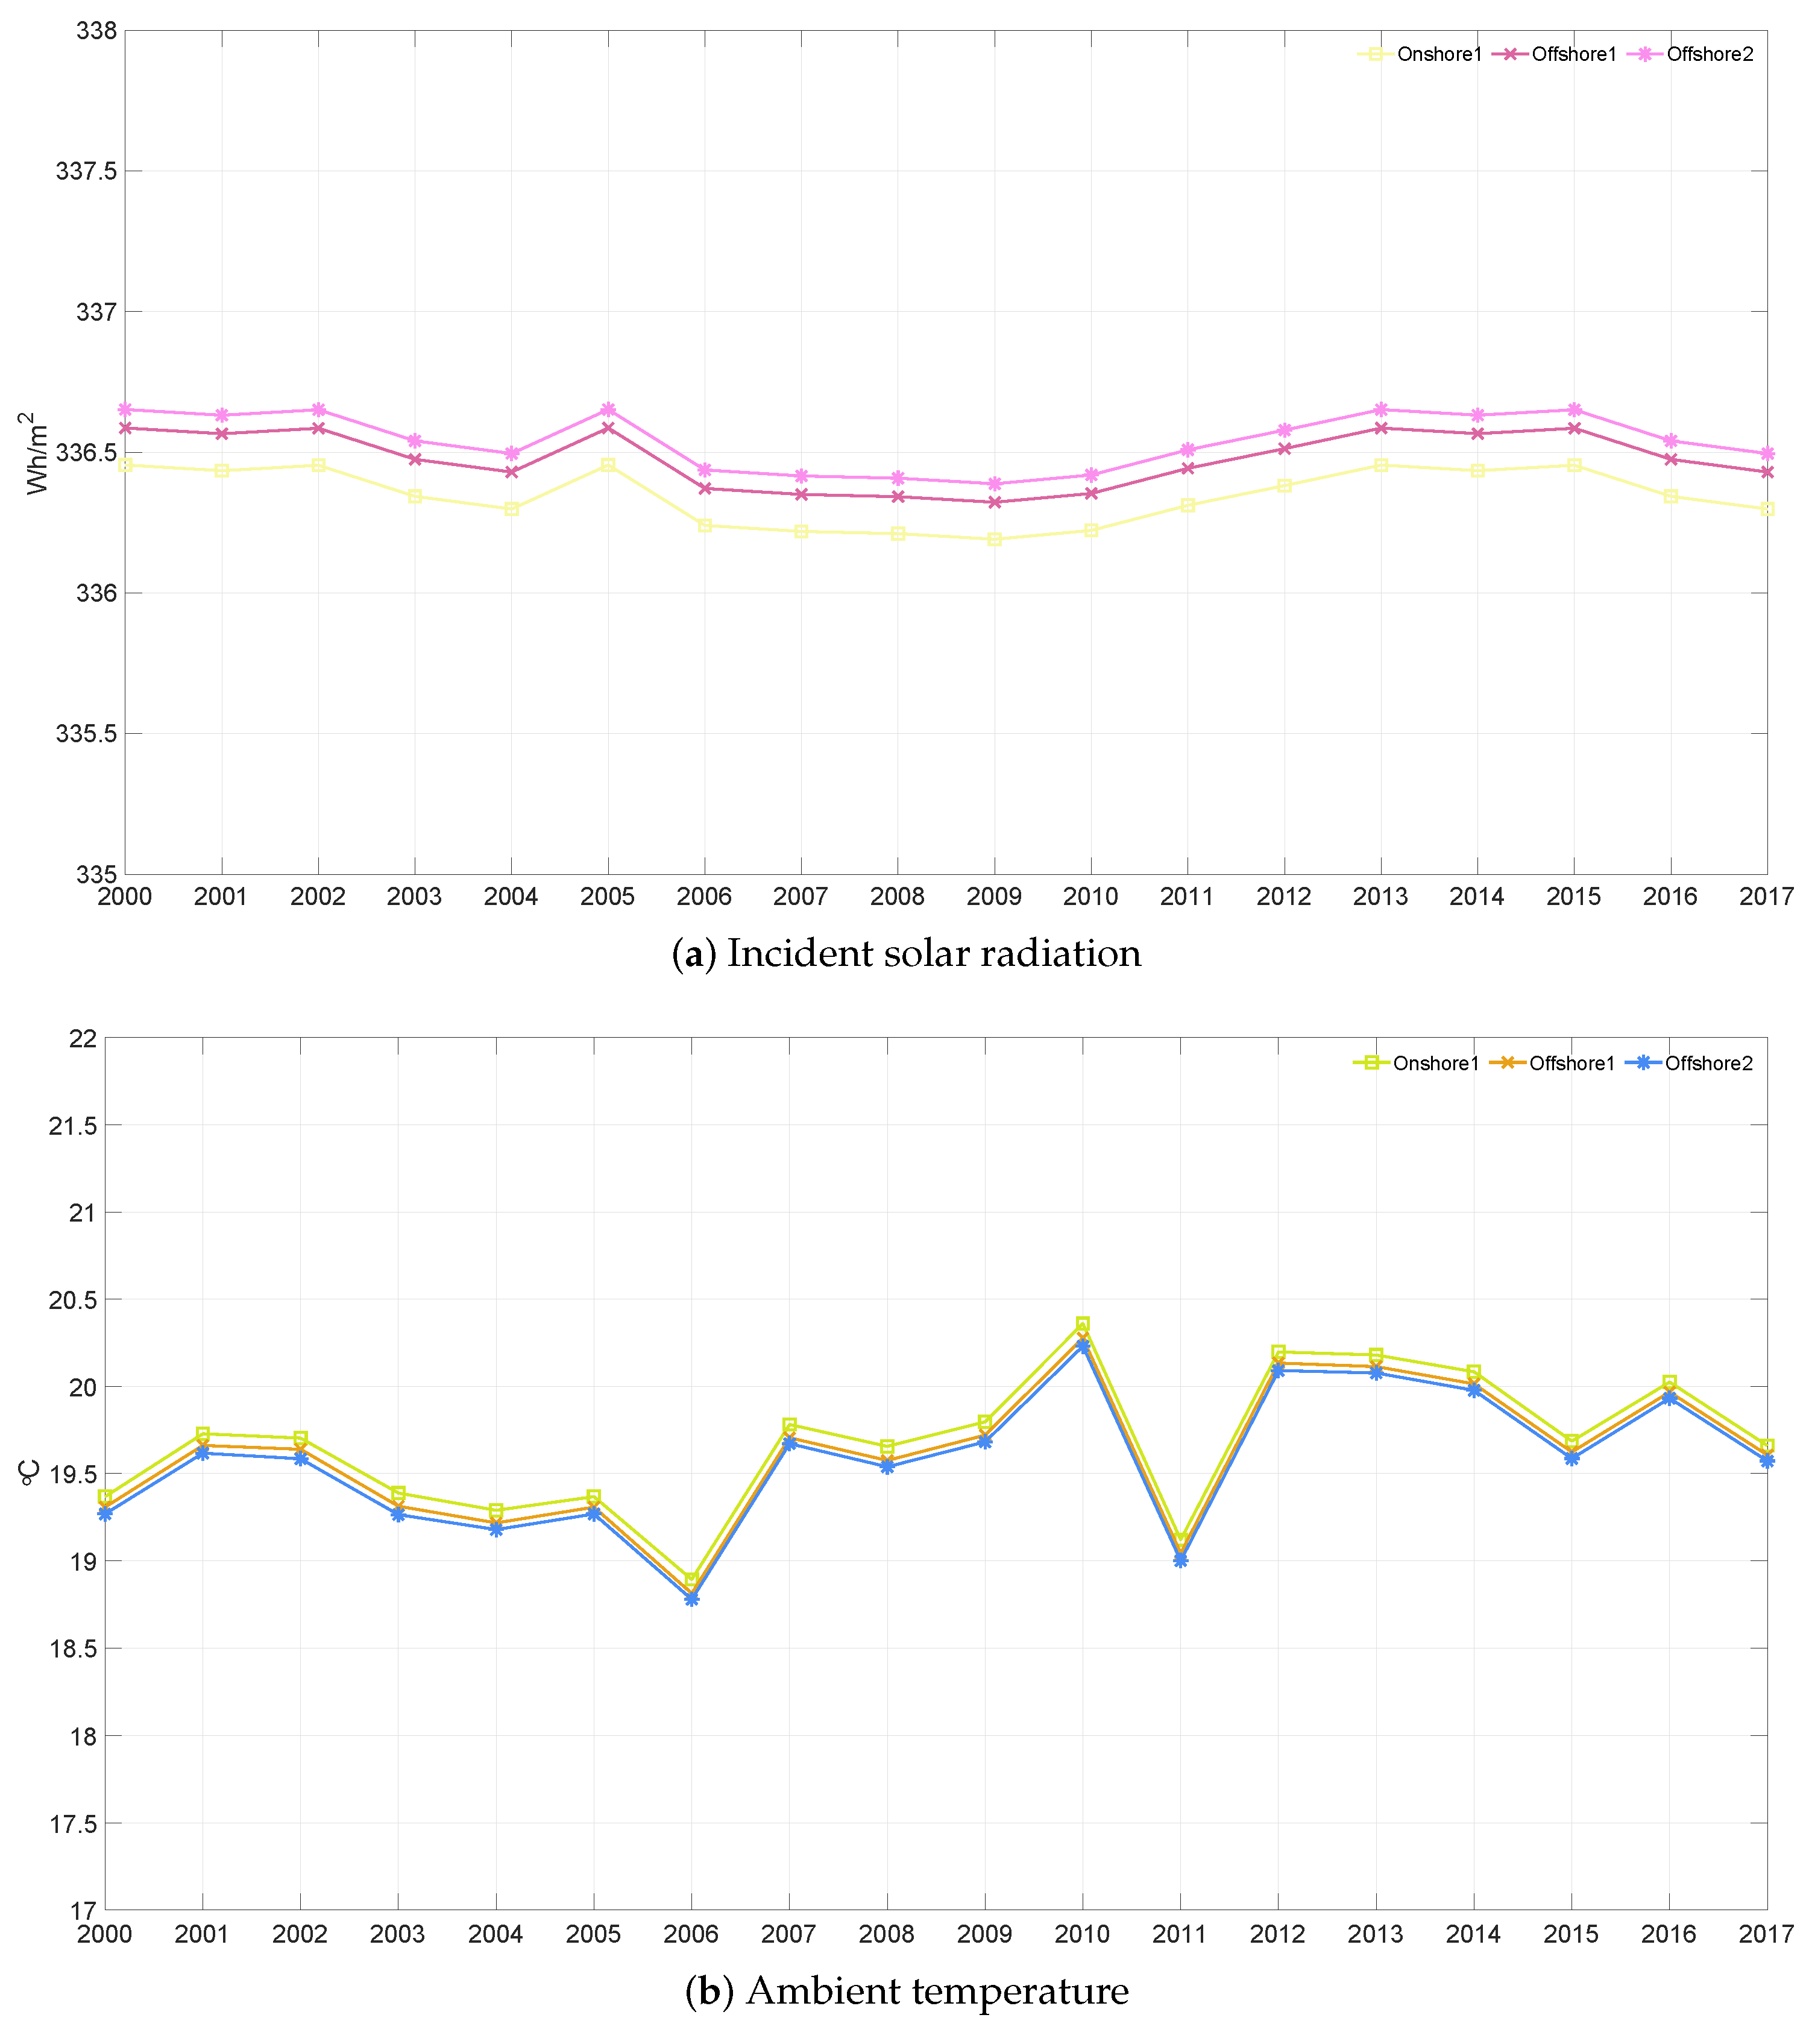
These small hourly differences are visible in solar parameter mean values, with a positive rate of change (RC) 0.0348 °C/year and incident radiation reducing its mean value by 0.0018 Wh·/year; similar values were found for the two other locations, with a positive RC for temperature and a reduction for incident levels. When the parameters are examined annually (see Figure 11), indeed it is clear that the annual differences were small for all locations, with temperature showing the “highest” annual mean variation.
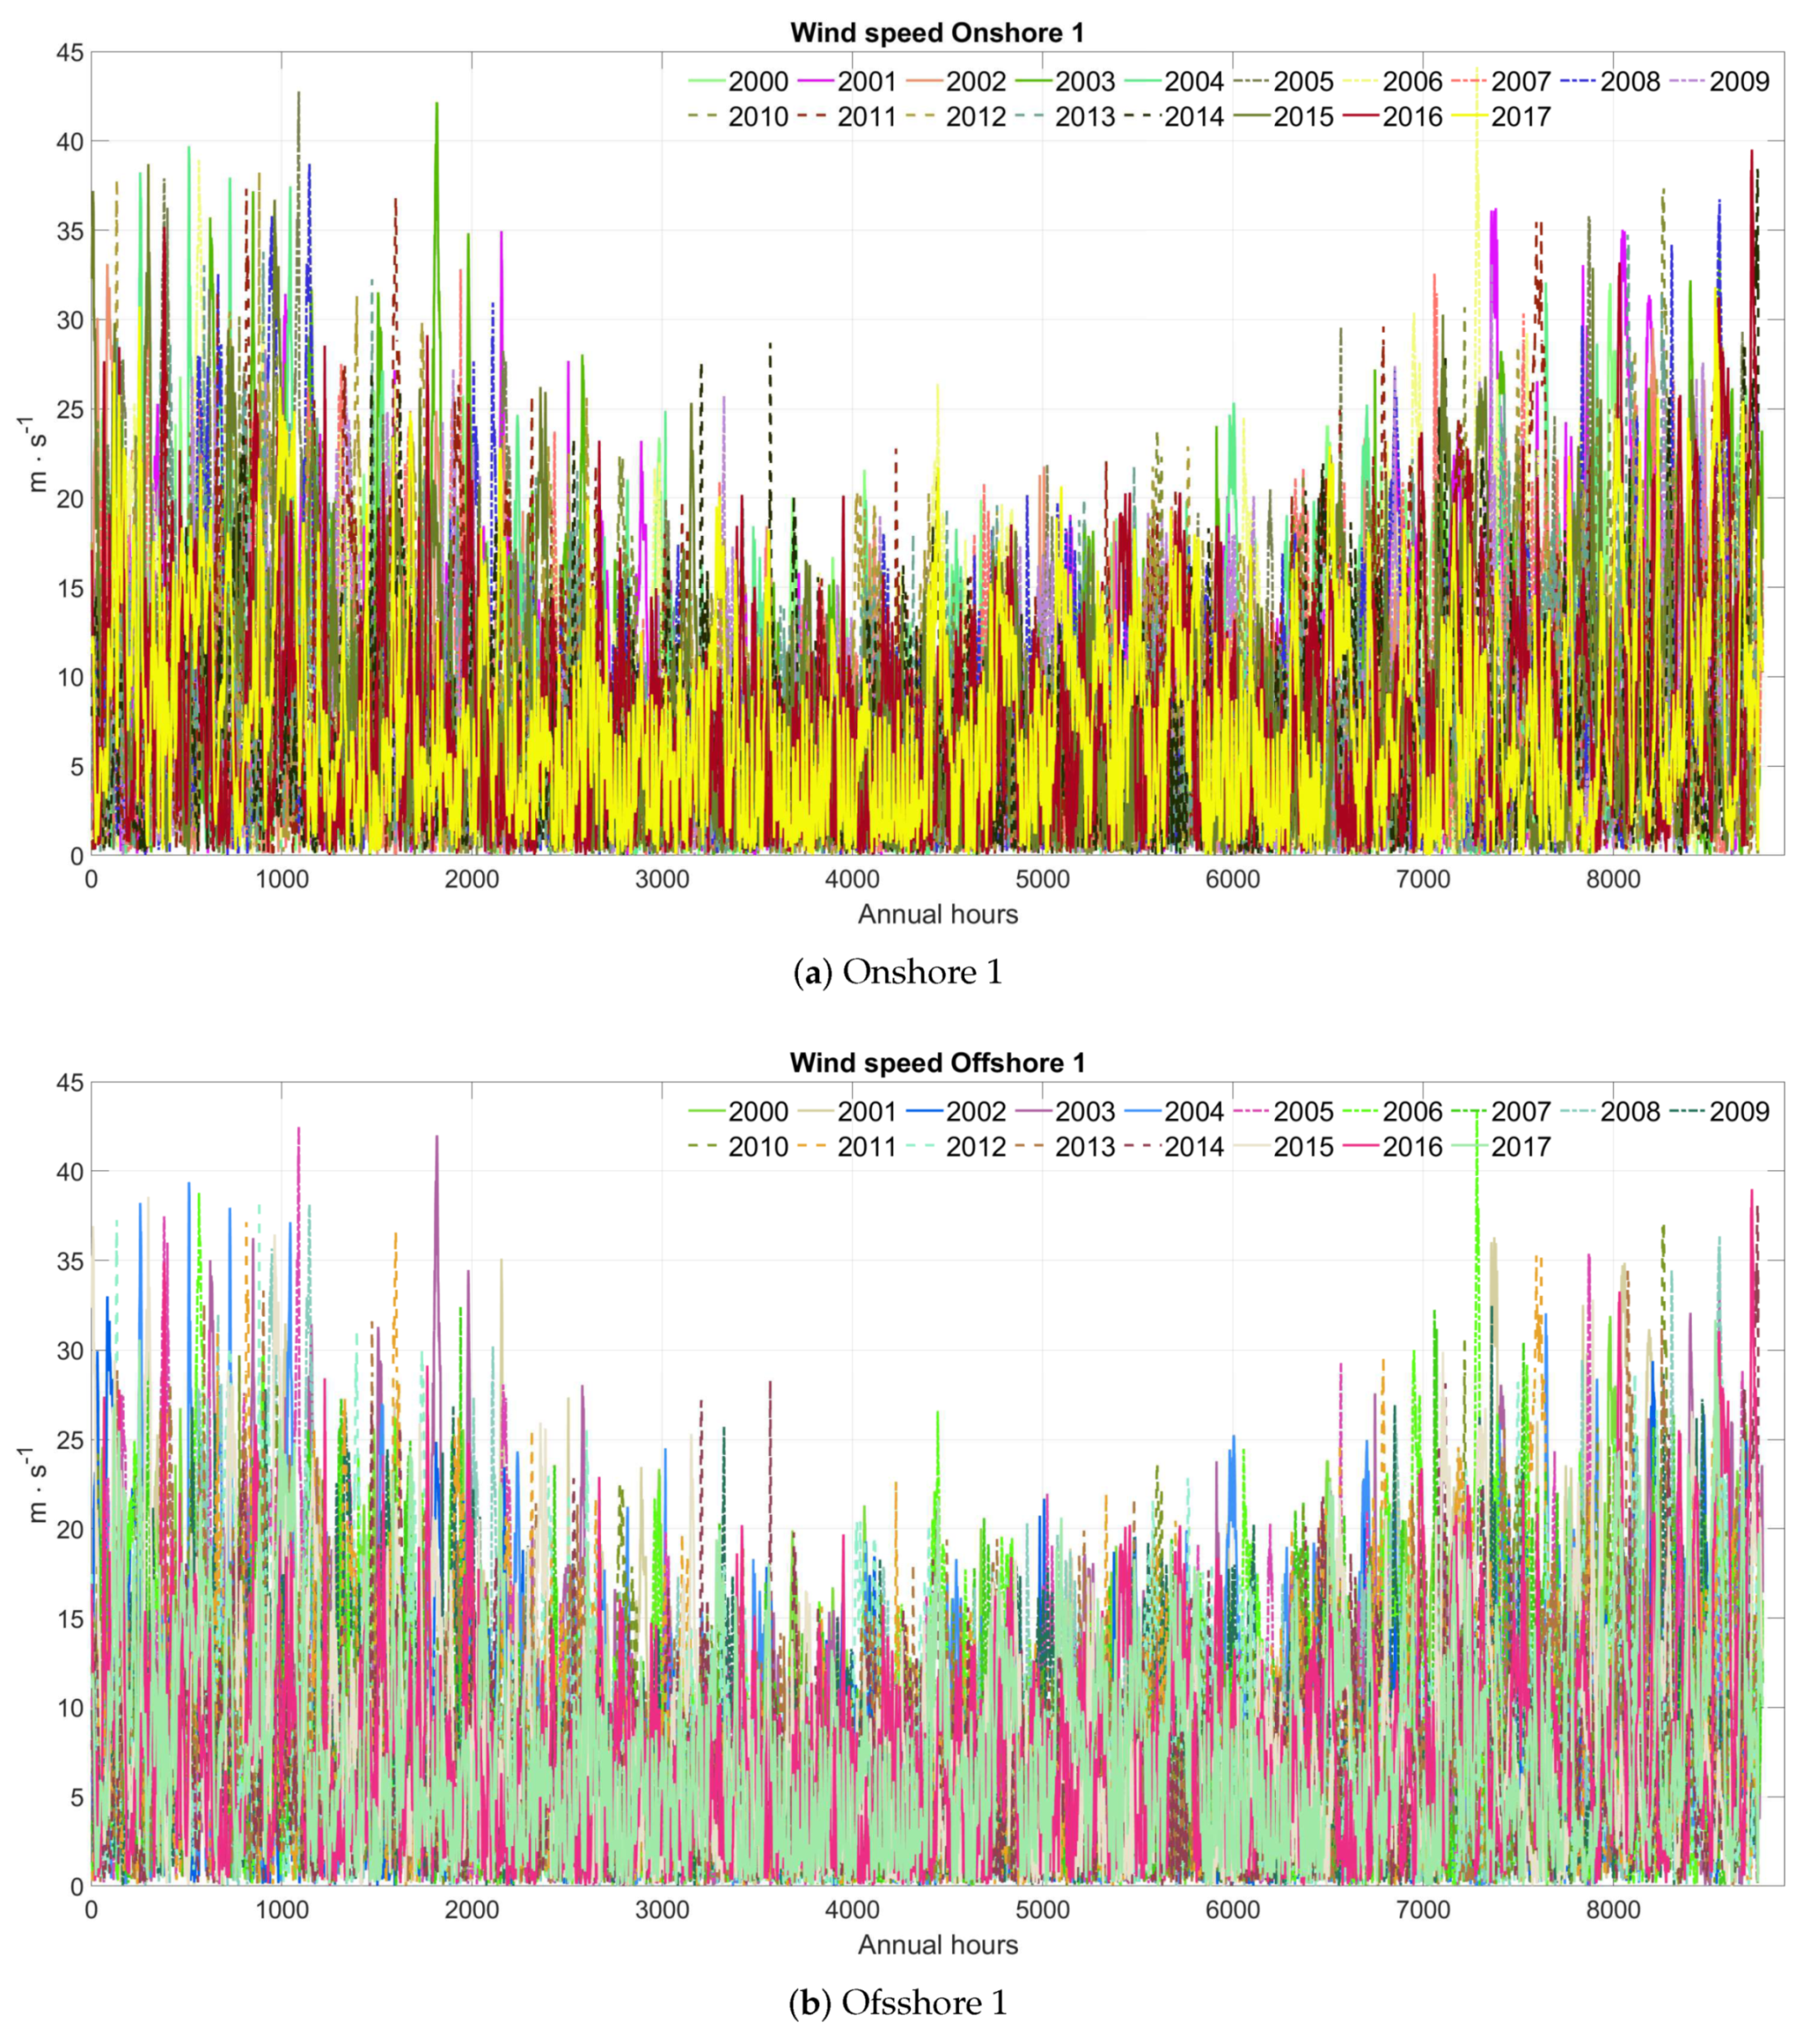
Annual hourly wind resources are presented in Figure 12. It is clear that the highest wind speeds were expected between mid-October and March. At Onshore 1 the most severe wind speed was 44.13 m·, followed by 2003 with 42.16 m·. In terms of the highest mean, 2011 had 8.37 m·. Offshore 1 and 2 showed similar occurrences in best mean and harshest wind speeds, with the highest mean wind speed in 2011 at 8.28 m· and 8.01 m· for Offshore 1 and 2, respectively. The harshest wind events occurred for both locations in 2006 with ≈42.5 m·.
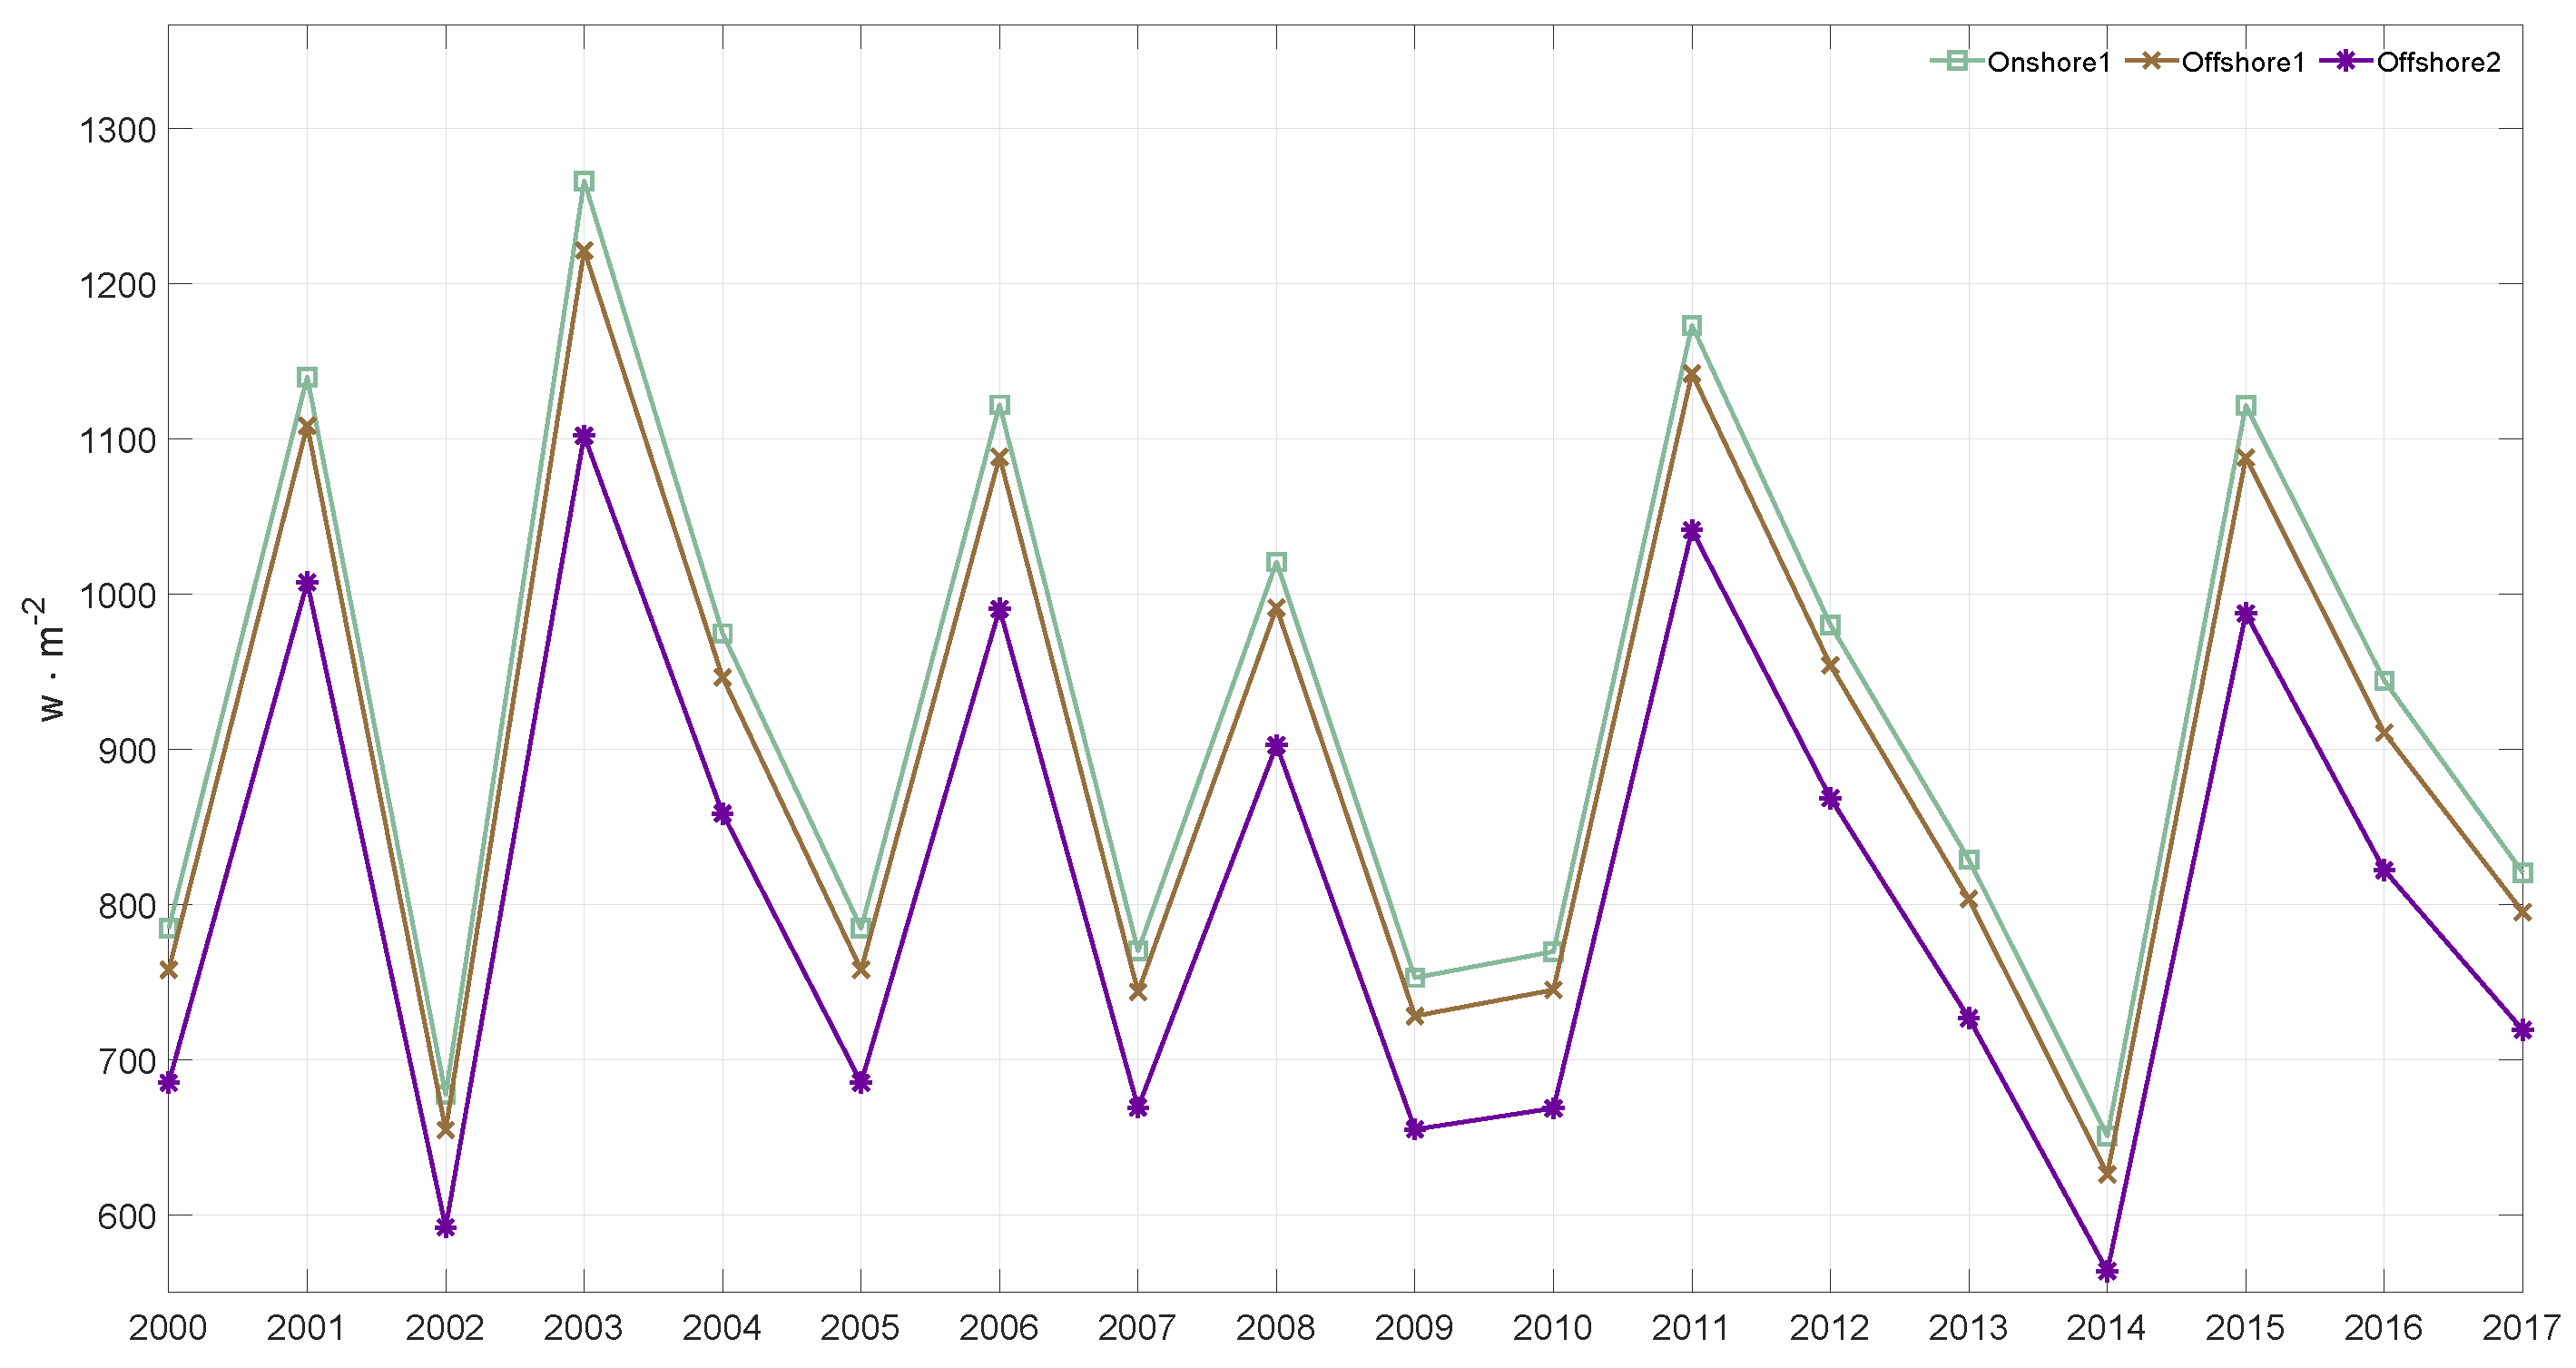
Unlike the more stable solar resource, as expected, there was a larger variation in mean energy density and RC , see Figure 13. The variability of wind energy was higher, with annual differences W·. However, closer analysis of the trends revealed that, throughout all locations, the energy density had reduced: Onshore 1 had a RC −3.3 W·/year, Offshore 1 was −3.2 W·/year and Offshore 2 was −2.9 W·/year.
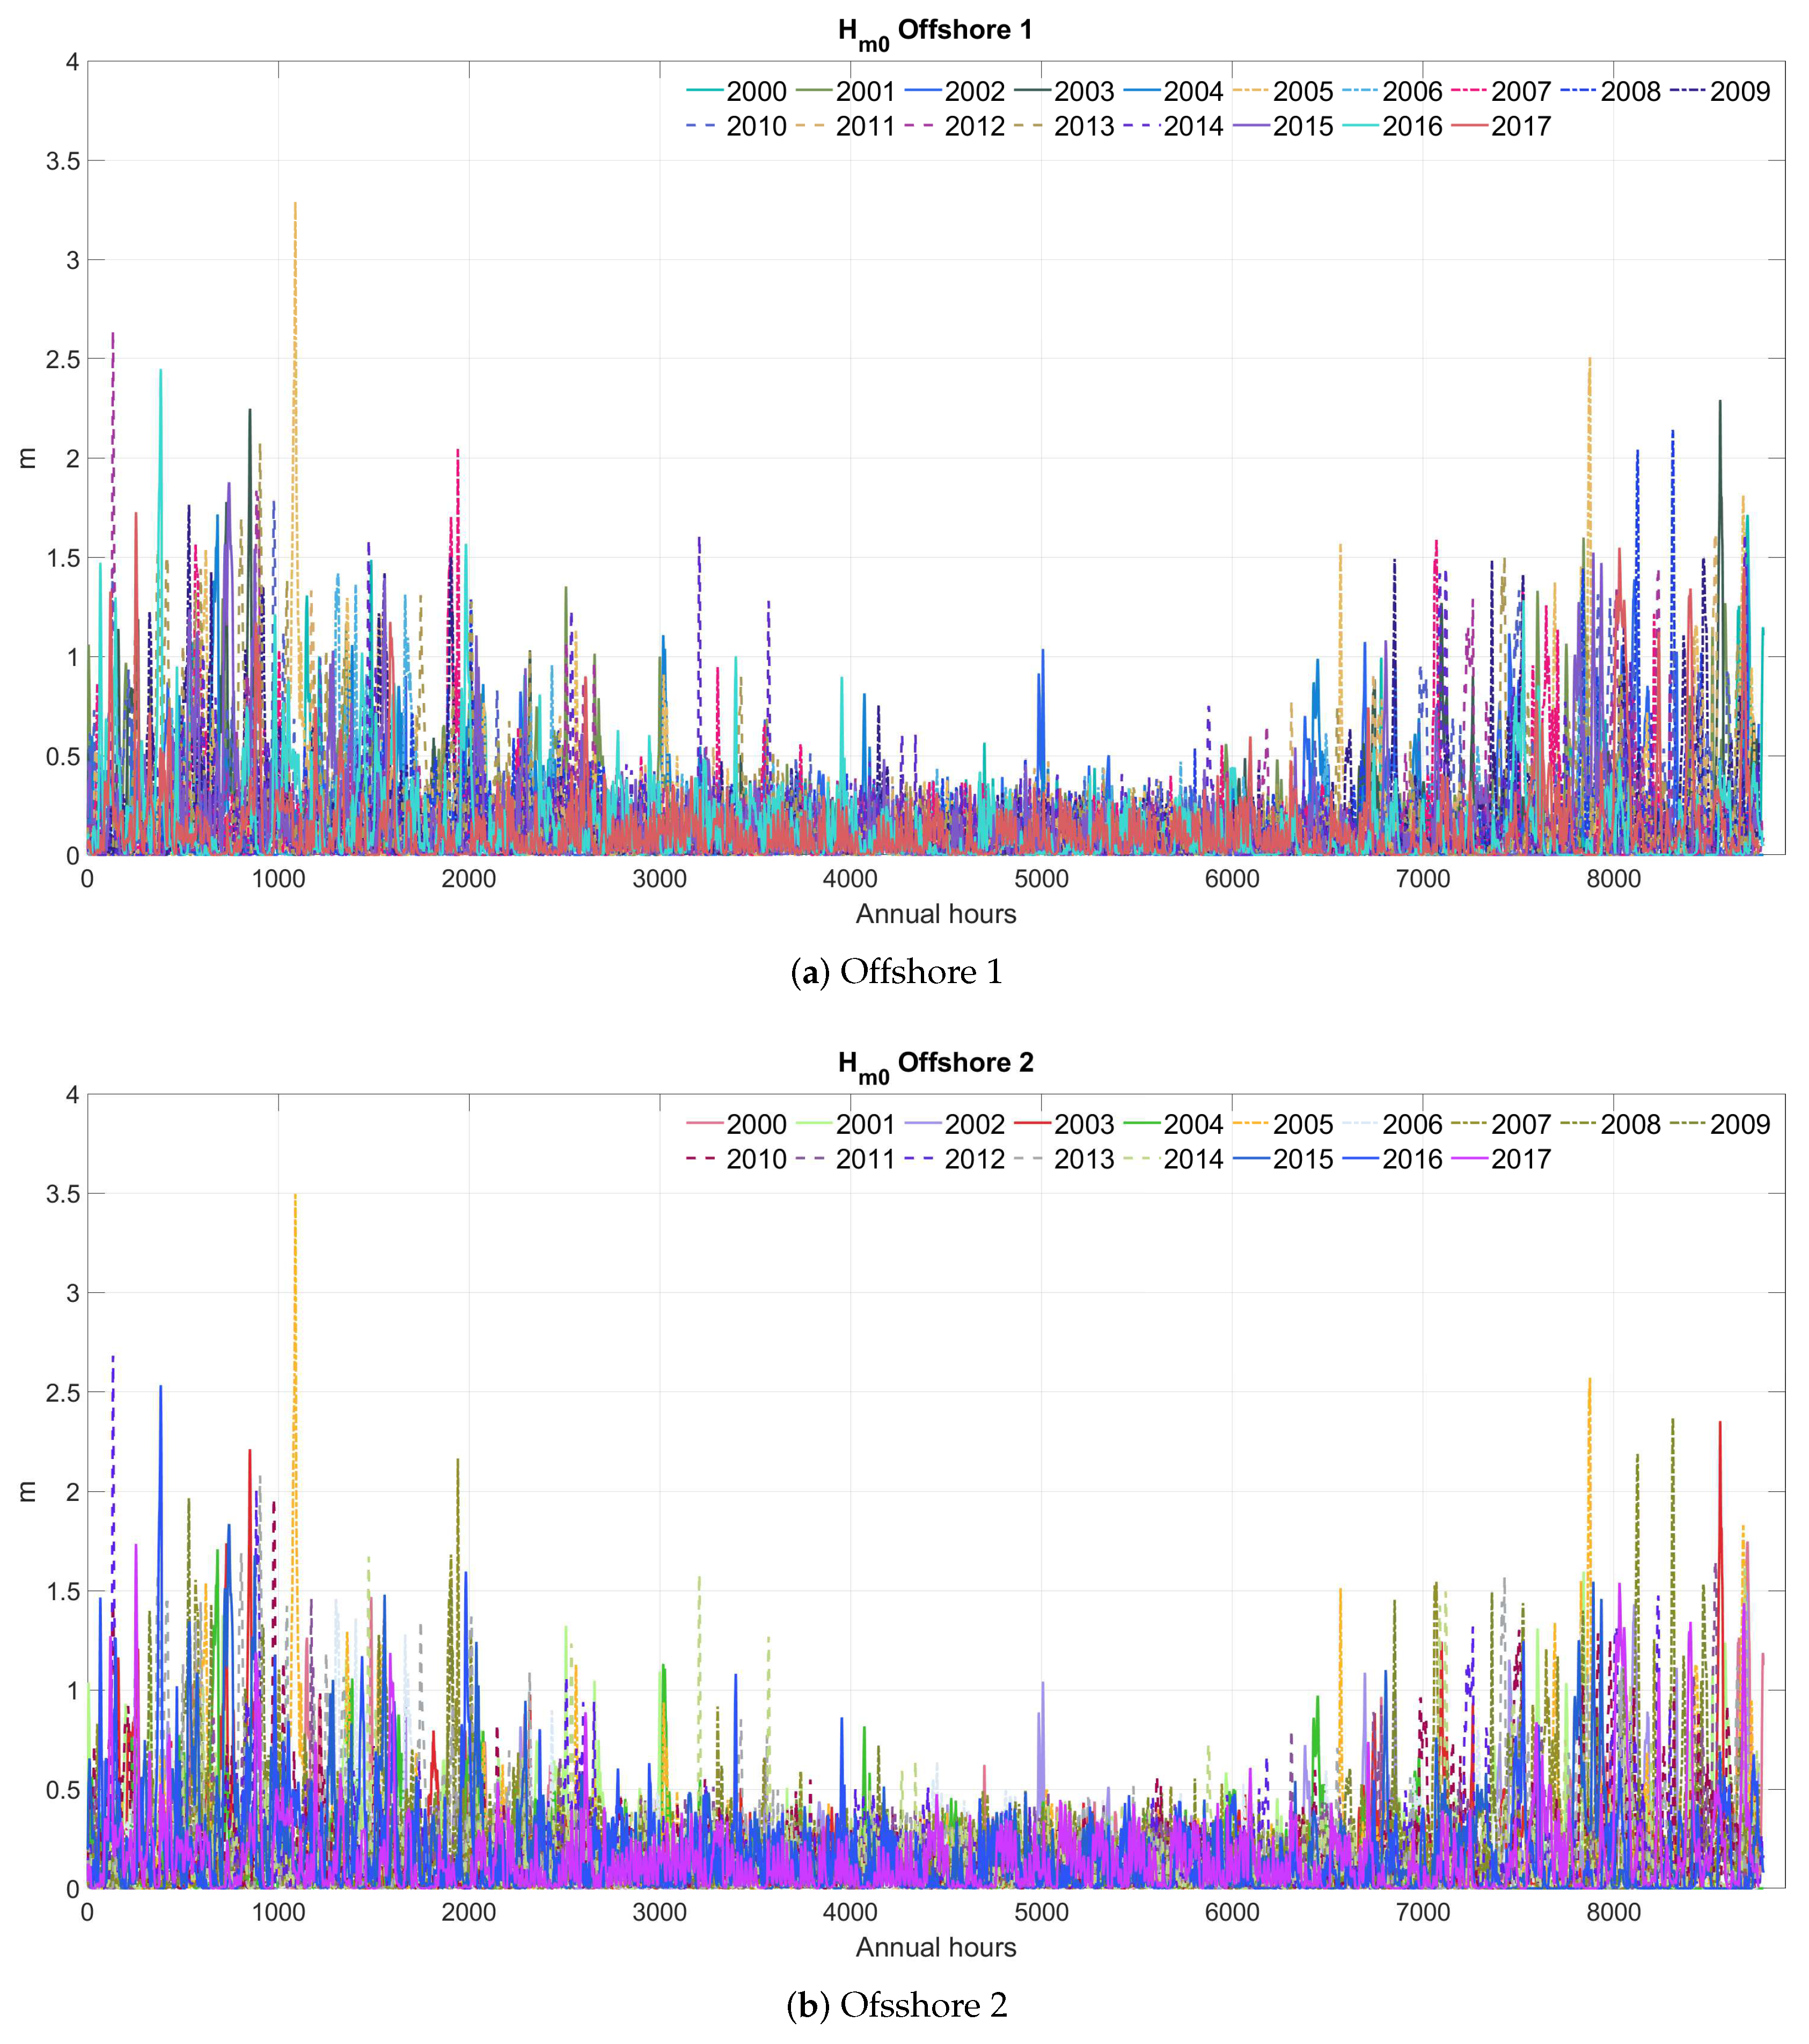
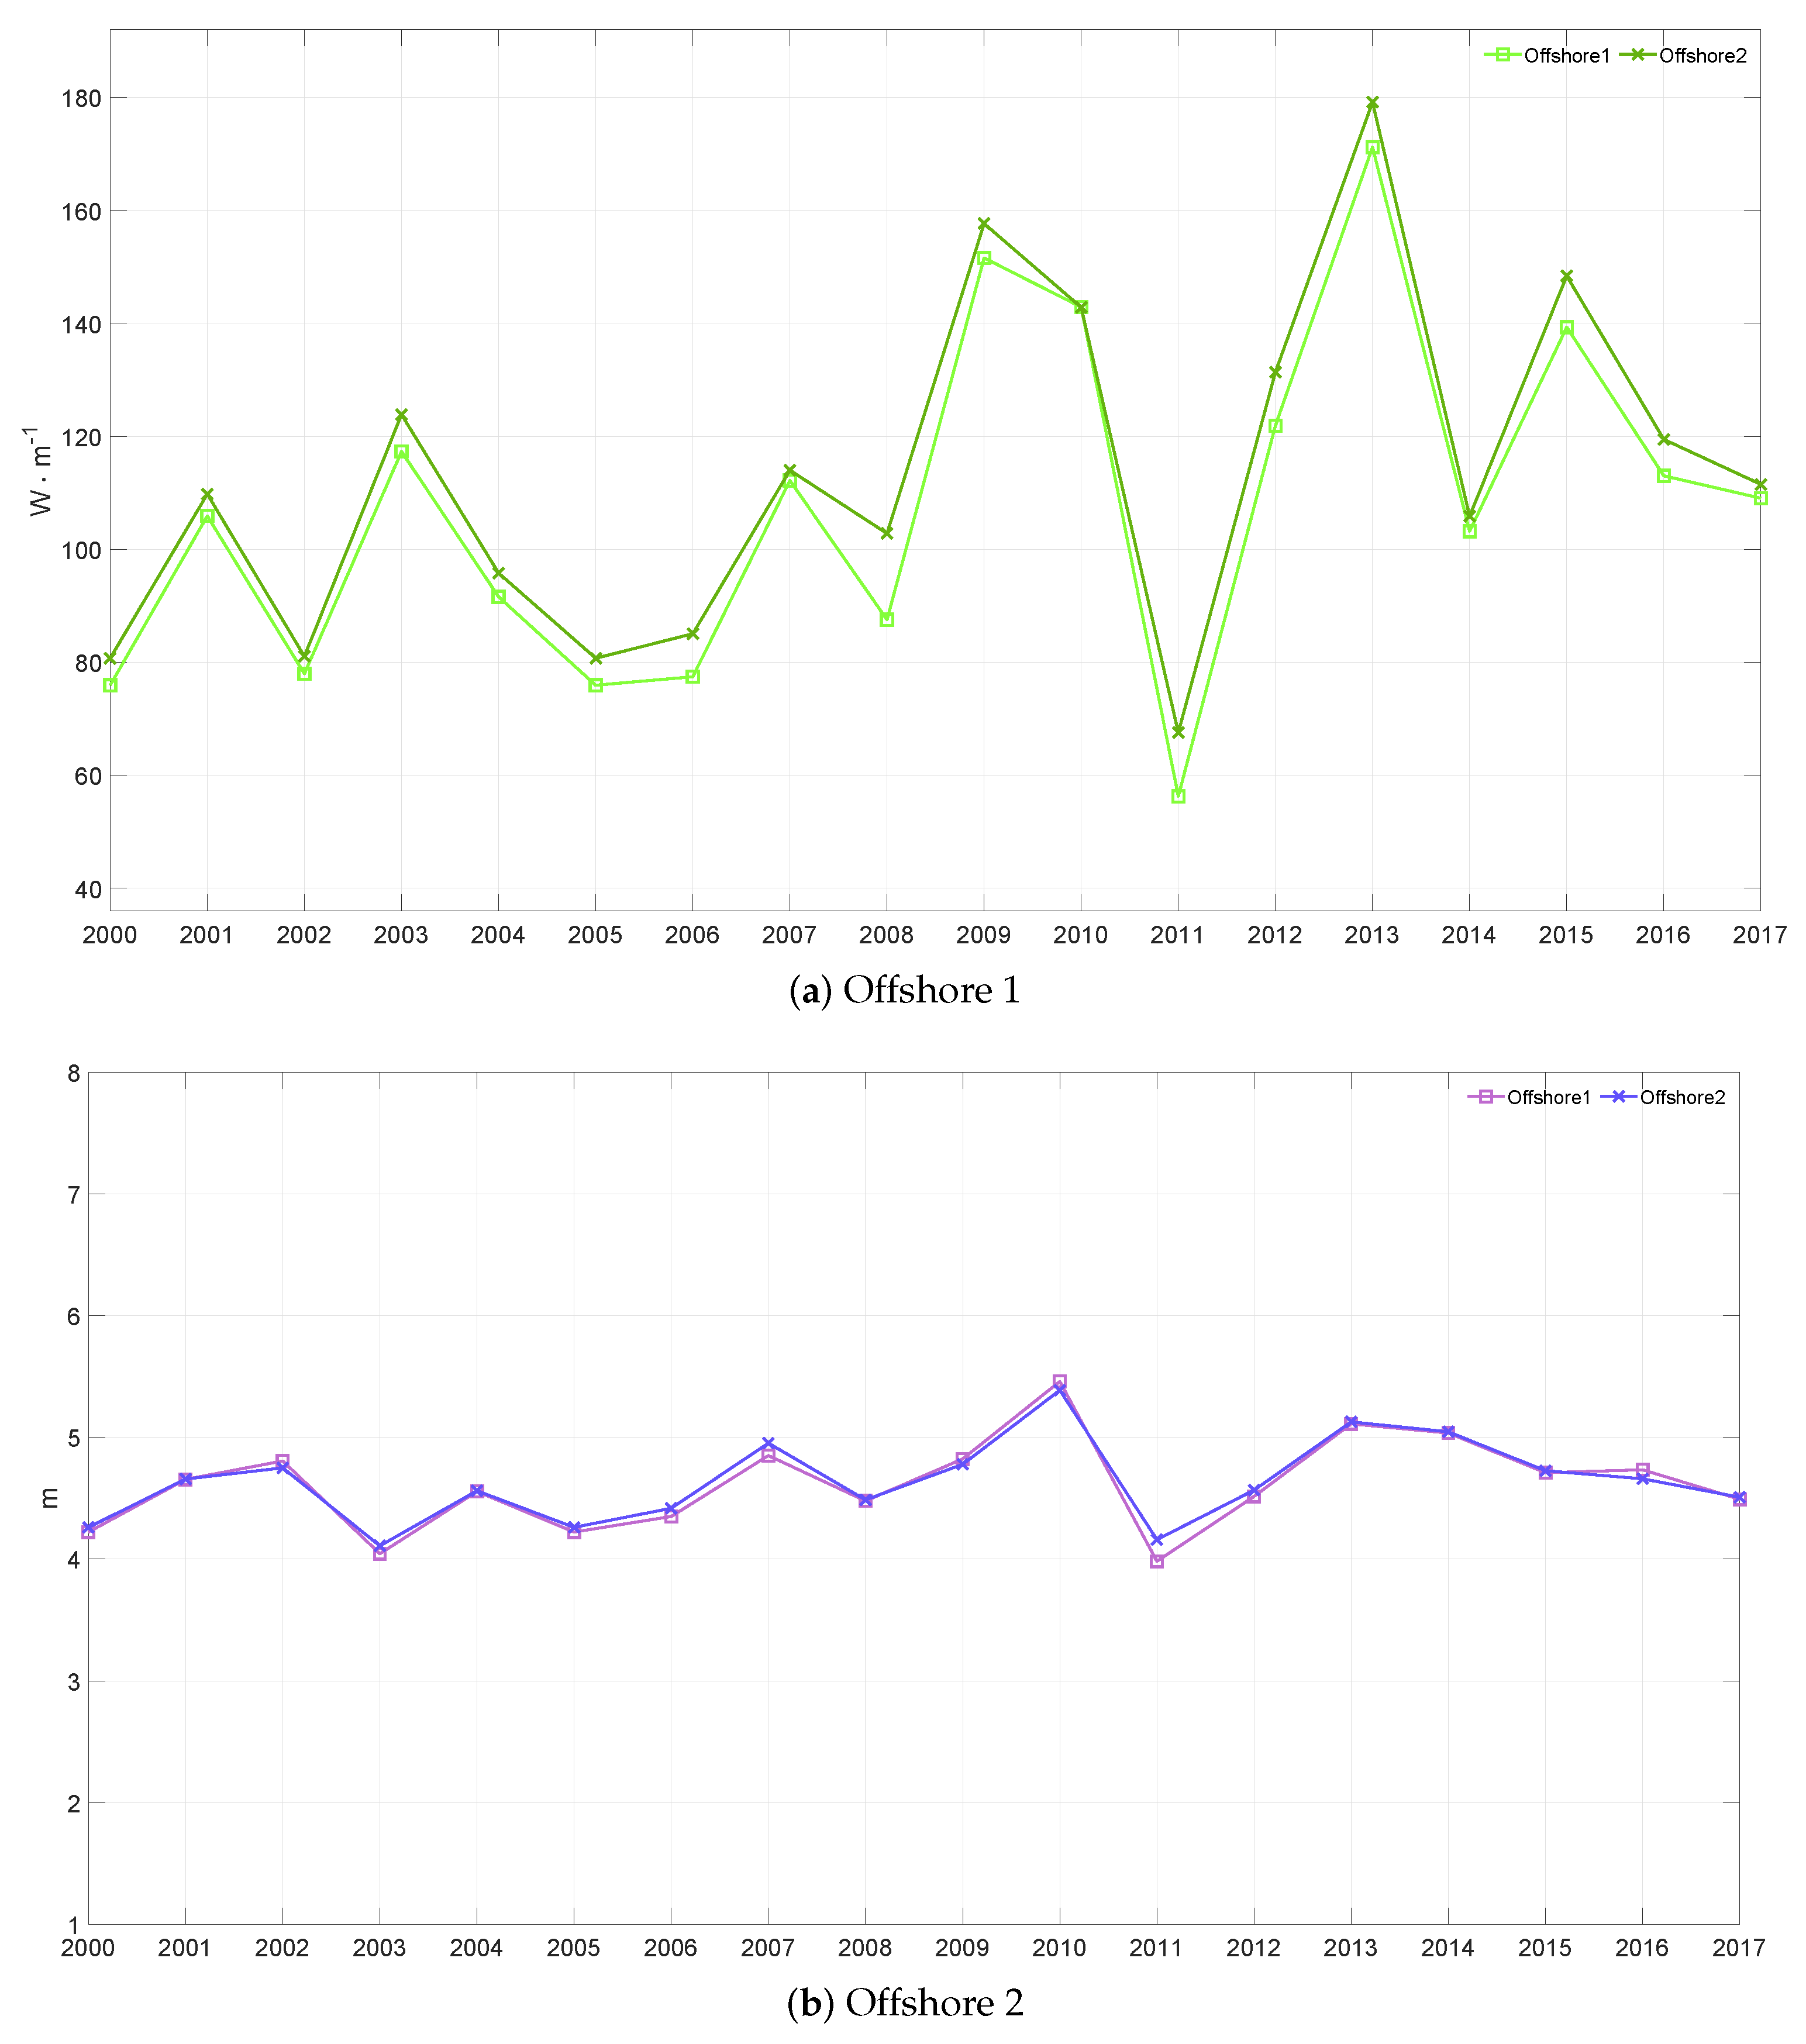
The region is dominated by wind-generated waves, and it is characterised by relatively short fetches. This means that most of the wave resource will be limited and highly connected to the seasonal variations of wind. In fact, most wave energetic months were indeed similar to wind, with the highest waves being 3.2 m (Offshore 1) and 3.4 m (Offshore 2), see Figure 14. The experienced relatively large variations within a four-year cycle, with overall mean expected wave energy density at Offshore 1 ≈107.23 W·. Offshore 2, which is located in deeper water, in contract to Offshore 1 had the highest available resource between the two, with ≈113.20 W·, and was consistently highest in wave energy density by ≈6 W·, see Figure 15. In terms of wavelength (i.e., the difference between wave crests), most years showed similar values, with the largest variation between 2010 and 2011 where the mean had an annual difference of 0.6 m (see panel (b) Figure 15). Finally, for the wave resource for both locations, indicated a positive RC with ≈2.5 W·/year.
4. Discussion
Moving into a new era, with more renewable power generation, will require utilisation of all indigenous resources [36]. However, it should not be overlooked that developing a large energy infrastructure may also find significant opposition, with possible occurrence of the NIMBY phenomenon [37]. A combination of onshore and offshore resources can lead to solutions that will be able to provide increased energy contributions, whilst keeping possible negative impacts to a minimum. With offshore resources having larger energy densities, it is vital that a proper assessment is provided for all resources.
While this study focuses on a relatively dense industrial region in Greece, surrounding the Port of Piraeus in the Gulf of Saronikos, our methodology is globally applicable. It is important that prior to any suggestion, with regard to the most suitable combination of renewable converters, the resources have to be assessed with accurate spatio-temporal conditions. In terms of time coverage and adhering to international practises, ≥10 years of data are necessary to develop a comprehensive resource potential [31,32]. Although the mean resource potential for any quantity offers significant information, this is not enough for proper renewable assessment. Resource variability also has to be assessed. CoV is a metric that reveals the most persistent locations and quantifies expected operational discrepancies.
In addition, when long-term renewable installations are investigated, the expected changes in the resources must also be quantified. “Positive” changes, though on surface can be considered good, may have negative effects on expected power production, since the potential can drive the converters (i.e., wind, wave) to survival mode. In addition, “positive” changes in temperatures may also have negative effects on photovoltaic production, as with higher operating temperatures the power production is expected to decrease. These conclusions are only possible when suitable climate sources are taken into account. Databases providing means only, or without long durations, can be useful for initial screenings, but their applicability is limited for power estimates. To identify trends and expected contributions, suitable conditions must be sourced and analysed, as in the case of ERA5 and the custom SWAN wave database.
Our focus area has three types of resources in abundance: solar, wind and waves; however, offshore wind and waves have not been properly considered so far [38]. Moving power production offshore offers significant benefits for reducing visual impacts, and it maximises the available space that can be used for development of commercial activities. From our analysis is it clear that a mismatch exists in resource availability. Solar energy is mostly available, with higher values in the summer months, whilst in the winter its energy density is reduced by at least 50% and has fewer hours of operation. On the other hand, winter months are the most energetic for wind and wave resources. In fact, the offshore wind resource has slightly better availability when compared to the onshore potential, also indicating lower changes over the long-term. As shown in Friedrich and Lavidas [39], dependence on only two types of renewable energy is more expensive when compared to multi-generation, which can achieve reductions ≥ in electricity costs and allow more demand-side management responses. Considering the abundance of local metocean conditions, one can take advantage of the temporal mismatch between wind and waves to further improve power production, especially in winter months.
Among the three resources, arguably the most difficult to harness and decide upon is the wave resource. While it can provide significant temporal and power production benefits, the assignment of a converter has to carefully account for the dominant wave conditions. In this region, wind-generated waves comprise the majority of resources, with swells coming from the southeast. This analysis underlines a need for selecting a low-operative wave energy converter with reduced weight. Additionally, it offers another significant insight—the absence of harsh conditions—meaning that survivability of the wave energy device is not expected to be compromised, and it will be available for more energetic conditions with higher resources. In fact, this can prove beneficial in reducing the total cost of the device, as extreme conditions are expected well within the means of standard off-the-shelf equipment.
5. Conclusions
This study assesses the opportunities for renewable energy generation based on the detailed and long-term examination of resources around the wider region of the Saronikos Gulf. Solar, wind and wave data from 2000 to 2017 have been analysed to confidently identify resource energy density, climate characteristics and expected changes. The solar and wind data were obtained by the ERA5 dataset and have been accordingly downscaled. The wave dataset was based on a calibrated and validated high-resolution nearshore wave model specifically developed for the area, with appropriate source terms employed to resolve shallow water, non-linear interactions. Subsequently, onshore and offshore locations were extracted by the dataset for further examination, with primary focus on opportunities surrounding the commercial zone of Piraeus Port.
The first analysed resource is the incident solar radiation and the ambient temperature, a factor well known to influence photovoltaic performance. The region can be characterised as a high energy density area, with mean value across the domain ≥250 Wh·. Focusing on the Port of Piraeus, as expected, the highest solar resource levels are expected in the spring/summer, with values ≥800 Wh· and ambient temperature of 19.6 °C; however, during winter and autumn seasons, the availability of solar resources drops significantly, almost by 50% in its energy density. Additionally, the annual mean and max values as well as the expected rate of change for the parameters were determined. Based on our dataset, the solar resource had a low intra-annual variability, with changes between ±1 and 1.2 Wh· and ±0.4 °C. Expected future trends indicate a negligible change in solar energy, but also an increase in ambient temperatures should be expected, affecting photovoltaic operating temperatures.
In terms of wind resource, the regions can be classified as moderate to low, with a mean energy density consistently ≥50 W· at and ≥60 W· at . The natural mountain obstacles and densely populated areas from the east pose as obstacles and reduce magnitudes from eastern and north-easterly winds. This results in high variations as winds propagate to the western part of the domain. At the Port of Piraeus, due to the proximity, onshore and offshore locations shared similar conditions, with offshore being slightly higher. Most energetic periods throughout the years were autumn and winter seasons, with at 42.16 m·, while throughout summer months the resource was ≤17 m·. Wind energy intra-annual variability was very high, with differences ±650 W·, whilst long-term expected changes indicated negative trends at 3.3 W·/year for the onshore region, and slightly less for offshore locations.
With regards to the wave resource of the region, it can be considered as a low level, with nearshore sections having energy content ≈300 W·. The regions close to the Port of Piraeus were dominated by wind-generated waves. Most energetic conditions occurred from October to March, and energy was ≈5000 . The spectral characteristics (i.e., , and peak direction) indicate waves originating from an eastern direction with high frequencies ≤7 s and ≤ 3 m. The conditions suggest that low-weight wave energy converters operating at high frequencies will be more suitable. In terms of expected changes in the region, a positive trend is identified with a potential increase of 2.5 W·/year.
This resource assessment has quantified all three available renewables in the wider domain of the Saronikos Gulf. For the first time, a dedicated wave energy assessment was also presented for the area, with detailed estimation of intra-annual and expected changes in resources. From a climate analysis it is clear that there is a mismatch among high energy potential time periods between solar, wind and wave. Most energy production is expected in the summer, while throughout winter the potential is reduced by half. On the contrary, wind energy seems more energetic during winter months, with offshore regions offering good energy content. Wave energy has a similar general seasonal trend with wind, and the highest energy potential occurs from October to March. This seasonal and hourly mismatch is beneficial as it ensures that all seasons can have increased power production, hence reducing intermittency.
Author Contributions
Conceptualization, G.L. and J.K.K.; methodology, G.L. and J.K.K.; software, G.L.; formal analysis, G.L. and J.K.K.; investigation, G.L. and J.K.K.; resources, G.L. and J.K.K.; data curation, G.L.; writing–original draft preparation, G.L. and J.K.K.; writing–review and editing, G.L. and J.K.K.; visualization, G.L. All authors have read and agreed to the published version of the manuscript.
Funding
This research received no external funding.
Acknowledgments
The authors would like to thank the editorial team of this Special Issue for considering this submission. The authors would like to thank the reviewers for their comments that helped improve the manuscript.
Conflicts of Interest
The authors declare no conflict of interest.
Abbreviations
| Nomenclature | |
| Roughness coefficient | |
| Mean wind energy density | |
| Mean wave energy density | |
| mean value of a variable | |
| Air density | |
| standard deviation | |
| Direction | |
| Group wave velocity | |
| f | Frequency |
| h | Height, vertical level of the atmosphere |
| Significant wave height | |
| Peak wave period | |
| U | Wind profile |
| Wavelength | |
| maxima value of a variable | |
| N | timesteps |
| Units | |
| J | Joule |
| Square meter | |
| W | watt |
| Wh | watt hours |
| kW | Killowatt |
| °C | Celsius |
| m | Meter |
| km | Kilometer |
| s | seconds |
| Abbreviations | |
| ECMWF | European Centre for Medium-Range Weather Forecasts |
| SWAN | Simulating WAves Nearshore |
| CoV | Coefficient of Variation |
| TI | Turbulence Intensity |
| TMY | Typical Meteorological Year |
| SET-Plan | Strategic Energy Technology Plan |
| RC | Rate of Change |
| NIMBY | Not In My Back Yard |
| EC | European Commission |
| GHI | Global Horizontal Irradiance |
| WRF | Weather Research and Forecasting |
| IMO | International Maritime Organization |
| IFS | Integrated Forecasting System |
References
- European Commission. A Clean Planet for All a European Strategic Long-Term Vision for a Prosperous, Modern, Competitive and Climate Neutral Economy; European Commission: Brussels, Belgium, 2018. [Google Scholar]
- JRC. The Strategic Energy Technology (SET) Plan; European Commission: Brussels, Belgium, 2017; p. 88. [Google Scholar] [CrossRef]
- European Commission. The European Green Deal, Communication from the Commission to the European Parliament, the European Council, the Council, the European Economic and Social Committee and the Committee of the Regions; European Commission: Brussels, Belgium, 2019. [Google Scholar]
- Makris, C.; Galiatsatou, P.; Tolika, K.; Anagnostopoulou, C.; Kombiadou, K.; Prinos, P.; Velikou, K.; Kapelonis, Z.; Tragou, E.; Androulidakis, Y.; et al. Climate change effects on the marine characteristics of the Aegean and Ionian Seas. Ocean. Dyn. 2016, 66, 1603–1635. [Google Scholar] [CrossRef]
- Piraeus Port Authority S.A—Services. Available online: http://www.olp.gr/en/services/exip-ploiwn (accessed on 4 August 2020).
- European Commission. National Energy and Climate Plans (NECPs); European Commission: Brussels, Belgium, 2020. [Google Scholar]
- Iris, Ç.; Lam, J.S.L. A review of energy efficiency in ports: Operational strategies, technologies and energy management systems. Renew. Sustain. Energy Rev. 2019, 112, 170–182. [Google Scholar] [CrossRef]
- Notteboom, T.; van der Lugt, L.; van Saase, N.; Sel, S.; Neyens, K. The role of seaports in green supply chain management: Initiatives, attitudes, and perspectives in rotterdam, antwerp, north sea port, and zeebrugge. Sustainability 2020, 12, 1688. [Google Scholar] [CrossRef] [Green Version]
- Winkel, R.; Weddige, U.; Johnsen, D.; Hoen, V.; Papaefthimiou, G. Potential for Shore Side Electricity in Europe; Technical Report; ECOFYS: Utrecht, The Netherlands, 2015. [Google Scholar] [CrossRef]
- Samadi, S.; Lechtenböhmer, S.; Schneider, C.; Arnold, K.; Fischedick, M.; Schüwer, D.; Pastowski, A. Decarbonization Pathways for the Industrial Cluster of the Port of Rotterdam; Technical Report September; Wuppertal Institute for Climate, Environment and Energy: Wuppertal, Germany, 2016. [Google Scholar] [CrossRef]
- Bjerkan, K.Y.; Seter, H. Reviewing tools and technologies for sustainable ports: Does research enable decision making in ports? Transp. Res. Part Transp. Environ. 2019, 72, 243–260. [Google Scholar] [CrossRef]
- Moon, D.S.H.; Woo, J.K. The impact of port operations on efficient ship operation from both economic and environmental perspectives. Marit. Policy Manag. 2014, 41, 444–461. [Google Scholar] [CrossRef]
- International Maritime Organization (IMO). UN Body Adopts Climate Change Strategy for Shipping. Available online: https://www.imo.org/en/MediaCentre/PressBriefings/Pages/06GHGinitialstrategy.aspx (accessed on 4 August 2020).
- Sdoukopoulos, E.; Boile, M.; Tromaras, A.; Anastasiadis, N. Energy efficiency in European ports: State-of-practice and insights on the way forward. Sustainability 2019, 11, 4952. [Google Scholar] [CrossRef] [Green Version]
- Lechtenböhmer, S.; Schostok, D.; Kobiela, G.; Knoop, K.; Pastowski, A.; Heck, S. Deep Decarbonisation Pathways for the Industrial Cluster of the Port of Rotterdam; Technical Report; Wuppertal Institute for Climate, Environment and Energy: Wuppertal, Germany, 2018. [Google Scholar]
- Lavidas, G.; De Leo, F.; Besio, G. Blue Growth Development in the Mediterranean Sea: Quantifying the Benefits of an Integrated Wave Energy Converter at Genoa Harbour. Energies 2020, 13, 4201. [Google Scholar] [CrossRef]
- Margheritini, L.; Vicinanza, D.; Frigaard, P. SSG wave energy converter: Design, reliability and hydraulic performance of an innovative overtopping device. Renew. Energy 2009, 34, 1371–1380. [Google Scholar] [CrossRef]
- Contestabile, P.; Di Lauro, E.; Buccino, M.; Vicinanza, D. Economic Assessment of Overtopping BReakwater for Energy Conversion (OBREC): A Case Study in Western Australia. Sustainability 2016, 9, 51. [Google Scholar] [CrossRef]
- Lavidas, G.; Venugopal, V. Energy Production Benefits by Wind and Wave Energies for the Autonomous System of Crete. Energies 2018, 11, 2741. [Google Scholar] [CrossRef] [Green Version]
- Curto, D.; Frazitta, V.; Trapnese, M. Supplying small islands with solar, wind and sea wave. An economic approach to find the best energy share. In Proceedings of the OCEANS 2019 MTS/IEEE SEATTLE, Seattle, WA, USA, 27–31 October 2019; pp. 1–7. [Google Scholar] [CrossRef]
- Cavaleri, L.; Sclavo, M. The calibration of wind and wave model data in the Mediterranean Sea. Coast. Eng. 2006, 53, 613–627. [Google Scholar] [CrossRef]
- Cavaleri, L.; Bertotti, L.; Pezzutto, P. Accuracy of altimeter data in inner and coastal seas. Ocean. Sci. 2019, 15, 227–233. [Google Scholar] [CrossRef] [Green Version]
- Kotroni, V.; Lagouvardos, K.; Lykoudis, S. High-resolution model-based wind atlas for Greece. Renew. Sustain. Energy Rev. 2014, 30, 479–489. [Google Scholar] [CrossRef]
- Soukissian, T.; Papadopoulos, A.; Skrimizeas, P.; Karathanasi, F.; Axaopoulos, P.; Avgoustoglou, E.; Kyriakidou, H.; Tsalis, C.; Voudouri, A.; Gofa, F.; et al. Assessment of offshore wind power potential in the Aegean and Ionian Seas based on high-resolution hindcast model results. AIMS Energy 2017, 5, 268–289. [Google Scholar] [CrossRef]
- Katopodis, T.; Markantonis, I.; Politi, N.; Vlachogiannis, D.; Sfetsos, A. High-Resolution Solar Climate Atlas for Greece under Climate Change Using the Weather Research and Forecasting (WRF) Model. Atmosphere 2020, 11, 761. [Google Scholar] [CrossRef]
- Lavidas, G.; Venugopal, V. A 35 year high-resolution wave atlas for nearshore energy production and economics at the Aegean Sea. Renew. Energy 2017, 103, 401–417. [Google Scholar] [CrossRef] [Green Version]
- Belibassakis, K.A.; Karathanasi, F.E. Modelling nearshore hydrodynamics and circulation under the impact of high waves at the coast of Varkiza in Saronic-Athens Gulf. Oceanologia 2017, 59, 350–364. [Google Scholar] [CrossRef]
- Hersbach, H.; Bell, W.; Berrisford, P.; Horányi, A.J.; M-S Nicolas, J.; Radu, R.; Schepers, D.; Simmons, A.; Soci, C.; Dee, D. Global Reanalysis: Goodbye ERA-Interim, Hello ERA5; Technical Report; European Centre for Medium-Range Weather Forecasts, Shinfield Park: Reading, UK, 2019. [Google Scholar]
- Lavidas, G.; Venugopal, V. Application of numerical wave models at European coastlines: A review. Renew. Sustain. Energy Rev. 2018, 92, 489–500. [Google Scholar] [CrossRef] [Green Version]
- Lavidas, G.; Venugopal, V.; Agarwal, A. Long-Term Evaluation of the Wave Climate and Energy Potential in the Mediterranean Sea. In Proceedings of the 4th IAHR Europe Congress, Liege, Belgium, 27–29 July 2016; Erpicum, S., Dewals, B., Archambeau, P., Pirotton, M., Eds.; Sustainable Hydraulics in the Era of Global Change, Advances in Water Engineering and Research. CRC Taylor and Francis, LLC.: Liege, Belgium, 2016; pp. 247–253. [Google Scholar]
- World Bank. Best Practice Guidelines for Mesoscale Wind Mapping Projects for the World Bank; Technical Report; World Bank: Washington, DC, USA, 2010. [Google Scholar]
- Ingram, D.; Smith, G.H.; Ferriera, C.; Smith, H. Protocols for the Equitable Assessment of Marine Energy Converters; Technical Report; Institute of Energy Systems, University of Edinburgh, School of Engineering: Edinburgh, UK, 2011. [Google Scholar]
- Manwell, J.; McGowan, J.; Rogers, A. Wind Energy Explained: Theory, Design and Application, 2nd ed.; John Wiley & Sons Ltd.: Hoboken, NJ, USA, 2009. [Google Scholar]
- Magkouris, A.; Bonovas, M.; Belibassakis, K. Hydrodynamic Analysis of Surge-Type Wave Energy Devices in Variable Bathymetry by Means of BEM. Fluids 2020, 5, 99. [Google Scholar] [CrossRef]
- Belibassakis, K.; Magkouris, A.; Rusu, E. A BEM for the Hydrodynamic Analysis of Oscillating Water Column Systems in Variable Bathymetry. Energies 2020, 13, 3403. [Google Scholar] [CrossRef]
- Jacobson, M.Z.; Delucchi, M.A.; Bauer, Z.A.; Goodman, S.C.; Chapman, W.E.; Cameron, M.A.; Bozonnat, C.; Chobadi, L.; Clonts, H.A.; Enevoldsen, P.; et al. 100% Clean and Renewable Wind, Water, and Sunlight All-Sector Energy Roadmaps for 139 Countries of the World. Joule 2017, 1–14. [Google Scholar] [CrossRef] [Green Version]
- Kaldellis, J.; Kapsali, M.; Kaldelli, E.; Katsanou, E. Comparing recent views of public attitude on wind energy, photovoltaic and small hydro applications. Renew. Energy 2013, 52, 197–208. [Google Scholar] [CrossRef]
- Kaldellis, J.; Kapsali, M. Shifting towards offshore wind energy-Recent activity and future development. Energy Policy 2012, 53, 136–148. [Google Scholar] [CrossRef]
- Friedrich, D.; Lavidas, G. Evaluation of the effect of flexible demand and wave energy converters on the design of Hybrid Energy Systems. Renew. Power Gener. 2017, 12. [Google Scholar] [CrossRef] [Green Version]
Figure 1.
Domain in which the resource assessment was conducted. The red box indicates the region of interest where locations were extracted for further analysis (image obtained by Google Earth).
Figure 1.
Domain in which the resource assessment was conducted. The red box indicates the region of interest where locations were extracted for further analysis (image obtained by Google Earth).

Figure 2.
Solar energy resource potential in Wh/ over the Saronikos Gulf region from 2000 to 2017.

Figure 3.
Ambient maximum temperature in °C for the Saronikos Gulf region from 2000 to 2017.

Figure 4.
Coefficient of variation (CoV) for the solar parameters.

Figure 5.
Wind energy resource potential in W/ over the Saronikos Gulf region from 2000 to 2017, at different vertical levels.
Figure 5.
Wind energy resource potential in W/ over the Saronikos Gulf region from 2000 to 2017, at different vertical levels.

Figure 6.
Wind turbulence intensity at different vertical levels in the Saronikos Gulf region from 2000 to 2017.
Figure 6.
Wind turbulence intensity at different vertical levels in the Saronikos Gulf region from 2000 to 2017.

Figure 7.
Wave energy resource potential in kW/m over the Saronikos Gulf region from 2000 to 2017.

Figure 8.
CoV for and in the Saronikos Gulf region from 2000 to 2017.

Figure 9.
Points of interest for which data have been extracted by the dataset. The locations include both onshore and offshore points to accommodate any possible resource combination.
Figure 9.
Points of interest for which data have been extracted by the dataset. The locations include both onshore and offshore points to accommodate any possible resource combination.

Figure 10.
Solar resource parameters for all years at Onshore 1.

Figure 11.
Annual evolution of solar parameters at Onshore 1.

Figure 12.
Recording of in m· for all years, for the locations Onshore 1 and Offshore 1.

Figure 13.
Annual evolution of for all locations.

Figure 14.
Hourly profile (m) for all years at the nearshore locations.

Figure 15.
Annual evolution for and Wlen for the offshore locations.

Publisher’s Note: MDPI stays neutral with regard to jurisdictional claims in published maps and institutional affiliations. |
© 2020 by the authors. Licensee MDPI, Basel, Switzerland. This article is an open access article distributed under the terms and conditions of the Creative Commons Attribution (CC BY) license (http://creativecommons.org/licenses/by/4.0/).
Share and Cite
MDPI and ACS Style
Lavidas, G.; K. Kaldellis, J. Assessing Renewable Resources at the Saronikos Gulf for the Development of Multi-Generation Renewable Systems. Sustainability 2020, 12, 9169. https://0-doi-org.brum.beds.ac.uk/10.3390/su12219169
AMA Style
Lavidas G, K. Kaldellis J. Assessing Renewable Resources at the Saronikos Gulf for the Development of Multi-Generation Renewable Systems. Sustainability. 2020; 12(21):9169. https://0-doi-org.brum.beds.ac.uk/10.3390/su12219169
Chicago/Turabian StyleLavidas, George, and John K. Kaldellis. 2020. "Assessing Renewable Resources at the Saronikos Gulf for the Development of Multi-Generation Renewable Systems" Sustainability 12, no. 21: 9169. https://0-doi-org.brum.beds.ac.uk/10.3390/su12219169
Note that from the first issue of 2016, this journal uses article numbers instead of page numbers. See further details here.