Article

Efficient Gear Ratio Selection of a Single-Speed Drivetrain for Improved Electric Vehicle Energy Consumption

by
Polychronis Spanoudakis
*,
Gerasimos Moschopoulos
,
Theodoros Stefanoulis
,
Nikolaos Sarantinoudis
,
Eftichios Papadokokolakis
,
Ioannis Ioannou
,
Savvas Piperidis
,
Lefteris Doitsidis
and
Nikolaos C. Tsourveloudis
School of Production Engineering & Management, Technical University of Crete, 73100 Chania, Greece
*
Author to whom correspondence should be addressed.
Sustainability 2020, 12(21), 9254; https://0-doi-org.brum.beds.ac.uk/10.3390/su12219254
Submission received: 15 September 2020 / Revised: 10 October 2020 / Accepted: 29 October 2020 / Published: 7 November 2020
(This article belongs to the Special Issue Applications, Integration and Trends of Renewable Energy Technologies)

Abstract

:
The electric vehicle (EV) market has grown over the last few years and even though electric vehicles do not currently possess a high market segment, it is projected that they will do so by 2030. Currently, the electric vehicle industry is looking to resolve the issue of vehicle range, using higher battery capacities and fast charging. Energy consumption is a key issue which heavily effects charging frequency and infrastructure and, therefore, the widespread use of EVs. Although several factors that influence energy consumption of EVs have been identified, a key technology that can make electric vehicles more energy efficient is drivetrain design and development. Based on electric motors’ high torque capabilities, single-speed transmissions are preferred on many light and urban vehicles. In the context of this paper, a prototype electric vehicle is used as a test bed to evaluate energy consumption related to different gear ratio usage on single-speed transmission. For this purpose, real-time data are recorded from experimental road tests and a dynamic model of the vehicle is created and fine-tuned using dedicated software. Dynamic simulations are performed to compare and evaluate different gear ratio set-ups, providing valuable insights into their effect on energy consumption. The correlation of experimental and simulation data is used for the validation of the dynamic model and the evaluation of the results towards the selection of the optimal gear ratio. Based on the aforementioned data, we provide useful information from numerous experimental and simulation results that can be used to evaluate gear ratio effects on electric vehicles’ energy consumption and, at the same time, help to formulate evolving concepts of smart grid and EV integration.

1. Introduction

Electric Vehicles (EVs) are currently trending in the automotive industry and there is an increased demand for this type of vehicle. In 2017, 1.3 million units were sold around the world, while in 2020 this number is estimated to have increased to around 2.9 million. This number corresponds to 1% of the total passenger vehicle sales and corresponds to 57% of the 2016 numbers [1]. Various original equipment manufacturers (OEMs) are ready to introduce more than 100 car models powered by electric motors by 2024, and the total share of electric vehicles is estimated to reach 20–25% globally by 2030. The ability of EVs to reach higher ranges and targets depends on increasing design efficiency or reducing manufacturing costs; therefore, the main target is that they can become affordable to more customer segments. However, the relatively short cruising range and the increased charging time of EVs are among the main obstacles to their development and widespread use. Thus, energy consumption is a factor of great interest throughout the automotive industry and significant research is conducted in every automotive component in order to a achieve higher range.
As found in the literature, various research articles are referred to in this topic. In [2], an EV energy consumption model was developed, capable of estimating electric and hybrid vehicle energy consumption using a braking-energy regeneration model, which estimated energy consumption based on vehicle trajectories, instantaneous speed–velocity profiles, and road grade. In [3], a study of the effects of different parameters on the performance characteristics of electric vehicles is conducted, where an EV simulation model is established and calibrated using experimental data related to vehicle energy flow and driving range analysis.
Several factors are have an effect on energy consumption. The major effects are (i) Ambient temperature—the ambient temperature greatly affects the battery performance, its power output capability, and thus its effectiveness [1]. (ii) Route type—energy consumption is inherently dependent on the driving environment (city, highway, etc.) and the road topography. For example, in a city, consumption is higher due to the frequent stops and consequent accelerations during driving. In addition, driving uphill requires more energy than driving on a flat road, and going downhill requires less energy and may increase energy regeneration [4]. Another issue covered in [5] is the development of a framework that can estimate energy the consumption of EVs by combining models that are derived by traffic flow theory and the mechanics of locomotion and Floating Cara Data (FCD) from available Information and Communications Technology (ICT) devices. This framework elucidates the possibility of integration in Intelligent Transportation System (ITS) applications. (iii) Driving style—an aggressive driving style with raw acceleration and deceleration phases reduces the autonomy of the battery, while economic driving and smooth pedal motions with constant moderate speed decreases electrical energy consumption. (iv) Traffic conditions—consumption may vary depending on traffic conditions and congestion level. (v) Vehicle accessory utilization—when using vehicle accessories, such as the air conditioner or the defroster system, a significant amount of energy that does not contribute to the propulsion of the vehicle is permanently consumed [6,7].
The aforementioned factors that alter the energy consumption depend on the environment and the driving habits of any driver. As such, they are factors that we cannot directly relate to vehicle development. In contrast, an ongoing process in the automobile industry is to establish techniques that can make electric vehicles more efficient in an effort to improve the energy consumption. Fundamentally, the techniques used include the following aspects.
Reducing vehicle resistance: Lightweight materials and advanced manufacturing technologies can reduce the weight of vehicles, which results in lowering the power demanded by the motor. Considering that a 10% weight reduction in a vehicle can lead to 6–8% lower energy consumption [8], it is obvious that this is a valuable approach for all future vehicles. On this path, the rapid development of tools resulting in lightweighting has been greatly supported by the EU in the last few years [9]. Such funded research projects demonstrate the capabilities of up to 35% weight reduction in the car Body-in-White stage [10]. Reducing aerodynamic resistance is also quite important at high speeds. As shown in [11,12], its reduction can positively affect energy consumption.
Energy management strategy: The use of power management systems in the vehicle helps to manage energy with a hybrid power train so the motor can draw energy from the appropriate energy source, depending on the conditions, and distribute energy from regenerative braking [13,14].
Properly matched transmission: The parameters of transmission, especially gear number and gear ratios, have considerable influence on operating power economy. In an effort to reduce consumption by properly matched transmission, different types of gearboxes are used, such as two-speed manual, automatic, and manual transmission or variable transmission systems, as well as an analysis of the correct way to change them [15,16,17,18,19].
Up to now, the majority of the production vehicles uses conventional Manual Transmissions (MTs) or Automatic Transmissions (ATs), Continuously Variable Transmissions (CVTs), and Infinitely variable transmissions. A study of specific characteristics related mostly to their efficiency, torque transfer, and applicability is presented in [20,21,22]. The torque characteristic is a key advantage of an electric motor, as it can transfer all the available torque (maximum torque) from the start and up to relatively low speeds [23]. This competitive advantage is used by most of the commercially available EVs, by installing powertrains directly connected to the driving wheels via a single reduction ratio [20]. Current state of the art on gearbox or alternative transmissions use on EVs is found in literature [18,19,24,25], including a vast number of simulation based comparisons using 2-speed versus single speed gearbox or CVT’s use [16,18,23,26,27,28,29,30]. In [31], different electric drivetrain configurations were discussed along with the implications of installing a multiple speed transmission in a fully electric drivetrain. In [32], a vehicle model was developed consisting of physical models of the components, considering the moments of inertia, drag torques, and efficiency maps which accounted for the variation on temperature (specifically the electric motor). Furthermore, an optimization of the gear ratios for both transmissions and shift points for the two-speed was undertaken. In [33], the authors went on to analyze two-speed, three-speed, and four-speed drivetrains with gear ratios selected based on the results of the CVT gear ratio optimization.
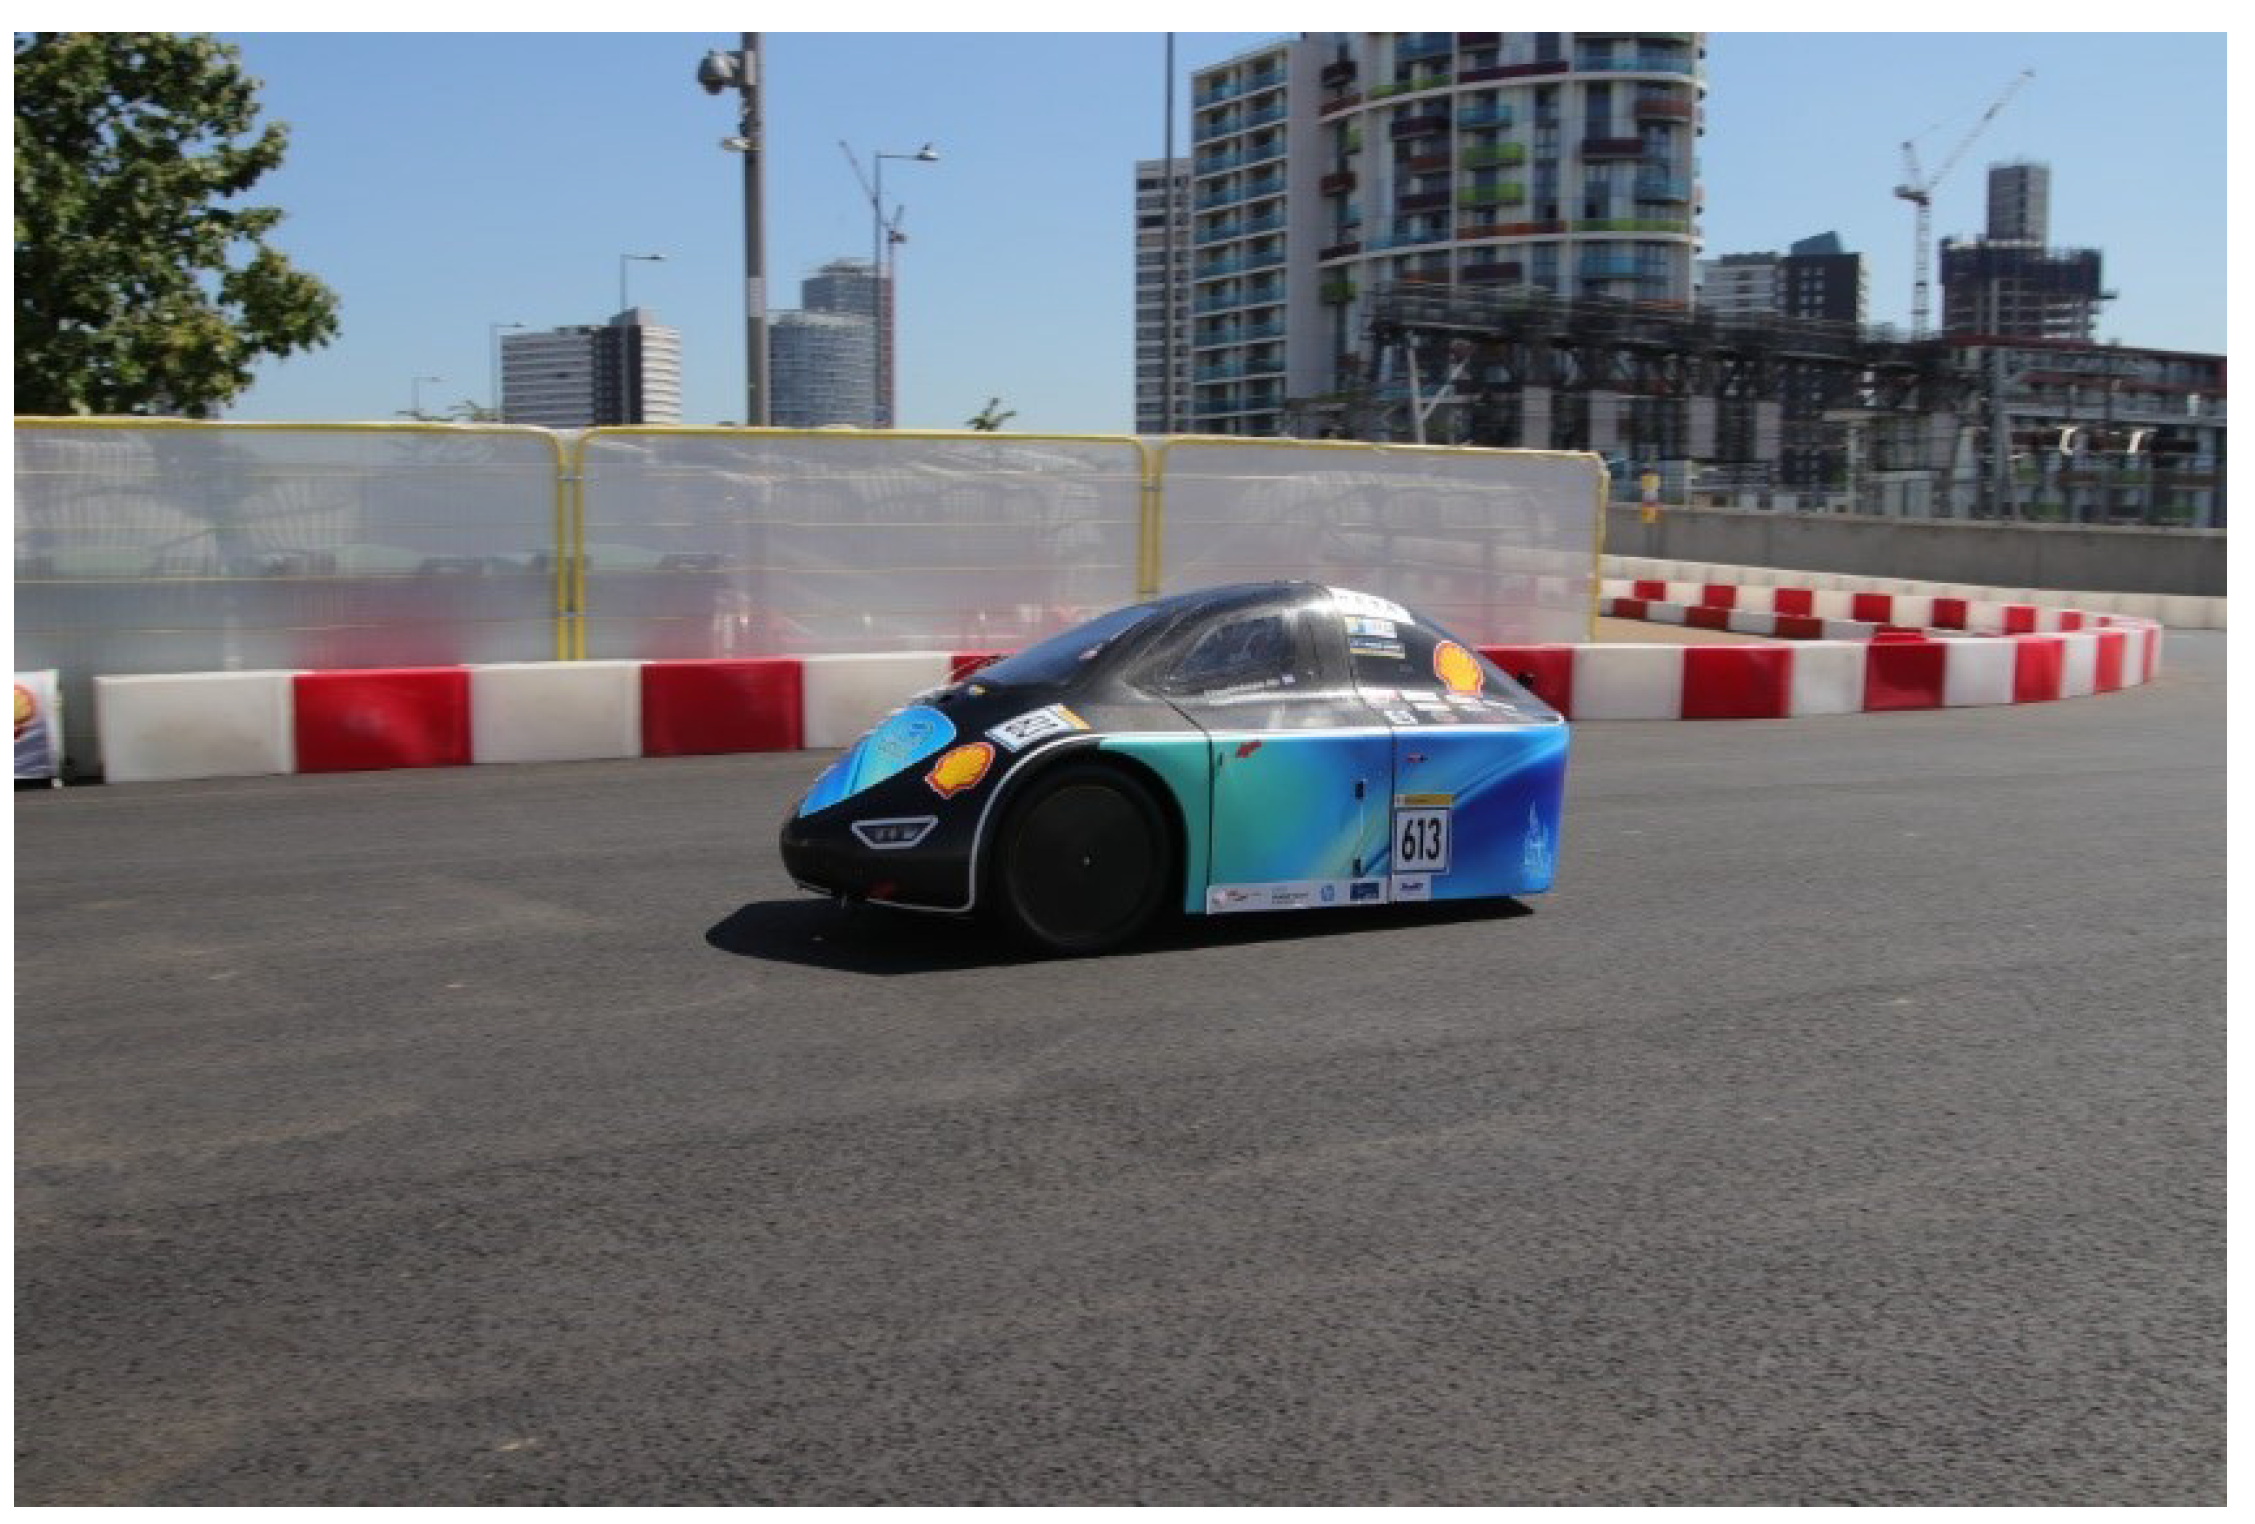
According to the above, there is limited research based on real on-road tests for model validation, in order to identify if and how a single-speed gearbox can provide a feasible solution towards reduced energy consumption. To the best of our knowledge, such research results have been only based in simulation results and no comparison of gear ratio effects is presented. This paper is focused on the technique of improving the energy consumption via the correct choice of the final gear ratio, so that an electric vehicle can work at more efficient operation points and draw less power from the energy source. In view of the fact that many EVs are equipped with a single-speed gearbox to reduce cost, volumes, losses, and drivetrain mass, extended experimental results of a single-speed transmission are presented. These tests are conducted using a prototype electric vehicle developed by our research team (TUC Eco Racing), under various scenarios. A dynamic model of the vehicle is created and fine-tuned using dedicated software, based on experimental results. Dynamic simulations are performed to compare and evaluate different gear ratio setup, providing valuable insights of their effect on energy consumption, towards the selection of an optimal gear ratio for the specific vehicle.
The rest of the manuscript is organized as follows. In 
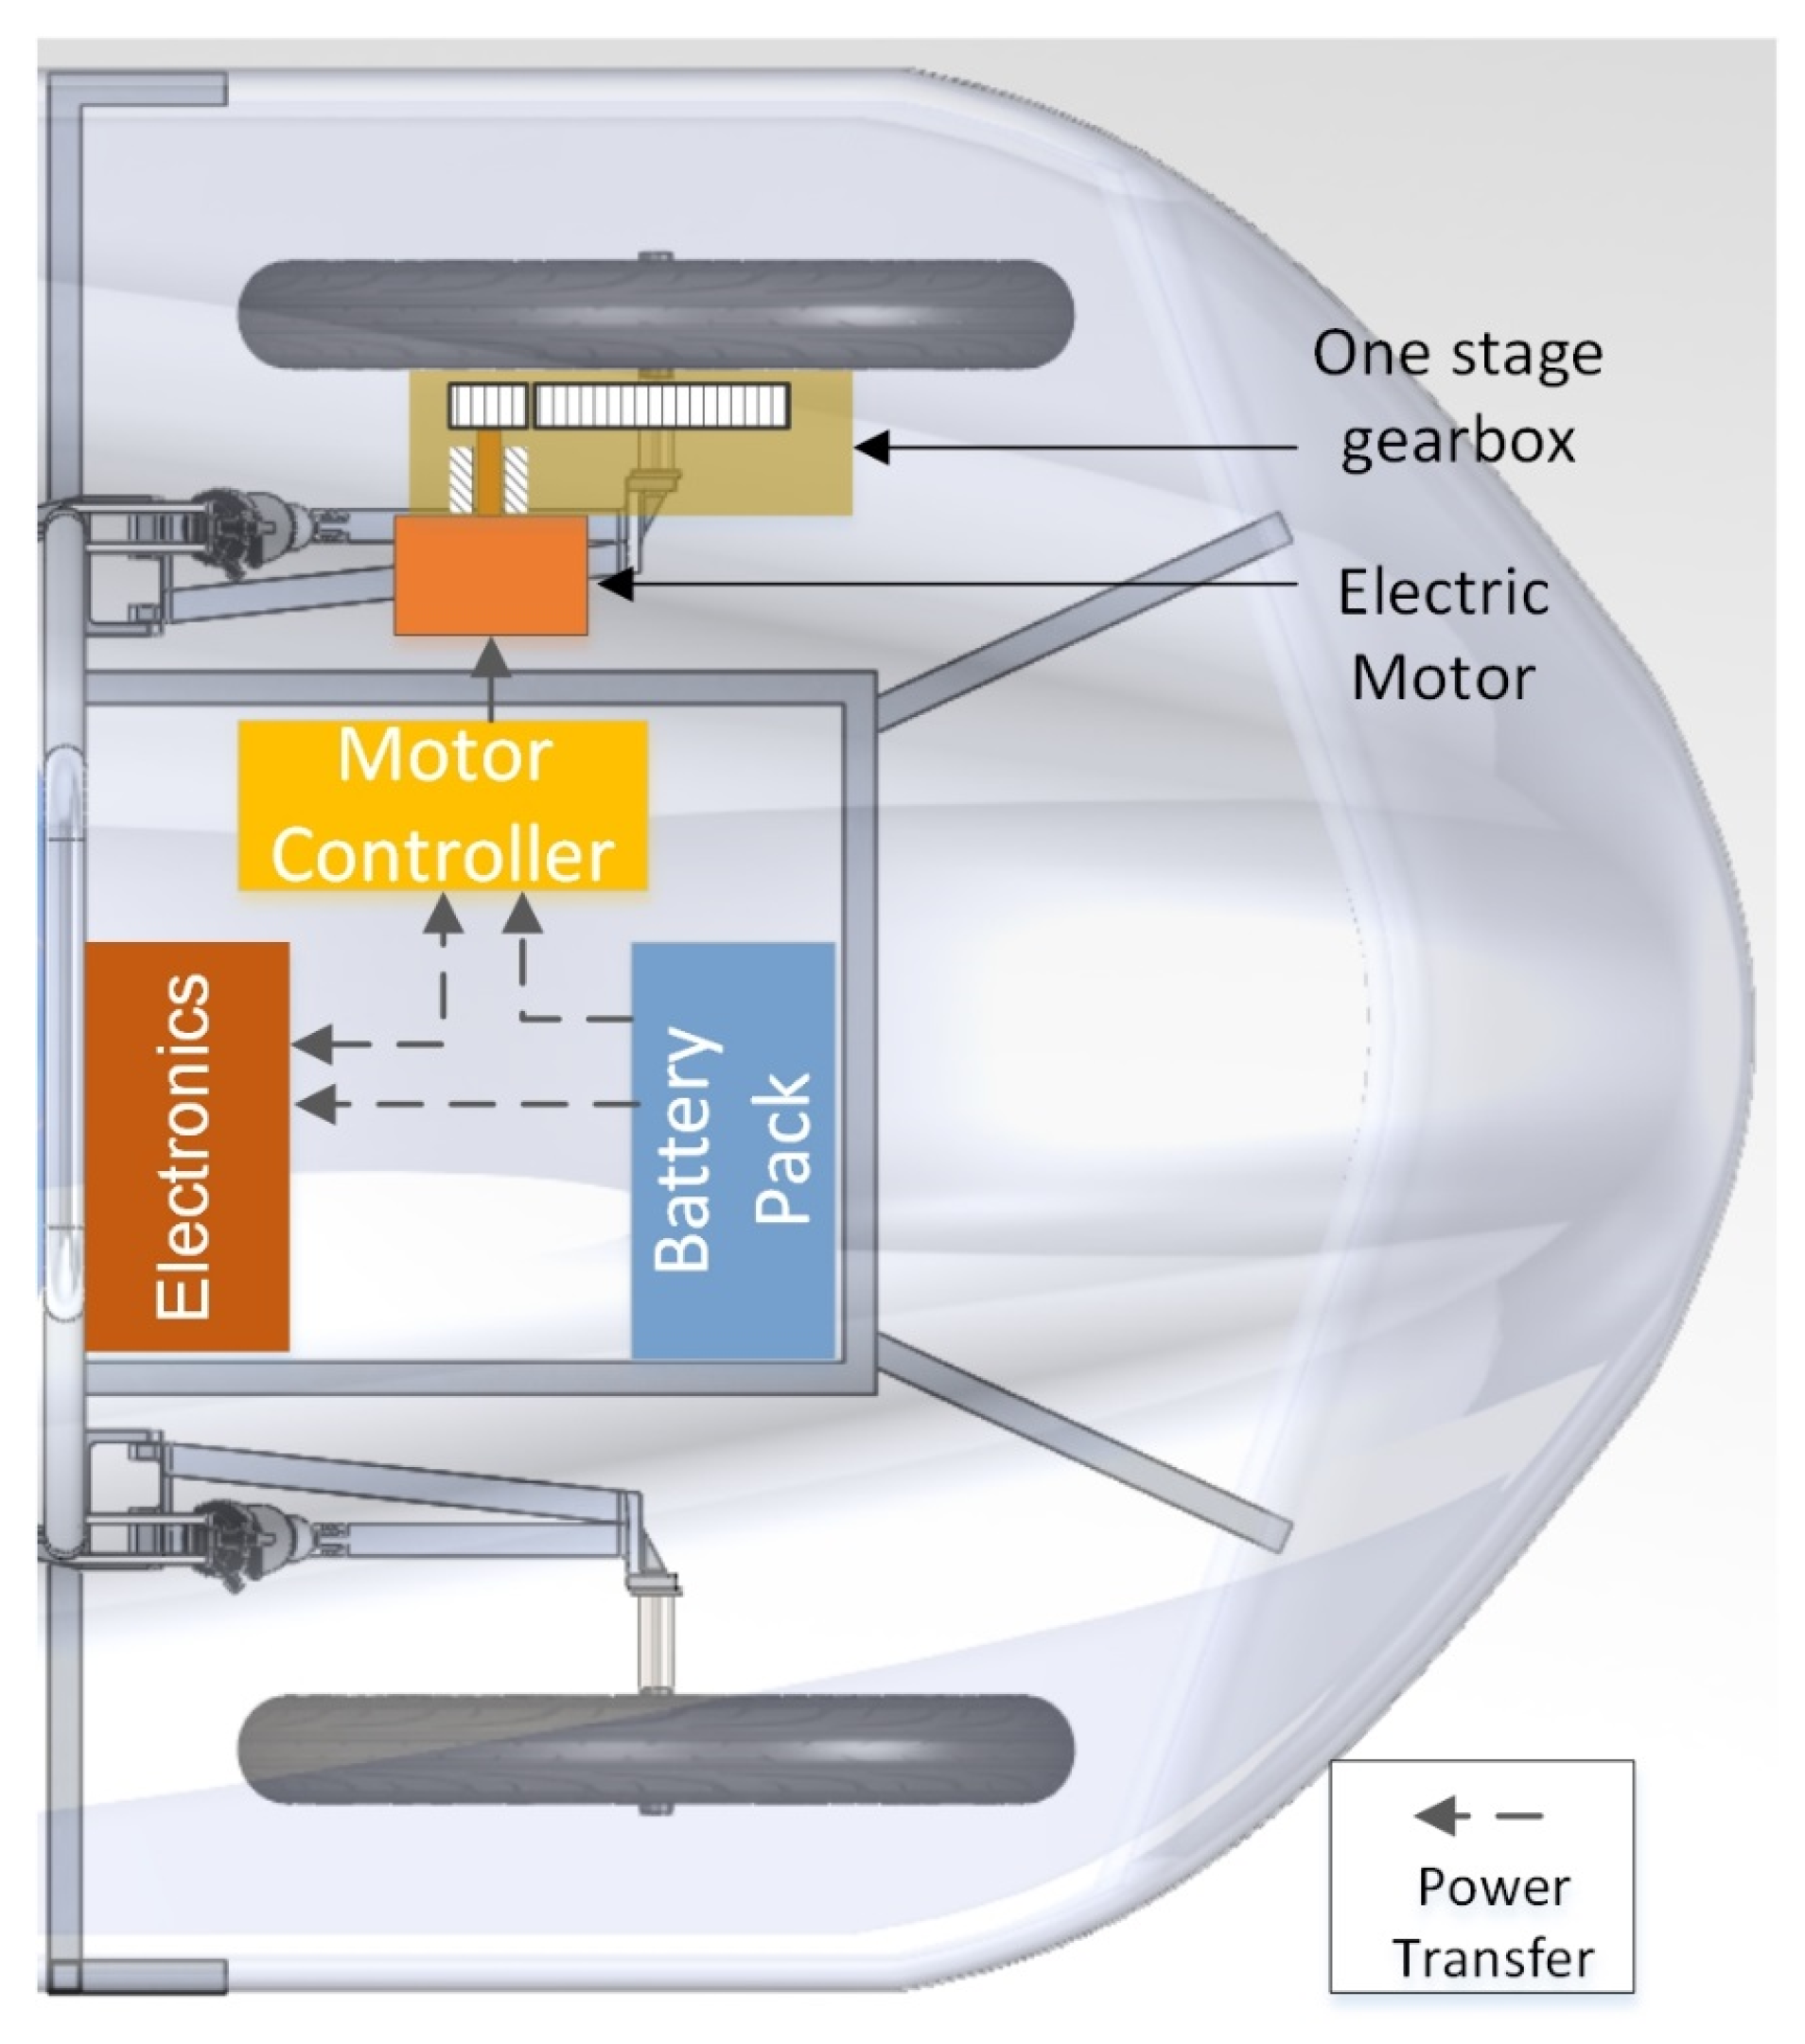
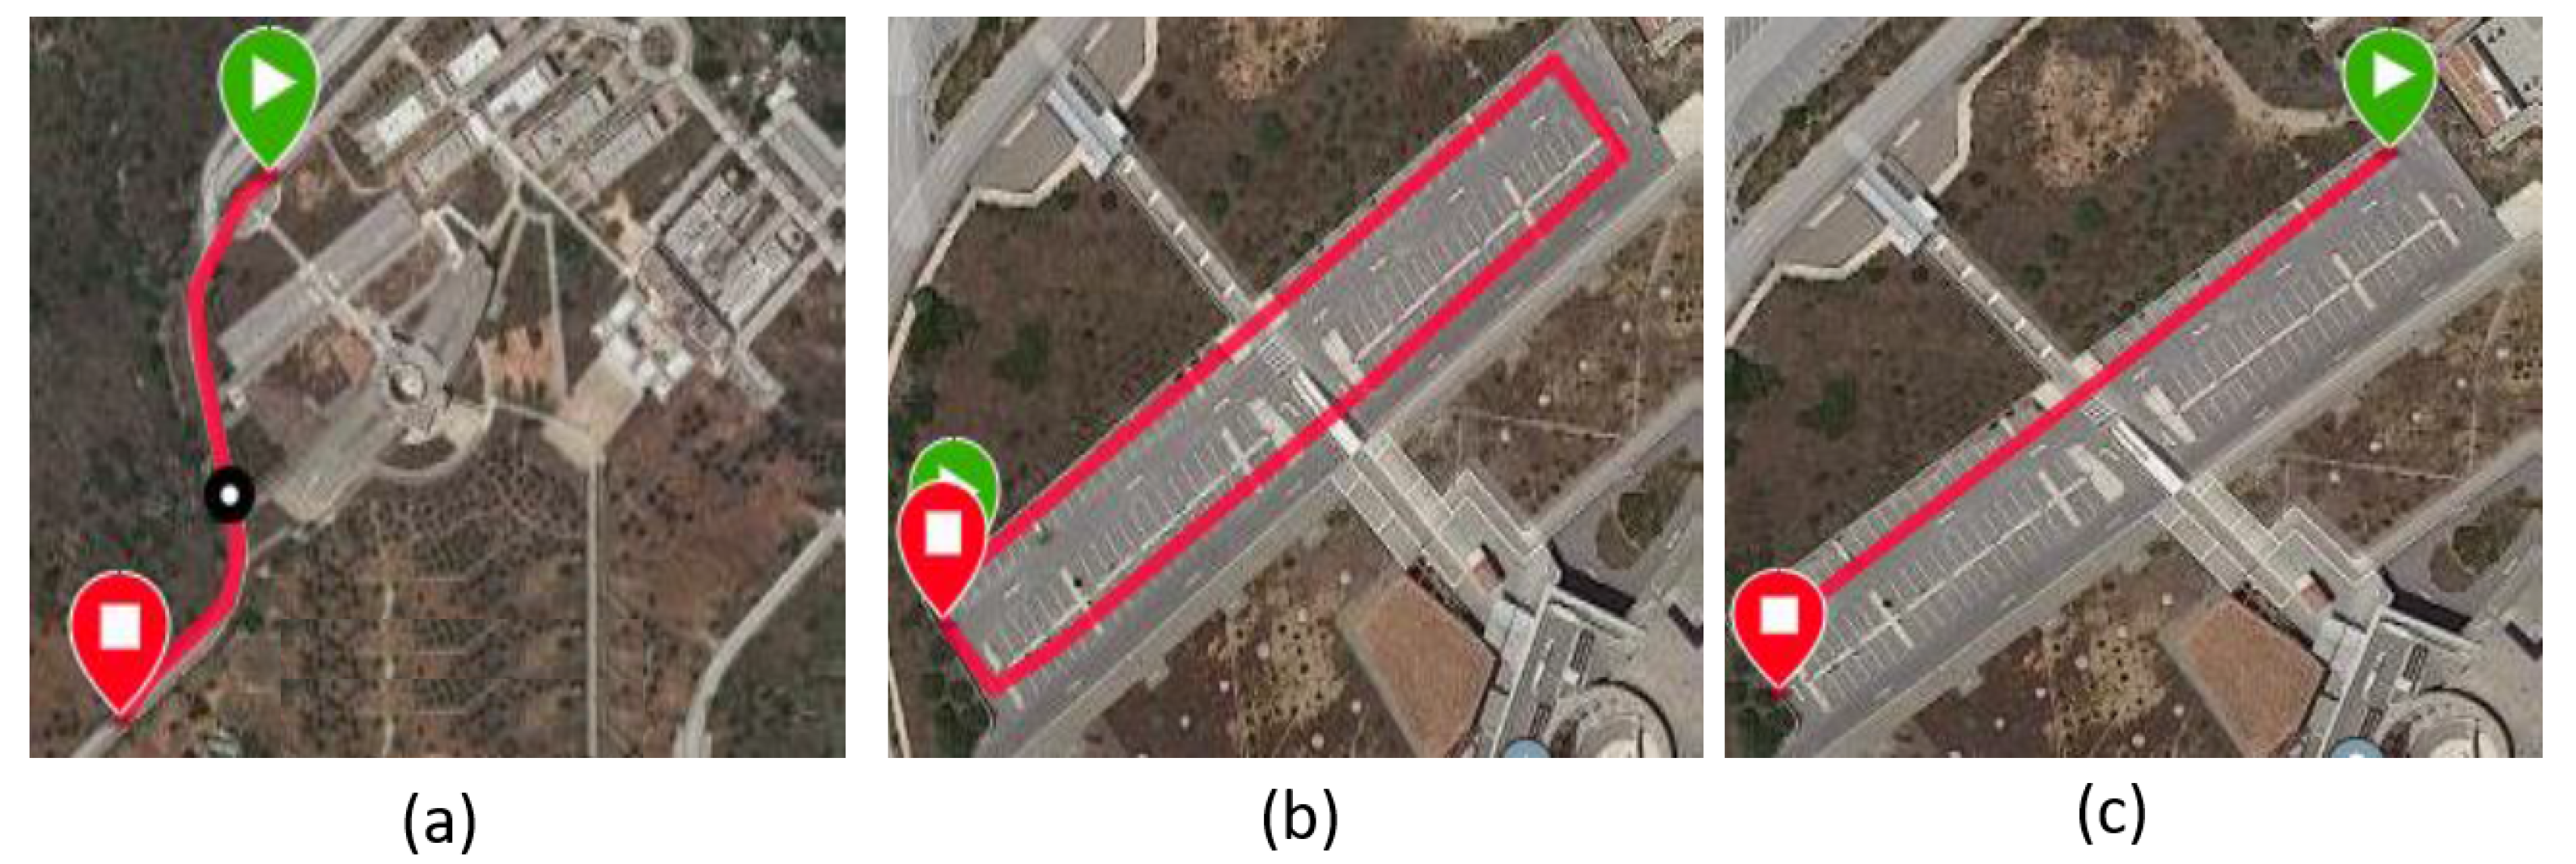
Section 2, we describe the methodology followed for our experimental testing, including the testbed vehicle used, with specifications, powertrain details and data recording set-up, along with the on road tests conducted. In Section 3, we present how we modeled in detail all the vehicle’s components used as input to a dedicated dynamic simulation software. Section 4 presents the results of simulations with different gear ratios, providing a comparison between the different configurations, as also the sustainability impacts of our findings. Finally, in Section 5 we present a discussion of the key conclusions and findings and provide useful insights for future research.

2. Materials and Methods

The methodology and materials used in order to investigate the effects of different gear ratios, in the energy consumption of an electric vehicle with a single-speed transmission, are presented in this section. As already mentioned, our target is to set up an adequate simulation model for a specific vehicle, from which the energy consumption will be calculated under different driving conditions, for three different gear ratios. In our case, the validation of the model is conducted using a prototype electric vehicle (testbed vehicle) for a series of on road experiments, where the energy consumption is recorded. It is very important to mention that in this work we do not depend on any theoretical models, but on experimental testing and data, that are used as input for the fine tuning of the simulation model. To provide details of this experimental methodology, at first we present the testbed vehicle including specifications, powertrain details and data recording set-up. Next, the preliminary experimental testing scenarios used for the basic setup of the simulation model and finally the testing and energy consumption results on a racetrack.

2.1. Testbed Vehicle

2.1.1. Vehicle Specifications

To evaluate the proper selection of the final one-stage gear ratio, the prototype urban vehicle Spyros Louis 2017 was used (Figure 1). It is a one seat, prototype vehicle for urban environments, developed by the Technical University of Crete Eco Racing team (TUCER). An electric motor powered from a battery pack makes up the vehicle’s energy system. The basic drivetrain consists of a one-stage geared transmission placed between the electric motor and the wheel. Testbed technical specifications are presented at Table 1. This vehicle is used as a platform for the development and testing of new technologies in areas such as energy consumption management [34], novel transmission use [19], safety, and new materials. It has also been used as a platform for experimentation in autonomous driving, enhanced with an additional sensor suite (lidar, stereo camera, GPS, etc.) and with an embedded device to perform on-board calculations [35].

2.1.2. Powertrain Specifications

The testbed vehicle powertrain configuration is presented in Figure 2. It consists of (a) a battery pack, (b) an electric motor with the motor controller, and (c) a one-stage gear transmission. Different gear ratios affect vehicle acceleration and energy consumption under consideration. The standard gear ratio used is 1:8, while there is the ability to change gear ratios, for experimentation on the effects of vehicle performance. At the same time, the battery pack can be replaced by a fuel cell module and a hydrogen tank, in order to fully experiment with an additional set-up.

2.1.3. Data Recording Setup

The testbed vehicle is used as an innovation platform and therefore extensive on road experimentation is required. For this purpose it is essential to have adequate data recording of vehicle performance in order to evaluate several parameters of vehicle set-up, as well as to use them for off-line simulations. For the acquisition of data streams two different approaches have been utilized. The first one consists of a custom data logger, tailored to serve the needs of TUCer team, used during testing in our premises as also in racing conditions. The second is a universal data logger, provided by the competition organizers, used only during a racing.
a
The custom data logger device (TUCer logger) records data of power supply voltage, power supply current, and vehicle’s speed, with frequency of a sample set every 0.5 s (2 Hz). The core of the logger is the popular Arduino Uno microcontroller. Voltage measurement is accomplished by a voltage divider while current measurement by a shunt resistor and an AD623 instrumentation amplifier. Speed measurement is done by a magnetic reed switch. All inputs are send as input to the Arduino for processing and evaluation. To overcome the Arduino’s lack of internal memory (for data logging), a connection to a Raspberry Pi is established, which receives the data from the Arduino and logs a file for retrieval after the race.
b
The racetrack data logger device provided by the competition organizers, is a commercial product with enhanced capabilities used throughout testing as backup and correction data provider. It provides data sets every 0.1 s (10 Hz frequency) regarding numerous aspects of the vehicle, such as position (GPS Tracking), energy consumption (V,A), and temperature (C).

2.2. Experimental Testing

Our main target was to develop a valid vehicle simulation model that can be used for the evaluation of vehicle performance and fine tuning of the powertrain, targeting lower energy consumption. For this purpose extensive experimental on road testing is required, in order to record vehicle performance in various operational conditions. The data recorded throughout these tests are imported in our simulation software and tuning of the vehicle model is achieved. In this section, we present in detail the preliminary testing procedure used for the simulation model set-up as well as the final testing during racing conditions in a racetrack.

2.2.1. Preliminary Experimental Testing

Using the testbed vehicle, on-road experiments were conducted inside the Technical University of Crete campus. Three different experimental scenarios were defined and followed, based on different driving style and route (altitude, curves, and distance) characteristics. The experimental data recorded in every test were (a) Vehicle speed (Km/h), (b) Energy consumption (Watt), (c) Time (sec), and (d) GPS position. All data were evaluated and validated through additional replicated tests so that adequate results are obtained.
In the first experimental scenario an ascending route (5% inclination, 300 m long) was set up and the driver accelerated the vehicle in order to achieve the highest speed possible Figure 3a. The purpose of this test was to record and evaluate vehicle performance in uphill conditions.
The second scenario included tests in a route of straights and curves Figure 3b where every lap corresponds to 240 m distance. During this test, the vehicle had to accelerate and brake in corners. The driver tried to follow a low energy consumption driving style, avoiding unnecessary accelerations and decelerations. This test corresponds to standard vehicle operation characteristics.
The third scenario was mainly conducted in a straight line of 120 m Figure 3c, targeting to record various vehicle acceleration characteristics. For this purpose, the driver used different pace of acceleration (up to 30 km/h) in a series of tests, providing valuable results related to energy consumption. The definition of the optimum acceleration is of great importance in order to achieve the lowest possible energy consumption.
All the above experimental testing were conducted using a 1:8 standard gear ratio. The numerous data gathered were used for an initial set-up and validation of the vehicle modeling for simulation purposes.

2.2.2. Racetrack Experimental Testing

The final experimental tests were conducted in an international competition racetrack, with a clear target to achieve the lowest energy consumption possible. An open test track at the Queen Elizabeth Olympic park (Figure 4) was used, created for the Shell Eco Marathon competition. In this track, one full lap corresponds to 1550 m and the test case procedure is to complete ten full laps corresponding to 15,500 m distance, in less than or equal to 39 min. In addition, at every lap it is necessary to start and stop the vehicle at the start line, simulating urban mobility transportation. In this case both TUCer datalogger and Racetrack datalogger were used for data recording. This way, a direct evaluation of results was possible, providing additional correlation of data recorded. The recording of speed profiles in different laps were directly imported in our simulation model. This, provided us with the ability: (a) to fine tune our simulation model, by performing a direct comparison of energy consumption results (experimental versus simulation), and (b) to use a valid simulation model for experimentation on possible alternative gear ratios, targeting lower energy consumption. The experimental results for every lap in the racetrack, are presented in Table 2, including lap time and mean energy consumption of every lap. The total time in the track was 2238.5 sec and the average energy consumption calculated for the 10 laps was 229.71 W.

3. Vehicle Modeling and Simulation

A dedicated software (Carmaker) [36] was used for modeling and simulation of the testbed vehicle. Using this software, we can accurately model test scenarios in a virtual world. It is an open integration and testing platform which can be deployed throughout the development, offering extended modeling capabilities. In this section, a detailed overview of specific vehicle systems and subsystems modeling is presented, as set for the evaluation of energy consumption.

3.1. Theoretical Modelling

The energy consumed on an electric vehicle is an integration of the power output at the battery terminals. The unit of energy usually used in transportation is KWh and the energy consumption per unit distance is KWh/Km when evaluating electric vehicle’s energy consumption. The resistance forces acting on a vehicle are mainly identified as [37] (1) acceleration resistance, (2) air resistance, (3) gradient resistance, and (4) rolling resistance; thus, the power P (Watt) needed to overcome the resistant forces can be described by Equation (1).
P = ( C · M · α + 1 2 · ρ · C D · A f · V 2 + M · g · sin α + f r · M · g ) · V n
where C = mass correction factor for rotational inertial acceleration, M = vehicle mass (kg), α = acceleration, ρ = air density (kgr/m 3 ), C D = aerodynamic drag coefficient, A f = projected frontal area of the vehicle (m 2 ), v = velocity (m/s), g = gravitational force (9.81 m/s 2 ), a = angle of road grade, f r = rolling resistance coefficient, and n = vehicle motor-to-wheels efficiency.
Other power-based models for EVs that are used for the estimation of power requirements depending on kinematic parameters and environmental conditions, are the VSP and VT-CPEM models [2]. As mentioned in [2], the VSP model is easily applicable to different vehicle types by multiplying the result with vehicle mass, but should be mostly used on lightweight vehicles, while VT-CPEM should be preferred for larger vehicles where increased air drag exists. It should be noted though, that the energy consumption estimated by theoretical calculations includes assumptions and cannot fully consider the effects of variable driving conditions observed during on road testing. For this purpose the work presented here is based on actual on road tests and the data collected were used to fine tune the vehicle model, which is setup on a dedicated dynamic modeling software. This is the reason no theoretical model is used for calculations, as simulated data are correlated to experimental data and the model is fully validated based on real experimentation.

3.2. Race Track Modelling

In a dynamic simulation model, the route is a particularly important factor, affecting powertrain operation and of course energy consumption. In order to replicate all the experimental scenarios defined in Section 2.2, the inputs from our data logger were used, mainly corresponding to GPS position. At the same time morphological data from Google Maps/Earth were acquired, converted and correlated to GPS inputs, so that an adequate and valid set of data was formed. An important task that was also followed while using Google Earth and GPS-coordinates provided, was to include altitude parameters. The altitude of the route can be added to the coordinate data using GPS Visualizer, providing the ability of importing altitude parameters associated to GPS-coordinates. A related procedure of importing valid track data to the specific software can be found in [19]. The final data set was imported into the software including longitude, latitude, and altitude values according to the format required in ASCII.

3.3. Vehicle Components Modeling

Several inputs related to vehicle components are required in order to configure a proper vehicle model. In our case, those mainly affecting the simulation set-up are the chassis, tires, and the powertrain. More details on the modeling of these components are presented in the next paragraphs below.

3.3.1. Chassis Modeling

The vehicle chassis or body is the central model. It consists of the Mesa Verde multibody vehicle model along with predefined interfaces to other modules. According to software requirements [36], the process of modeling the masses of the vehicle’s components is separated in two divisions: (a) body masses and (b) unsprung masses. Body masses refers to those which are placed on the chassis and the vehicle-body. Therefore the values to be imported were the respective weights, the coordinates of the centers of gravity and their moments of inertia. These values were defined and calculated throughout our CAD software. The unsprung masses are divided into further sub-sections, classified as spinning (e.g., wheel, rim, and wheel-hub) and non-spinning masses (e.g., wheel carrier and half the wishbone or brake caliper). Finally, the driver is modeled as a trim load and the suspensions are assumed rigid and have no effect on vehicle operation. Each of the components has been designed in a CAD software so the respective information of weight and moments of inertia were highly accurate and were computed with a common coordinate system.

3.3.2. Tire Modeling

The testbed vehicle uses the MICHELIN 95/80 R16 tires in front and rear wheels. For their modeling the standard Pacejka Magic formula was used [38] and the only parameters changed were the tire dimensions and the rolling friction coefficient provided by the manufacturer. This modeling procedure is used in most cases of such simulations mainly for simplicity, as dedicated experimental testing would be needed in order to tune a tire model. Moreover, in our case the vehicle is driven in low speeds and limited braking occurs during driving, thus it is assumed not to have an important effect in our simulation results. An extension of tire simulation capabilities can be used for future detailed tire modeling, by applying the TameTire model developed by Michelin [39], where it is possible to examine tire forces and moments in a wide range of conditions, including the impact of thermal effects, speed effects, inflation pressure or transient effects. In general, tire friction can be of importance during vehicle cornering and braking, in terms of vehicle handling. Such data are mainly related to road conditions (dry, wet, or ice), as also on different road material types (such as asphalt, gravel, etc.) [40,41,42]. Experimental and theoretical results for car tires in contact with a road made from tarmac in dry conditions can be found in [42,43], presenting a range of values 0.7 < μ < 1.0.

3.3.3. Powertrain

One of the most determinant stages, in order to simulate the energy consumption and the performance of the prototype car, is the modeling of the powertrain. At this stage, the general information is determined, such as the basic type of the powertrain and also the number of the motors on the vehicle. In our case the type of powertrain is set to electrical, linking to a battery pack. The defined output values of the Energy Source, like the Voltage and Maximum Power, were set to 48 Volt and 960 Watt, respectively. At this point the “Electrical” control model was also selected, which resembles a typical control strategy for an electric powertrain.
The testbed vehicle has one motor installed and the details of the motor specifications imported were mainly extracted from the data sheet of the electric motor. Normalized values of the torque and rotational speed in relation to the efficiency of the motor are imported in the software. This procedure was explicitly defined according to our experimental tests. At the driveline, it is needed to define the way that the torque is distributed by the motor to the wheel. The model that was used (since there is no option for a single motor in one wheel), was the universal drive with a differential in the rear axle. By using this kind of model there was an option to define the inertia, the transmission ratio and the efficiency of the differential. Due of the absence of differential in the prototype car, the values set were ideal, corresponding to Inertia = 0 kgm 2 , Ratio = 1:1 and Efficiency = 100%.
The final gear ratio, which is the main subject researched here, has a standard value of 1:8 and can receive two alternative values, 1:6 and 1:10 respectively. Since a single gear ratio is installed on the testbed vehicle, the no gearbox option is used and the user can switch from one ratio to another manually. The specific gear ratios are chosen as the limits of ratios that can be used on the specific vehicle, in order to be able to accelerate and achieve the maximum velocity needed and at the same time to cover every lap in a specific timeframe. To clarify this more, if a higher gear ratio is used (>1:10) then the vehicle would not be able to accelerate fast enough, while for a lower gear ratio (<1:6) the vehicle would not achieve the maximum velocity needed in order to finish the 10 laps in the timeframe of up to 39 min.

3.3.4. Other Vehicle Components

The modeling of other subsystems of the vehicle were fine-tuned based on our knowledge and experimental testing of their effects on vehicle energy consumption. For the suspension, a model of the double wishbone type was defined, the same as in our vehicle, and all the values of sensitivity were considerably increased in order to cope with the almost stiff suspensions used. It must be noted that due to the difficulty of modeling a valid suspension for the specific testbed vehicle, we have chosen to adjust the vehicle suspensions on the higher stiffness possible on every experimental test. In this way the suspension effects were limited for our simulation purposes. Finally, the steering wheel was modeled as a rack pinion type, with imported value of rack travel to steering pinion angle.

3.4. Driving Model

One of the factors with a high impact on the powertrain, which is directly related to energy consumption is the aggressiveness of the driver. The driver behavior model can be developed in many different ways and can be predefined in CarMaker software. However, as in our case there is an availability of experimental data from road tests we chose to import real velocity-time data in the software. In this way, we are sure that in every simulation the vehicle will follow exactly the same driving style and thus provide us with validated results of the energy consumption. For this purpose the file imported had four columns, including time, velocity, upper velocity, and lower velocity. The values of upper and lower velocity were entered manually, with a deviation of ±0.01 m/s from the actual velocity, corresponding to upper and lower bounds that the simulation can use in order to achieve the specific driving model imported in terms of velocity and time. This technique helped us also to control our dynamic simulation model, since based on the speed profile imported, we could actually control the driver’s behavior according to the limits set by us. Of course the experimental velocity data available were obtained for a final gear ratio 1:8. For the other two gear ratios researched, the same velocity-time profile was used for each lap and the only change re-defined was on the gear ratio.

4. Results

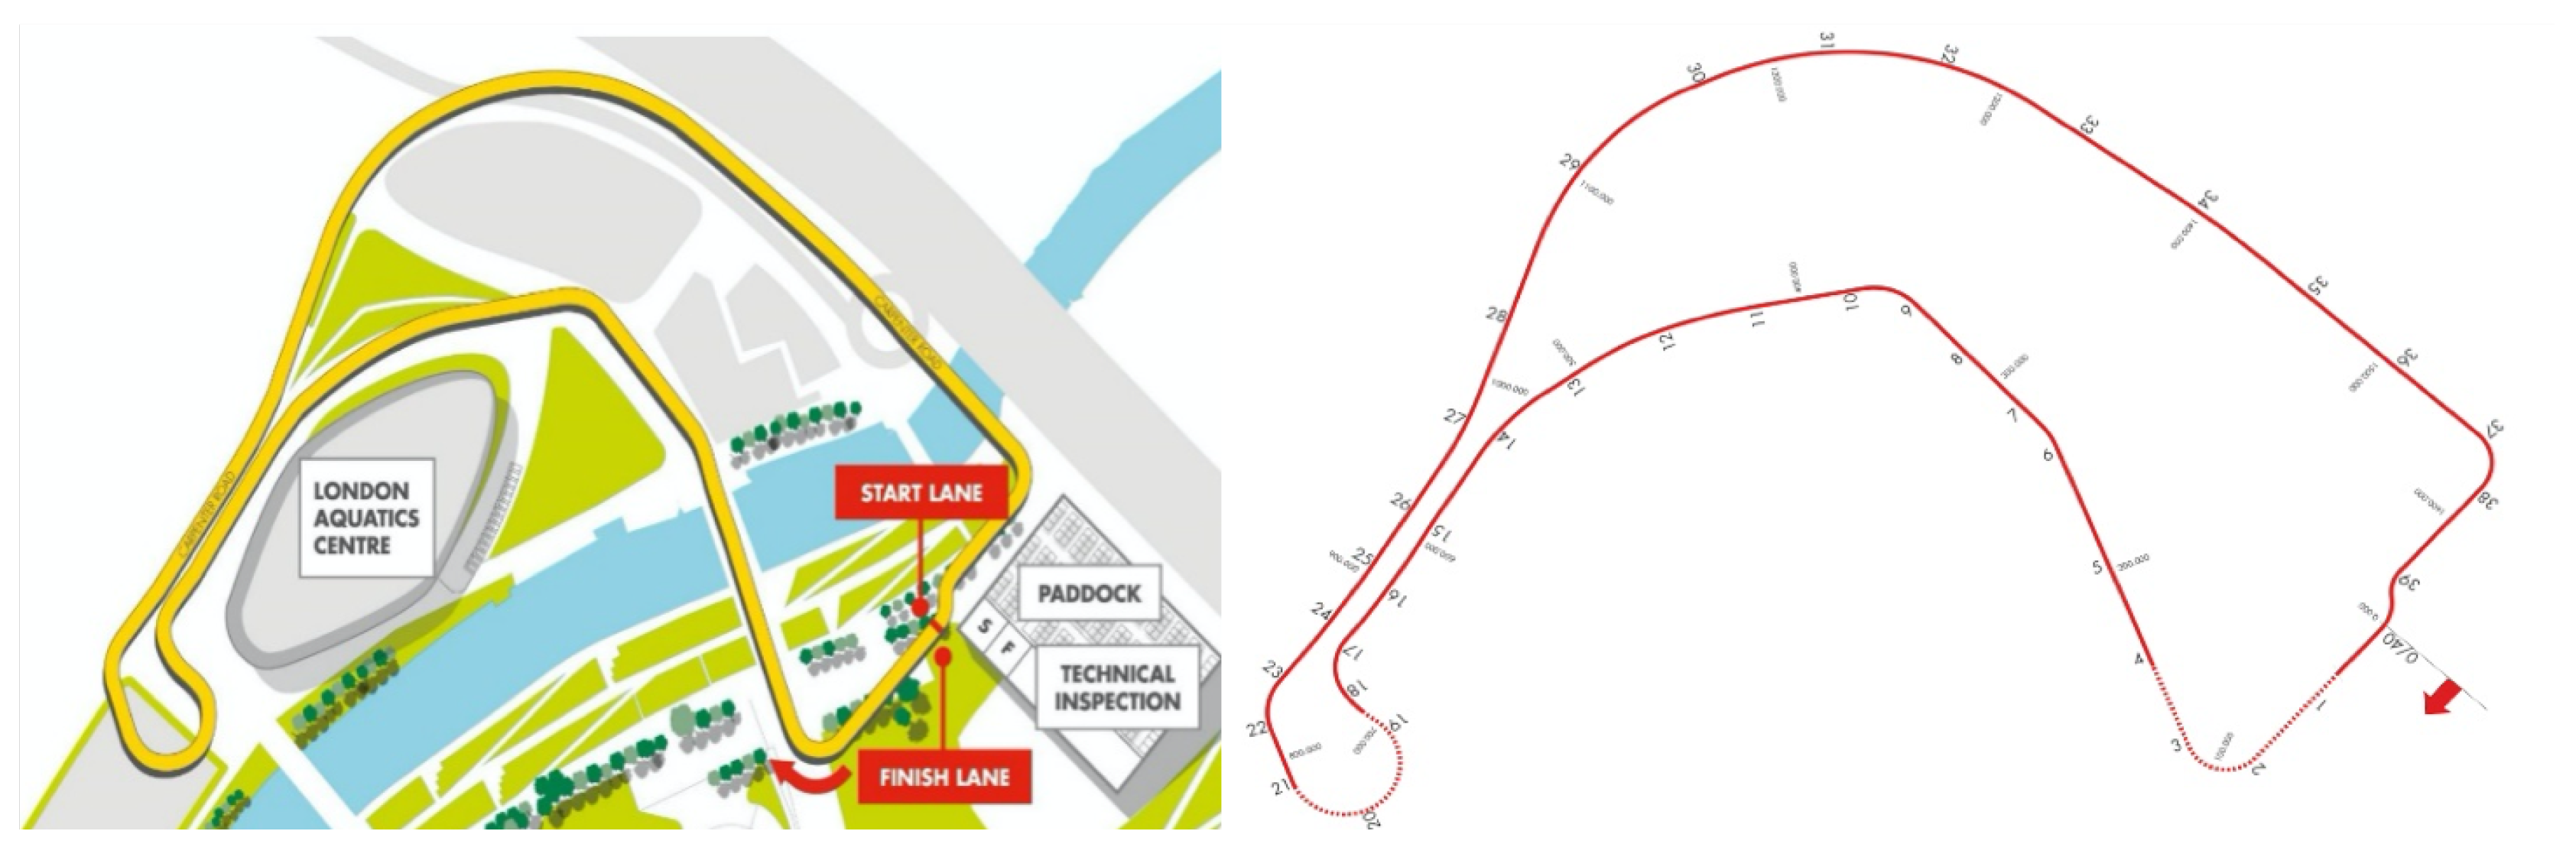
Based on numerous experimental on road tests and data collected, a valid vehicle model was developed. As already mentioned, the main target of this research is to use this dynamic vehicle model for the determination of a suitable gear ratio that can provide the lowest possible energy consumption. The final on road experiments took place in a racetrack, as detailed in Section 2.2.2, using the standard gear ratio (1:8) and two alternative gear ratios (1:6, 1:10) were simulated and compared. A comparison of simulation and experimental results is conducted first, using the standard gear ratio of 1:8 for a distance of 10 laps in the racetrack. Then, the 10 laps are duplicated in simulation (in terms of speed profile) using the alternative gear ratios (1:6, 1:10) and comparative results are presented. Next, the best lap is chosen, corresponding to the lower energy consumption achieved in the track and it is used for further comparison of gear ratios effects. Finally, the sustainability issues that arise from our results are discussed and calculation of their impacts are presented for the year 2050.

4.1. Racetrack Comparative Simulation

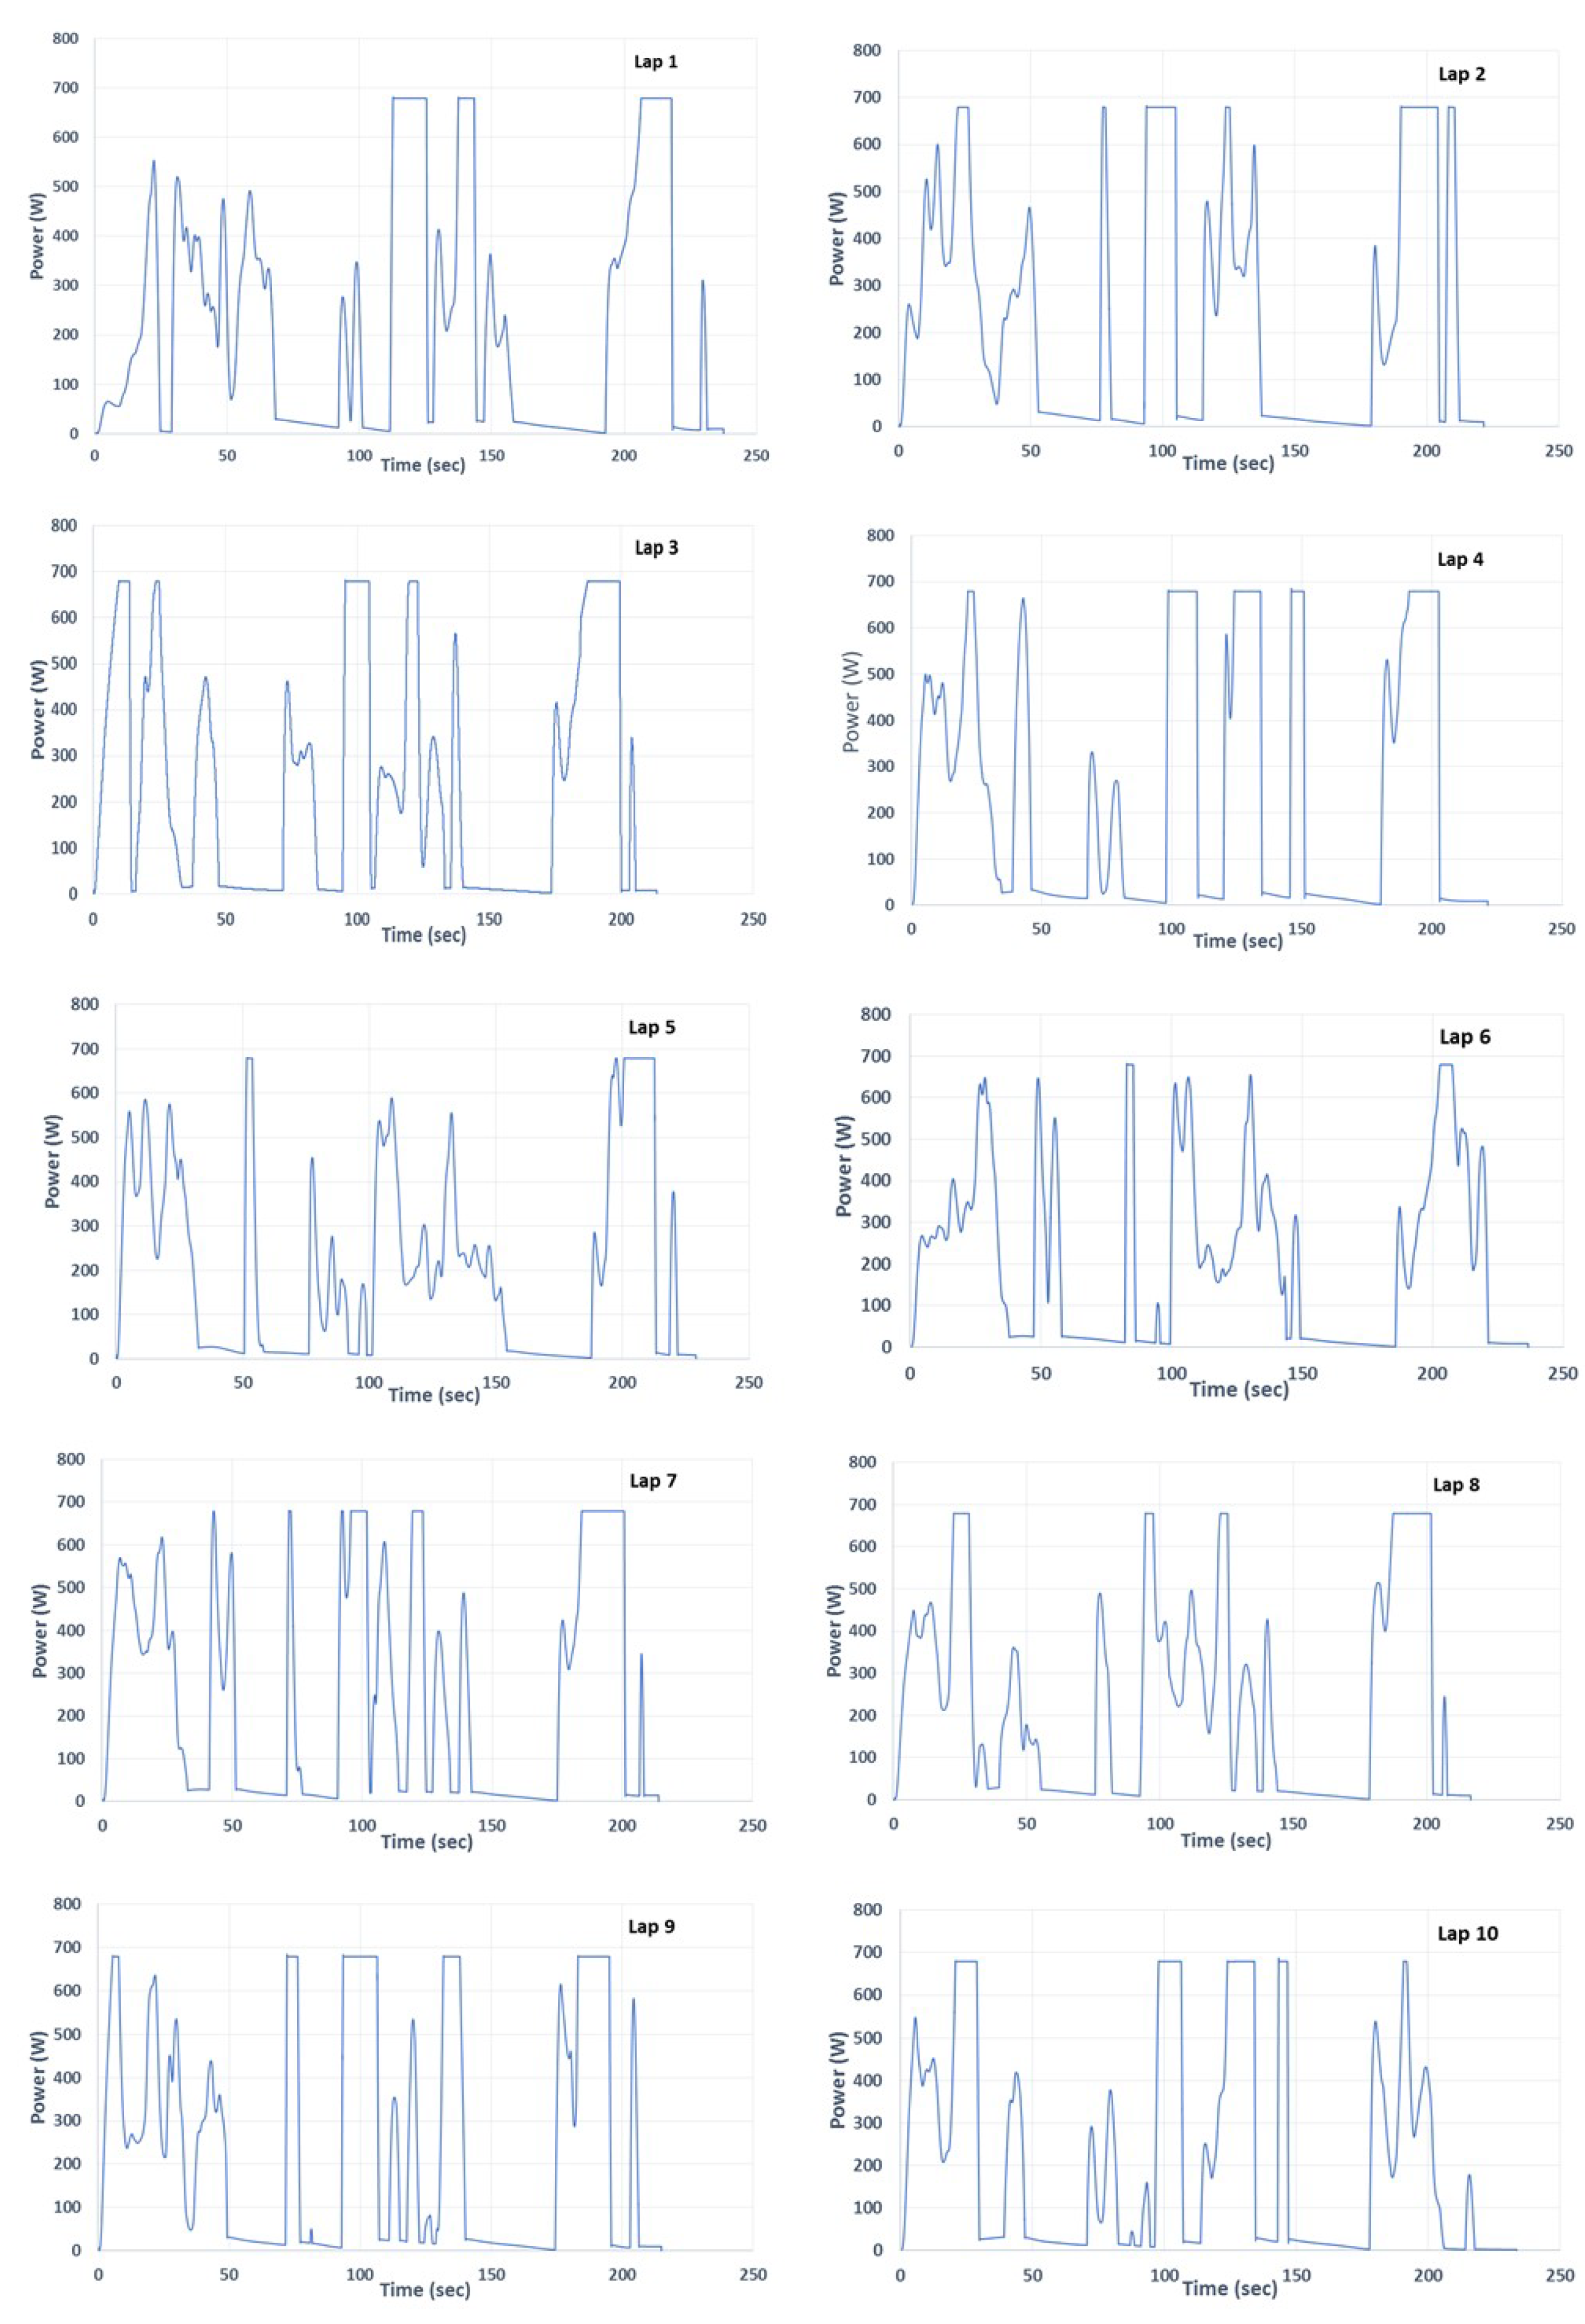
The testbed vehicle completed 10 laps in the racetrack and the various operational parameters recorded are used for the final verification and tuning of our dynamic model, using the standard gear ratio of 1:8. Several simulations were performed, on a lap by lap basis, until minimum energy consumption deviation was reached, comparing experimental versus simulation results (Table 3). The efficiency included in Table 3, corresponds to the electric motor’s efficiency calculated by the simulation software. The power needs of the vehicle’s electric motor for every lap, as obtained by the simulation software, are presented in Figure 5.
The time of every lap was identical to experimental results, as a specific velocity profile was used. Regarding the energy consumption, our dynamic model presented differences of 0.7–7.7%, resulting to a mean value of 4.16%. It must be noted that the lowest difference is found in Lap 5 (0.7%), where also (a) the highest motor efficiency and (b) the lowest energy consumption is achieved. It must be clarified that lap 10 is 60 m shorter than the other laps and that is why we consider Lap 5 to have the lowest consumption. The lap time has an important impact on energy consumption, as a higher lap time equals to lower mean velocity inside the track. But this is not straight forward, as the velocity profile is the second factor critically affecting energy consumption. An example for this insight, is that if we consider experimental values of lap 3 and 7 which have almost equal lap time, different mean energy consumption is achieved. The average simulated energy consumption calculated for the 10 laps corresponds to 230.85 W, while from the experimental data 229.71 W was found, showing a difference of 0.4%. The small variations of experimental versus simulation results confirmed that the simulation is adequate and can be used for further experimentation.
Following the validation of our dynamic model, we can focus on the evaluation of different gear ratios. Only the gear ratio is changed in the model and exactly the same velocity profile is used, in order to replicate the 10 laps. As so, every lap time remains constant and the only change is due to acceleration differences. The first simulation results presented correspond to a gear ratio 1:6 and the second to gear ratio 1:10, as shown in Table 4 and Table 5.
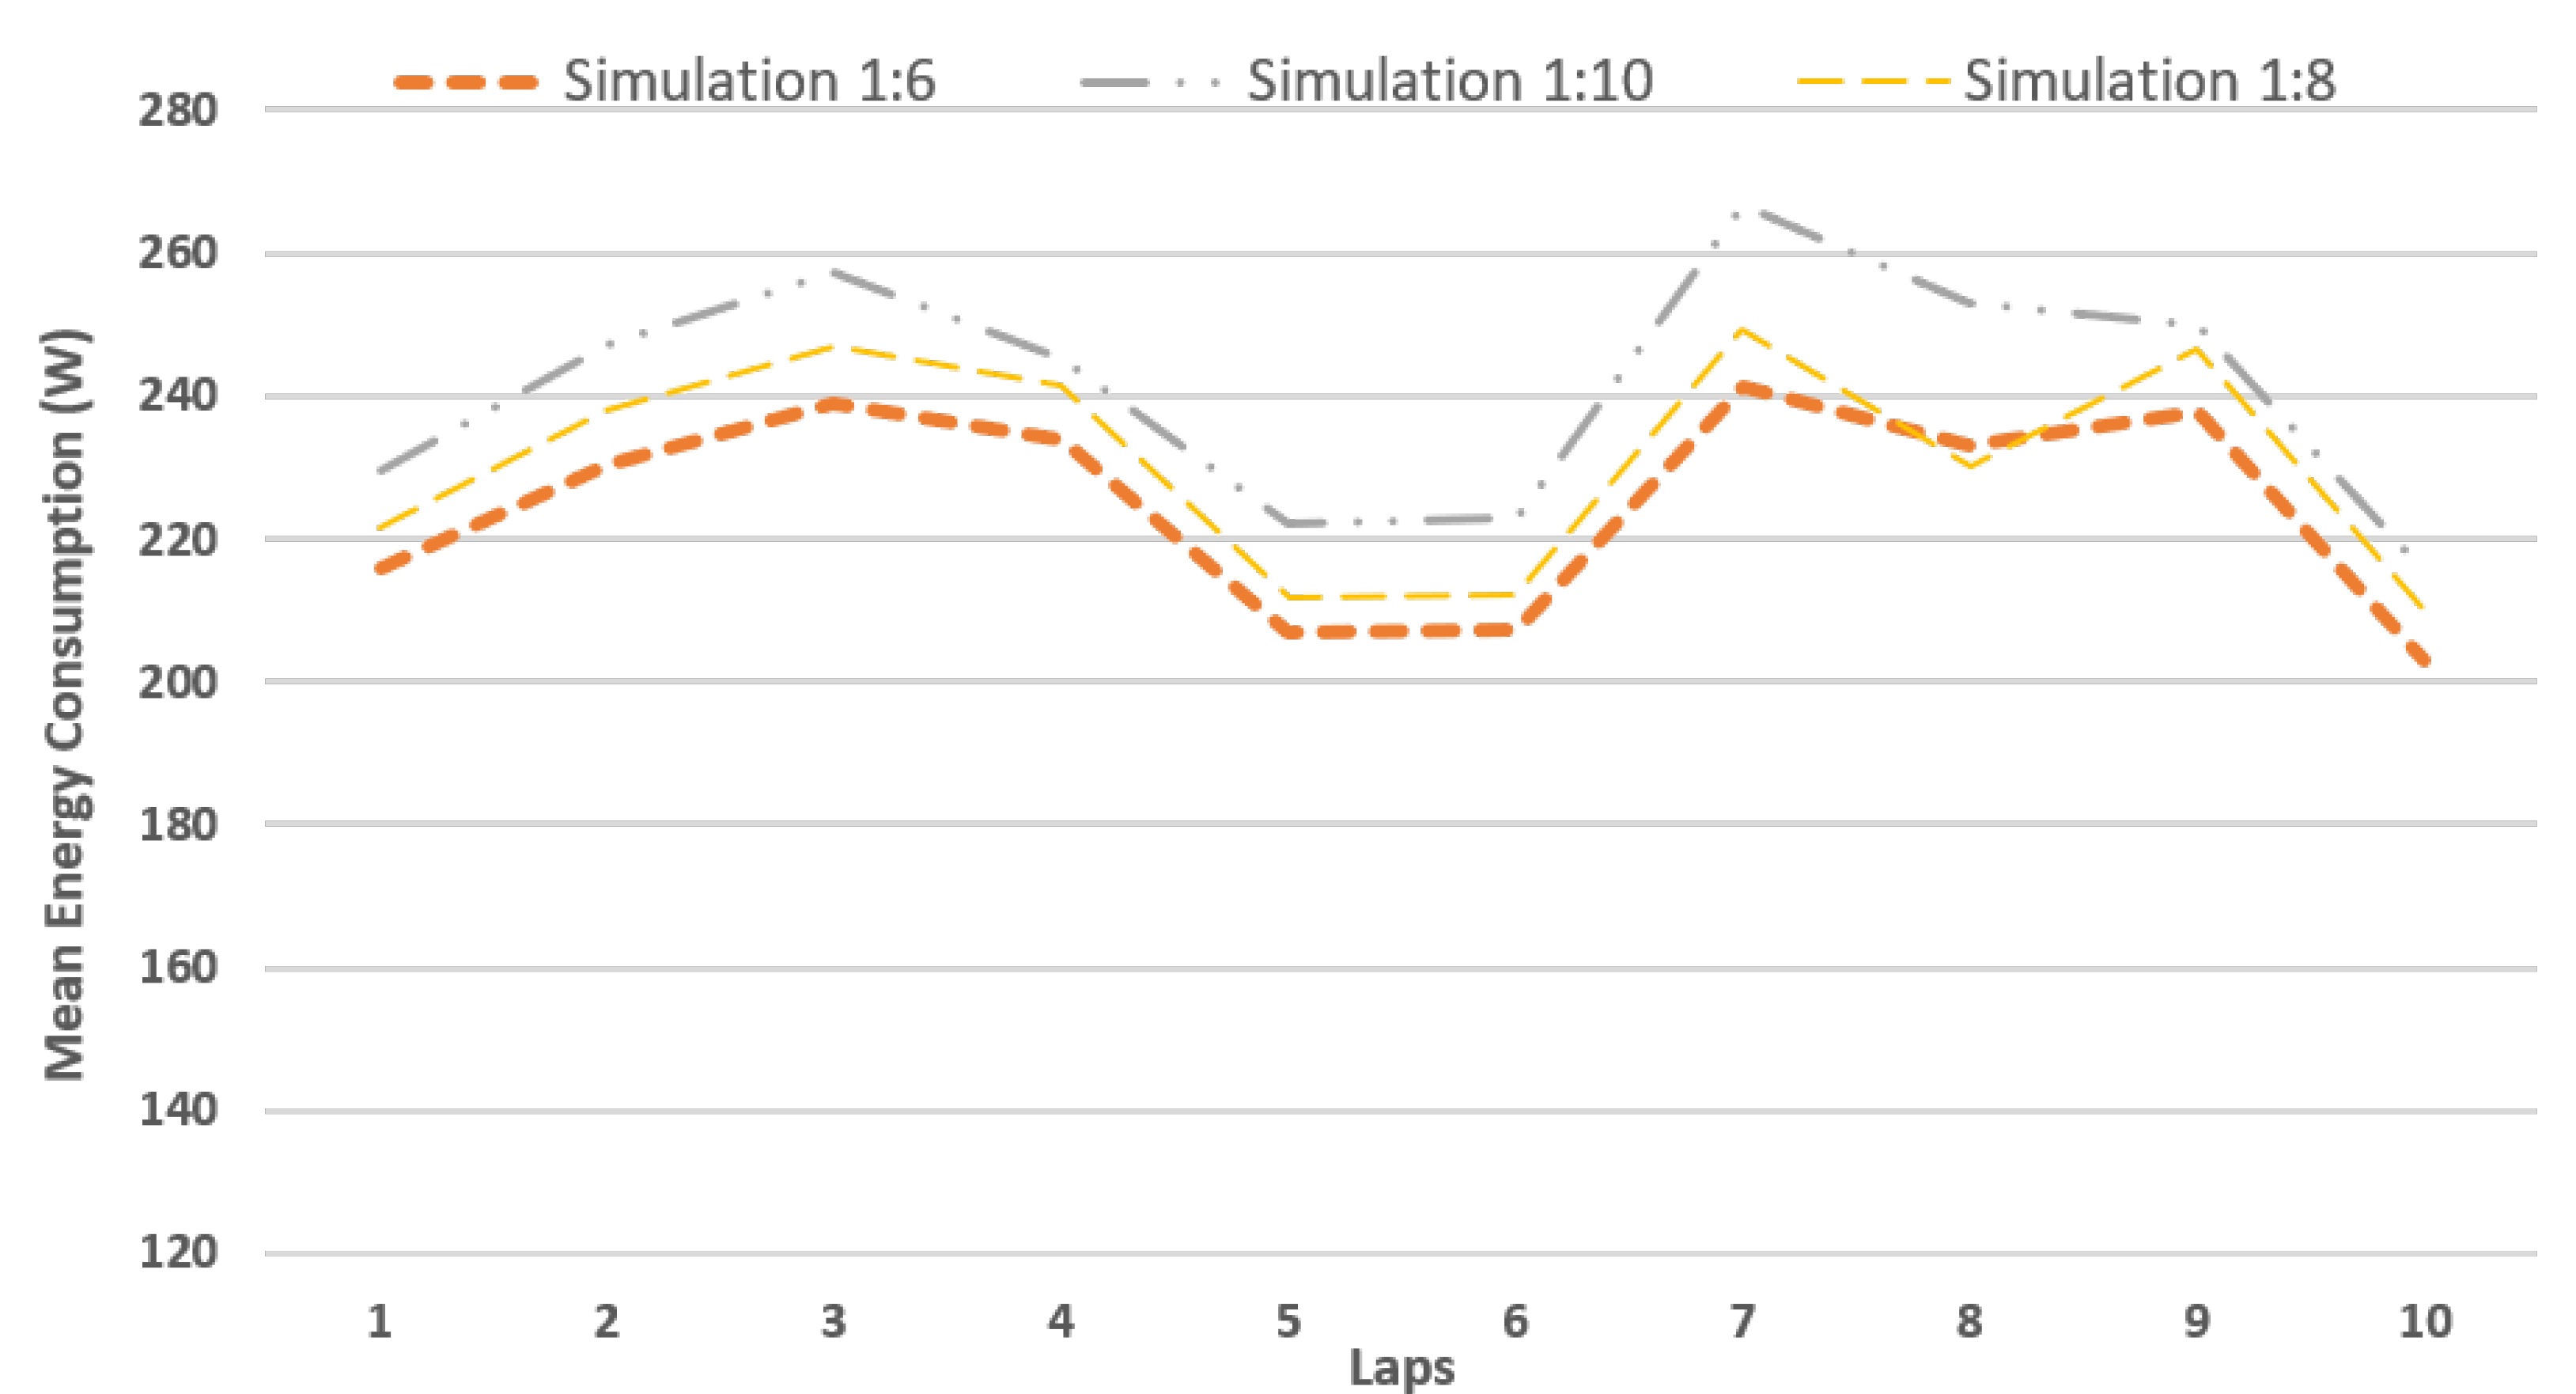
Simulation results evaluation is based on the mean energy consumption values obtained for the 10 laps, where for gear ratio 1:6 and 1:10 are 224.81 W and 240.93 W, respectively. Compared to ratio 1:8 (230.85 W), ratio 1:6 provided 2.6% lower mean consumption and ratio 1:10 higher mean consumption of 4.2%. A general observation is that ratio 1:6 should be chosen to lower the testbed vehicle energy consumption. A graphical representation is used to highlight the differences that occur in every simulated lap, as shown in Figure 6, for further evaluation of gear ratios comparison.
It can be seen that with a higher ratio, 1:10, the vehicle would consume more power in every lap, compared to standard gear ratio (1:8). Alternatively, the lower ratio 1:6 presents lower energy consumption in every lap, except lap 8 (+1.26%). As all the laps considered have different time and velocity profile, more conclusions can be drawn from these observations and need to be discussed. The first comment is related to the percentage of consumption differences between gear ratio 1:8 and 1:10, which range from 1.54% to 8.95%, thus velocity profile critically affects energy consumption due to more aggressive accelerations. On the contrary, ratio 1:6 presents almost equal differences in all laps, ranging from 2.74% to 3.74%. In this case it is less effected by velocity fluctuations (as in ratio 1:10) because the driver is limited (by the gearbox) to perform smooth accelerations, which minimize the energy consumed. Based on the aforementioned it can be assumed that lower gear ratios offer higher potentials to adjust vehicle performance and minimize energy consumption, when discussing the use of a single-speed gearbox.

4.2. Best Lap Simulation

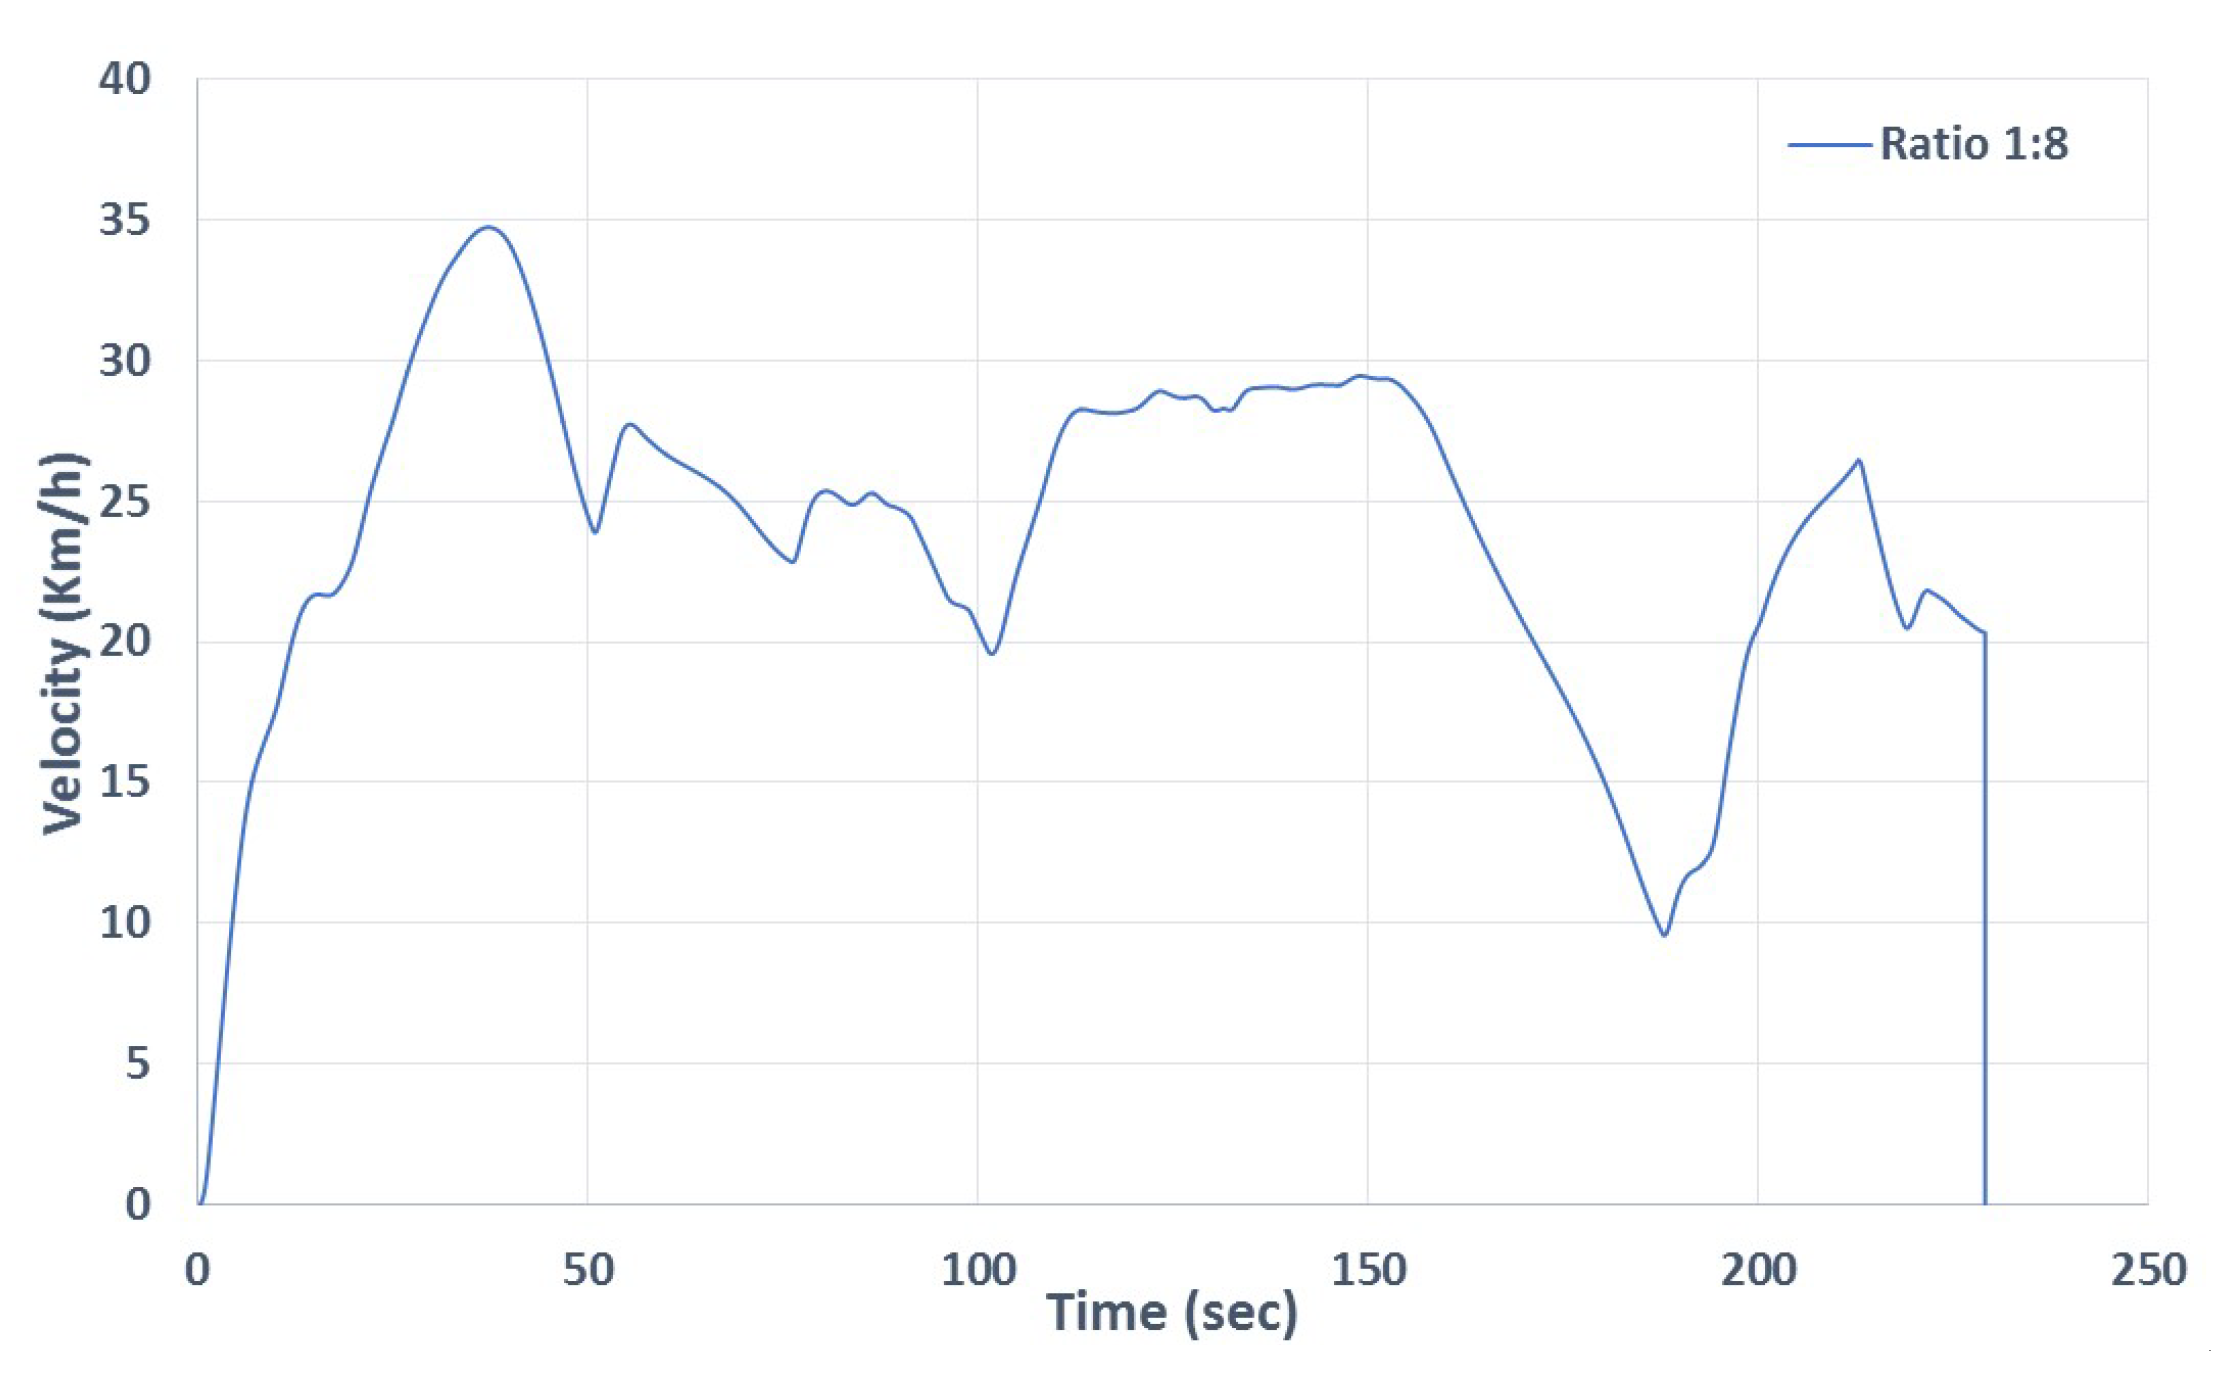
As mentioned before, in lap 5 the lowest difference between experimental and simulation results was found (0.7%) where the lap time achieved was 229 s. In contrast to typical racing conditions, where the target is to finish every lap in the lowest time, in order to obtain lower consumption every lap should be completed in the maximum time possible. For the specific racing track the target is to finish the 10 laps in up to 2340 s (39 min). Therefore the optimum lap time should be as close as possible to 234 s. Based on this, laps 1, 5, 6, and 10 were the best achieved by the driver, in terms of time and consumption. However, laps 1 and 6 exceed the ideal lap time (234 s) and lap 10 is 60 m shorter. Lap 5 presents the lowest deviation from experimental data and for the above mentioned reasons is chosen as the ideal lap. It is easy to assume that all the races should be driven with this driving profile (Figure 7), targeting to achieve the lowest possible energy consumption. Thus, this lap is considered the best lap and further experimentation is conducted to explore the effects of the alternative gear ratios.
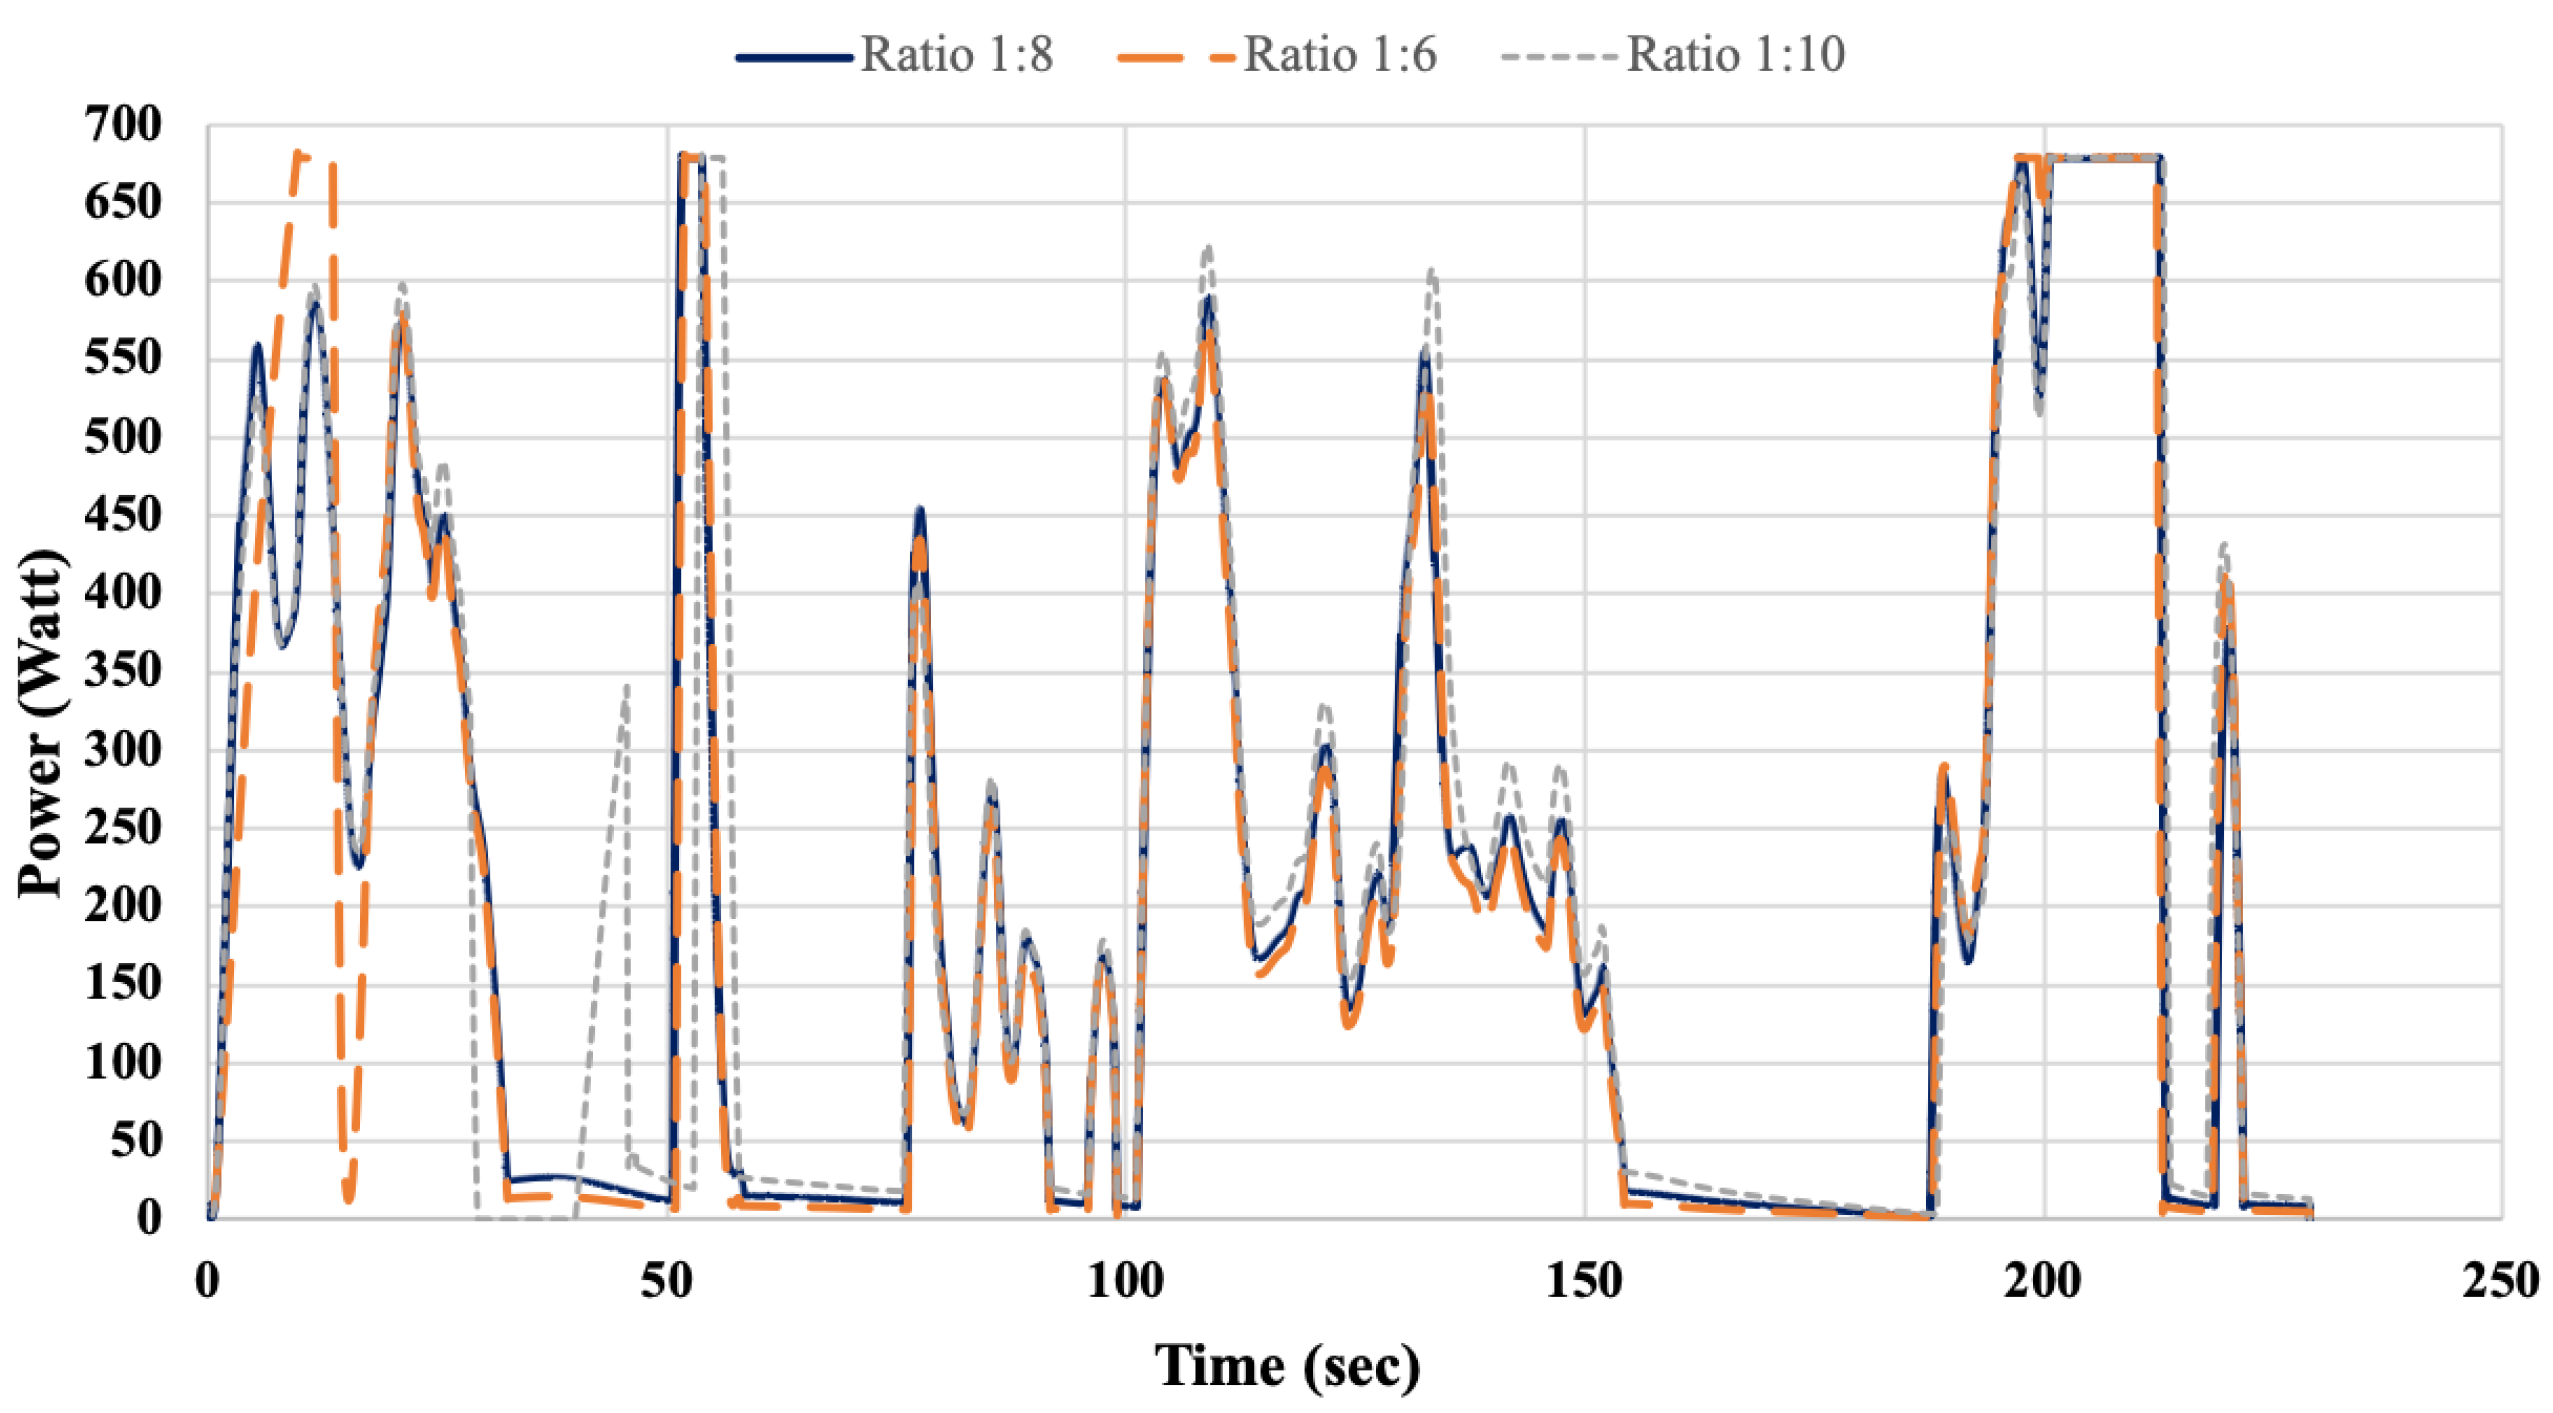
The simulation results are summarized in Table 6. Using ratio 1:6 a 2.4% lower consumption would be achieved and with ratio 1:10 a 4.6% higher consumption would result.
A comparative diagram of the energy over time for this specific lap is presented in Figure 8, for further insight in this evaluation. Differences are relative small between the three ratios, but the small spikes in certain points of the diagram constitute the differences discussed, especially for ratio 1:10. The conclusion obtained from this focused evaluation, is that even in a lap where the driver managed to achieve the best possible lap time and velocity profile, a lower gear ratio would provide 2.4% benefits on energy consumption. In contrast, a higher gear ratio would result to 4.6% higher power demand. It is clear that an optimal gear ratio choice would therefore improve an electric vehicle’s consumption and it should be carefully chosen.

4.3. Sustainability Issues

The aforementioned results revealed that when using a single-speed gearbox in an electric vehicle, several benefits of reduced energy consumption can be achieved by an optimal gear ratio use. In this section, we consider the effects of this reduction in the sustainability of electric vehicles, considering the reduction of power from the change of gear ratio as well as from the driving style. As presented in Section 4, our vehicle has an average energy consumption of 230.85 Watt (0.231 KW), the time in the racetrack was 2238.5 s and the distance covered was 15.5 Km. These values correspond to an energy consumption of 0.371 KWh for the specific prototype vehicle and considering the distance covered, this equals to 0.0239 KWh/Km. These values are far lower than current production vehicles, considering that it is a very low weight prototype vehicle. From the results presented in Section 4.1, the use of gear ratio 1:6 provides 2.6% lower mean energy consumption compared to gear ratio 1:8. Moreover, the aggressiveness of the driver or else the driving style, has a considerable effect in electric vehicle energy consumption. Based on the simulation results presented in Table 4 for the 1:8 gear ratio, the best lap achieved in the track (Lap 5) shows a 7.6% reduction (211.84 W), in respect to 230.85 W mean energy consumption for the 10 laps. Moreover, if an optimal gear ratio is used, this would provide an additional 2.4% reduction of energy consumption (Table 5), which results to a total reduction of 10.4%. Thus combining an economy driving style and an optimal gear ratio would achieve 10.4% reduction required by the power grid for electric vehicle’s charging.
In order to make a projection of this effect on sustainability, we consider the total annual energy demand from transport for EU-28 [44], which presents three different penetration scenarios of Battery Electric Vehicles (BEVs) for year 2050. The Reference scenario considers an 8% EVs share in 2050, while the Medium 50% and High scenarios 80%. The annual power generation demand for charging of electric vehicles, is assumed 57 TWh, 283 TWh and 448 TWh for the three scenarios respectively [44]. Furthermore, in this work we focused on single-speed transmissions for EVs. Thus we should distinguish the single-speed transmission EVs from the total fleet. The key findings for the 2019 EV transmission market in EU [
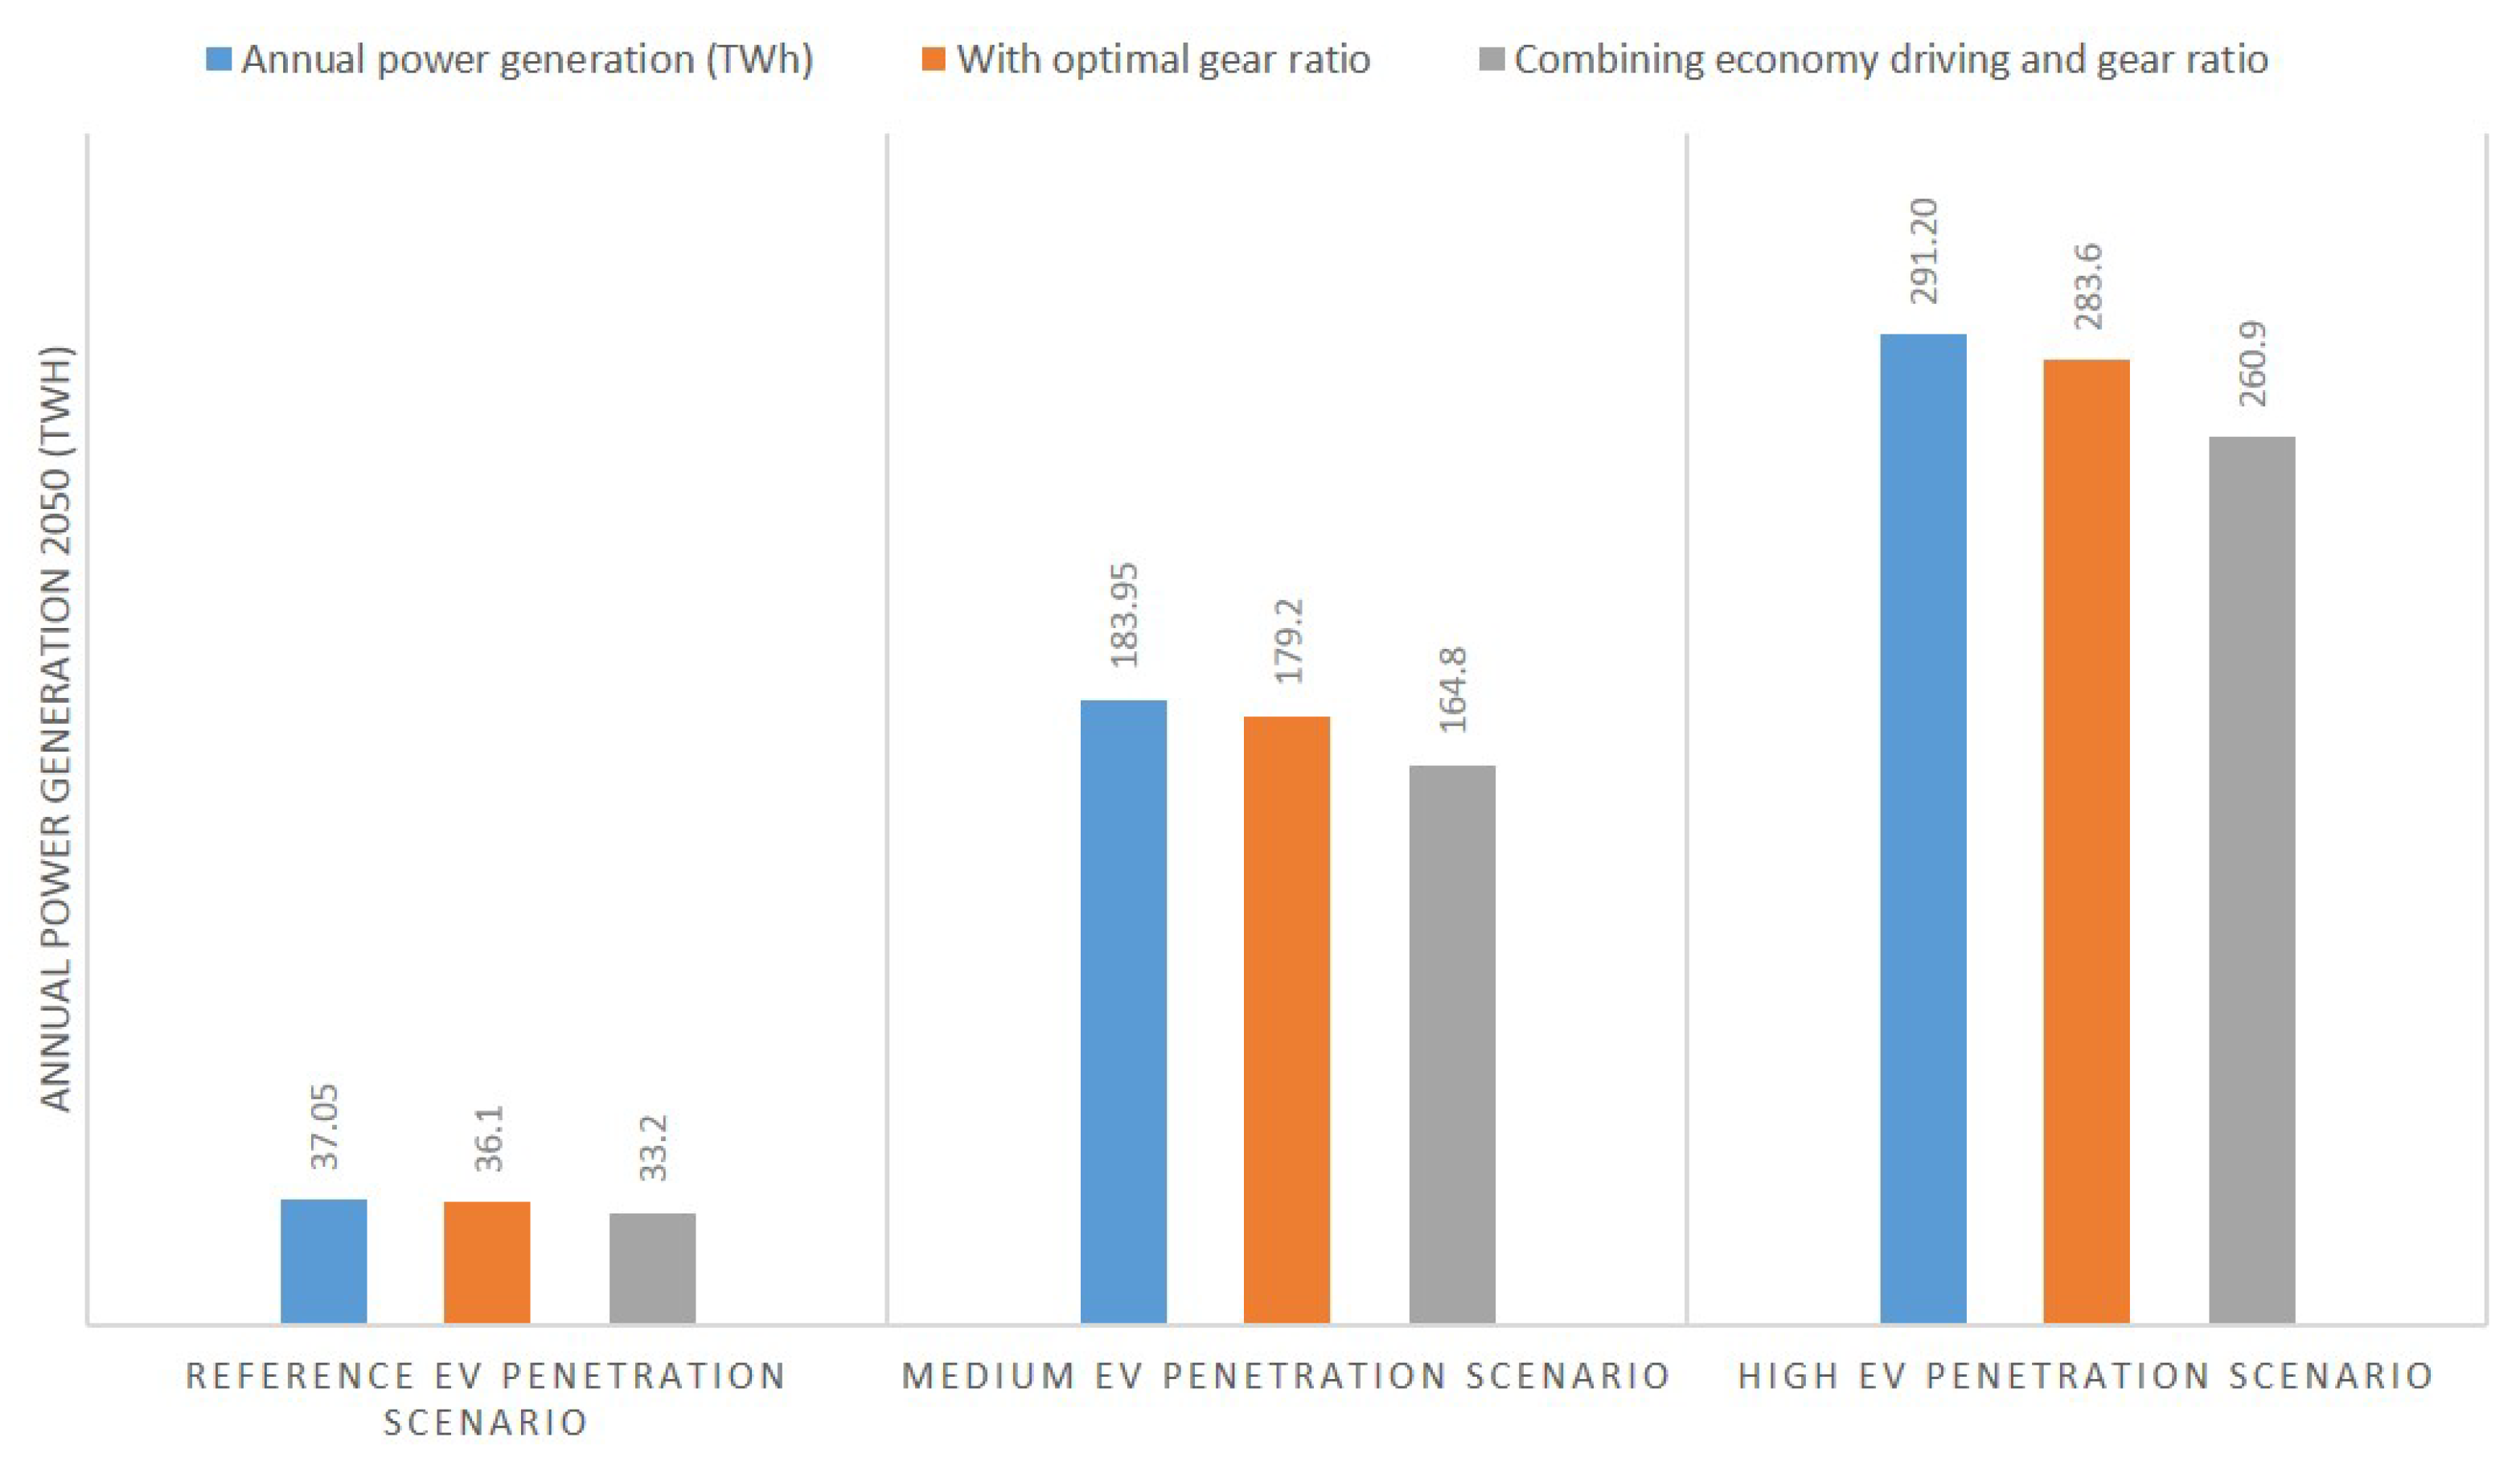
45], conclude that single speed transmissions have an 80% market share of EVs sold. Since we could not find a projection of their sales for 2050, we assume that technology advances will decrease their share, but due to low cost they will remain dominant in the market. As so, for our brief study presented here we assume a 65% market share for 2050, whereas the annual power generation demand for charging of electric vehicles that can be effected by our gear ratio findings, are now assumed 37.05 TWh, 183.95 TWh, and 291.20 TWh for the three scenarios. The effects of 2.6% energy reduction from optimal gear ratio and 10.4% by the combination of economy driving and optimal gear ratio, on the annual power generation demand for 2050, are presented in Figure 9. It is evident that for higher EV market penetration there are higher energy benefits. Of course, this reduction of energy demand from the power grid will have economical and environmental benefits. The economic impacts reflect to lower additional power generation for vehicle’s charging and the environmental to lower CO 2 emissions from the power generation.

5. Discussion

Energy consumption of electric vehicles is a major research topic for the automotive industry, but also extends to the related infrastructure and its impact towards a sustainable future. The use of a gearbox in electric cars is also a highly discussed subject, directly related to driving performance and energy consumption. In this work, the main scope was to explore the effects of gear ratio choice when a single-speed gearbox is installed on an electric vehicle. For this purpose, a prototype electric vehicle developed by our research team was used and numerous experimental tests were conducted. The experimental data gathered were then used to fine-tune a valid dynamic simulation model, which was set up on CarMaker commercial software. The final simulation model was compared to experimental results, where a mean difference of 0.4% was found for the ten laps in the racetrack. As so, it was confirmed that our model was adequate for further experimentation on the energy consumption of the specific vehicle.
As a next step, alternative gear ratios were defined (1:6, 1:10) and used, targeting the evaluation of their effects on the vehicle’s energy consumption. We chose these limits to have an equal difference from the standard gear ratio (1:8), so that their effects in energy consumption would be evident and useful. Using simulation results for the 10 laps, the mean energy consumption was calculated at 224.81 W and 240.93 W for gear ratio 1:6 and 1:10 respectively. Compared to ratio 1:8 (230.85 W), ratio 1:6 provided 2.6% lower mean consumption and ratio 1:10, 4.2% higher. A second test case explored: the effects of these ratios on the best lap completed in the racetrack, which corresponds to the best driving profile achieved by the driver, that provided the lowest energy consumption. In this case, the simulation results showed that using ratio 1:6 a 2.4% lower consumption would be achieved, while with ratio 1:10 a 4.6% higher consumption would occur. If just the effects of driving style are considered, then the best lap shows a 7.6% energy reduction compared to the mean energy consumption of the 10 laps.
Based on the above, the following important insights are evident. (a) Lower gear ratios offer higher potentials to minimize energy consumption, as it is less effected by sudden velocity changes (that occur in higher ratios) due to the fact the driver is limited to perform more smooth accelerations. (b) Velocity profile is a major factor affecting energy consumption while lap time should also be considered but has a lower effect. (c) Even if an ideal velocity profile is achieved by an economy driving style, a lower gear ratio provides additional energy consumption benefits.
The work presented, highlighted that an optimal gear ratio choice, for an electric vehicle equipped with a single-speed gearbox, would improve the energy consumption and it should be carefully chosen. Moreover, according to experimental and simulation results, the lowest possible gear ratio would be the best choice towards highest energy consumption benefits. Even if the percentage of these benefits is not very high, it is a strong indication of the operation that single-speed electric vehicles should target, towards a sustainable future. To the best of our knowledge, limited literature exists on the effects of gear ratios for a single-speed electric vehicle and therefore the results presented can be a useful insight for further research. Our future target will be to develop a certain methodology, that can combine simulation and experimental results and calculate the optimal gear ratio applicable for a specific electric vehicle.

Author Contributions

Conceptualization, P.S. and G.M.; methodology, P.S., G.M., T.S., and L.D.; software, G.M. and T.S.; validation, P.S. and S.P.; investigation, N.S., E.P., and I.I.; data curation, N.S.; writing—original draft preparation, P.S., G.M., T.S., and N.S.; writing—review and editing, P.S., L.D., and N.C.T.; visualization, P.S., L.D., and G.M.; supervision, N.C.T. All authors have read and agreed to the published version of the manuscript.

Funding

This work has been partially funded by the TUC’s internal project “TUC Eco Racing team”.

Acknowledgments

The authors would like to acknowledge IPG Automotive for providing the software licenses and supporting the TUC Eco Racing Team efforts.

Conflicts of Interest

The authors declare no conflict of interest.

References

  1. Yuksel, T.; Michalek, J.J. Effects of Regional Temperature on Electric Vehicle Efficiency, Range, and Emissions in the United States. Environ. Sci. Technol. 2015, 49, 3974–3980. [Google Scholar] [CrossRef] [PubMed]
  2. Luin, B.; Petelin, S.; Al-Mansour, F. Microsimulation of electric vehicle energy consumption. Energy 2019, 174, 24–32. [Google Scholar] [CrossRef]
  3. Xie, Y.; Li, Y.; Zhao, Z.; Dong, H.; Wang, S.; Liu, J.; Guan, J.; Duan, X. Microsimulation of electric vehicle energy consumption and driving range. Appl. Energy 2020, 267, 115081. [Google Scholar] [CrossRef]
  4. Yao, E.; Yang, Z.; Song, Y.; Zuo, T. Comparison of Electric Vehicle’s Energy Consumption Factors for Different Road Types. Discret. Dyn. Nat. Soc. 2013, 13. [Google Scholar] [CrossRef]
  5. Croce, A.I.; Musolino, G.; Rindone, C.; Vitetta, A. Energy consumption of electric vehicles: Models’ estimation using big data (FCD). Transp. Res. Procedia 2020, 47, 211–218. [Google Scholar] [CrossRef]
  6. Younes, Z.; Boudet, L.; Suard, F.; Gérard, M.; Rioux, R. Analysis of the main factors influencing the energy consumption of electric vehicles. In Proceedings of the 2013 International Electric Machines Drives Conference, Chicago, IL, USA, 12–15 May 2013; pp. 247–253. [Google Scholar]
  7. Carlson, R.; Shirk, M.G.; Geller, B.M. Factors Affecting the Fuel Consumption of Plug-In Hybrid Electric Vehicles. In Proceedings of the 25th World Battery, Hybrid and Fuel Cell Electric Vehicle Symposium & Exhibition, Shenzhen, China, 5–9 November 2010. [Google Scholar]
  8. Global Lightweight Car Market (2019–2024); Technical Report; Mordor Intelligence: Telangana, India, 2019.
  9. Reiland, J.; Bax, L.; Ierides, M.; Hielscher, C.; Toelle, J.; Bohner, F.; Lopez, I.; Pipino, A.; Daniele Bassan, D.P.; Storer, D.; et al. A Vision on the Future of Automotive Ligwthweighting: Accelerating the Decarbonisation of Automotive Mobility by Means of Lightweighting. Technical Report; H2020 Alliance Project. 2020. Available online: http://lightweight-alliance.eu/wp-content/uploads/2019/11/alliance_vision-document.pdf (accessed on 29 October 2020).
  10. Goede, M.; Stehlin, M.; Rafflenbeul, L.; Kopp, G.; Beeh, E. Super Light Car—Lightweight construction thanks to a multi-material design and function integration. Eur. Transp. Res. Rev. 2009, 1, 5–10. [Google Scholar] [CrossRef] [Green Version]
  11. Huluka, A.W.; Kim, C.H. Numerical study on aerodynamic drag reduction and energy harvest forelectric vehicle: A concept to extend driving range. In Proceedings of the 2nd Conference of Computational Methods in Offshore Technology and First Conference of Oil and Gas Technology (COTech & OGTech 2019), Stavanger, Norway, 27–29 November 2019. [Google Scholar]
  12. Yang, Z.F.; Li, S.H.; Liu, A.M.; Yu, Z.; Zeng, H.J.; Li, S.W. Simulation study on energy saving of passenger car platoons based on DrivAer model. Energy Sources Part A 2019, 41, 3076–3084. [Google Scholar] [CrossRef]
  13. Tzortzis, G.; Amargianos, A.; Piperidis, S.; Koutroulis, E.; Tsourveloudis, N.C. Development of a compact regenerative braking system for electric vehicles. In Proceedings of the 2015 23rd Mediterranean Conference on Control and Automation (MED), Torremolinos, Spain, 16–19 June 2015; pp. 102–108. [Google Scholar]
  14. Petrou, A.K.; Efstathiou, D.S.; Tsourveloudis, N.C. Modeling and control of the energy consumption of a prototype urban vehicle. In Proceedings of the 2011 19th Mediterranean Conference on Control Automation (MED), Corfu, Greece, 20–23 June 2011; pp. 44–48. [Google Scholar]
  15. Hofman, T.; Dai, C.H. Energy efficiency analysis and comparison of transmission technologies for an electric vehicle. In Proceedings of the 2010 IEEE Vehicle Power and Propulsion Conference, Lille, France, 1–3 September 2010; pp. 1–6. [Google Scholar]
  16. Spanoudakis, P.; Tsourveloudis, N.C.; Koumartzakis, G.; Krahtoudis, A.; Karpouzis, T.; Tsinaris, I. Evaluation of a 2-speed transmission on electric vehicle’s energy consumption. In Proceedings of the 2014 IEEE International Electric Vehicle Conference (IEVC), Florence, Italy, 17–19 December 2014; pp. 1–6. [Google Scholar]
  17. Xi, J.-q.; Xiong, G.-m.; Zhang, Y. Application of automatic manual transmission technology in pure electric bus. In Proceedings of the 2008 IEEE Vehicle Power and Propulsion Conference, Harbin, China, 3–5 September 2008; pp. 1–4. [Google Scholar]
  18. Spanoudakis, P.; Tsourveloudis, N.C. On the efficiency of a prototype continuous variable transmission system. In Proceedings of the 21st Mediterranean Conference on Control and Automation, Chania, Greece, 25–28 June 2013; pp. 290–295. [Google Scholar]
  19. Spanoudakis, P.; Tsourveloudis, N.C. A Prototype Variable Transmission System for Electric Vehicles: Energy Consumption Issues. Int. J. Automot. Technol. 2015, 16, 525–537. [Google Scholar] [CrossRef]
  20. Ehsani, M.; Gao, Y.; Emadi, A. Modern Electric, Hybrid Electric and Fuel Cell Vehicles: Fundamentals, Theory, and Design; CRC Press LLC: Boca Raton, FL, USA, 2010. [Google Scholar]
  21. Kluger, M.A.; Long, D.M. An Overview of Current Automatic, Manual and Continuously Variable Transmission Efficiencies and Their Projected Future Improvements; SAE Technical Paper Series; SAE International: Warrendale, PA, USA, 1999. [Google Scholar]
  22. Spanoudakis, P. Design and Tuning of Operational Parameters for a Prototype Transmission System. Ph.D. Thesis, Technical University of Crete, Chania, Greece, 2013. [Google Scholar]
  23. Holdstock, T. Investigation into Multiple-Speed Transmissions for Electric Vehicles. Ph.D. Thesis, University of Surrey, Guildford, UK, 2014. [Google Scholar]
  24. Mantriota, G. Fuel consumption of a vehicle with power split CVT system. Int. J. Veh. Des. 2005, 37, 327. [Google Scholar] [CrossRef]
  25. Zhang, Z.; Zuo, C.; Hao, W.; Zuo, Y.; Zhao, X.L.; Zhang, M. Three-speed transmission system for purely electric vehicles. Int. J. Automot. Technol. 2013, 14, 773–778. [Google Scholar] [CrossRef]
  26. Bottiglione, F.; Pinto, S.D.; Mantriota, G.; Sorniotti, A. Energy Consumption of a Battery Electric Vehicle with Infinitely Variable Transmission. Energies 2014, 7, 8317–8337. [Google Scholar] [CrossRef] [Green Version]
  27. Bingzhao, G.; Qiong, L.; Lulu, G.; Hong, C. Gear ratio optimization and shift control of 2-speed I-AMT in electric vehicle. J. Mech. Syst. Signal Process. 2015, 50, 615–631. [Google Scholar]
  28. Sorniotti, A.; Pilone, G.L.; Viotto, F.; Bertolotto, S.; Everitt, M.; Barnes, R.; Morrish, I. A Novel Seamless 2-Speed Transmission System for Electric Vehicles: Principles and Simulation Results. SAE Int. J. Engines 2011, 4, 2671–2685. [Google Scholar] [CrossRef]
  29. Elmarakbi, A.; Morris, A.; Ren, Q.; Elkady, M. Modelling and Analyzing Electric Vehicles with Geared Transmission Systems: Enhancement of Energy Consumption and Performance. Int. J. Eng. Res. Technol. 2013, 2, 1215–1254. [Google Scholar]
  30. Sorniotti, A.; Subramanyan, S.; Turner, A.; Cavallino, C.; Viotto, F.; Bertolotto, S. Selection of the Optimal Gearbox Layout for an Electric Vehicle. SAE Int. J. Engines 2011, 4, 1267–1280. [Google Scholar] [CrossRef]
  31. Rinderknecht, S. Electric power train configurations and their transmission systems. In Proceedings of the International Symposium on Power Electronics Electrical Drives Automation and Motion (SPEEDAM), Pisa, Italy, 14–16 June 2010; pp. 1564–1568. [Google Scholar]
  32. Knödel, U.; Stube, A.; Blessing, U.C.; Klosterman, S. Design and Implementation of requirement-driven electric drives. ATZ Worldw. 2010, 112, 56–60. [Google Scholar] [CrossRef]
  33. Ren, Q.; Crolla, D.; Morris, A. Effect of transmission design on Electric Vehicle (EV) performance. In Proceedings of the 2009 IEEE Vehicle Power and Propulsion Conference, Dearborn, MI, USA, 7–10 September 2009; pp. 1260–1265. [Google Scholar] [CrossRef] [Green Version]
  34. Spanoudakis, P.; Tsourveloudis, N.C.; Doitsidis, L.; Karapidakis, E.S. Experimental Research of Transmissions on Electric Vehicles’ Energy Consumption. Energies 2019, 12, 388. [Google Scholar] [CrossRef] [Green Version]
  35. Sarantinoudis, N.; Spanoudakis, P.; Doitsidis, L.; Stefanoulis, T.; Tsourveloudis, N. A study of electric vehicle prototype for shell eco-marathon. In Proceedings of the 10th Workshop on Planning, Perception and Navigation for intelligent Vehicles, 2018 IEEE/RSJ International conference on Intelligent Robots and Systems, Madrid, Spain, 1 October 2018. [Google Scholar]
  36. IPGDriver. User Manual, version 6.3; IPG Automotive GmbH: Karlsruhe, Germany, 2006. [Google Scholar]
  37. Liu, K.; Wanga, J.; Yamamoto, T.; Morikawa, T. Modelling the multilevel structure and mixed effects of the factors influencing the energy consumption of electric vehicles. Appl. Energy 2016, 183, 1351–1360. [Google Scholar] [CrossRef]
  38. Pacejka, H. Tire and Vehicle Dynamics, 3rd ed.; Elsevier Health Sciences: Amsterdam, The Netherlands, 2012. [Google Scholar]
  39. Spetler, F.; Blanco, O. Tametire 3.0; Technical Report; Michelin: Clermont-Ferrand, France, 2014. [Google Scholar]
  40. Sponziello, A.; Frendo, F.; Guiggiani, M. Stability analysis of a three-wheeled motorcycle. SAE Int. J. Eng. 2009, 1, 1396–1401. [Google Scholar] [CrossRef]
  41. Terada, K.; Sano, T.; Watanabe, K.; Kaieda, T.; Takano, K. Investigation of the behavior of three-wheel vehicles when they pass over a low road surface. In Proceedings of the Small Engine Technology Conference, Charleston, SC, USA, 15–17 November 2016. [Google Scholar]
  42. Lambourn, R.A. Comparison of Motorcycle and Car Tyre/Road Friction; Technical Report; TRL Limited: Crowthorne, UK, 2010. [Google Scholar]
  43. Limpert, R. Brake Design and Safety, Third Edition; SAE International: Warrendale, PA, USA, 2011. [Google Scholar]
  44. Kasten, P.; Bracker, J.; Haller, M.; Purwanto, J. Electric Mobility in Europe—Future Impact on the Emissions and the Energy Systems; Technical Report; Institute for Applied Ecology: Breisgau, Germany, 2016. [Google Scholar]
  45. Global Electric Vehicle Transmission Market 2019–2025; Technical Report; Mobility Foresights Automotive: Bengaluru, India, 2020.
Figure 1. The prototype vehicle “Spyros Louis” in the racetrack.
Sustainability 12 09254 g001
Figure 2. Testbed vehicle powertrain setup.
Sustainability 12 09254 g002
Figure 3. On-road vehicle testing routes.
Sustainability 12 09254 g003
Figure 4. Competition track and related specifications used for road tests.
Sustainability 12 09254 g004
Figure 5. Simulation results of power consumption for ten laps in the racetrack, using 1:8 gear ratio.
Sustainability 12 09254 g005
Figure 6. Comparison of mean energy consumption simulation results for the three different gear ratios (1:6, 1:8, 1:10).
Sustainability 12 09254 g006
Figure 7. Lap 5 (best lap) velocity profile.
Sustainability 12 09254 g007
Figure 8. Energy consumption of every gear ratio (1:6, 1:8, 1:10) in the best lap simulation.
Sustainability 12 09254 g008
Figure 9. Effects of total annual energy reduction, using optimal gear ratio or combination of economy driving and optimal gear ratio, for a projection of power generation for 2050.
Sustainability 12 09254 g009
Table 1. Vehicle specifications.
BodyCarbon fiber
ChassisAluminum—carbon fiber
MotorBrushless electric motor
Max motor torque5 Nm
Max motor RPM5200 RPM
Power sourceBattery pack 0.96 KWh
Dimensions2.5 × 1.25 × 1 m (L × W × H)
Max speed40 Km/h
Weight77 kg (excl. Driver)
Table 2. Experimental results of 10 laps in the racetrack, using a 1:8 gear ratio.
LapTime (s)Consumption Experimental (W)
1237.5205.12
2221.5247.45
3213.5259.45
4221.5222.90
5229213.32
6236.5219.51
7214239.95
8216.5242.35
9215244.31
10233.5202.85
Table 3. Experimental and simulation results of 10 laps in the racetrack, using a 1:8 gear ratio.
LapTime (s)Consumption Experimental (W)Consumption Simulation (W)Consumption Difference (%)Motor Efficiency (%)
1237.5205.12221.607.44%86.86%
2221.5247.45238.01−3.96%87.75%
3213.5259.45246.94−5.06%87.82%
4221.5222.90241.497.70%88.35%
5229213.32211.84−0.70%89.07%
6236.5219.51212.35−3.37%88.10%
7214239.95249.453.81%88.09%
8216.5242.35230.30−5.23%88.14%
9215244.31246.720.98%88.26%
10233.5202.85209.893.35%87.28%
Table 4. Simulation results of 10 laps in the racetrack, using a 1:6 gear ratio.
LapTime (s)Mean Energy Consumption of Ratio 1:8 (W)Mean Energy Consumption of Ratio 1:6 (W)Consumption Difference (%)
1237.5221.60215.85−2.66%
2221.5238.01230.26−3.37%
3213.5246.94239.03−3.31%
4221.5241.49233.83−3.28%
5229211.84206.79−2.44%
6236.5212.35207.14−2.52%
7214249.45241.30−3.38%
8216.5230.30233.241.26%
9215246.72237.82−3.74%
10233.5209.89202.84−3.48%
Table 5. Simulation results of 10 laps in the racetrack, using a 1:10 gear ratio.
LapTime (s)Mean Energy Consumption of Ratio 1:8 (W)Mean Energy Consumption of Ratio 1:10 (W)Consumption Difference (%)
1237.5221.60229.433.41%
2221.5238.01247.223.73%
3213.5246.94257.394.06%
4221.5241.49245.271.54%
5229211.84222.124.63%
6236.5212.35222.964.76%
7214249.45266.716.47%
8216.5230.30252.958.95%
9215246.72249.881.26%
10233.5209.89215.412.56%
Table 6. Simulation results of gear ratios 1:6, 1:8, and 1:10, for the best lap (lap 5) on the racetrack.
Gear RatioSimulation (W)Consumption Difference (%)
1:6206.79−2.4%
1:8211.840%
1:10222.124.6%
Publisher’s Note: MDPI stays neutral with regard to jurisdictional claims in published maps and institutional affiliations.

