Visitors’ Preferences on the Characteristics of Bogor Botanical Gardens


1
Master Program of Economic Planning and Public Policy, Universitas Indonesia, Jakarta City 10430, Indonesia
2
Department of Economics, Universitas Indonesia, Depok City 16424, Indonesia
3
School of Environmental Science, Universitas Indonesia, Jakarta City 10430, Indonesia
*
Author to whom correspondence should be addressed.
Sustainability 2020, 12(22), 9489; https://0-doi-org.brum.beds.ac.uk/10.3390/su12229489
Submission received: 22 July 2020
/
Revised: 9 November 2020
/
Accepted: 10 November 2020
/
Published: 14 November 2020
(This article belongs to the Section Tourism, Culture, and Heritage)
Abstract
:This study aims to estimate the economic benefits of the Bogor Botanical Gardens (BBG) in terms of willingness to pay (WTP) and, using the estimation, to make a scenario of the entrance fee. Data were collected through a survey among 414 local visitors using the travel cost method (TCM) and choice modeling method (CM). The result from the TCM reveals that travel cost, gender, and education significantly affect the number of visits to the BBG. The value of consumer surplus amounts to IDR 582,072 (USD 40.90) and the total value of benefits obtained is IDR 728.8 billion (USD 51.21 million) per year. Meanwhile, the CM result shows that compensating surplus is estimated at IDR 19,704 (USD 1.38) and the total value of benefits is IDR 24.67 billion (USD 1.73 million) per year. The CM shows that the attributes of service cars as well as information and environmental educational tools and infrastructure have positive and significant values to the visitors. Thus, there is a potential to increase the entrance fee for tourists to become IDR 20,629 (USD 1.45) per visit. Through the increase in entrance fee, the BBG could generate a potential revenue of IDR 25.83 billion (USD 1.81 million) per year, which can improve the number of plant species, information and environmental educational tools and infrastructures, and service cars inside the BBG.
1. Introduction
Botanical gardens have an important function in preserving biodiversity. Botanical gardens, which are generally located in urban spaces, re-connect nature and humans and become a part of the urban ecosystem. This makes botanical gardens have various values—not only ecological but also social, economic, and cultural values [1]. Unlike primary forests, botanical gardens are an effort to conserve biodiversity by man-made methods. They are designed for multiple purposes, such as education, research, recreation, and conservation. Therefore, botanical gardens have a very important role and a high value for nature and humans. As mentioned by [2], botanical gardens are defined as ‘institutions holding documented collections of living plants for purposes of scientific research, conservation, display, and education’.
The Convention on Biological Diversity (CBD) has set a plant conservation strategy through the Global Strategy for Plant Conservation (GSPC) which was approved by 187 countries [3]. To support the strategy, Botanical Gardens Conservation International (BGCI) developed a framework for botanical gardens to contribute a major role in achieving the target of the GSPC through the International Agenda for Botanical Gardens in Conservation. The agenda focuses on four agendas: avoiding biodiversity loss, raising awareness, landscape management, and plant conservation promotion [3]. The GSPC targets include not only the ecological aspect but also the human ecological relation by addressing education and awareness on plant diversity and its role in sustainable livelihood [4]. One of the human ecological relations promoted by botanical gardens is revealed in the form of recreational activity. The recreational values embraced by visitors of botanical gardens are often not limited only to the ecological value of the botanical gardens but also include social, cultural, and educational values [5].
Globally, there are 3686 botanical gardens registered in the BGCI database, and in South East Asia, there are 70 botanical gardens registered [6]. Taking the case of Indonesia, only five botanical gardens registered in the BGCI database. However, the national database shows a higher number of botanical gardens which reached 37, with a total area of 5139 hectares [7], spreading across provinces, districts, cities, and universities. Bogor Botanical Gardens (BBG) is the oldest one in the country and even in South East Asia. The area of BBG spans 75.4 hectares. BBG manages one of the most complete germplasm collections in South East Asia [8]. As of December 2018, BBG has a collection of 12,141 plant specimens consisting of 3156 species of plants (not including a collection of orchids). BBG has a collection of old, large, hundreds of years old trees that are increasingly difficult to find in Indonesia’s forests. In general, the BBG plant collections are rare plants with economic and iconic values. In addition to plant collections, BBG also presents beautiful natural scenery as well as a cool and comfortable atmosphere, buildings and objects of cultural heritage, landscapes, as well as thematic parks that can attract more visitors. The number of visitors to BBG in 2016 reached 1.43 million visitors, not to mention an additional 662,000 visitors to the Bogor Palace that is located in the same area as BBG [9]. This makes the BBG not only the most popular recreational site in the Bogor Area, but also compared to other botanical gardens in Indonesia, such as the Bali Botanical Garden, the Cibodas Botanical Garden, and the Purwodadi Botanical Garden [10]. The number of visitors of BBG is quite volatile, with the number of visitors decreasing by 7% in 2016 and increasing by about 32% the next year, generating an average number of visitors as one million people/year for the last five years.
The increase in the number of visitors has the potential to cause damage to the ecosystems and the environment. This is apparent in the trees that have become less shady and in the fauna population that is declining [8]. In the last 4 years, the number of cars allowed to enter has increased by 48% from 46.7 thousand in 2014 to 89.5 thousand in 2017. This is compounded by the development of the city of Bogor, which is centered around the BBG area. The density and traffic congestion around BBG cause pollution levels to increase. In addition, the exploitation of groundwater carried out by hotels and malls surrounding BBG has caused damage to the plants.
In the last twenty years, the number of plant collection species has decreased by 26.74%, from 4300 in 1980 to 3150 in 2018. This is attributable to pests, diseases, and natural disasters, such as strong winds. In 2017, one of the 600 oldest plant collections, a 194-year-old lychee tree, fell due to a buildup of termites. Many interesting, large, and old trees suffer from damage such as open roots, decaying stems, and broken branches. This damage can cause trees to fall and harm the people nearby [11]. While the establishment of BBG itself pursues the objective of conservation, the current practice of the utilization of ecosystem services provided by the BBG in the form of tourism services threatens the sustainability of the BBG as a conservation site.
The visitation rate is considered high, which could be a potential source of revenue for BBG. However, this could lead to an ecological risk and reduce the ecosystem services provided to the visitors and the surroundings. The mission is, then, how to harmonize both the source of revenue and the capacity of BBG in providing ecological services that include preservation of plant collections, landscapes and natural resources, buildings and historic objects, and animals. The potential additional revenue can meet both economic and conservation objectives which are in line with the framework of sustainability.
Currently, the revenue is unable to cover the costs to manage all BBG operations. One source of BBG revenue comes from the entrance fee. Yet, since 2012, there has been no significant increase in the entrance fee. Based on Government Regulation number 32 of 2016, the entrance fees are fixed at IDR 15,000 (USD 1.05) (USD 1 was around IDR 14,231 in 2018) for local tourists and IDR 25,000 (USD 1.76) for foreign tourists. However, after deducting the insurance and other cost components, such as the Zoological Museum entrance fee, Bogor City Government levies, and donations to the Indonesian Red Cross (Palang Merah Indonesia (PMI)), BBG only receives IDR 10,000 (USD 0.70) from each local tourist and IDR 20,000 (USD 1.40) from each foreign tourist. The amount is still cheaper than that of other botanical gardens in other countries, such as the Singapore Botanical Garden that charges SGD 5, and the Nong Nooch Tropical Garden in Thailand that charges THB 100. The current BBG entrance fee is considered too low compared to the benefits gained by the visitors. The absence of the estimated value of the recreation and other ecological services BBG offers leads to the underestimation by stakeholders of the importance to improve the BBG’s management.
Previous research provides an estimation of the suggested entrance fee for the Malaysian Penang Botanic Garden attraction [12]. The study, which applies the travel cost method (TCM), reveals that most respondents are willing to pay more if the funds collected are used to improve the management of the botanical garden. Similar results were produced in a study by [13] in Malaysia’s Endau Rompin National Park (ERNP). Improved conservation and management increase the value of the site as perceived by the visitors. The study recommends that the revenue gathered from the entrance fee can be increased to finance conservation initiatives and reduce visitor density.
In the BBG, the research by [14] shows that respondents prefer finding places with impressive objects that will encourage them to enjoy the surrounding scenery to viewing displays of plants for biodiversity and educational purposes. The biodiversity services provided by the BBG indirectly impact the beauty of the recreational area. This implies that the management needs to harmonize both the conservation efforts and the beauty of the landscape to increase the value of the BBG.
Many studies have successfully estimated the potential increase in the entrance fee of botanical gardens that can support the improvement of BBG [13,15,16,17]. The potential to increase the entrance fee can be seen in the willingness to pay (WTP) by the visitors. The general visitors’ perspective in looking at the value of BBG may differ from that of specific users, such as students or researchers, and it will impact the perceived value of each BBG characteristic and function.
Different studies use different methods in estimating the WTP for ecosystem services provided by botanical garden. The typical objective of the use of the TCM intends to estimate the potential of increasing entrance fee to finance the botanical garden management, such as the studies conducted by [13,17]. Other methods, such as the contingent valuation method (CVM), try to estimate the WTP of the visitors for just one hypothetical scenario of botanical garden improvement, for example, the study of [18].
However, botanical garden management sometimes needs more detailed information on what features or attributes of the garden need to be improved. The CVM cannot provide this kind of information, but the choice modeling method (CM) does [19]. Thus, the CM method is an extended version of the CVM which allows us to reveal the WTP of the visitors for each attribute of the botanical garden that we are interested in looking for.
The use of two methods in economic valuation to estimate the WTP for the botanical garden can be found in the studies of [17,18]. Both studies used TCM and CVM. Looking at the advantages of CM for improving botanical garden management, we are challenged to use a combination of methods by using the TCM and CM. To date, we hardly found any studies on botanical garden ecosystem services’ valuation that use both methods.
This study aims to estimate the economic benefits of recreational services provided by BBG from the perspective of visitors. The economic benefit is estimated through the elicitation of the visitors’ WTP using two methods: the TCM and CM. From the TCM, we can estimate the potential increase in the entrance fee that can be used for quality improvement of BBG management, while from the CM method, we can estimate the value of each attribute of the BBG perceived by the visitors to make improvements to the BBG that are more related to the visitors’ preferences.
2. Literature Review: Economic Valuation of Botanical Garden Environmental Services
This section identifies a theoretical background related to the value of ecosystem services provided by the botanical garden using the framework of total economic value (TEV). Botanical gardens provide valuable environmental services, involving ecological, economic, social, and cultural values. As most of these benefits are intangible, we can hardly estimate the value of these services using a market price [20]. Based on the environmental economic perspective, we can estimate these values in monetary terms using the economic valuation method [21] and identify the value of the benefit using the TEV approach [22].
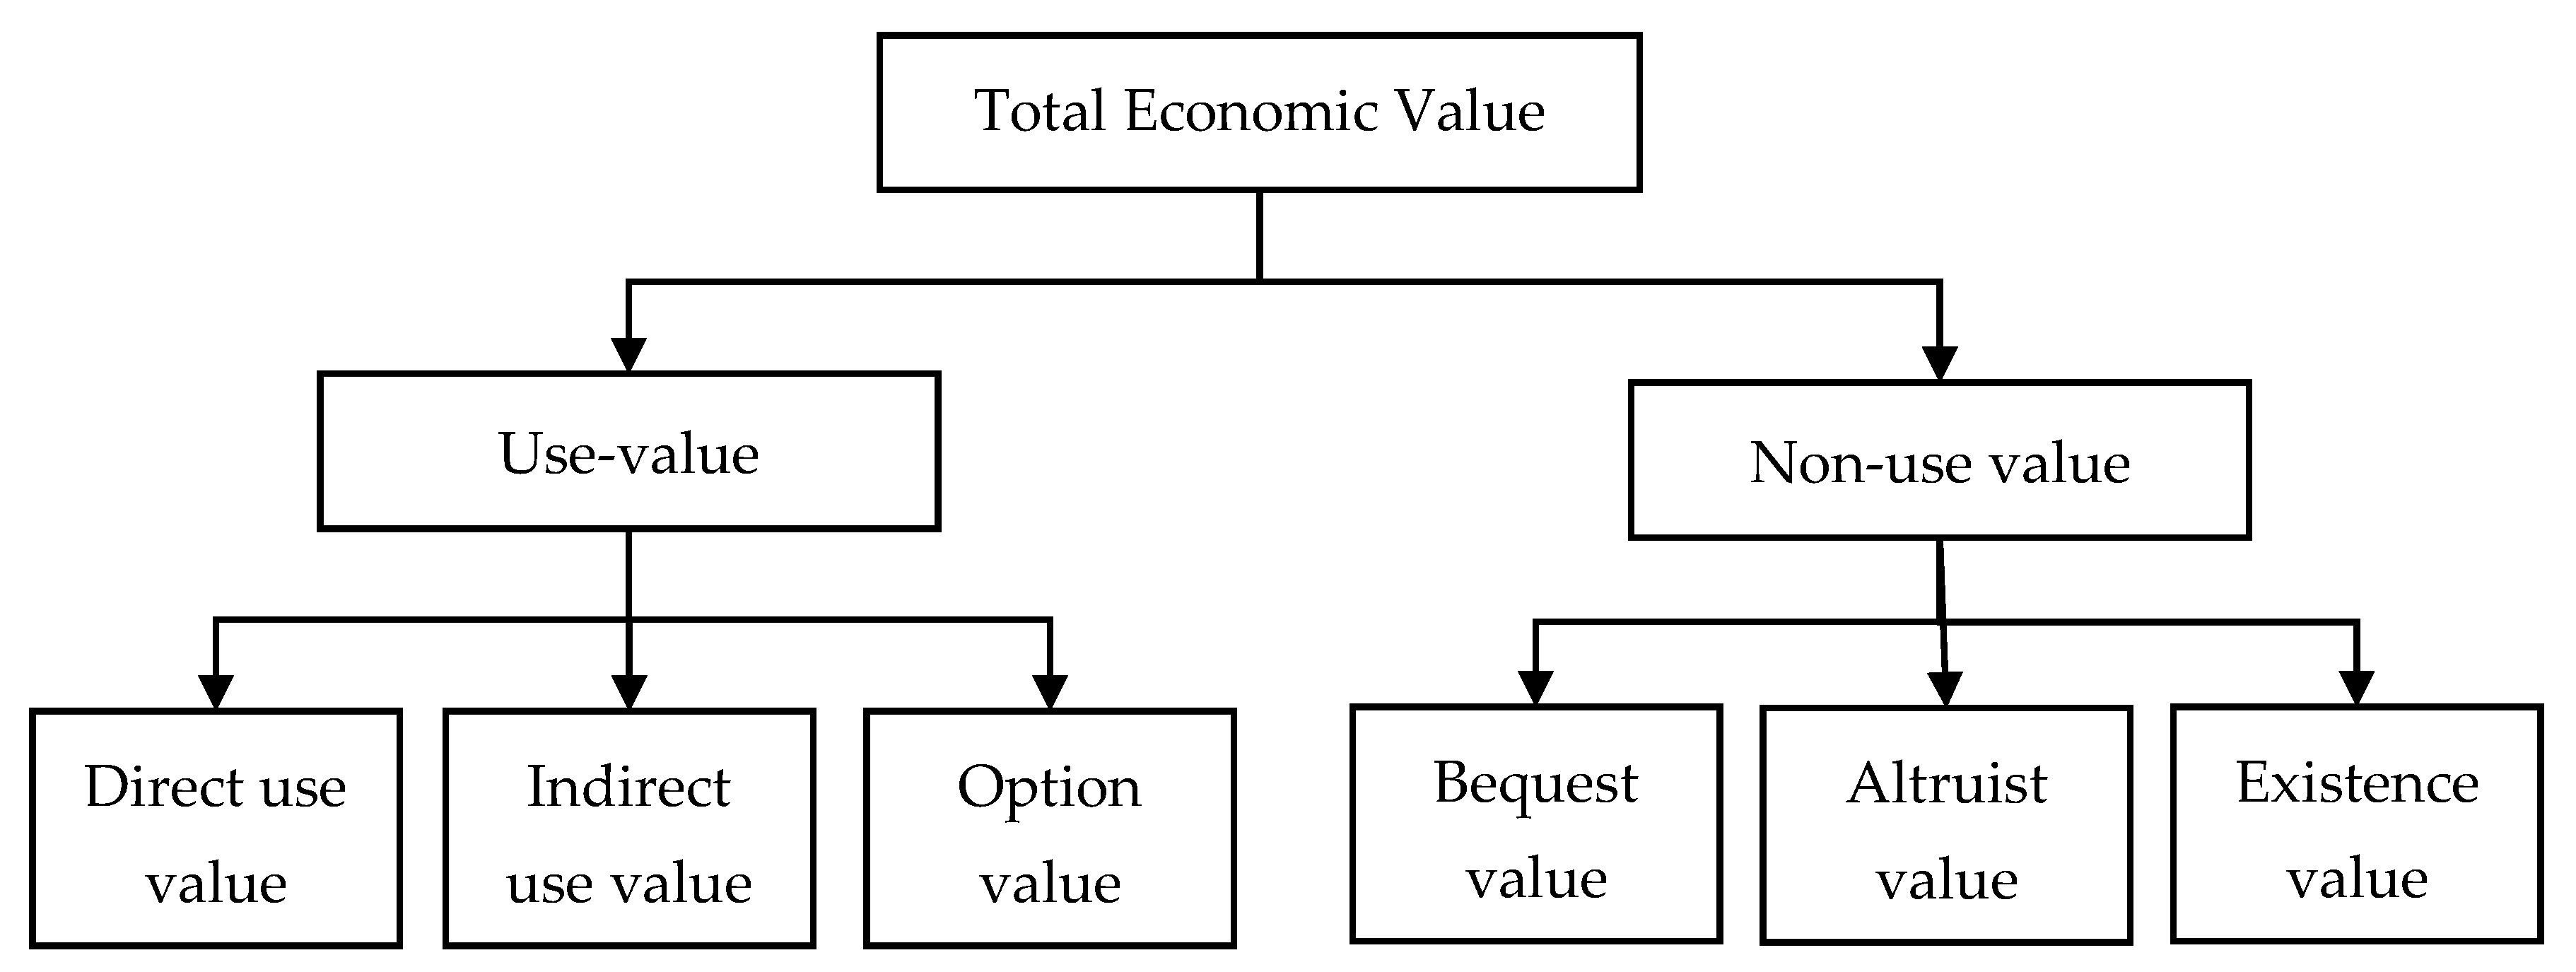
Theoretically, we can classify the value of ecosystem services into two broad categories: use value and non-use value [20,21,23]. Use value is society’s gains from using, or potentially using, a given environmental resource or its services [20], while non-use value is the enjoyment people may experience simply by knowing that a resource exists, even if they never expect to use that resource directly themselves [23]. Use value can be classified into direct use value—ecosystem goods and services that are used directly by human beings—and indirect use value—ecosystem services that provide benefits outside the ecosystem itself [23]. We can classify further direct use value into consumptive/extractive categories, such as harvesting of food products, timber for fuel or construction, medicinal products, and hunting of animals for consumption, and the non-consumptive/non-extractive category, which is not actually consumed, such as the enjoyment of recreational and cultural activities. Option value is the value from an option that people give to the future availability of ecosystem goods and services that may not be used at present for personal benefit [24].
The non-use value can be classified into bequest value—where individuals attach value from the fact that the ecosystem resource will be passed on to future generations; altruist value—where individuals attach values to the availability of ecosystem resources for others in the current generation; existence value—the value of the existence of an ecosystem resource, even if a person has no actual or planned use [24]. The TEV classification can be seen in Figure 1. The use and non-use values configure the total economic value of services provided by an ecosystem [21]. The value of environmental services contributes to human well-being or welfare.
Botanical gardens have a variety of environmental services, ranging from provisioning services, such as food, water, wood, and medical providers, regulating services, such as natural drainage, air quality regulation, and climate change regulation, and habitat services, such as maintenance of genetic diversity, to cultural and leisure services, such as recreation and tourism [25]. From the perspective of the visitors, recreational value is the most important value the visitors get, but beyond that, the visitors can put a value on other benefits, such as the function of the BBG to protect biodiversity.
Recreational services are cultural services that are classified as non-consumptive direct use values. Providing recreational value, a botanical garden can generate revenue that can be used to maintain botanical functions, such as ecological services, conservation, education, and research [7]. Recreational value can be calculated using various economic valuation methods, such as the TCM, CM, and the CVM [16,17,18,25]. The valuation method is chosen based on the purpose of the valuation. In this study, the recreation value of the Bogor Botanical Gardens is calculated using TCM and CM approaches.
The TCM estimates the recreational value provided by the botanical garden by using a proxy of how much money a person is willing to spend in visiting the recreational site. The TCM can generate the demand curve, which will, in return, show us the consumer surplus, which represents the recreational value of the BBG from the perspective of the visitor. The demand curve makes it possible to estimate the impact of increasing the entrance fee on the revenue of BBG. Thus, determining the optimal entrance fee becomes possible. Previous studies utilized the TCM and the CVM to estimate the value of botanical gardens, such as that conducted by [18] to determine a revenue-maximizing entrance fee at the National Botanical Garden of Bangladesh. In addition to the Bangladesh case, two studies revealed the values of three Australian botanical gardens using the TCM and the CVM [17] and a botanical garden in the Nilgiris District, India, using the TCM [16].
Moreover, CM can complement the TCM. CM is an economic valuation method that can capture a person’s preference for a particular attribute or characteristic of a service provided by an ecosystem [26]. Consumer utility is defined as a set of attributes or characteristics of goods or services purchased [27]. Consequently, a visit to the botanical garden can imply the consumption of attributes, such as fresh air, information and education, appreciation of nature, observation of plant collections, and tourist facility services. A consumer will have access to the utility of these attributes as well as the disutility of other attributes, such as congestion impact.
The CM is not only able to estimate the value of certain attributes of an environmental service but is also able to generate a value of a set of attributes with a certain level of attributes scenario. In this case, CM can provide values of several scenarios that may represent several levels of environmental improvement. Referring to [14], conducted using CM, the study estimated the value of improvement for the University of Kentucky Campus Arboretum. Using five attributes that are expected to be a source of income for improvement, the construction of a pollinating garden came up as the attribute with the highest value. Other examples of how CM can be used to estimate the values of environmental improvement scenarios are represented in [28,29] for conservation and in [30] for aesthetic landscape. In the case of BBG, it is possible to set several policy recommendation scenarios that generate different levels of improvement in the BBG’s management and make the value of the attributes become the basis of generating income for improving BBG.
Various methods can be used in analyzing visitor preferences. However, from the management of the botanical garden’s point of view, analyzing the value of attributes of the BBG can be very useful in choosing the right policy for the improvement of the BBG and as the basis of increasing entrance fees for improving environmental services.
3. Materials and Methods
This study aims to estimate the economic benefits of BBG with both the TCM and CM. The TCM can estimate the value of BBG recreation services with visitor preferences, which are reflected by the costs that visitors bear to come to BBG. These costs reflect the visitors’ WTP. Furthermore, this study employs CM, which makes it possible to estimate the marginal WTP of visitors for several BBG characteristics. By using both methods, we can estimate the recreational value of BBG, the value of selected characteristics of BBG, and the increase in entrance fee which can be used to improve the services of BBG.
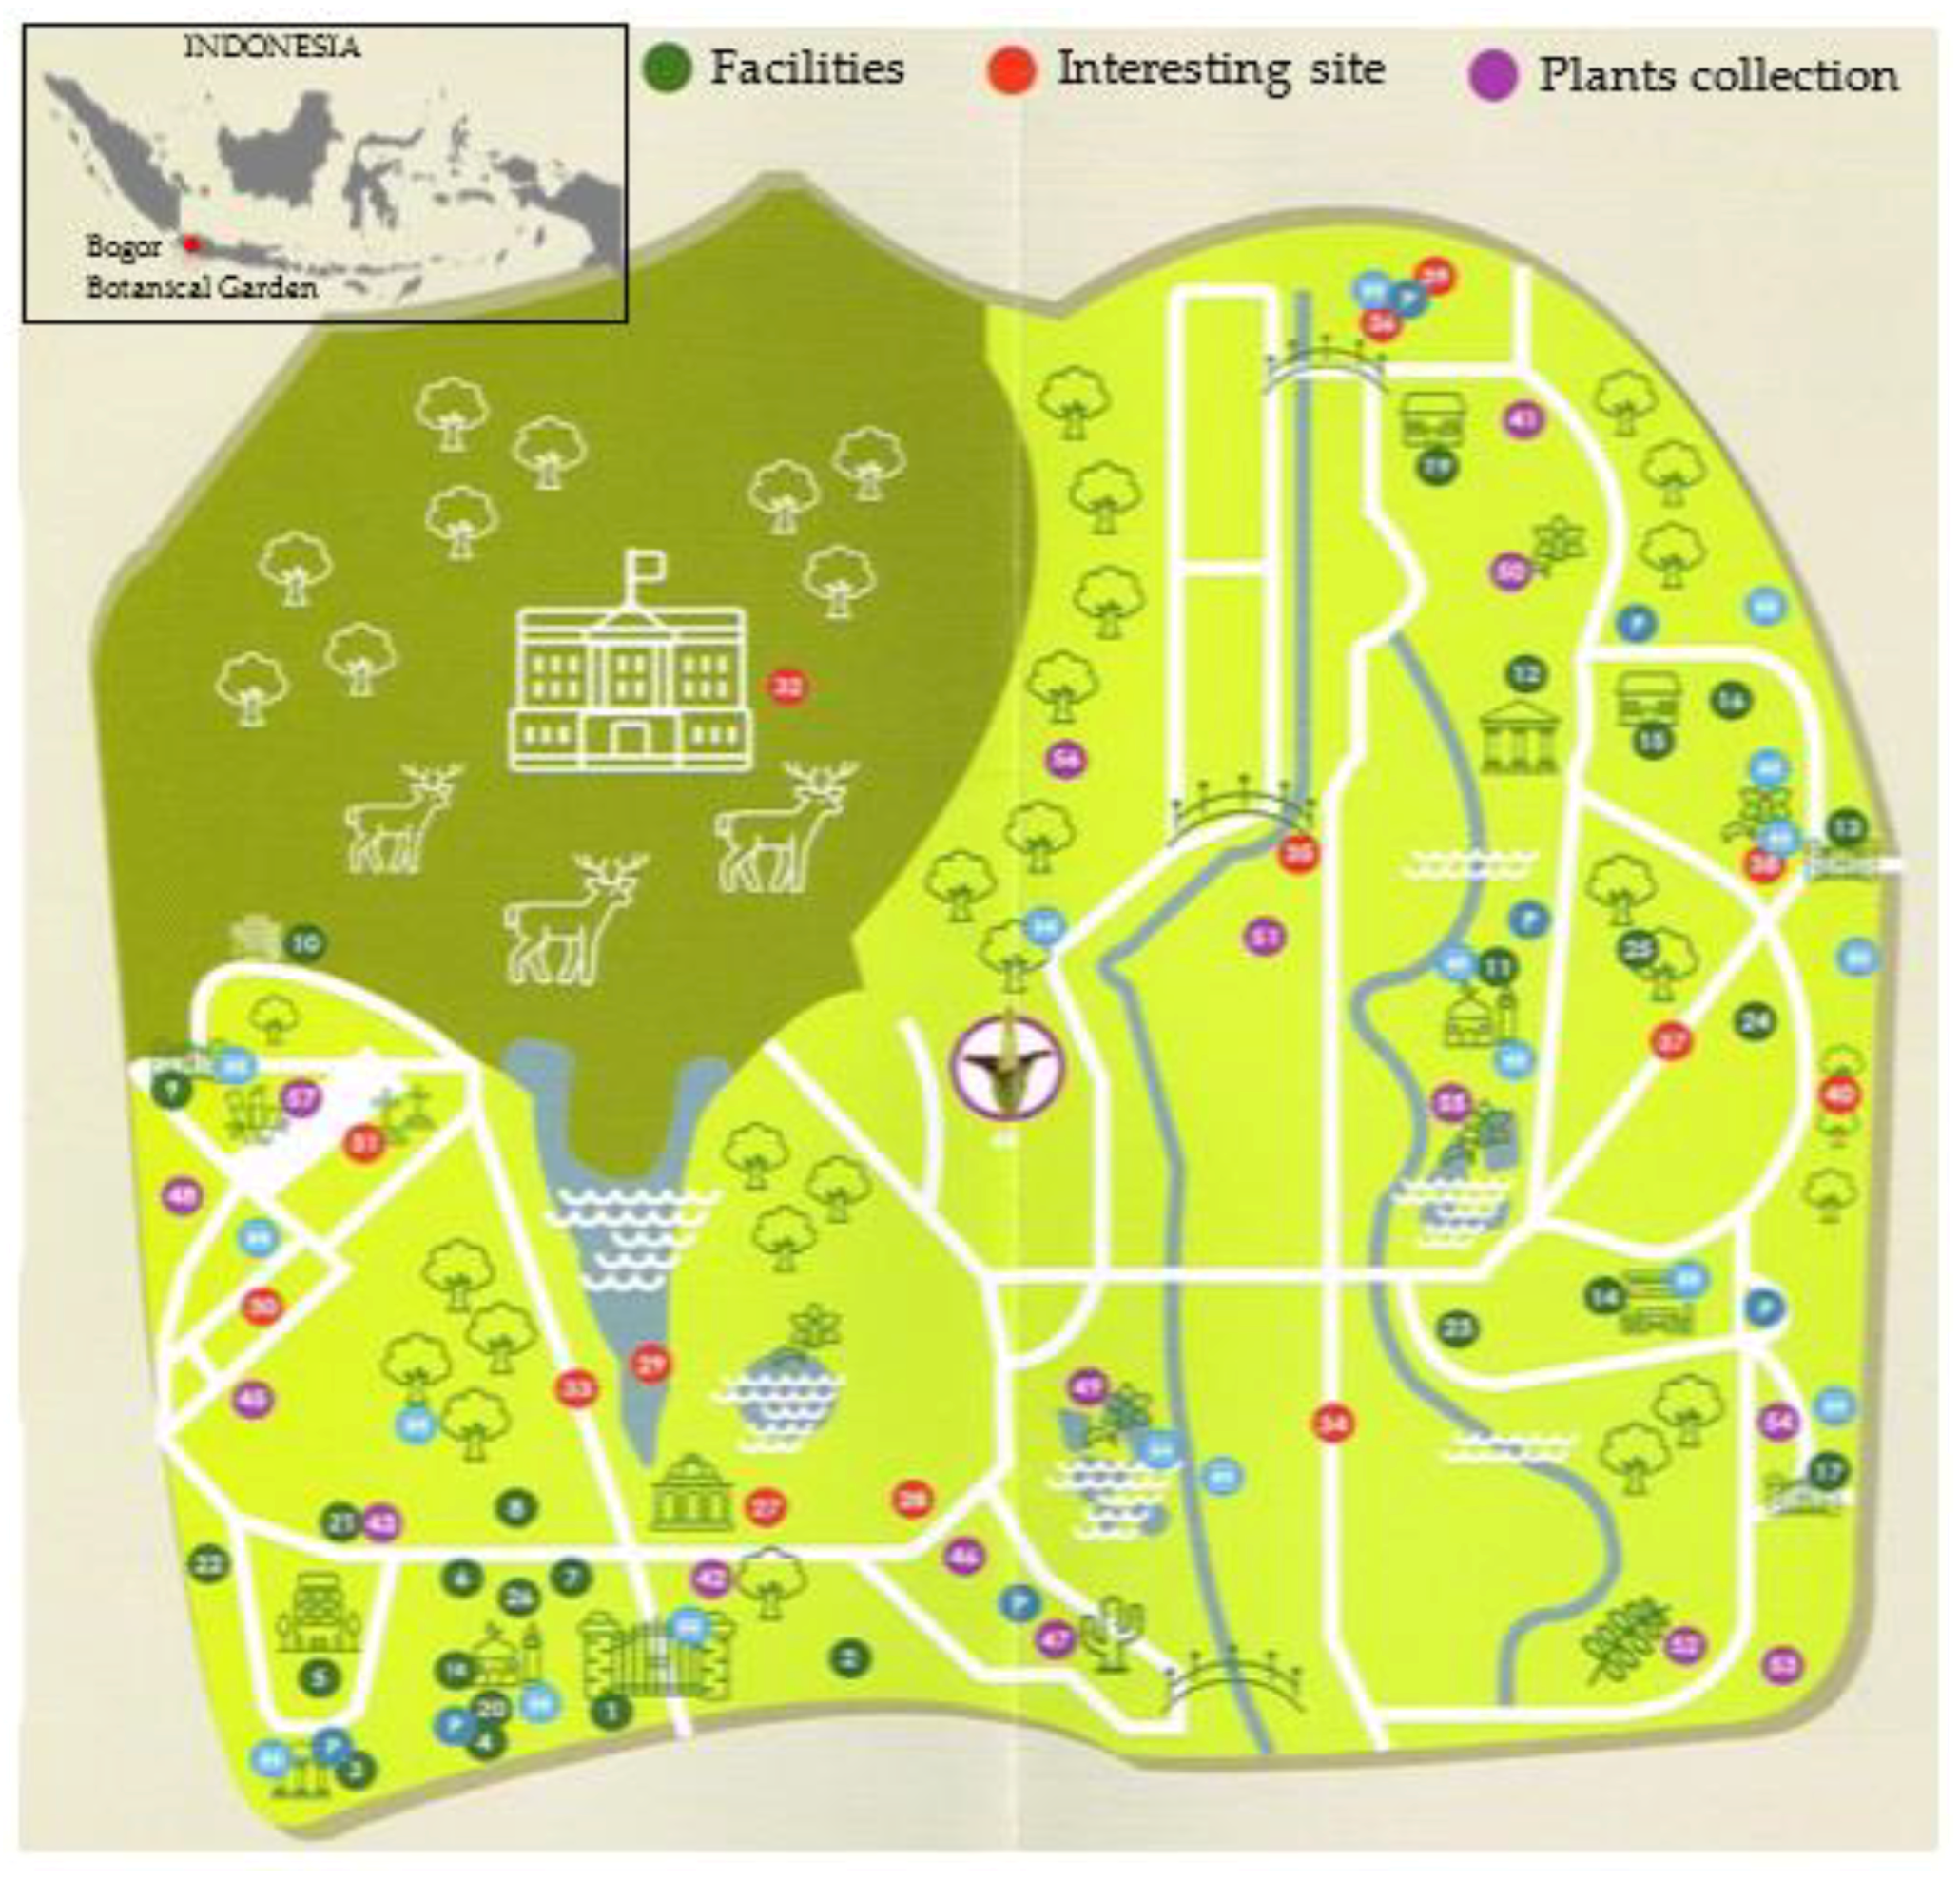
Figure 2 provides information on the location of BBG on a map of Indonesia as well as the services provided in the garden. There are three service categories described in the map; first, facilities, including the Zoological Museum, the Orchid Nursery, the Re-introduction and Rare plants Nursery, the Tissue Culture Laboratory, and other general public facilities. Second, interesting sites, such as the Lady Raffles Memorial, the Bogor Palace, the Hanging Bridge, the Orchid House, Pine Areas, and others. Lastly, plant collections, such as the rare and unique Rafflesia Arnoldi, medicinal plant collections, cactus collections, and others.
A survey was conducted in BBG, which is located in the administrative area of Bogor City, West Java Province, Indonesia, from April until May 2019, on both weekdays and weekends. The data were gathered through a survey using a questionnaire, and the purposive sampling method was used to obtain a sample of visitors. The sample was limited to local visitors (domestic tourists), at least 18 years old. The sample covers 414 respondents, taken from BBG visitation data in 2018, of 1.3 million visitors and uses the margin of error of 5%. Before conducting the main survey to 414 respondents, in-depth interviews and pre-survey tests were conducted. The in-depth interview took several groups; 8 respondents of BBG management, to mainly explore more about the kinds of functions and services provided by BBG; in addition to that, 20 respondents consisted of visitors and food stall owners who were interviewed in depth to explore their experiences in using the BBG services and their recommendations for the improvement of BBG to be used for developing a questionnaire followed up by a pre-survey test.
The questionnaire consisted of four parts and 50 questions that accommodate questions both for the TCM and CM. Following the introduction part, the first part consisted of a CM questionnaire, including the background situation of BBG and scenarios of BBG improvement (3 pages) and 8 set-choice questions (3 pages). The second part was the TCM questions, that comprised of 2.5 pages, which explored the travel cost of visitors and experience of visitors in BBG. The third part, which consisted of one page, was about the preference and attitude of visitors regarding environmental issues and recreational activities in BBG.
3.1. Travel Cost Method (TCM)
In the TCM, the main data needed are the total travel costs of the visitors and the number of visits during the year. This study uses the individual TCM that utilizes data at an individual level, assuming that BBG is the only destination of the visitors. The costs of a visitor comprise all costs borne by the visitors, both explicit and implicit costs. Explicit costs include transportation costs and other expenses during activities in BBG. The implicit cost includes the opportunity cost of time of the visitors to arise because they visit BBG. Another implicit cost is the congestion impact that occurs when the visitors are interrupted when the BBG becomes congested. This study does not cover the implicit cost because the survey revealed that most of the visitors (90.82%) come to BBG in their leisure time, do not sacrifice their working time, and enjoy the trip to BBG (96.38%). We did not apply the congestion effect either because most of the visitors (65.94%) do not feel interrupted by the large crowd.
At the first stage, the trip generating function is estimated using an econometric model, Ordinary Least Square (OLS). The trip generating function is a function with the travel cost as the dependent variable and the number of visits (visitation rate) as the main independent variable. As the control variable, the equation puts the socioeconomic characteristics of the respondents, namely age, marital status, gender, gross income per month, and education level.
Utilizing the result from the trip generating function, the demand function curve is obtained by performing a hypothetical simulation of several scenarios of additional travel costs through the increase in the entrance fee. The entrance fee simulation ranges from the lowest value, which represents the highest number of visits, to the highest value, in which the number of visits is (near) zero. The simulation reflects the downward sloping of the demand curve, whereas the price (travel cost) is negatively related to the number of visitors.
3.2. Choice Modeling Method (CM)
CM is used to estimate the value of attributes related to conservation and services in BBG. The first step in CM is determining the attributes and the level of attributes. In-depth interviews were conducted to explore the service and functions of the botanical gardens, especially in terms of conservation and management of the BBG, which will later determine the attributes, the level of attributes, and the scenarios of improvement. There were two groups targeted for in-depth interview activity. First is the BBG management, with a total of 8 respondents, including operational staff, botanical garden researchers and curators, and tour guides.
The second group is the visitors and food stall owners in the BBG, with a total of 20 respondents. Some of the questions raised in the in-depth interview included: (1) How many times have you visited BBG this year?; (2) What is your purpose for visiting BBG?; (3) What do you get from visiting BBG? (4) In accordance with the services and functions of the Botanical Gardens, what needs to be improved from the BBG?; (5) Based on your suggestion in question 4, what is your maximum WTP if the suggested improvement is carried out by BBG management? Based on the pre-survey test results and in-depth interviews with visitors and experts, the study uses four attributes that are closely related to the visitor preferences on BBG, namely:
- The number of plant species (species). The continuous reduction in the number of plant species becomes the main consideration of putting this attribute to be valued. The value generated from this attribute can become the basis of pursuing the program to increase the plant species in the botanical garden. The number of species is rounded to lessen the cognitive work of the respondents, i.e., to make them easier to imagine the figure.
- Information and environmental educational tools and infrastructure (enveduc). The in-depth interview results show the importance of increasing the tools and infrastructure to improve the information and educational materials to provide a variety of information services on plantations and plant conservation and to increase public awareness and concern for the environment.
- Tourist car (touristcar). Observation of the current practice of allowing cars to enter the BBG site becomes the consideration to look at whether it is important to make a policy to control the vehicle entering the BBG to reduce the pollution from vehicles.
- Entrance fee (charge) is employed as a fee for each option.
The attributes and levels used in this study can be seen in Table 1.
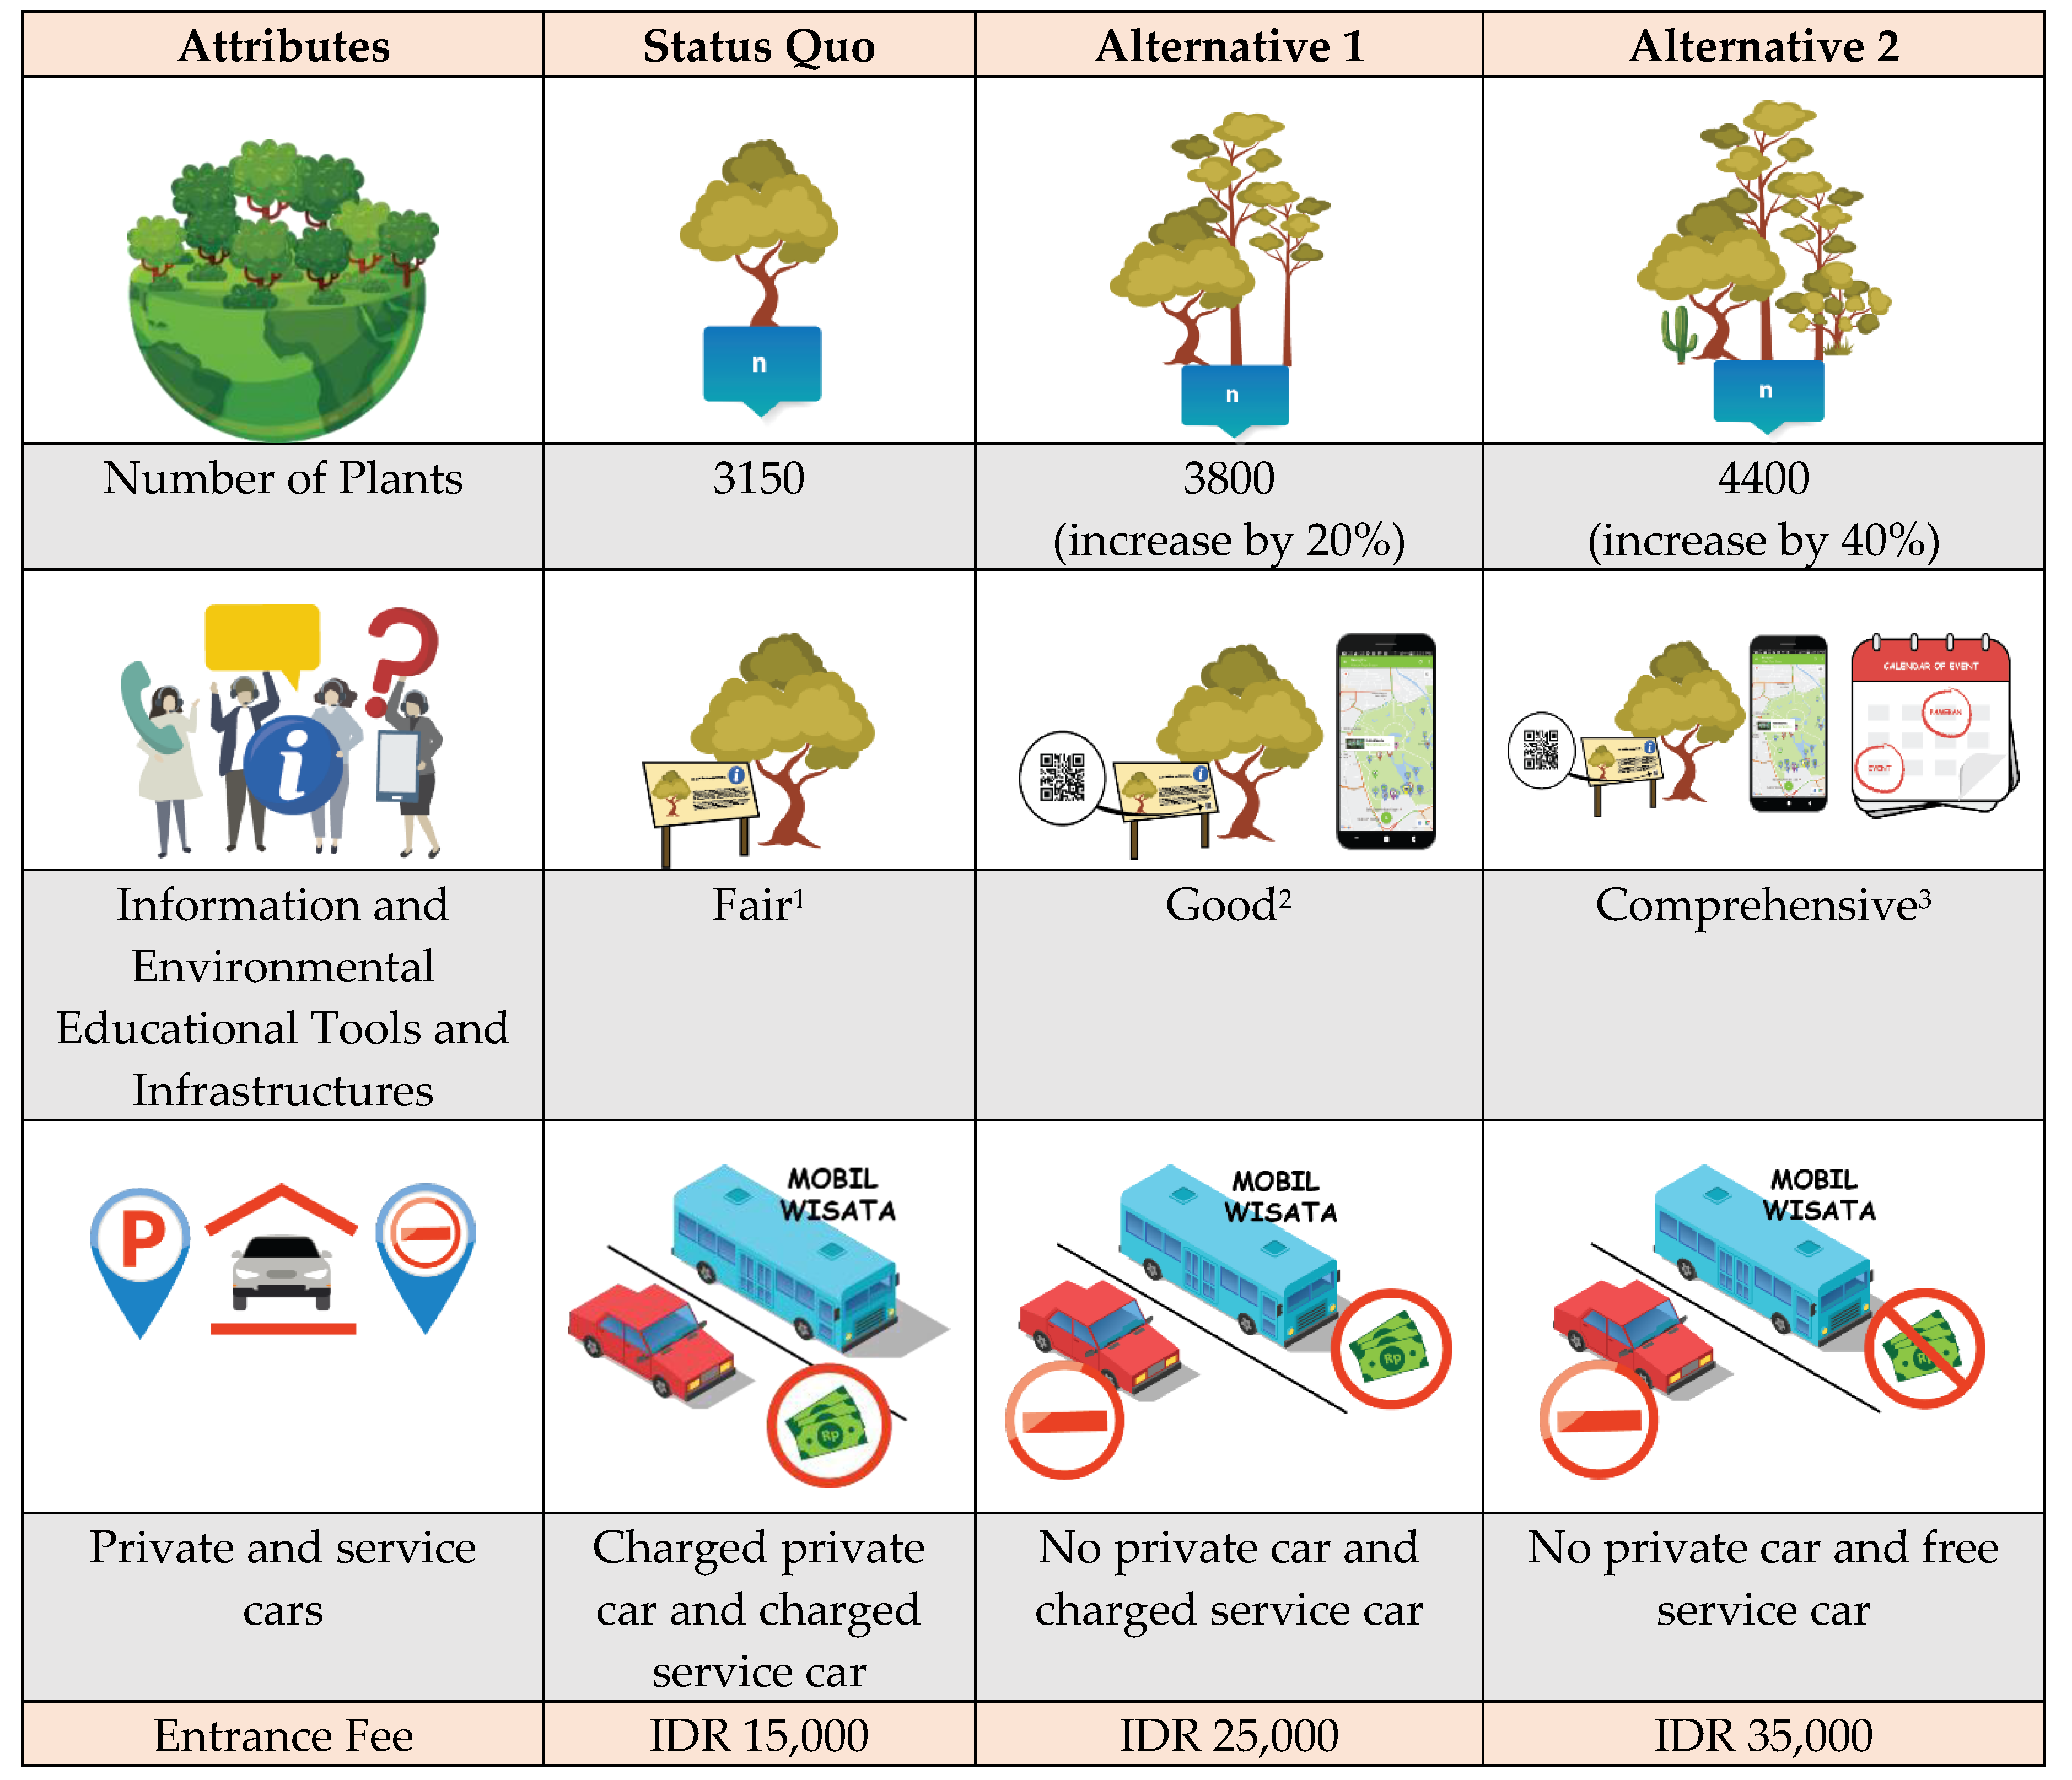
After the attributes and levels were determined, the econometric model analysis was performed. Using a full factorial experimental design, the combination of four attributes and three levels for each attribute generated 81 choice set combinations that were obtained from 3 × 3 × 3 × 3. This study uses fractional factorial, which utilizes only a portion of the complete combinations to be asked to the respondent. The result indicates that the questionnaires use 5 blocks of combinations with 8 choice sets for each block. Each respondent will then answer 8 choice sets. Figure 3 describes the sample of a choice set.
Two estimation models are used, namely the basic model and the model with socioeconomic characteristics [34]. The data processing for the two models uses conditional logistic regression. The basic model employs Alternative Specific Constant (ASC) attribute and is equated as follows:
where Vi is an individual utility. The extended model using the socioeconomic variables comprises ASC and socioeconomic characteristics that interact with ASC. The model is stated in the following equation:
where educ is education level, spend is a proxy of gross income per month (IDR), fams is the number of family members living at the same house, envico is the respondent’s concern for the environment, consorg is the involvement in the environmental/conservation organizations, and usecar is the number of respondents using private cars when visiting BBG.
Vi = ASC + β1species + β2enveduc + β3touristcar + β4charge
Vi = ASC + α1ASC*age + α2ASC*gender + α3ASC*educ + α4ASC*spend + α5ASC*fams + α6ASC*envico + α7ASC*consorg + α8ASC*usecar + β1species + β2enveduc + β3touristcar + β4charge
After the econometrics model is analyzed, implicit price calculations are then performed to estimate individual responsiveness to the marginal rates of substitution (MRS) between attribute levels [35]. The formula for calculating the implicit price is as follows:
IP is implicit price obtained from the efficient distribution of non-monetary attributes (βk) divided by the coefficient of monetary attributes (βm). After an implicit price is obtained, a compensating surplus (CoS) is calculated to obtain the proposed value/policy offered. Compensating surplus is estimated by the following formula:
where βm is the monetary attribute coefficient, V0 is the coefficient value of the CM regression of the current conditions (status quo), and V1 is the coefficient value according to the proposed improvement program scenario [36].
4. Results
The data on the characteristics of respondents are presented in Table 2. Based on utilization preferences, most visitors consider BBG the main tourist destination (80.92%). Nearly 90% of visitors come to BBG for recreation purposes compared to other purposes, such as sports, work, and study or research (10.14%). Judging from the time of the visit, 80.19% of visits are made during the holidays and 19.81% of the visits are made on weekdays.
4.1. Consumer Surplus from TCM
The value of environmental services in the form of recreational value was estimated using TCM through the consumer surplus approach. Consumer surplus values are obtained from the trip generating function estimation. The trip generating function is obtained from the results of a trip cost regression, with the results described in Table 3.
The R-squared value of 0.037 signifies that the proportion of the number of visits can be explained with the variables of travel costs, namely age, marital status, gender, income, and education at the rate of 3.7%. The test results show that the probability of F-stat of 0.01 is significant for α = 10%, which means that all the independent variables together significantly influence the number of respondents’ visits to BBG.
Of the six independent variables obtained by travel costs, the gender and education variables have a significant effect on the number of visits, while age, status, and income have no significant effect on the dependent variable. The travelcost variable with a negative sign indicates that every change in travel costs of IDR one million will cause a decrease in the number of visits to BBG by 0.859 times. The positive variable gender indicates that male respondents have a higher chance to visit BBG 0.428 times compared to the female ones. Furthermore, the education coefficient with a negative sign indicates that respondents who have received higher education (above high school) have a lower probability to visit BBG by 0.509 times compared to those who have a lower education (high school and below).
Estimation of the trip generation function equation results as follows:
visit = 3.673 – 8.59 × 10⁻⁷ travelcost
Utilizing the above equation to simulate hypothetical additional entrance fee scenarios, a consumer surplus of IDR 582,072 (USD 40.90) per visit is obtained. With the number of BBG visitors in 2018 reaching 1.25 million people, the economic benefits of BBG become IDR 728.8 billion (USD 51.21 million) per year.
4.2. Attribute Values from CM Analysis
The CM estimation results show both for the basic model as explained in Equation (1) and the extended model in Equation (2). For attributes that comprise of qualitative measure, the variables need an effect coding. By providing a base level with code −1 for each new variable, the following results are obtained:
After using the effect coding in Table 4, the model equation becomes as follows:
Vi = ASC + β1species + β2enveduc1 + β3enveduc2 + β4touristcar1 + β5touristcar2 + β6charge
Of the four regression models, the extended model is considered the best according to the pseudo R2 value and the number of significant variables. The results of conditional logit regression can be seen in Table 5. This result represents Model 4 which is taken from the full version of regression results provided in Appendix A. The overall model is significant with a p-value of 0.0000 and a pseudo R2 of 0.102. The acceptable pseudo R2 values are between 0.1 and 0.4 as suggested by Domencich and McFadden (1975) [13].
The attribute representing the number of plant species (species) shows a positive coefficient number but is not significant. This implies that most visitors may consider an increase in the number of species to be part of the botanical garden’s work and it is not appropriate to charge the visitors for this kind of improvement. Visitors prefer shade, beauty, and freshness of the collection of plants to an increase in the number of plant species. The respondents in this study aiming at recreation amounted to 89.86% and only 3.10% of them were aiming at research and study tours. This makes it a reasonable argument, to such an extent, that the species attribute is not significant. It may imply that the visitors do not put value for non-use value characteristics, such as biodiversity. Another attribute that indicates a positive benefit from the visitor’s perspective is the improvement of the information and environmental education tools and infrastructures from the fair to the good level (enveduc2). Visitors put value on the moderate improvement (from fair to good level), while they do not perceive a positive value for significant improvement—from good to comprehensive level (enveduc1). This result highlights the importance of investing in more useful information and educational tools in the form of digital mobile applications (QR code/digitization interpretation boards, digital maps). This improvement seems to give benefits to the visitor compared to the additional benefit given by the enveduc1 variable, which is the addition of events and exhibits related to the education environment.
Respondents gave more value to the free service car (touristcar1), which is reasonable because people like to receive a free service more than a paid service. This reason is strengthened with the estimation regression result that the change from paid private car and paid service car to just paid service car with no private car is not significant (touristcar2). Banning private cars from entering BBG is quite controversial because, based on the results of the interview, some respondents need a vehicle to carry equipment and consumables during the tour. The interaction of ASC attributes with the socioeconomic factors—the level of education, income (proxy by expenditure/spending), and environmental awareness—show positive and significant signs as expected, meaning that as those variables increase, people tend to perceive a positive benefit of the improvement of the BBG. The reverse happens for age—the older the visitor, the fewer benefits he/she gets from the improvement of BBG. As for gender, females seem more appreciative of the BBG improvement than males.
ASC in the extended model shows a significant and positive number. This implies that in general, the respondents are willing to choose the alternatives that improve the BBG. This also implies that socioeconomic factors, such as income, education level, and environmental awareness, have a significant impact on the option for improving BBG. The respondents support the improvement of the BBG through information and environmental educational tools and infrastructures but not by increasing the number of plants.
4.3. Economic Value from Environmental Quality Improvement Scenarios
The marginal WTP values presented in Table 5 can be interpreted as follows: (1) For the information and environmental educational tools and infrastructures attributes (enveduc2), respondents are generally willing to pay an additional entrance fee of IDR 1301 (USD 0.09) from fair (status-quo) to good level condition; (2) For the attribute of private and service car policy (touristcar1), respondents, in general, are willing to pay an additional ticket price of IDR 3968 (USD 0.28), from a paid service car to a free service car.
A set of attribute levels that can be taken by BBG as a policy target are (1) to increase the attributes of information and environmental educational tools and infrastructures from fair to good (enveduc2) and (2) to make paid service cars free (touristcar1). This policy scenario will generate the highest compensating surplus value of IDR 19,704 (USD 1.38). Considering that the number of BBG visits in 2018 amounted to 1.25 million visitors, we can obtain an estimate of economic benefit generated from the BBG recreational and ecological value of IDR 24.67 billion (USD 1.73 million) per year.
The recommendation for policy alternatives taken by BBG is to improve two things: information and environmental educational tools and infrastructures and giving free service cars to the visitors. This will create the need to increase the entrance fee by IDR 5269 (USD 0.37), which will make the entrance fee become IDR 20,629 (USD 1.45), adding the first value with the current entrance fee of IDR 15,000.
5. Discussion
From the TCM, we can draw an estimated value of IDR 582,072 (USD 40.90) per visit or IDR 728.8 billion (USD 51.2 million) per year, assuming the total visitors counted as 1,252,122 in 2018. This value represents the recreational value of BBG given the current situation and status quo service level condition. From the CM method, the value of improvement of BBG is estimated at IDR 19,704 (USD 1.38) per visitor, which creates a total value of IDR 24.67 billion (USD 1.73 million) in a year. The potential additional revenue from the increase in the entrance fee can be utilized for improvement in the facilities of the site and the biodiversity feature of the BBG. Combining both aspects emphasizes the co-benefit features which will ensure the sustainability of the ecosystem service provision in terms of recreational value and biodiversity value.
Compared to the other three studies, the result of recreational value revealed by the TCM is in the range of values of other studies. For example, a study by [17] estimates a value of USD 39 per visit or a total benefit in terms of consumer surplus of USD 194 million for three Australian botanical gardens in Canberra, Melbourne, and Sydney. Another study by [16] is on the recreation value of the Government Botanic Garden (GBG), the Nilgiris District, India, using the TCM. The value created is INR 4000 (USD 59.64) per visit and the total consumer surplus value was INR 11.757 billion (USD 175.29 million) in 2015. The study in Bangladesh [18] revealed a much lower value of USD0.955 per visitor and the yearly consumer surplus is USD 593,634. Another beach recreational value in Bangladesh [15] using the TCM shows a very low value of BDT 15 (USD 0.18) per visitor or more than BDT 6,750,000 (USD 79,882) around the year. The variation in values among sites in different regions must be evaluated by considering variables such as income, inflation adjustment because of different periods of study, and the specific characteristics or services of the botanical gardens in the respective sites.
Researchers utilizing CM, including the one by [14], identify the use value of potential structural improvements at the university arboretum. Five potential attributes selected are expected to be a source of income for the arboretum, with one monetary attribute in the form of a monthly parking permit. The results showed the biggest positive WTP was for the construction of a pollinating garden with a value of USD 3.65 per user per month. Controversial attributes for the surrounding community are vending machines and perimeter fences. These results provide input to the arboretum authorities to make decisions based on funding and infrastructure that are most aligned with public values [14]. This is also a consideration that in managing BBG, there must be a balance in the economic, social, and environmental interests of the stakeholders in accordance with the sustainability framework.
The originality of this study was translated in the use of two methods in estimating the value of BBG, which created not only a recreational value but also the possibility of capturing value of BBG improvement. Another thing is the construction of the attributes in the CM method is very site-specific, showing that different botanical gardens have different dominant attributes perceived by the visitor. This study also added to the limited literature on the value of BBG, particularly in Indonesia.
It has to be noted that the ecosystem services estimated in this study only cover recreational value as use value and not non-use value as another service provided by BBG. In this case, not all values in the TEV framework [20,21,23] are included. Looking at the importance of BBG to serve biodiversity, it is important to consider other values in further study. Regarding the attributes assigned in this study, capturing more detail attributes will be interesting, such as instead of putting the number of species, we can also list the rare species of plants. The use of local visitors as the basis for estimating the value of BBG could be underestimated since there is a possibility to capture the value of BBG from other groups, such as foreign visitors and visitors for research and educational purposes.
6. Conclusions
Botanical gardens are one of the man-made ways to conserve biodiversity and connect it with the society. One of the connection efforts is recreation. This study calculates the economic benefits of recreational service provided by BBG from the perspective of visitors. The result shows that the consumer surplus value of BBG visitors is estimated at IDR 582,072 (USD 40.90) per visit and the total value of benefits obtained is IDR 728.8 billion (USD 51.21 million) per year. As the total economic benefits gained by visitors are huge, the BBG’s authority should review the current entrance fee and set a higher target for improving the environmental services. The potential increase in the entrance fee is IDR 5269 (USD 0.37) or a 35% increase in the current entrance fee (IDR 15,000). With the new entrance fee, the BBG authority has a potential revenue of IDR 25.83 billion (USD 1.81 million) per year, 15.80% higher than the current entrance fee revenue.
Visitors’ marginal WTP for the improvement of BBG can be obtained from the CM results that estimate the compensating surplus value of IDR 19,704 (USD 1.38), generated from the improvement of information and environmental educational tools and infrastructures attribute and the provision of free service cars in the BBG.
In the short term, the BBG should impose a high charge for a private car entering the site before banning private car entrance. This, hopefully, can incentivize other environmentally friendly transportation modes, such as internal service cars or bicycles. The management can buy time until they have the capacity to provide free service cars and other supporting infrastructures, such as parking lots outside BBG and shelters inside BBG.
In terms of the environmental education function, the BBG authority should improve the quality and quantity of information facilities. Digitalization of information (for example, QR code application) on interpretation boards, enrichment of plantation content, and environmental education in mobile applications have been initiated. They should also improve flora tour services and tour guides, especially the provision of tour guides in each tour car.
This study elaborates more on the recreational value of BBG from the visitors’ point of view. Although the study has tried to include the ecological function in terms of several plants, the visitors do not put a value on biodiversity-related concerns. Further examinations must be taken to explore the value of biodiversity as the main function of BBG to protect them. The most relevant users are researchers. We believe that the benefit of biodiversity can be classified as a public good. Because of that, the policymaker can consider supporting BBG, particularly with funding to give BBG a larger capacity to protect biodiversity for better BBG sustainability.
We noted several points that make this study useful for the improvement of botanical gardens. First, the administrator of the botanical garden can use the opportunity to improve the management of the botanical garden by identifying the potential of increasing entrance fees through the estimation of the WTP of the visitors to the garden. Moreover, which features should be improved by the authority of botanical garden can be found through the estimation of WTP of each attribute of the garden, where one shows a significant value. One of the methods to reveal the relevant attributes is the CM method that we used in this study.
Second, the ability of the botanical garden to provide ecosystem services continuously and sustainably depends on the resources they had, and one of them is the budget that comes from the revenue of the botanical garden. This can be relevant to most botanical gardens that are managed by the government, which depend mostly on the government budget, which, in some cases, is limited, such as in developing countries. A limited budget can reduce the ability of the management to provide many services, not only facilities but also ecological functions, such as biodiversity that the botanical garden provides.
Third, we have conducted an exercise for certain attributes of botanical garden in this study and it might be relevant to similar botanical gardens around the world. However, for carefully adapting the attributes to other botanical garden sites, further assessment needs to be done to incorporate site-specific characteristics of each site.
The study results are not only relevant to the BBG but also for botanical gardens in general. Improvement in managing botanical gardens in line with the International Agenda for Botanic Gardens in Conservation will contribute to the achievement of the Global Strategy for Plant Conservation (GSPC) target.
Author Contributions
Conceptualization, S.D.A. and A.H.; methodology, S.D.A. and A.H.; formal analysis, S.D.A., A.H. and F.W.A.; investigation, S.D.A.; resources, S.D.A.; data curation, S.D.A; writing—original draft preparation, S.D.A, A.H., F.W.A; writing—review and editing, A.H., and F.W.A; visualization, F.W.A; supervision, A.H. All authors have read and agreed to the published version of the manuscript.
Funding
This research was funded by Universitas Indonesia for the research grant NKB-1909/UN2.R3.1/HKP.05.00/2019 and the Ministry of Research, Technology and Higher Education for giving the Science and Technology Human Resources Scholarship.
Conflicts of Interest
The authors declare no conflict of interest.
Appendix A
| Variable | Model 1 | Model 2 | Model 3 | Model 4 | ||||
| Coeff. | Standard Error | Coeff. | Standard Error | Coeff. | Standard Error | Coeff. | Standard Error | |
| asc | −0.192 | (0.153) | 0.615 ** | (0.309) | −0.193 | (0.154) | 0.618 ** | (0.310) |
| species | 0.0000804 | (0.0000746) | 0.0000959 | (0.0000766) | 0.0000762 | (0.0000758) | 0.0000941 | (0.0000778) |
| enveduc | 0.109 ** | (0.0465) | 0.119 ** | (0.0477) | ||||
| touristcar | 0.225 *** | (0.0459) | 0.235 *** | (0.0472) | ||||
| charge | −0.0000628 *** | (0.00000822) | −0.0000674 *** | (0.00000853) | −0.0000629 *** | (0.00000822) | −0.0000675 *** | (0.00000854) |
| aage | −0.0380 *** | (0.00395) | −0.0380 *** | (0.00395) | ||||
| agender | −0.239 *** | (0.0899) | −0.241 *** | (0.0899) | ||||
| aeduc | 0.438 *** | (0.0934) | 0.444 *** | (0.0935) | ||||
| aspend | 0.0994 ** | (0.0464) | 0.0998** | (0.0464) | ||||
| afams | 0.0233 | (0.0278) | 0.0237 | (0.0278) | ||||
| aenvico | 0.346 *** | (0.0886) | 0.347 *** | (0.0886) | ||||
| aconsorg | 0.0652 | (0.200) | 0.0634 | (0.200) | ||||
| ausecar | 0.133 | (0.102) | 0.126 | (0.102) | ||||
| enveduc1 | 0.0727 | (0.0519) | 0.0746 | (0.0532) | ||||
| enveduc2 | 0.0690 | (0.0517) | 0.0878* | (0.0531) | ||||
| touristcar1 | 0.254 *** | (0.0518) | 0.268 *** | (0.0532) | ||||
| touristcar2 | −0.0531 | (0.0515) | −0.0565 | (0.0528) | ||||
| N | 3519 | 3519 | 3519 | 3519 | ||||
| pseudo R-sq | 0.066 | 0.102 | 0.066 | 0.102 | ||||
| chi2 | 302.4 | 467.7 | 305.3 | 471.6 | ||||
| p | 2.98 × 10−63 | 1.05 × 10−91 | 4.55 × 10−62 | 5.71 × 10−91 | ||||
| Standard errors in parentheses | ||||||||
| ** p < 0.05, *** p < 0.01. | ||||||||
References
- Forbes, S. How Botanic Gardens Changed The Word. In The History & Future of Social Innovation Conference; Hawke Research Institute for Sustainable Societies: Adelaide, Australia, 2008. [Google Scholar]
- Jackson, P.W. Experimentation on a Large Scale-An Analysis of the Holdings and Resources of Botanic Gardens. In Botanic Gardens Conservation News; Botanic Garden Conservation International (BGCI): Richmond, UK, 1999; pp. 27–30. [Google Scholar]
- BGCI. International Agenda for Botanic Gardens in Conservation; Botanic Gardens Conservation International: Richmond, VA, USA, 2012. [Google Scholar]
- Secretariat of the Convention on Biological Diversity. The GSPC Targets. Available online: https://www.plants2020.net/gspc-targets/ (accessed on 7 November 2020).
- Karasah, B. Determination of Cultural Ecosystem Services Provided by Botanical Garden “Case of Batumi Botanical Garden, Georgia”. In Researches on Science and Art in 21st Century Turkey; Gece publishing: Ankara, Turkey, 2017; Volume 2, p. 2033. [Google Scholar]
- BGCI. Garden Search. Available online: https://tools.bgci.org/garden_search.php (accessed on 7 November 2020).
- LIPI. Report on the Development of Regional Botanical Gardens in Indonesia; LIPI: Bogor, Indonesia, 2017; (only available in Bahasa). [Google Scholar]
- Hotimah, O.; Wirutomo, P.; Alikodra, H.S. Conservation of World Heritage Botanical Garden in an Environmentally Friendly City. Procedia Environ. Sci. 2015, 28, 453–463. [Google Scholar] [CrossRef] [Green Version]
- BPS Bogor. Number of Bogor City Tourist Visits in 2016; BPS: Bogor, Indonesia, 2018; (only available in Bahasa). [Google Scholar]
- LIPI. Number of Tourist Visits at Four National Botanical Gardens; LIPI: Bogor, Indonesia, 2018; (only available in Bahasa). [Google Scholar]
- Karlinasari, L. The Assessment of Canary Trees in the Bogor Botanic Gardens Using Forest Health Monitoring and Sonic Tomography Methods. In Proceedings of the IOP Conference Series: Earth and Environmental Science, Banda Aceh, Indonesia, 26–27 September 2018; Volume 203. [Google Scholar] [CrossRef]
- Akbar, S.; Som, A.P.M.; Gani, K. Visitors’ Willingness to Pay for Park Fees: A Case Study of Penang Botanic Gardens. Int. J. Hosp. Tour. Syst. 2010, 3, 1–11. [Google Scholar]
- Matthew, N.K.; Ahmad, S.; Ramachandran, S.; Syamsul-Herman, M.A.; Zaiton, S. Visitors preferences on forest conservation and management in Endau-Rompin National Park. J. Trop. Sci. 2018, 30, 354–361. [Google Scholar]
- Trull, N.; Penn, J.; Hu, W. Visitor support for growth and funding in public built environments: The case of an arboretum. J. Hous. Built Environ. 2018, 33, 829–841. [Google Scholar] [CrossRef]
- Bashar, R.; Nandy, A. A more efficient valuation of beaches using tourists’ perspectives and Geographic Information System (GIS): The case of Patenga of chittagong, Bangladesh. Environ. Socio-Econ. Stud. 2019, 7, 54–65. [Google Scholar]
- Rajkumar, V.; Boopathi, S. Economic Valuation of Recreational Benefits from Government Botanical Garden, The Nilgiris: An Individual Travel Cost Approach. Int. J. Multidiscip. Res. Dev. 2017, 4. [Google Scholar] [CrossRef]
- Mwebaze, P.; Bennett, J. Valuing Australian botanic collections: A combined travel-cost and contingent valuation study. Aust. J. Agric. Resour. Econ. 2012, 56, 498–520. [Google Scholar] [CrossRef] [Green Version]
- Tahzeeda, J.; Khan, M.R.; Bashar, R. Valuation approaches to ecosystem goods and services for the National Botanical Garden, Bangladesh. Environ. Soc.-Econ. Stud. 2018, 6. [Google Scholar] [CrossRef] [Green Version]
- Perman, R.; Ma, Y.; McGilvray, J.; Common, M. Natural Resource and Environmental Economics, 3rd ed.; Pearson Education: Harlow, UK, 2003. [Google Scholar]
- Bolt, K.; Ruta, G.; Sarraf, M. Estimating the Cost of Environmental Degradation; The World Bank: Washington, DC, USA, 2005. [Google Scholar]
- Hackett, S. Environmental and Natural Resources Economics, 9th ed.; Pearson Education Inc.: Hoboken, NJ, USA, 2014. [Google Scholar]
- Harris, J.M.; Roach, B. Environmental and Natural Resource Economics; Routledge: New York, NY, USA, 2017. [Google Scholar]
- Pagiola, S.; von Ritter, K.; Bishop, J. How Much Is an Ecosystem Worth? Assessing the Economic Value of Ecosystem Conservation. World Bank Environ. Dep. 2004, 101, 48. [Google Scholar] [CrossRef]
- Defra. An Introductory Guide to Valuing Ecosystem Services; Defra publishing: London, UK, 2007. [Google Scholar]
- TEEB. The Economics of Ecosystems and Biodiversity: The Ecological and Economic Foundations; Earthscan: London, UK; Washington, DC, USA, 2010. [Google Scholar]
- Hanley, N.; Mourato, S.; Wright, R.E. Choice Modelling Approaches: A Superior Alternative for Enviromental Valuation? J. Econ. Surv. 2001, 15, 435–462. [Google Scholar] [CrossRef]
- Gravelle, H.; Rees, R. Microeconomics, 2nd ed.; London Longman: London, UK, 1992. [Google Scholar]
- Estifanos, T.K.; Polyakov, M.; Pandit, R.; Hailu, A.; Burton, M. Managing Conflicts between Local Land Use and the Protection of the Ethiopian Wolf: Residents’ Preferences for Conservation Program Design Features. Ecol. Econ. 2020, 169, 106511. [Google Scholar] [CrossRef]
- Cerda, C.; Ponce, A.; Zappi, M. Using Choice Experiments to Understand Public Demand for the Conservation of Nature: A Case Study in a Protected Area of Chile. J. Nat. Conserv. 2013, 21, 143–153. [Google Scholar] [CrossRef]
- Van Zanten, B.T.; Verburg, P.H.; Scholte, S.S.K.; Tieskens, K.F. Using Choice Modeling to Map Aesthetic Values at a Landscape Scale: Lessons from a Dutch Case Study. Ecol. Econ. 2016, 130, 221–231. [Google Scholar] [CrossRef]
- BBG Authority. Map of Bogor Botanical Garden; BBG Authority: Bogor, Indonesia, 2020. [Google Scholar]
- Fauzi, A. Ekonomi Sumberdaya Alam Dan Lingkungan (Teori Dan Aplikasi); PT Gramedia Pustaka Utama: Jakarta, Indonesia, 2010. [Google Scholar]
- Fauzi, R. Valuasi Ekonomi Taman Nasional Kalimutu Melalui Pendekatan Nilai Ekonomi Wisata; Thesis Universitas Indonesia: Depok, Indonesia, 2013. [Google Scholar]
- Adamowicz, W.; Louviere, J.; Swait, J. Introduction to Attribute-Based Stated Choice Methods; A Report Submitted To: National Oceanic and Atmospheric Administration (NOAA); National Oceanic and Atmospheric Administration (NOAA): Washington, DC, USA, 1998.
- Louviere, J.J.; Hensher, D.A.; Swait, J.D. Stated Choice Methods Analysis and Applications; Cambridge University Press: Cambridge, UK, 2000. [Google Scholar]
- Wang, X.; Bennett, J.; Xie, C.; Zhang, Z.; Liang, D. Estimating Non-Market Environmental Benefits of the Conversion of Cropland to Forest and Grassland Program: A Choice Modeling Approach. Ecol. Econ. 2006, 3, 114–125. [Google Scholar] [CrossRef] [Green Version]
Figure 1.
Total economic value. Source: adapted from [25].
Figure 1.
Total economic value. Source: adapted from [25].

Figure 2.
Map of Bogor Botanical Gardens. Source: [31].
Figure 2.
Map of Bogor Botanical Gardens. Source: [31].

Figure 3.
Sample of choice set.


Table 1.
Attributes and levels.
| Atributes | Detail | Level | Status Quo | ||
|---|---|---|---|---|---|
| 1 | 2 | 3 | |||
| species | The number of plant species | 3150 | 3800 (increase by 20%) | 4400 (increase by 40%) | 3150 |
| enveduc | Information and environmental educational tools and infrastructure services | Fair 1 | Good 2 | Comprehensive 3 | Fair 1 |
| touristcar | The use of private cars 4 and serviced cars 5 | Charged private car and charged serviced car | No private car and charged serviced car | No private car and free serviced car | Charged private car and charged serviced car |
| charge | Entrance fee | IDR 15,000 | IDR 25,000 | IDR 35,000 | IDR 15,000 |
The coverage of information and environmental educational service includes: 1 Fair: Brochures, visitor centers, garden maps, plant collection identities, interpretation boards, and scouting and flora tours. 2 Good: Brochures, visitor centers, garden maps, plant collection identities, interpretation boards, scouting and flora tours, and digital mobile applications (QR code/digitization interpretation boards, digital maps). 3 Comprehensive: Brochures, visitor centers, garden maps, plant collection identities, interpretation boards, scouting and flora tours, and digital mobile applications (QR code/digitization interpretation boards, digital maps), as well as events and exhibits related to an education environment. Details in touristcar mean: 4 Private car: Visitor’s car. 5 Service car: Car provided by BBG.
Table 2.
Respondent characteristics.
| Description | Frequency | Sample (N = 414) | Description | Frequency | Sample (N = 414) |
|---|---|---|---|---|---|
| Gender | Profession | ||||
| Male | 175 | 42.27% | Civil servant | 35 | 8.45% |
| Female | 239 | 57.73% | Private company employee | 142 | 34.30% |
| Marital Status | Entrepreneur | 92 | 22.22% | ||
| Married | 239 | 57.73% | Other | 47 | 11.35% |
| Unmarried | 175 | 42.27% | Not working | 98 | 23.67% |
| Age | Residence | ||||
| 18–24 | 127 | 30.68% | DKI Jakarta | 89 | 21.50% |
| 25–40 | 174 | 42.03% | Bogor City | 105 | 25.36% |
| 41–60 | 105 | 25.36% | Bogor Regency | 96 | 23.19% |
| >60 | 8 | 1.93% | Depok | 24 | 5.80% |
| Education | Tangerang | 39 | 9.42% | ||
| High school and lower | 238 | 57.49% | Bekasi | 22 | 5.31% |
| Tertiary education and higher | 176 | 42.51% | Other | 39 | 9.42% |
| Income | Main Transport | ||||
| IDR 0 to IDR 6,000,000 | 331 | 79.95% | Private car | 116 | 28.02% |
| IDR 6,000,000 to IDR 12,000,000 | 61 | 14.73% | Motorcycle | 113 | 27.29% |
| >IDR 12,000,000 | 22 | 5.31% | Other | 185 | 44.69% |
Table 3.
Travel cost regression result.
| Variable | Coefficient | Standard Error |
|---|---|---|
| travelcost | −0.859 * | (0.480) |
| age | 0.00484 | (0.0135) |
| gender (1 = male) | 0.428 * | (0.249) |
| marital status (1 = unmarriage) | −0.328 | (0.342) |
| income | −0.0251 | (0.0349) |
| education (1 = higher than high school) | −0.509 * | (0.264) |
| _cons | 3.673 ** | (0.871) |
| Observations | 414 | |
| R-squared | 0.037 | |
| Prob > F | 0.01 |
Standard errors in parentheses * p < 0.1, ** p < 0.01.
Table 4.
Effect coding for non-linear attributes.
| Attribute | Variable 1 | Variable 2 |
|---|---|---|
| Level of information and environmental educational tools and infrastructures | enveduc1 | enveduc2 |
| Comprehensive | 1 | 0 |
| Good | 0 | 1 |
| Fair | −1 | −1 |
| The use of private and service car level | touristcar1 | touristcar2 |
| No private car and free service car | 1 | 0 |
| No private car and charged service car | 0 | 1 |
| Charged private car and charged servic ecar | −1 | −1 |
Table 5.
Results of Regression Models with Socioeconomic Factors.
| Variable | A Model with Socioeconomic Factors | |||
|---|---|---|---|---|
| Detail | Coeff. | Standard Error | MWTP (IDR) | |
| ASC | Alternative specific constant | 0.618 ** | (0.310) | |
| species | The number of plant species | 0.0000941 | (0.0000778) | |
| enveduc1 | Dummy variable showing the increase from good to comprehensive level in the information and educational tools and infrastructures | 0.0746 | (0.0532) | |
| enveduc2 | Dummy variable showing the increase from fair to good level in the information and educational tools and infrastructures | 0.0878 * | (0.0531) | 1301.11 |
| touristcar1 | Dummy variable showing the increase from paid service car to free service car | 0.268 *** | (0.0532) | 3968.30 |
| touristcar2 | Dummy variable showing the increase from paid private and service cars to paid service car only | −0.0565 | (0.0528) | |
| charge | Entrance fee | −0.0000675 *** | (0.00000854) | |
| aage | ASC age interaction | −0.0380 *** | (0.00395) | |
| agender | ASC gender interaction (1 = male) | −0.241 *** | (0.0899) | |
| aeduc | ASC education level interaction (1 = higher than high school) | 0.444 *** | (0.0935) | |
| aspend | ASC expense interaction | 0.0998 ** | (0.0464) | |
| afams | ASC number of family interaction | 0.0237 | (0.0278) | |
| aenvico | ASC environmental awareness interaction | 0.347 *** | (0.0886) | |
| aconsorg | ASC involvement in environmental conservation organizations interaction | 0.0634 | (0.200) | |
| ausecar | ASC private car use interaction | 0.126 | (0.102) | |
| N | 3519 | |||
| pseudo R-square | 0.102 | |||
| chi2 | 471.6 | |||
| p | 5.71 × 10−91 | |||
Standard errors in parentheses * p < 0.1, ** p < 0.05, *** p < 0.01.
Publisher’s Note: MDPI stays neutral with regard to jurisdictional claims in published maps and institutional affiliations. |
© 2020 by the authors. Licensee MDPI, Basel, Switzerland. This article is an open access article distributed under the terms and conditions of the Creative Commons Attribution (CC BY) license (http://creativecommons.org/licenses/by/4.0/).
Share and Cite
MDPI and ACS Style
Affandi, S.D.; Halimatussadiah, A.; Asrofani, F.W. Visitors’ Preferences on the Characteristics of Bogor Botanical Gardens. Sustainability 2020, 12, 9489. https://0-doi-org.brum.beds.ac.uk/10.3390/su12229489
AMA Style
Affandi SD, Halimatussadiah A, Asrofani FW. Visitors’ Preferences on the Characteristics of Bogor Botanical Gardens. Sustainability. 2020; 12(22):9489. https://0-doi-org.brum.beds.ac.uk/10.3390/su12229489
Chicago/Turabian StyleAffandi, Sigit Dian, Alin Halimatussadiah, and Farha Widya Asrofani. 2020. "Visitors’ Preferences on the Characteristics of Bogor Botanical Gardens" Sustainability 12, no. 22: 9489. https://0-doi-org.brum.beds.ac.uk/10.3390/su12229489
Note that from the first issue of 2016, this journal uses article numbers instead of page numbers. See further details here.