Maintenance Decision-Making of an Urban Rail Transit System in a Regionalized Network-Wide Perspective


Abstract
:1. Introduction
2. Literature Review
2.1. Multi-Facility Location-Allocation Model in the Network
2.2. The Method of Allocating Maintenance Resource
- A novel URT-NMDP is defined from the network-wide maintenance with an incapacitated constraints perspective.
- A new multi-objective integer programming model for designing the regionalized maintenance network is established by integrating the set coverage model with the P-median model, and several critical guarantee rules are followed in the model.
- The reliability problem of the resource allocation is described for the URT maintenance network in a real-world environment by the Monte Carlo simulation.
- A case study on Changchun city with a developing URT system is given. The performance of the regionalized maintenance network is evaluated from a network-wide maintenance perspective. The applicability of regionalized network-wide maintenance and management mode is analyzed by comparing it with other two modes.
3. Model and Algorithm for the URT-NMDP
3.1. Problem Description
- The maintenance point is selected among nodes, and the range of its total number is determined in advance based on experience.
- The only maintenance point is deployed for every regional subnet, and each maintenance demand point can be assigned to the only maintenance point. That is, the sole maintenance responsibility rule is followed in the maintenance network.
- The distance between each pair of nodes can be obtained through practical investigation.
- A node and its adjacent edge in the driving direction are collectively called a maintenance demand point. Therefore, the allocation of demand points is mainly calculated according to the node. If the node is assigned to a maintenance point, the corresponding adjacent edge will be assigned to the same maintenance point.
- Large-size and special-purpose maintenance equipment and materials are unitedly configured and managed in a unified manner with the maintenance network; they are not considered in the research. This work mainly configures basic maintenance resources for maintenance points in the regional subnets.
- Each maintenance demand point in the network contains K types of professional equipment, and the corresponding maintenance resources is also divided into K categories. That is, the maintenance resources can complete all tasks with different technical levels, which are uniformly configured by category.
- The failure rate of each demand point is different.
- The average travel speed of maintenance resources from the maintenance point to the maintenance demand point is .
- The maximum failure response time requested by the system is known.
3.2. Maintenance Guarantee Rule
3.2.1. Node Importance
3.2.2. Timeliness of Failure Response
3.2.3. The Method of Allocating Maintenance Unit
3.3. Mathematical Model
3.4. Solving Algorithm
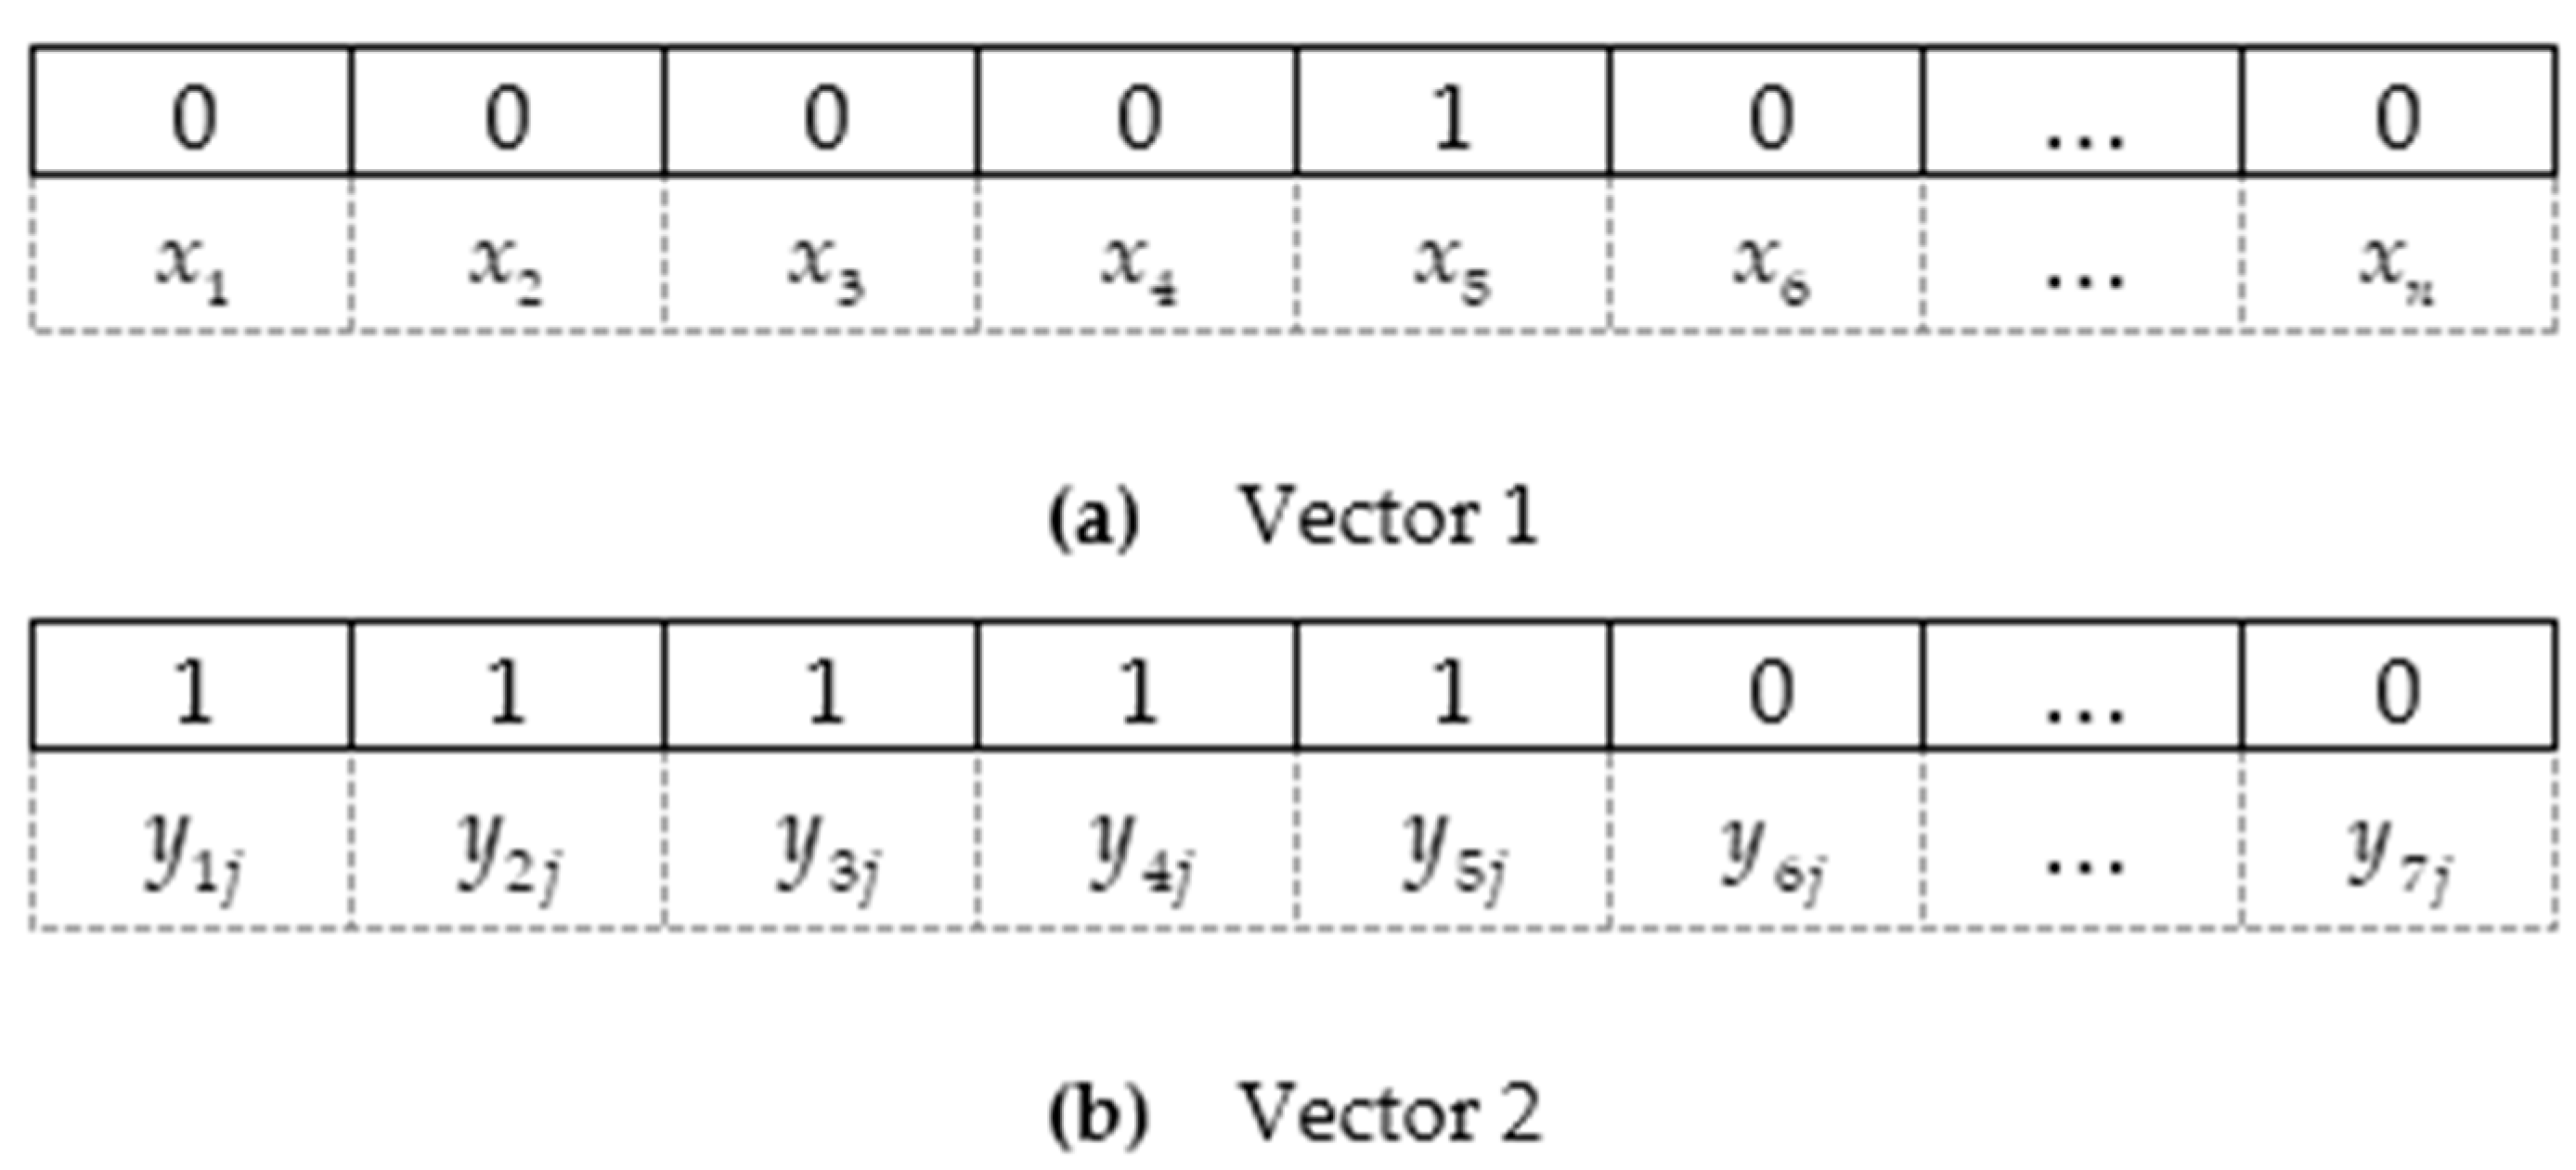
- Step 1: Solution encoding
- Step 2: Initialization
- Step 3: Resource allocation
- Step 4: Non-dominated sorting
- Step 5: Pareto optimal solution under the elite strategy
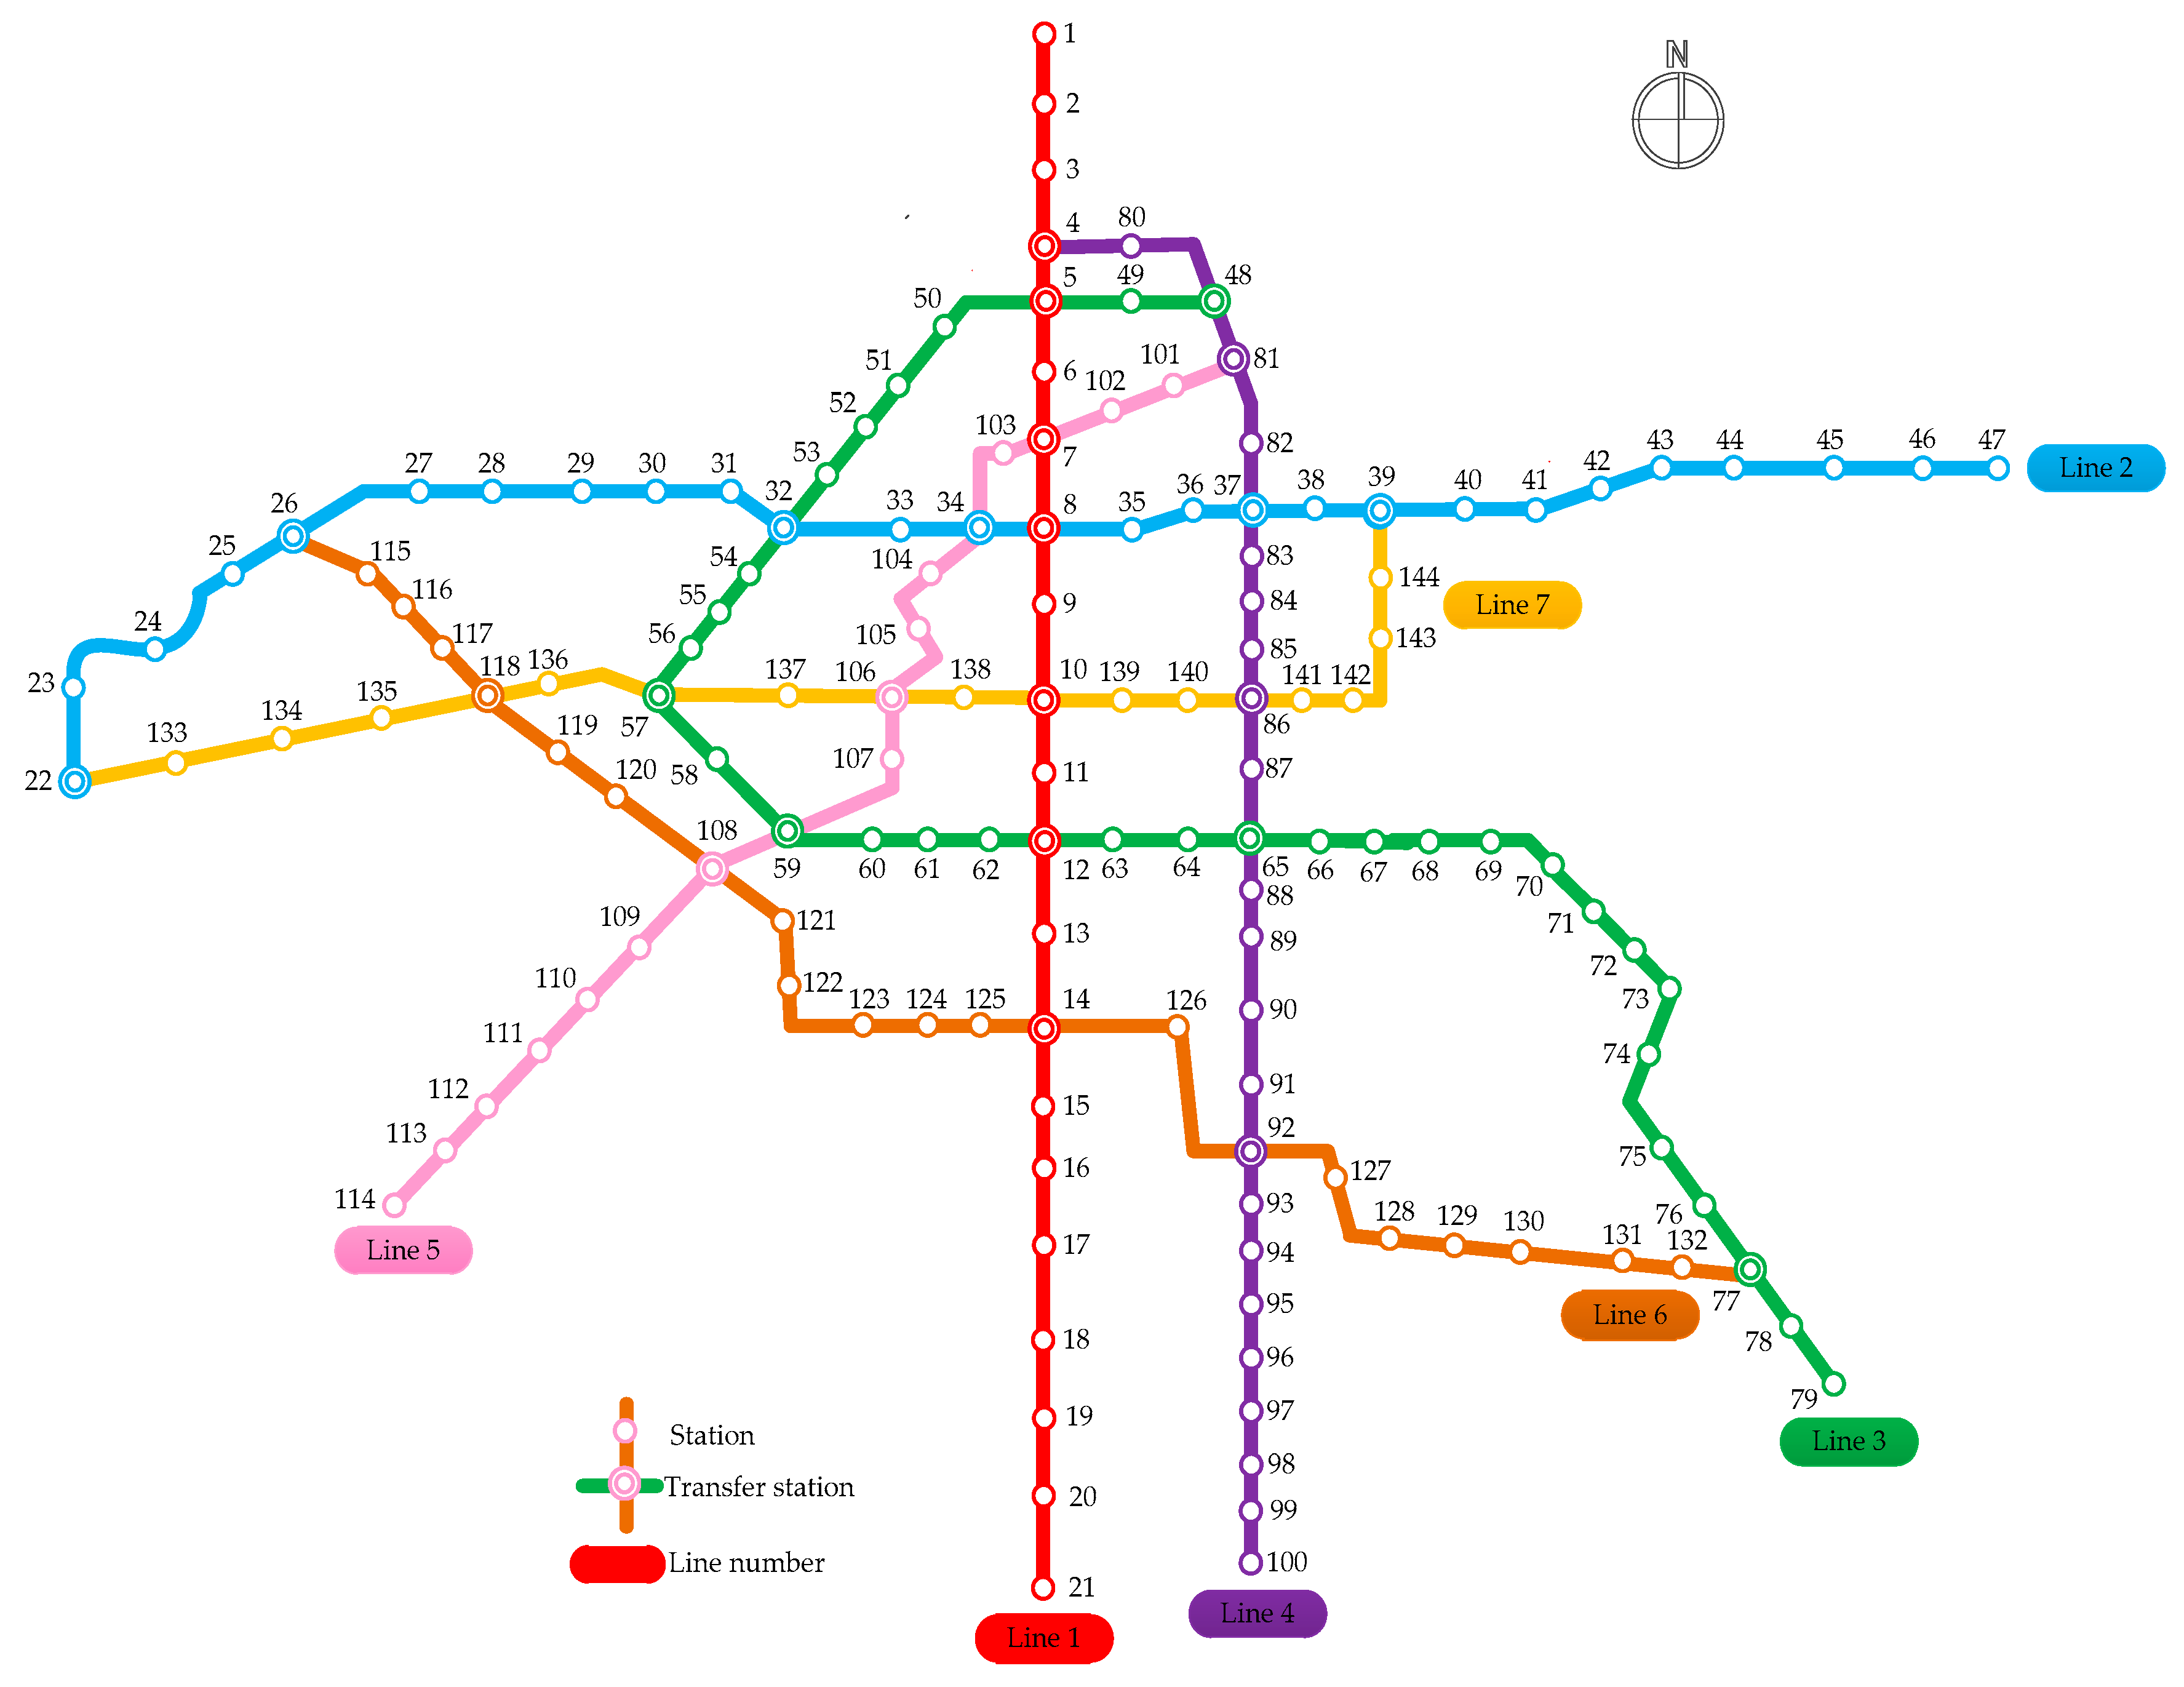
4. Case Study
4.1. The Impact of on Maintenance Network Desgining
Experiment 1
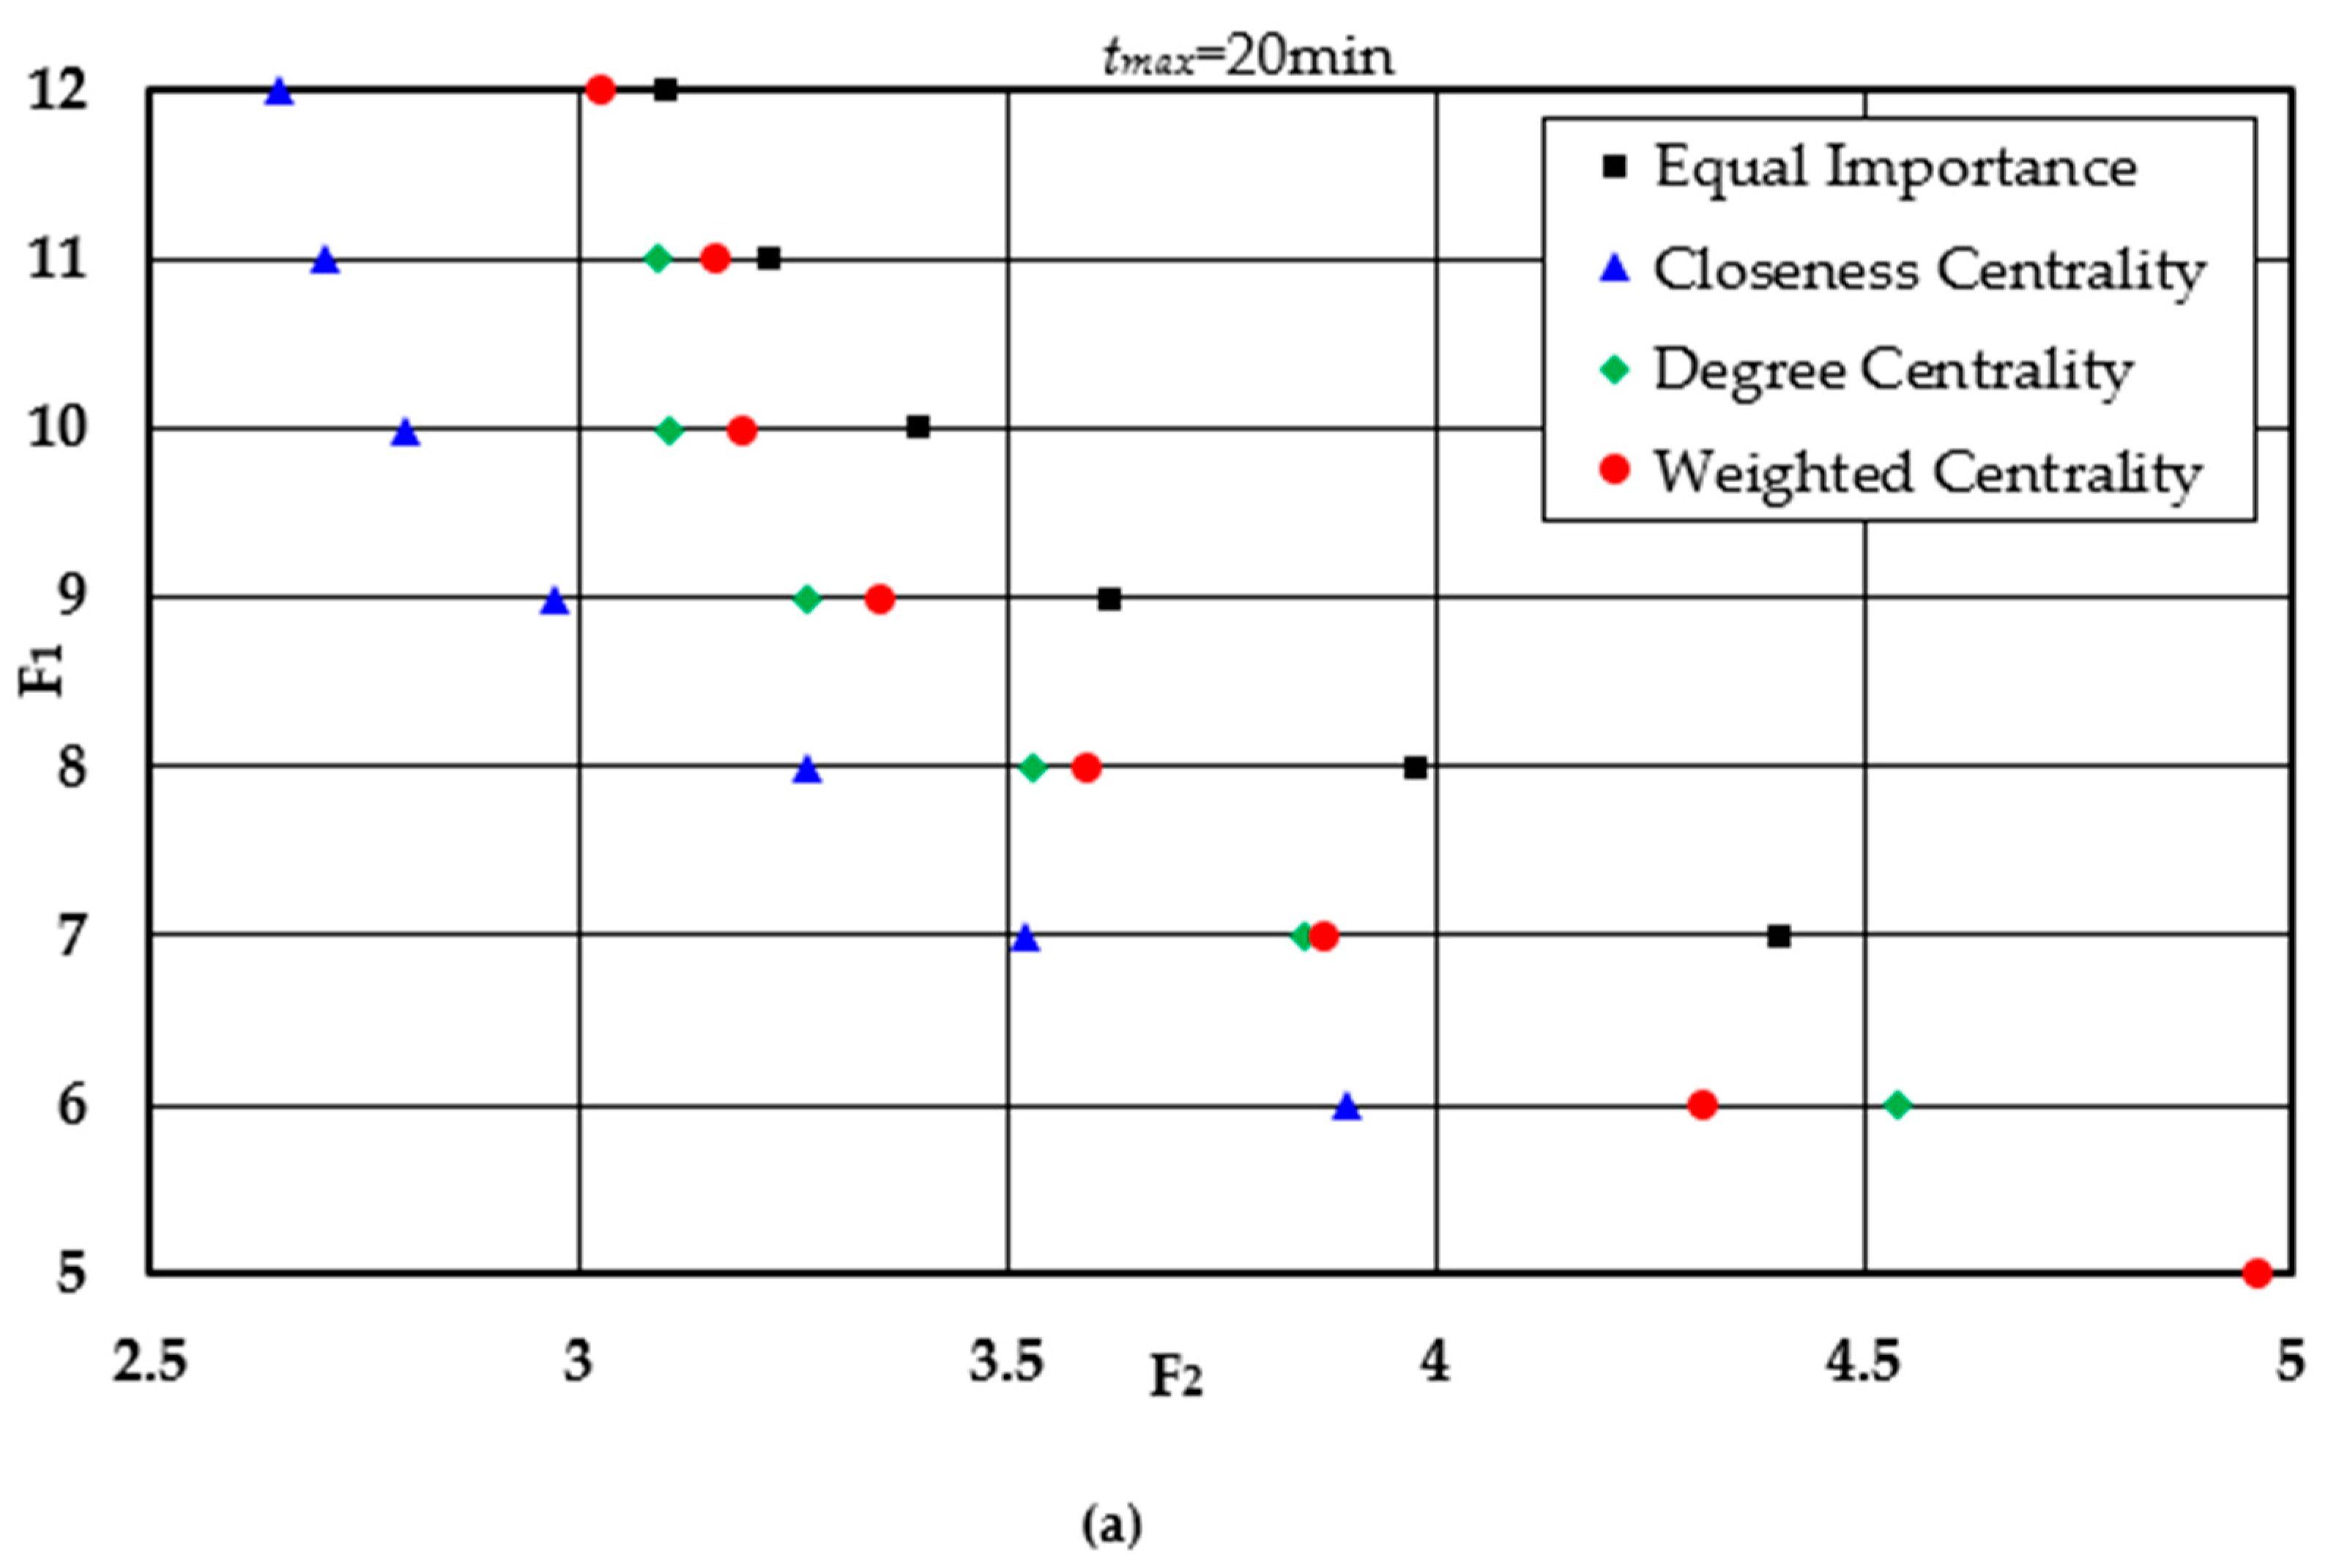
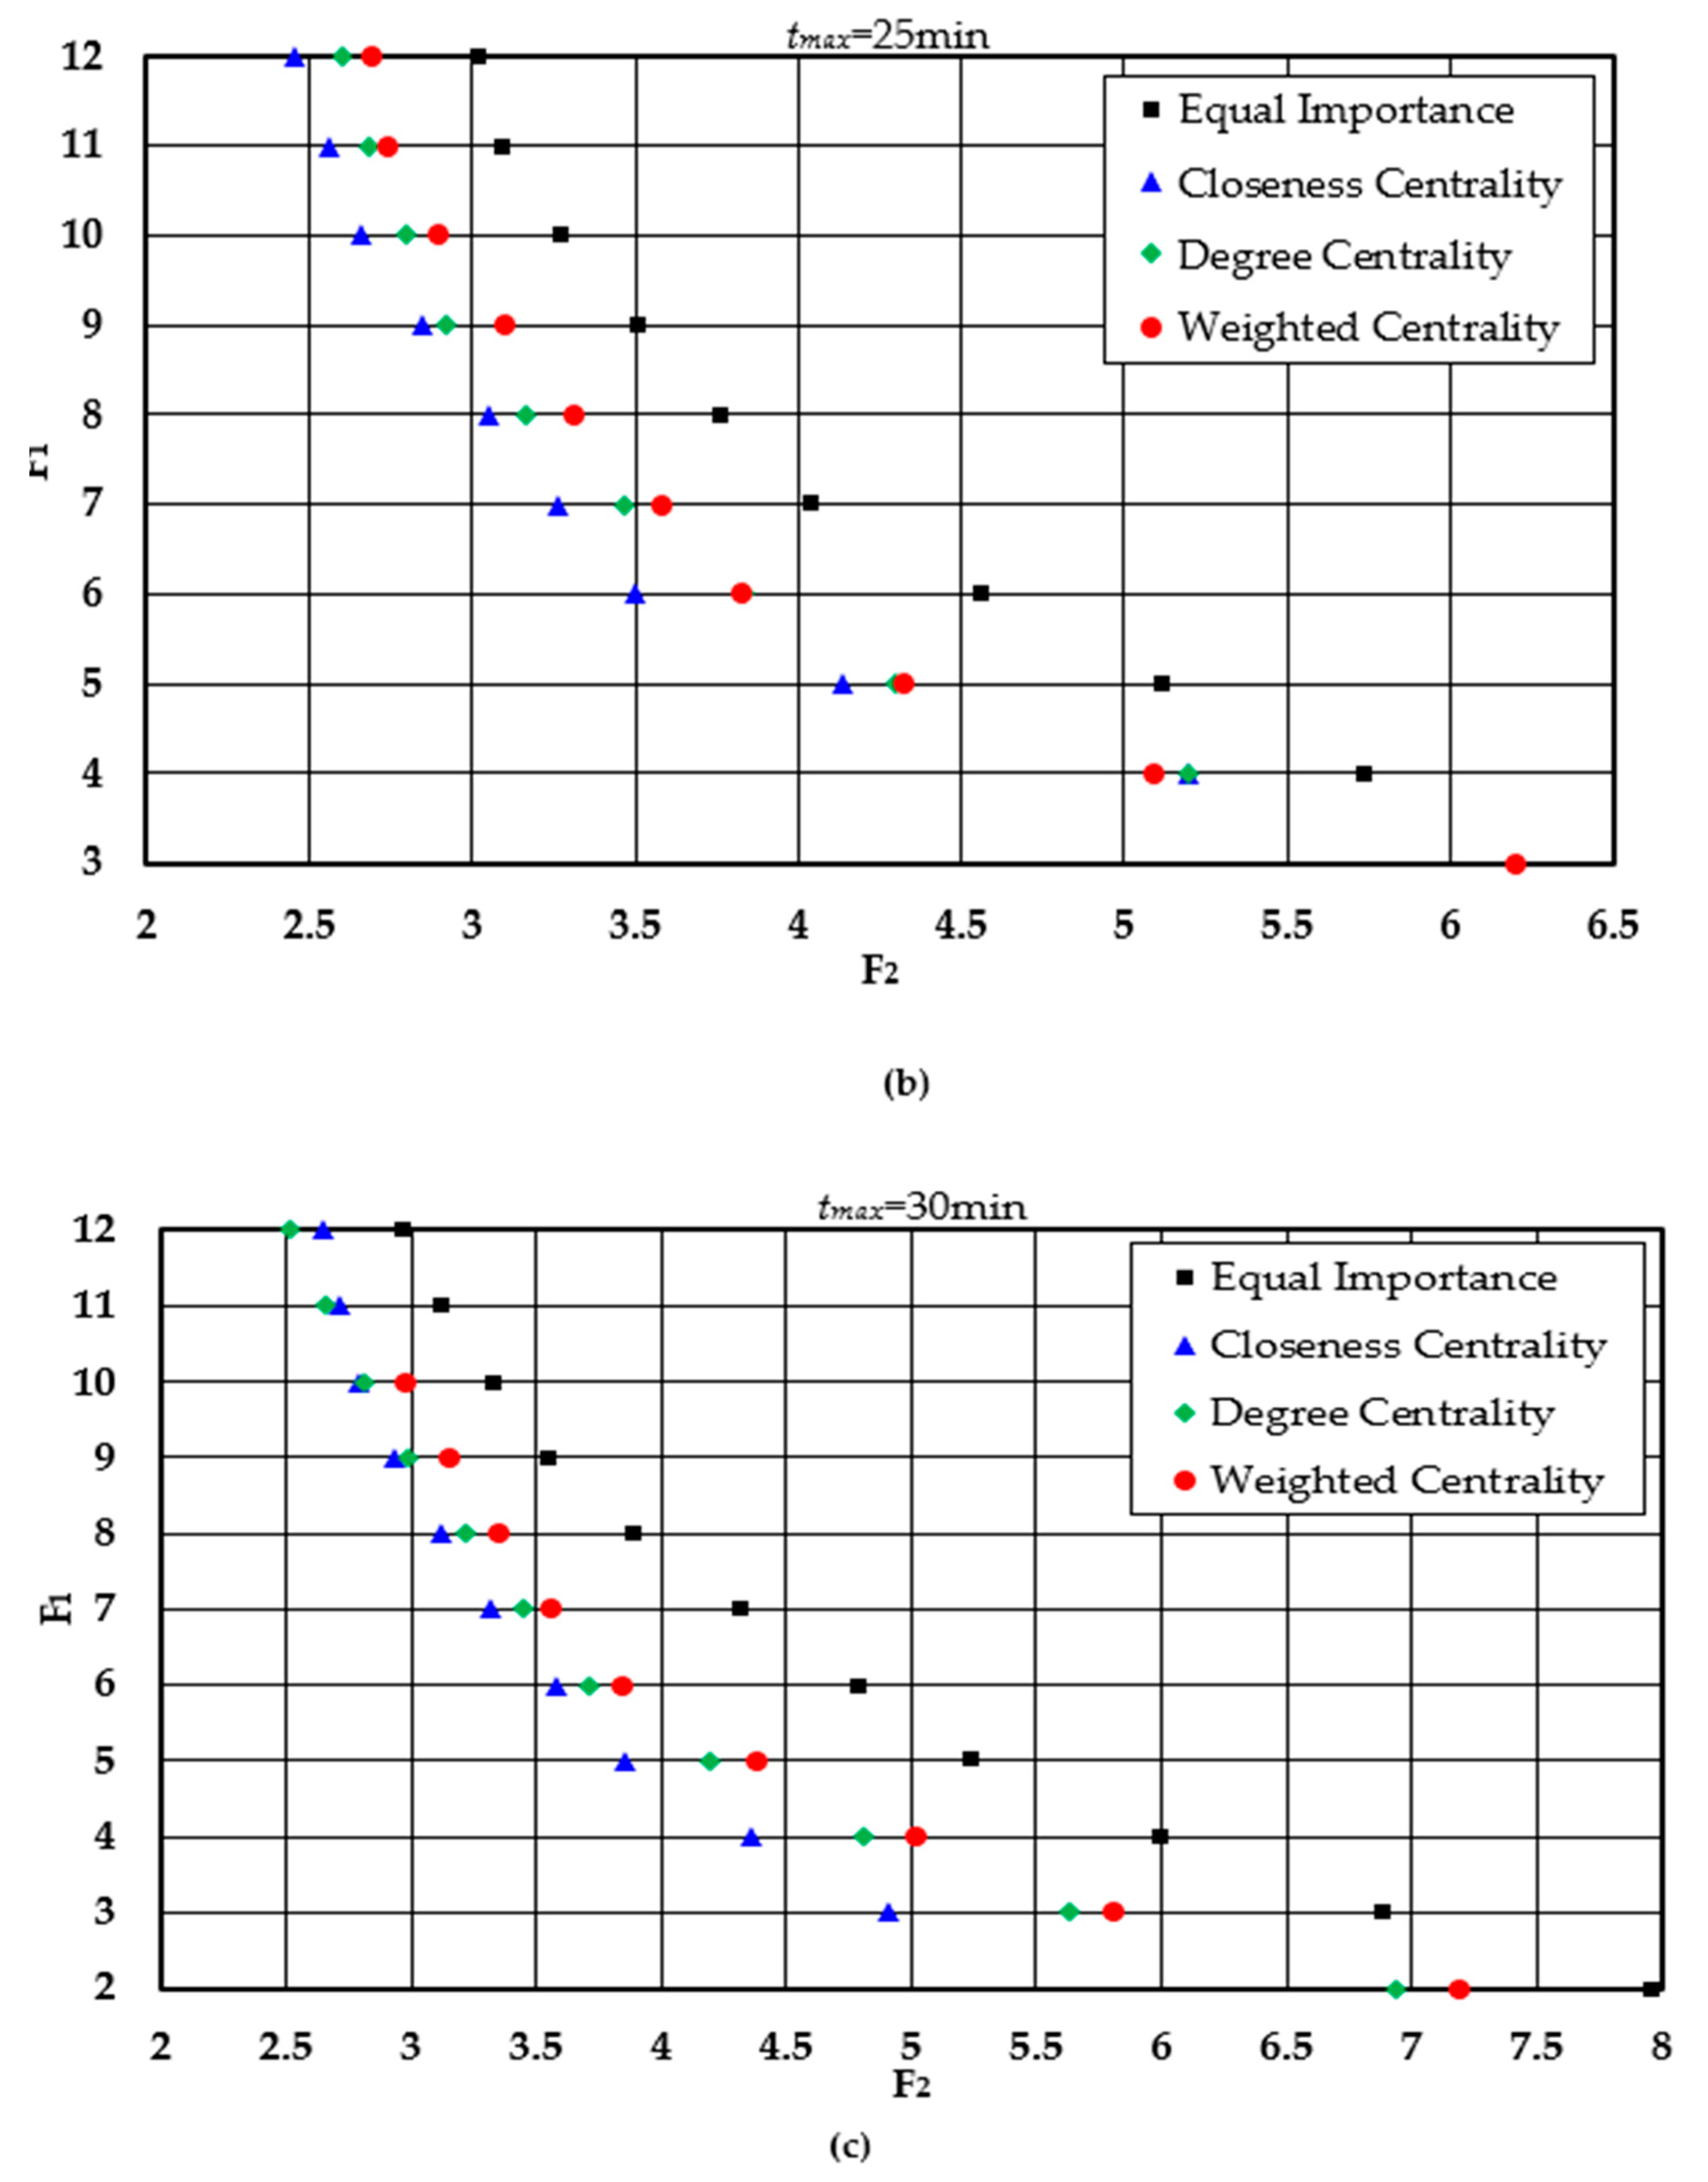
4.2. The Impact of on the Performance of Maintenance Network
Experiment 2
4.3. Adaptability Analysis of the Regionlized Network-Wide Maintenance Mode
5. Conclusions
Author Contributions
Funding
Acknowledgments
Conflicts of Interest
Appendix A

| Line 1 | Line 2 | Line 3 | Line 4 | Line 5 | Line 6 | Line 7 | |
|---|---|---|---|---|---|---|---|
| (1,2) = 1.4 (2,3) = 1.2 (3,4) = 1.4 (4,5) = 0.7 (5,6) = 0.9 (6,7) = 1.4 (7,8) = 1.2 (8,9) = 1.4 (9,10) = 1.6 (10,11) =1.1 (11,12) =1.1 (12,13) =1.6 (13,14) =2.0 (14,15) =1.4 (15,16) =1.2 (16,17) =1.4 (17,18) =0.7 (18,19) =1.6 (19,20) =1.2 (20,21) =2.0 | (22,23) = 1.7 (23,24) = 1.1 (24,25) = 2.0 (25,26) = 1.7 (26,27) = 2.0 (27,28) = 1.2 (28,29) = 1.2 (29,30) = 0.9 (30,31) = 0.9 (31,32) = 1.0 (32,33) = 0.7 (33,34) = 1.0 (8,34) = 1.5 (8,35) = 1.1 (35,36) = 1.0 (36,37) = 1.5 (37,38) = 1.0 (38,39) = 1.5 (39,40) = 1.1 (40,41) = 1.5 (41,42) = 2.0 (42,43) = 2.0 (43,44) = 1.7 (44,45) = 2.0 (45,46) = 1.7 (46,47) = 2.0 | (48,49) = 1.2 (5,49) = 1.4 (5,50) = 1.6 (50,51) = 1.2 (51,52) = 0.6 (52,53) = 0.6 (32,53) = 1.1 (32,54) = 0.9 (54,55) = 0.7 (55,56) = 0.9 (56,57) = 0.9 (57,58) = 1.1 (58,59) = 1.6 (59,60) = 0.9 (60,61) = 0.9 (61,62) = 0.7 (12,62) = 1.2 (12,63) = 1.2 (63,64) = 1.2 (64,65) = 1.2 (65,66) = 1.2 (66,67) = 1.2 (67,68) = 1.1 | (68,69) = 1.2 (69,70) = 0.9 (70,71) = 1.2 (71,72) = 1.2 (72,73) = 1.1 (73,74) = 1.6 (74,75) = 1.1 (75,76) = 0.9 (76,77) = 0.9 (77,78) = 1.1 (78,79) = 1.8 | (4,80) = 1.3 (48,80) = 1.1 (48,81) = 0.9 (81,82) = 1.4 (37,82) = 1.1 (37,83) = 0.9 (83,84) = 0.9 (84,85) = 0.7 (85,86) = 0.7 (86,87) = 1.1 (65,87) = 1.4 (65,88) = 0.7 (88,89) = 0.9 (89,90) = 1.4 (90,91) = 1.4 (91,92) = 1.1 (92,93) = 0.9 (93,94) = 0.9 (94,95) = 0.9 (95,96) = 0.7 (96,97) = 0.7 (97,98) = 0.7 (98,99) = 0.7 (99,100) = 1.1 | (81,101) = 1.1 (101,102) = 1.1 (7,102) = 1.1 (7,103) = 0.9 (34,103) = 1.4 (34,104) = 1.1 (104,105) = 1.6 (105,106) = 0.9 (106,107) = 1.1 (59,107) = 1.4 (59,108) = 1.9 (108,109) = 1.9 (109,110) = 0.7 (110,111) = 0.9 (111,112) = 0.9 (112,113) = 0.9 (113,114) = 0.9 | (26,115) = 1.2 (115,116) = 1.0 (116,117) = 0.9 (117,118) = 1.2 (118,119) = 1.4 (119,120) = 1.4 (108,120) = 1.7 (108,121) = 1.4 (121,122) = 1.2 (122,123) = 2.1 (123,124) = 0.7 (124,125) = 0.7 (14,125) = 1.0 (14,126) = 2.6 (92,126) = 2.6 (92,127) = 1.2 (127,128) = 1.4 (128,129) = 0.7 (129,130) = 0.9 (130,131) = 1.7 (131,132) = 0.9 (77,132) = 1.7 | (22,133) = 1.6 (133,134) = 1.6 (134,135) = 1.6 (118,135) = 0.9 (118,136) = 1.4 (57,136) = 1.4 (57,137) = 1.2 (106,137) = 1.2 (106,138) = 0.9 (10,138) = 1.8 (10,139) = 1.2 (139,140) = 0.9 (86,140) = 1.4 (86,141) = 0.9 (141,142) = 0.9 (142,143) = 1.8 (143,144) = 0.9 (39,144) = 0.9 |
References
- Han, B.M.; Chen, J.H.; Yang, Y.J.; Qian, L.; Yang, Z.X.; Dai, W. Statistical analysis of urban rail transit operation in the world in 2019: A review. Urban Rapid Rail Transit. 2020, 33, 4–8. [Google Scholar]
- Urban Rail Transit 2019 Annual Statistics and Analysis Report. China Assoc. Metros. 2020, 2, 1–53. Available online: https://www.camet.org.cn/tjxx/5133 (accessed on 18 May 2020).
- Yuan, X.Y.; Tang, J.C.; Wong, W.K.; Songsak, S. Modeling Co-movement among different agricultural commodity markets: A Copula-GARCH approach. Sustainability 2020, 12, 7873. [Google Scholar] [CrossRef] [Green Version]
- Yu, G.Y. Maintenance strategy and network integration in shanghai metro. Urban Mass Transit. 2014, 17, 1–7. [Google Scholar] [CrossRef]
- He, L.; Liang, Q.; Fang, S. Challenges and innovative solutions in urban rail transit network operations and management: China’s Guangzhou Metro experience. Urban Rail Transit. 2016, 2, 33–45. [Google Scholar] [CrossRef] [Green Version]
- He, L. Urban Rail Transit Operation Management from Order to Effectiveness; China Labor and Social Security Press: Beijing, China, 2015; pp. 73–87. [Google Scholar]
- Juan, F.G.F.; Adolfo, C.M. Maintenance Management in Network Utilities: Framework and Practical Implementation; Springer: London, UK, 2012; pp. 33–45. [Google Scholar] [CrossRef]
- Ren, W.; Wu, K.; Gu, Q.; Hu, Y. Intelligent decision making for service providers selection in maintenance service network: An adaptive fuzzy-neuro approach. Knowl. Based Syst. 2020, 190, 105263. [Google Scholar] [CrossRef]
- Hu, Y.; Xiao, S.; Wen, J.; Li, J. ANP-multi-criterion-based methodology to construct maintenance networks for agricultural machinery cluster in a balanced scorecard context. Comput. Electron. Agric. 2019, 158, 1–10. [Google Scholar] [CrossRef]
- Ren, W.; Wen, J.; Hu, Y.; Li, J. Maintenance service network redesign for geographically distributed moving assets using NSGA-II in agriculture. Comput. Electron. Agric. 2020, 169, 105170. [Google Scholar] [CrossRef]
- Wu, S.; Yang, Z. Locating manufacturing industries by flow-capturing location model—Case of Chinese steel industry. Transp. Res. Part E Logist. Transp. Rev. 2018, 112, 1–11. [Google Scholar] [CrossRef]
- Reza, Z.F.; Samira, F.; Ruiz, R.; Sara, H.; Nasrin, A. OR models in urban service facility location: A critical review of applications and future developments. Eur. J. Oper. Res. 2019, 276, 1–27. [Google Scholar] [CrossRef]
- Guden, H.; Sural, H. The dynamic p-median problem with mobile facilities. Comput. Ind. Eng. 2019, 135, 615–627. [Google Scholar] [CrossRef]
- Farahani, R.Z.; Asgari, N.; Heidari, N.; Hosseininia, M.; Goh, M. Covering problems in facility location: A review. Comput. Ind. Eng. 2012, 62, 368–407. [Google Scholar] [CrossRef]
- Wang, K.J.; Makond, B.; Liu, S.Y. Location and allocation decisions in a two-echelon supply chain with stochastic demand—A genetic-algorithm based solution. Expert Syst. Appl. 2011, 38, 6125–6131. [Google Scholar] [CrossRef]
- An, Y.; Zeng, B.; Zhang, Y.; Zhao, L. Reliable p-median facility location problem: Two-stage robust models and algorithms. Transp. Res. Part B Methodol. 2014, 64, 54–72. [Google Scholar] [CrossRef]
- Li, W.; Huan, S.; Lu, G. Healthcare facility location-allocation optimization for China’s developing cities utilizing a multi-objective decision support approach. Sustainability 2018, 10, 4580. [Google Scholar] [CrossRef] [Green Version]
- Sun, X.L. Optimization Research on Emergency Rescue Stations Siting and Resources Settings of Urban Rail Transit Network; Beijing Jiaotong University: Beijing, China, 2012. [Google Scholar]
- Ye, L.; Ye, C.; Chuang, Y.F. Location set covering for waste resource recycling centers in Taiwan. Resour. Conserv. Recycl. 2011, 55, 979–985. [Google Scholar] [CrossRef]
- Vianna, S.S. The set covering problem applied to optimization of gas detectors in chemical process plants. Comput. Chem. Eng. 2019, 121, 388–395. [Google Scholar] [CrossRef]
- Chen, L.; Yuan, D. Solving a minimum-power covering problem with overlap constraint for cellular network design. Eur. J. Oper. Res. 2010, 203, 714–723. [Google Scholar] [CrossRef] [Green Version]
- Jiang, Y.; Sun, B.F.; Zheng, L.L.; Cui, W.K.; Mao, X.H. Modified maintenance network model for urban rail transit systems based on the variable coverage radius: Evidence from Changchun city in China. J. Adv. Transp. 2020, 2020, 1–11. [Google Scholar] [CrossRef]
- Erdemir, E.T.; Batta, R.; Rogerson, P.A.; Blattb, A.; Flaniganb, M. Joint ground and air emergency medical services coverage models: A greedy heuristic solution approach. Eur. J. Oper. Res. 2010, 207, 736–749. [Google Scholar] [CrossRef]
- Sittipong, D.; Chulin, L.; Radom, P. Applied p-median and p-center algorithms for facility location problems. Expert Syst. Appl. 2014, 41, 3596–3604. [Google Scholar] [CrossRef]
- Daisik, N.; Minyoung, P. Improving the operational efficiency of parcel delivery network with a bi-level decision making model. Sustainability 2020, 12, 8042. [Google Scholar] [CrossRef]
- Irawan, C.A.; Imran, A.; Luis, M. Solving the bi-objective capacitated p-median problem with multilevel capacities using compromise programming and VNS. Int. Trans. Oper. Res. 2020, 27, 361–380. [Google Scholar] [CrossRef] [Green Version]
- Zhang, B.; Xu, Y.; Dong, Y.; Hou, N.; Yu, Y. Research on the optimization method of maintenance support unit configuration with queuing theory. Phys. Procedia 2012, 33, 368–374. [Google Scholar] [CrossRef] [Green Version]
- Li, S.; Li, Z. Spare parts allocation by improved genetic algorithm and Monte Carlo simulation. Int. J. Syst. Sci. 2012, 43, 997–1006. [Google Scholar] [CrossRef]
- Nguyen, D.Q.; Bagajewicz, M. Optimization of preventive maintenance in chemical process plants. Comput. Aided Chem. Eng. 2008, 25, 319–324. [Google Scholar] [CrossRef]
- Sheng, S.; Li, K.K.; Chan, W.L.; Zeng, X.G.; Duan, X.Z. Monte Carlo based maintenance resource allocation considering vulnerability. In Proceedings of the 2005 IEEE/PES Transmission and Distribution Conference and Exposition: Asia and Pacific, Dalian, China, 18 August 2005; pp. 1–5. [Google Scholar] [CrossRef]
- Wang, Y.L.; Jin, C.; Ran, H.L.; Ren, W.G. Monte-Carlo simulation allocation of Weibull distribution spare parts. J. Liaoning Tech. Univ. (Nat. Sci.) 2018, 37, 159–162. [Google Scholar]
- Gorman, M.F.; Kanet, J.J. Formulation and solution approaches to the rail maintenance production gang scheduling problem. J. Transp. Eng. 2010, 136, 701–708. [Google Scholar] [CrossRef]
- Pour, S.M.; Rasmussen, K.M.; Drake, J.H.; Edmund, K.B. A constructive framework for the preventive signaling maintenance crew scheduling problem in the Danish railway system. J. Oper. Res. Soc. 2019, 70, 1956–1982. [Google Scholar] [CrossRef]
- Lau, H.C.; Yuan, Z.; Gunawan, A. Patrol scheduling in urban rail network. Ann. Oper. Res. 2016, 239, 317–342. [Google Scholar] [CrossRef]
- Wang, H.J. Research on Optimal Allocation of Maintenance Resources for Nanjing Metro Vehicles. Nanjing Univ. Sci. Technol. 2011. Available online: http://dx.chinadoi.cn/10.7666/d.y1919538 (accessed on 30 August 2020).
- Du, Z.; Tang, J.; Qi, Y.; Wang, Y.; Han, C.; Yang, Y. Identifying critical nodes in metro network considering topological potential: A case study in Shenzhen city—China. Phys. A Stat. Mech. Appl. 2020, 539, 122926. [Google Scholar] [CrossRef]
- Zhang, J.H.; Wang, S.L.; Zhang, Z.J.; Zou, K.S.; Shu, Z. Characteristics on hub networks of urban rail transit networks. Phys. A Stat. Mech. Appl. 2016, 447, 502–507. [Google Scholar] [CrossRef]
- Zhang, H.; Zhuge, C.; Yu, X. Identifying hub stations and important lines of bus networks: A case study in Xiamen, China. Phys. A Stat. Mech. Appl. 2018, 502, 394–402. [Google Scholar] [CrossRef]
- Yang, Y.; Liu, Y.; Zhou, M.; Li, F.; Sun, C. Robustness assessment of urban rail transit based on complex network theory: A case study of the Beijing Subway. Saf. Sci. 2015, 79, 149–162. [Google Scholar] [CrossRef]
- Tian, G.; Zhou, M.; Li, P.; Zhang, C.; Jia, H. Multi-objective optimization models for locating vehicle inspection stations subject to stochastic demand, varying velocity and regional constraints. IEEE Trans. Intell. Transp. Syst. 2016, 17, 1978–1987. [Google Scholar] [CrossRef]
- Miao, H.Z.; Jia, H.F.; Li, J.C.; Qiu, T.Z. Autonomous connected electric vehicle (ACEV)-based car-sharing system modeling and optimal planning: A unified two-stage multi-objective optimization methodology. Energy 2019, 169, 797–818. [Google Scholar] [CrossRef]
- Wang, Y.; Yuan, Y.Y.; Guan, X.Y.; Wang, H.Z.; Liu, Y.; Xu, M.Z. Collaborative mechanism for pickup and delivery problems with heterogeneous vehicles under time windows. Sustainability 2019, 11, 3492. [Google Scholar] [CrossRef] [Green Version]
- Deb, K.; Pratap, A.; Agarwal, S.; Meyarivan, T. A fast and elitist multi-objective genetic algorithm: NSGA-II. IEEE Trans. Evol. Comput. 2002, 6, 182–197. [Google Scholar] [CrossRef] [Green Version]


| F1 | tmax3 = 30 min | tmax2 = 25 min | tmax1 = 20 min | |||||||||||||
|---|---|---|---|---|---|---|---|---|---|---|---|---|---|---|---|---|
| F2 | D3 (km) | (min) | F2 | D2 (km) | D2–D3 (km) | RD (%) | F2 | D1 (km) | D1–D2 (km) | RD (%) | ||||||
| 2 | 7.96 | 1145.90 | 12.85 | 19 | ||||||||||||
| 3 | 6.88 | 991.20 | 11.47 | 21 | ||||||||||||
| 4 | 5.99 | 863.00 | 10.20 | 25 | 5.38 | 825.90 | 9.79 | 24 | −31.70 | −4.30 | ||||||
| 5 | 5.25 | 755.40 | 9.12 | 27 | 5.11 | 736.30 | 8.80 | 26 | −19.10 | −2.53 | ||||||
| 6 | 4.79 | 690.00 | 8.57 | 31 | 1.56 | 657.00 | 8.30 | 30 | −33.00 | −4.78 | ||||||
| 7 | 4.31 | 620.90 | 8.09 | 34 | 4.04 | 581.60 | 7.47 | 31 | −39.30 | −6.33 | 4.40 | 633.70 | 8.01 | 35 | 52.10 | 8.96 |
| Scenarios | j | n | (km) | (min) | (min) | RD (%) | Rt (%) | ||
|---|---|---|---|---|---|---|---|---|---|
| Scenario 1 | 18 | 13,14,15,16,17,18,19,20,21,123,124,125. | 12 | 45.90 | 7.46 | 12.14 | 4 | ||
| 38 | 35,36,37,38,39,40,41,42,43,44,45,46,47,48,80,81,82,83, 84,85,86,87,101,102,139,140,141,142,143,144. | 30 | 143.50 | 8.83 | 21.29 | 6 | |||
| 53 | 1,2,3,4,5,6,7,8,9,27,28,29,30,31,32,33,34,49,50,51,52,53,54,55,103, 104. | 26 | 99.30 | 7.46 | 14.43 | 6 | |||
| 74 | 67,68,69,70,71,72,73,74,75,76,77,78,79. | 13 | 45.10 | 6.96 | 12.29 | 5 | |||
| 93 | 63,64,65,66,88,89,90,91,92,94,95,96,97,98,99,100,126, 127,128,129,130,131,132. | 24 | 102.70 | 8.11 | 14.57 | 6 | |||
| 136 | 10,11,12,22,23,24,25,26,56,57,58,59,60,61,62,105,106, 107,108,109,110,111,112,113,114,115,116,117,118,119, 120,121,122,133,134,135,136,137,138. | 39 | 220.50 | 10.07 | 19.29 | 5 | |||
| Network | - | 144 | 657.00 | 8.15 | 21.29 | 32 | |||
| Scenario 2 | 34 | 1,2,3,4,5,6,7,8,9,10,29,30,31,32,33,34,35,36,49,50,51,52,53,54,55,80,101,102,103,104,105,139,140. | 33 | 127.70 | 7.53 | 15.29 | 7 | ||
| 39 | 37,38,40,41,42,43,44,45,46,47,48,81,82,83,84,85,86,87, 141,142,143,144. | 23 | 105.40 | 8.55 | 19.14 | 6 | |||
| 59 | 11,12,13,56,57,58,59,60,61,62,63,64,106,107,108,109, 110,111,112,113,114,120,121,122,123,137,138. | 27 | 104.10 | 7.51 | 13.57 | 5 | |||
| 72 | 67,68,69,70,71,72,73,74,75,76,77,78,79. | 13 | 55.60 | 8.11 | 14.14 | 5 | |||
| 92 | 14,15,16,17,18,19,20,21,65,66,88,89,90,91,92,93,94,95, 96,97,98,99,100,124,125,126,127,128,129,130,131,132. | 32 | 171.60 | 9.66 | 23.00 | 6 | |||
| 116 | 22,23,24,25,26,27,28,115,117,118,119,133,134,135,136. | 16 | 61.20 | 7.46 | 13.14 | 3 | |||
| Network | - | 144 | 625.60 | 8.14 | 23.00 | 32 | −4.77 | −0.12 | |
| Scenario 3 | 14 | 11,12,13,14,15,16,17,18,19,20,21,122,123,124,125,126. | 16 | 58.50 | 7.22 | 15.57 | 5 | ||
| 33 | 6,7,8,9,27,28,29,30,31,32,33,34,35,50,51,52,53,54,55,56,103,104. | 22 | 61.10 | 5.97 | 10.43 | 6 | |||
| 82 | 11,12,13,56,57,58,59,60,61,62,63,64,106,107,108,109, 110,111,112,113,114,120,121,122,123,137,138. | 29 | 156.50 | 9.71 | 24.29 | 6 | |||
| 88 | 1,2,3,4,5,36,37,38,39,40,41,42,43,44,45,46,47,48,49,80, 81,83,84,85,101,102,143,144. | 41 | 281.00 | 11.79 | 25.00 | 8 | |||
| 107 | 10,58,59,60,61,62,105,106,107,108,109,110,111,112,113,114,121,137,138,139. | 20 | 81.70 | 7.88 | 15.57 | 4 | |||
| 118 | 22,23,24,25,26,57,115,116,117,118,119,120,133,134,135,136. | 16 | 53.70 | 6.80 | 13.43 | 4 | |||
| Network | - | 144 | 692.50 | 8.22 | 25.00 | 33 | 5.40 | 0.86 | |
| Scenario 4 | 14 | 11,12,13,14,15,16,17,18,19,20,21,62,63,123,124,125,126. | 18 | 69.60 | 7.52 | 15.57 | 5 | ||
| 34 | 1,2,3,4,5,6,7,8,9,10,27,28,29,30,31,32,33,34,50,51,52,53,54,55,56,57,102,103,104,105,106,107,137,138. | 34 | 131.60 | 7.53 | 15.29 | 7 | |||
| 37 | 35,36,37,38,39,40,41,42,43,44,45,46,47,48,49,65,66,67, 80,81,82,83,84,85,86,87,101,139,140,141,142,143,144. | 33 | 159.00 | 8.88 | 22.71 | 6 | |||
| 75 | 68,69,70,71,72,73,74,75,76,77,78,79. | 12 | 40.10 | 6.77 | 12.29 | 4 | |||
| 120 | 22,23,24,25,26,58,59,60,61,108,109,110,111,112,113, 114,115,116,117,118,119,120,121,122,133,134,135,136. | 28 | 146.40 | 9.47 | 17.43 | 4 | |||
| 127 | 88,89,90,91,92,93,94,95,96,97,98,99,100,127,128,129, 130,131,132. | 19 | 74.50 | 7.60 | 13.14 | 4 | |||
| Network | - | 144 | 621.20 | 7.96 | 22.71 | 30 | −5.45 | −2.33 | |
| Mode | Object | j | n | (km) | (km) | (min) | tijmax (min) | |
|---|---|---|---|---|---|---|---|---|
| M1 | line1 | 11 | 21 | 26.50 | 146.10 | 5 | 11.94 | 22.29 |
| line2 | 18 | 37 | 37.00 | 222.80 | 5 | 14.24 | 27.86 | |
| line3 | 12 | 35 | 37.60 | 279.30 | 8 | 14.47 | 29.14 | |
| line4 | 88 | 25 | 23.60 | 126.50 | 5 | 10.61 | 18.29 | |
| line5 | 106 | 18 | 19.80 | 79.30 | 2 | 10.09 | 17.14 | |
| line6 | 124 | 23 | 29.60 | 139.50 | 4 | 13.07 | 21.57 | |
| line7 | 138 | 19 | 22.50 | 71.50 | 2 | 10.52 | 16.57 | |
| Network | - | 144 | 196.90 | 1065.00 | 31 | 12.13 | 29.14 |
| Mode | j | n | (km) | (km) | (min) | tijmax (min) | RD (%) | Rt (%) | RU (%) | |
|---|---|---|---|---|---|---|---|---|---|---|
| M2 | 10 | 144 | 196.60 | 1322.80 | 14 | 15.12 | 32.29 | 24.21 | 24.65 | −54.84 |
| M3 | 7 | 30 | 41.50 | 109.50 | 7 | 7.21 | 12.00 | −40.14 | −32.65 | 9.68 |
| 40 | 13 | 20.30 | 54.90 | 4 | 8.03 | 17.57 | ||||
| 72 | 12 | 14.70 | 48.90 | 3 | 7.82 | 14.14 | ||||
| 105 | 21 | 29.10 | 106.0 | 5 | 9.21 | 18.43 | ||||
| 117 | 17 | 25.10 | 65.20 | 4 | 7.48 | 13.29 | ||||
| 126 | 31 | 37.10 | 183.00 | 6 | 10.43 | 19.29 | ||||
| 140 | 20 | 28.80 | 70.00 | 5 | 7.00 | 11.00 | ||||
| Network | 144 | 196.60 | 637.5 | 34 | 8.17 | 19.29 |
Publisher’s Note: MDPI stays neutral with regard to jurisdictional claims in published maps and institutional affiliations. |
© 2020 by the authors. Licensee MDPI, Basel, Switzerland. This article is an open access article distributed under the terms and conditions of the Creative Commons Attribution (CC BY) license (http://creativecommons.org/licenses/by/4.0/).
Share and Cite
Sun, B.; Liu, J.; Hao, J.; Shen, X.; Mao, X.; Song, X. Maintenance Decision-Making of an Urban Rail Transit System in a Regionalized Network-Wide Perspective. Sustainability 2020, 12, 9734. https://0-doi-org.brum.beds.ac.uk/10.3390/su12229734
Sun B, Liu J, Hao J, Shen X, Mao X, Song X. Maintenance Decision-Making of an Urban Rail Transit System in a Regionalized Network-Wide Perspective. Sustainability. 2020; 12(22):9734. https://0-doi-org.brum.beds.ac.uk/10.3390/su12229734
Chicago/Turabian StyleSun, Baofeng, Jiaojiao Liu, Junyi Hao, Xiuxiu Shen, Xinhua Mao, and Xianmin Song. 2020. "Maintenance Decision-Making of an Urban Rail Transit System in a Regionalized Network-Wide Perspective" Sustainability 12, no. 22: 9734. https://0-doi-org.brum.beds.ac.uk/10.3390/su12229734