Feasibility Study for Sustainable Use of Lithium-Ion Batteries Considering Different Positive Electrode Active Materials under Various Driving Cycles by Using Cell to Electric Vehicle (EV) Simulation

Abstract
:1. Introduction
2. Methodologies
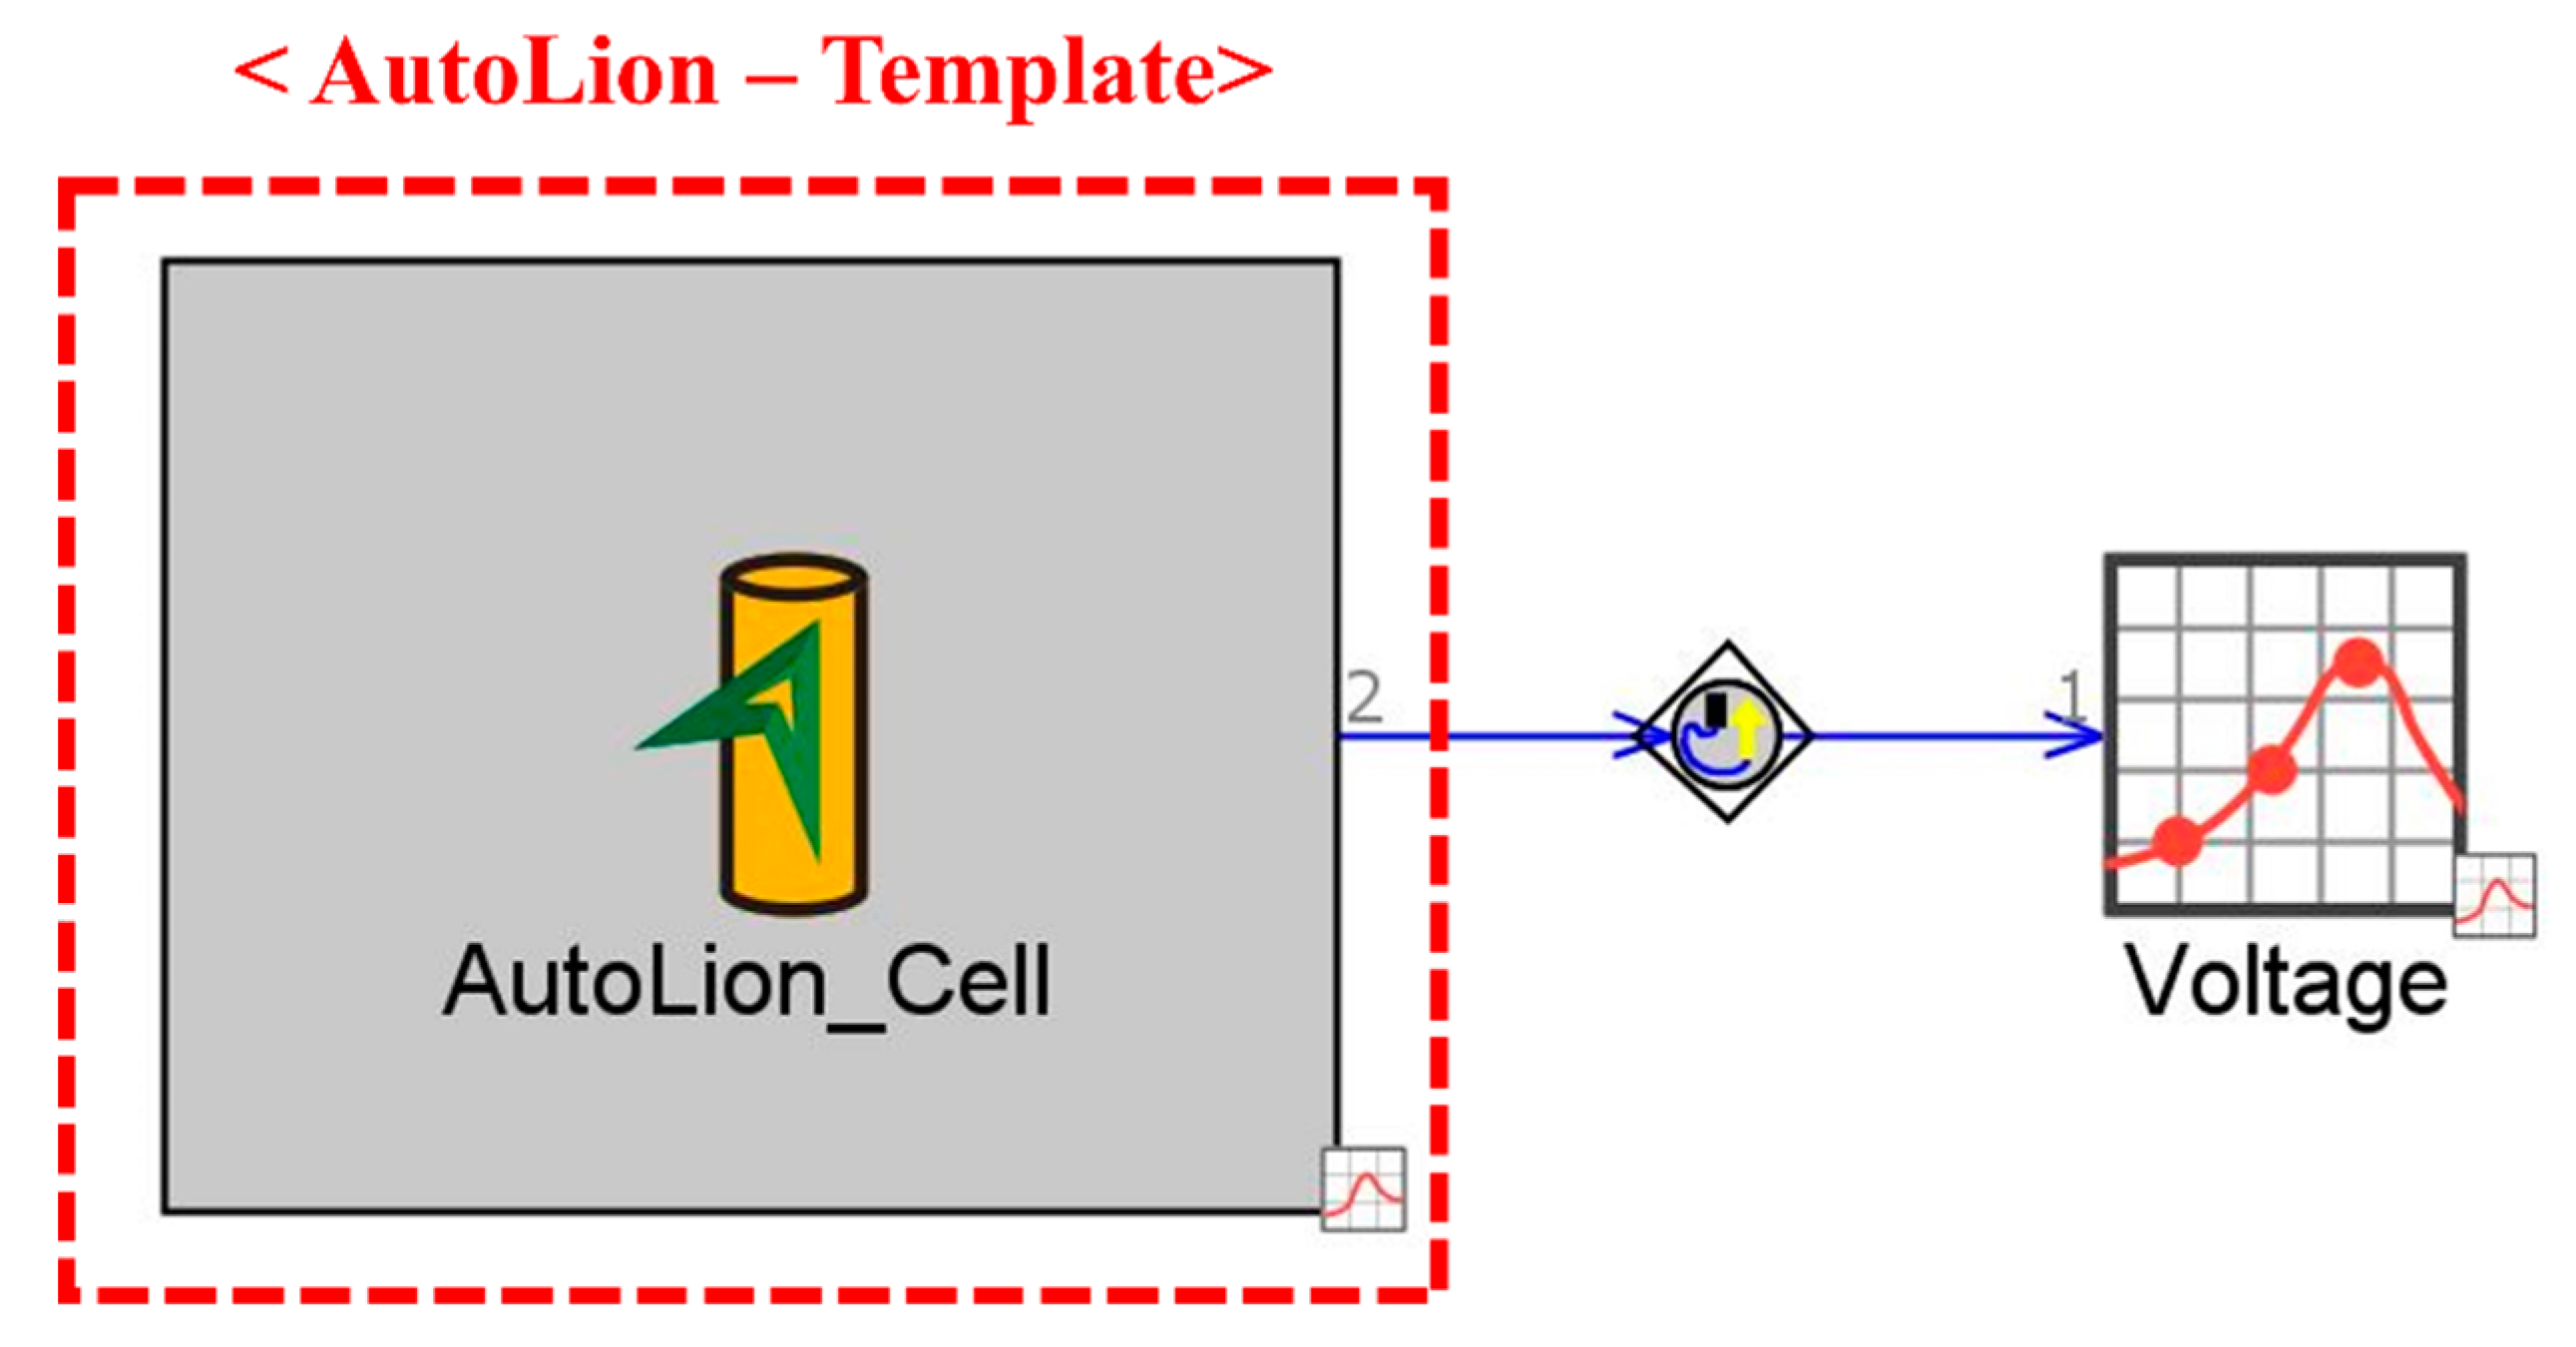
2.1. Battery Cell and Pack Simulation
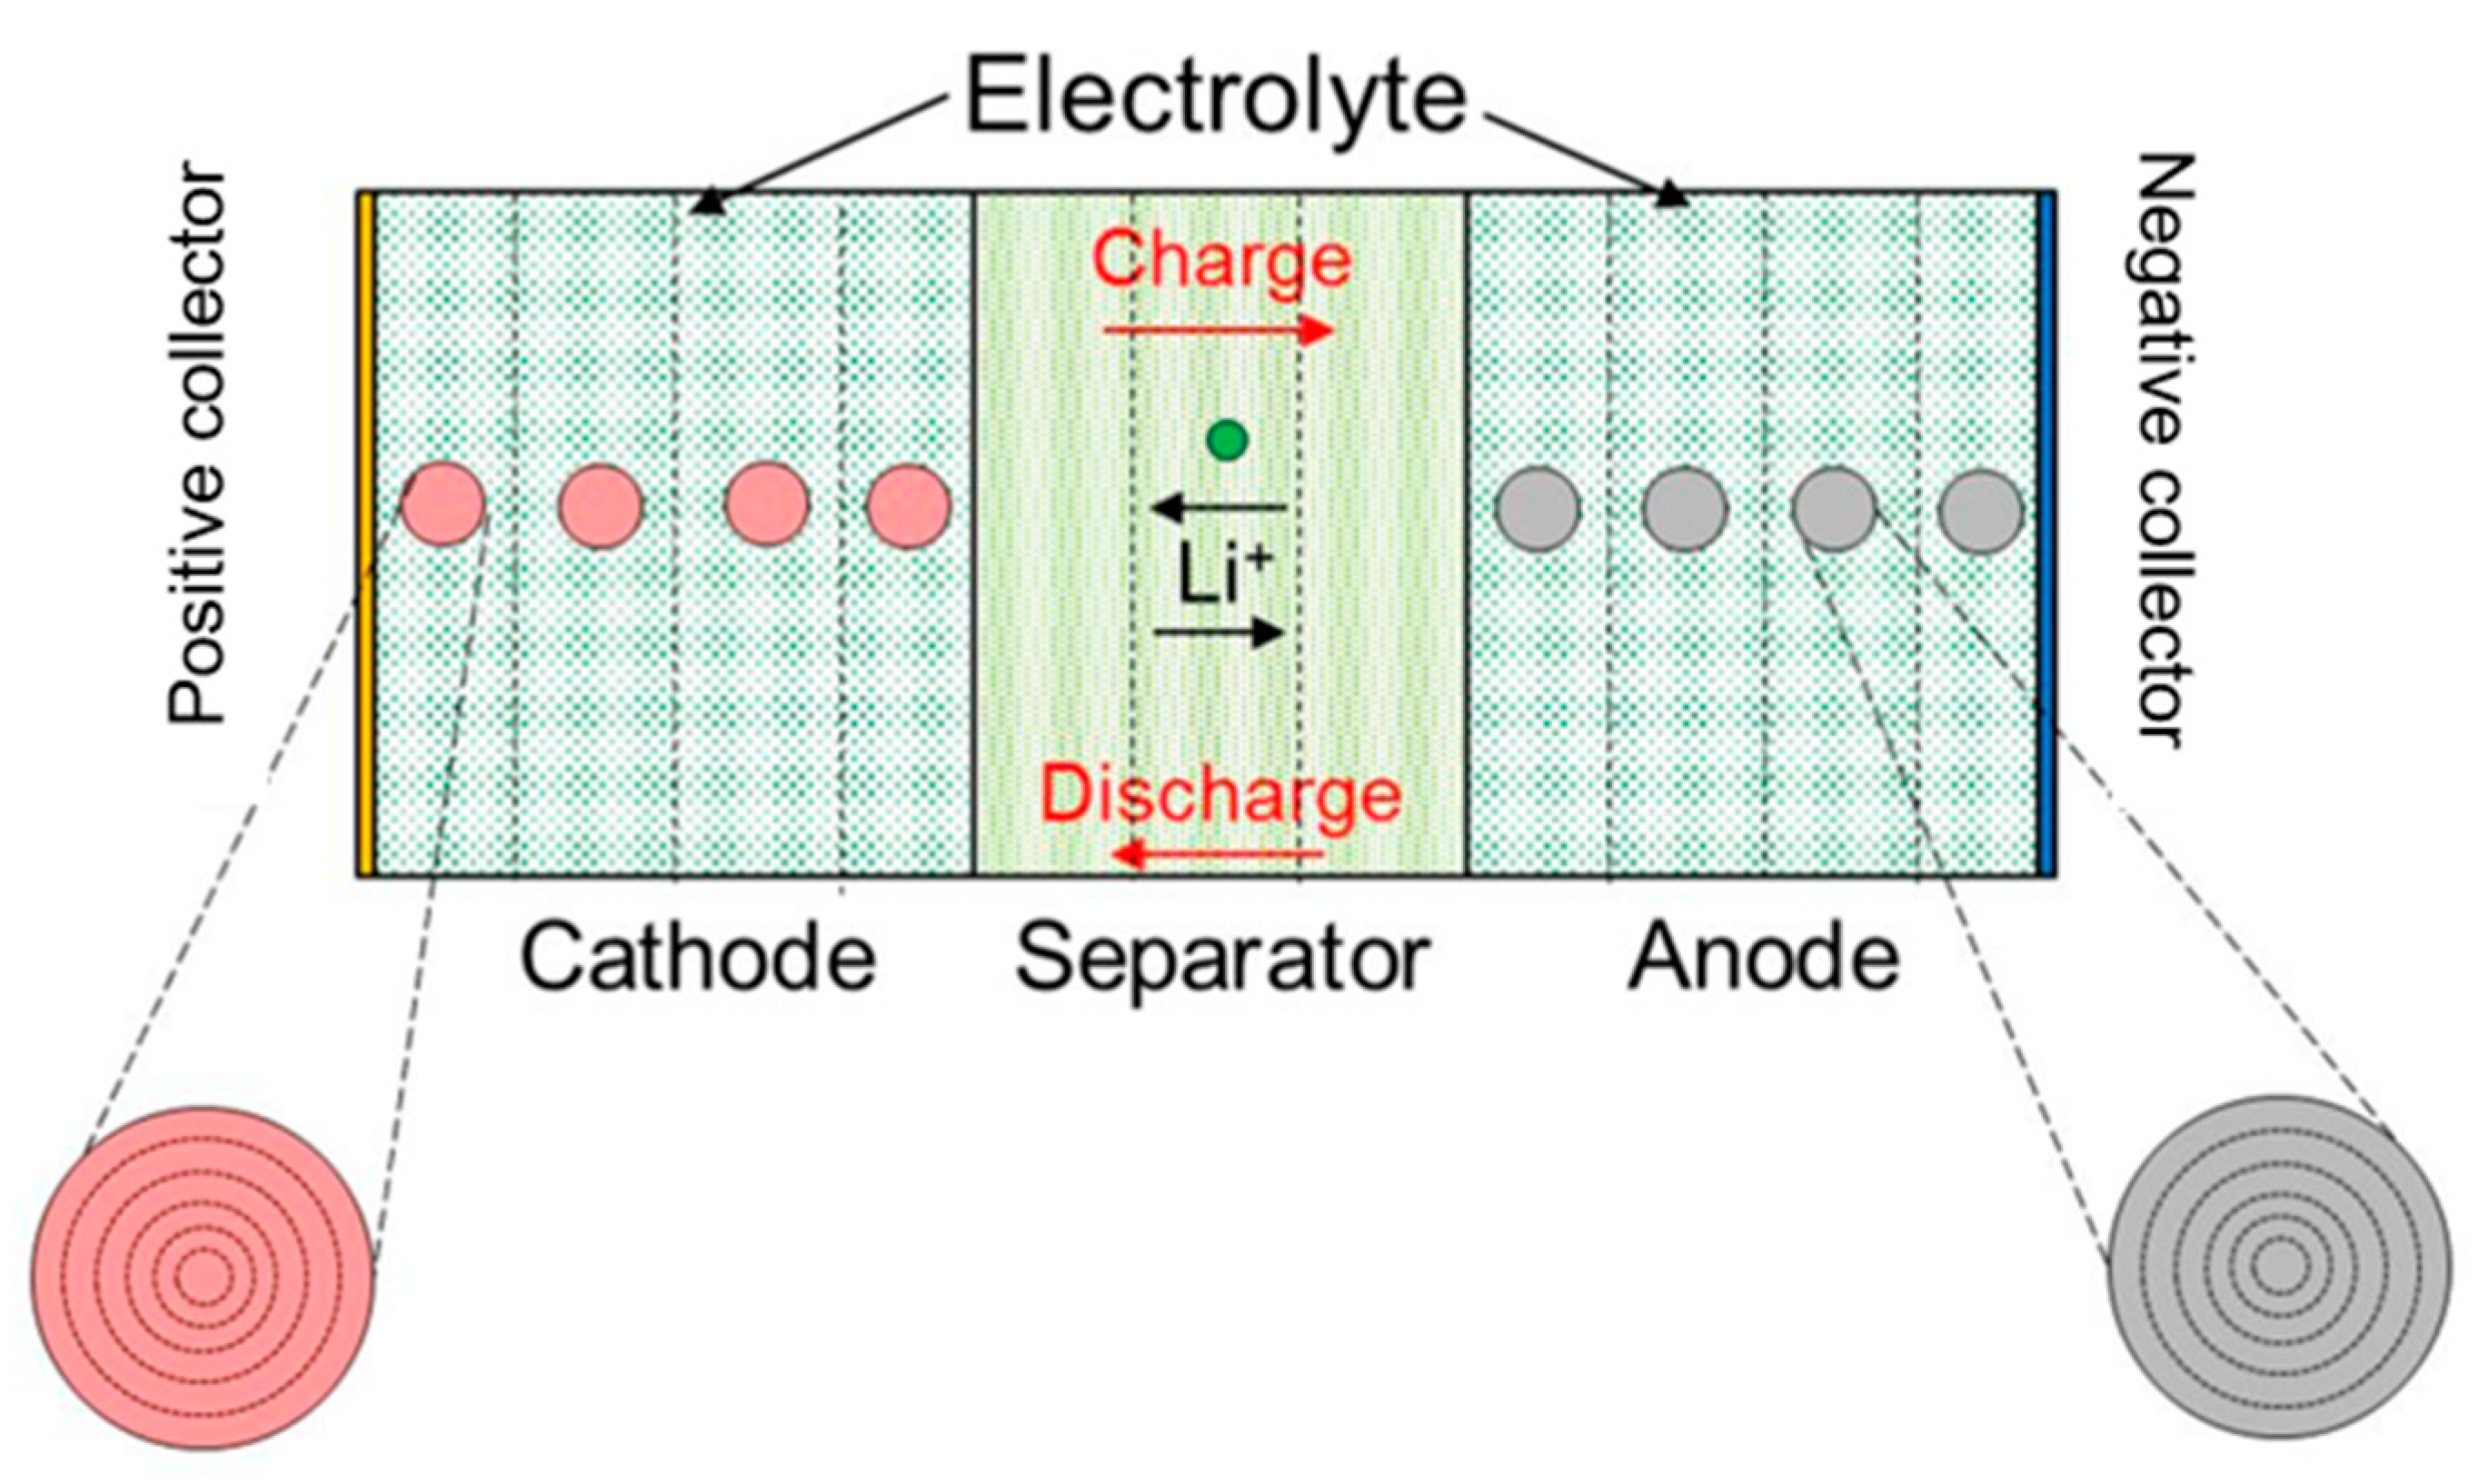
2.1.1. Governing Equations for Electrochemistry and Thermally Coupled Battery Model
2.1.2. Battery Cell Setup
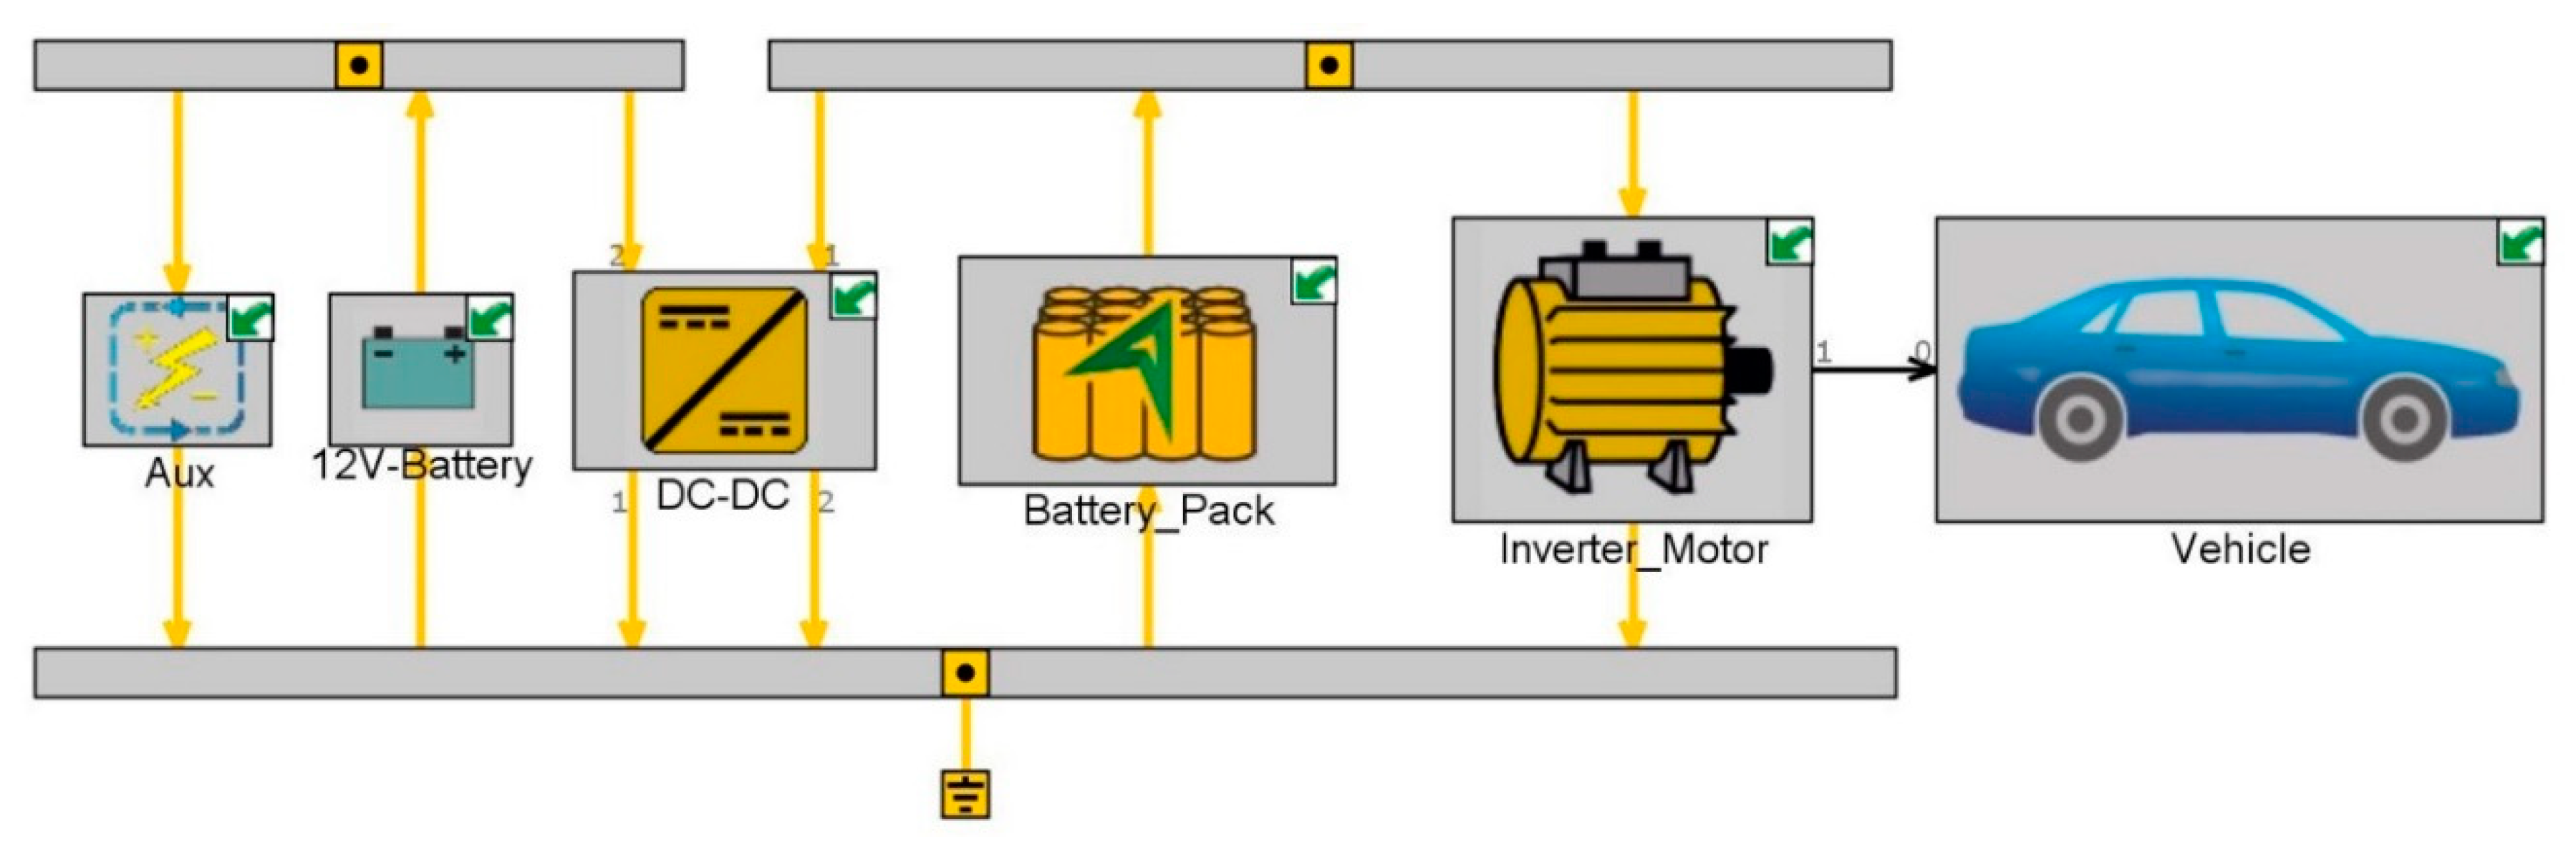
2.1.3. Battery Pack Determination
2.2. Battery Cell Experiment
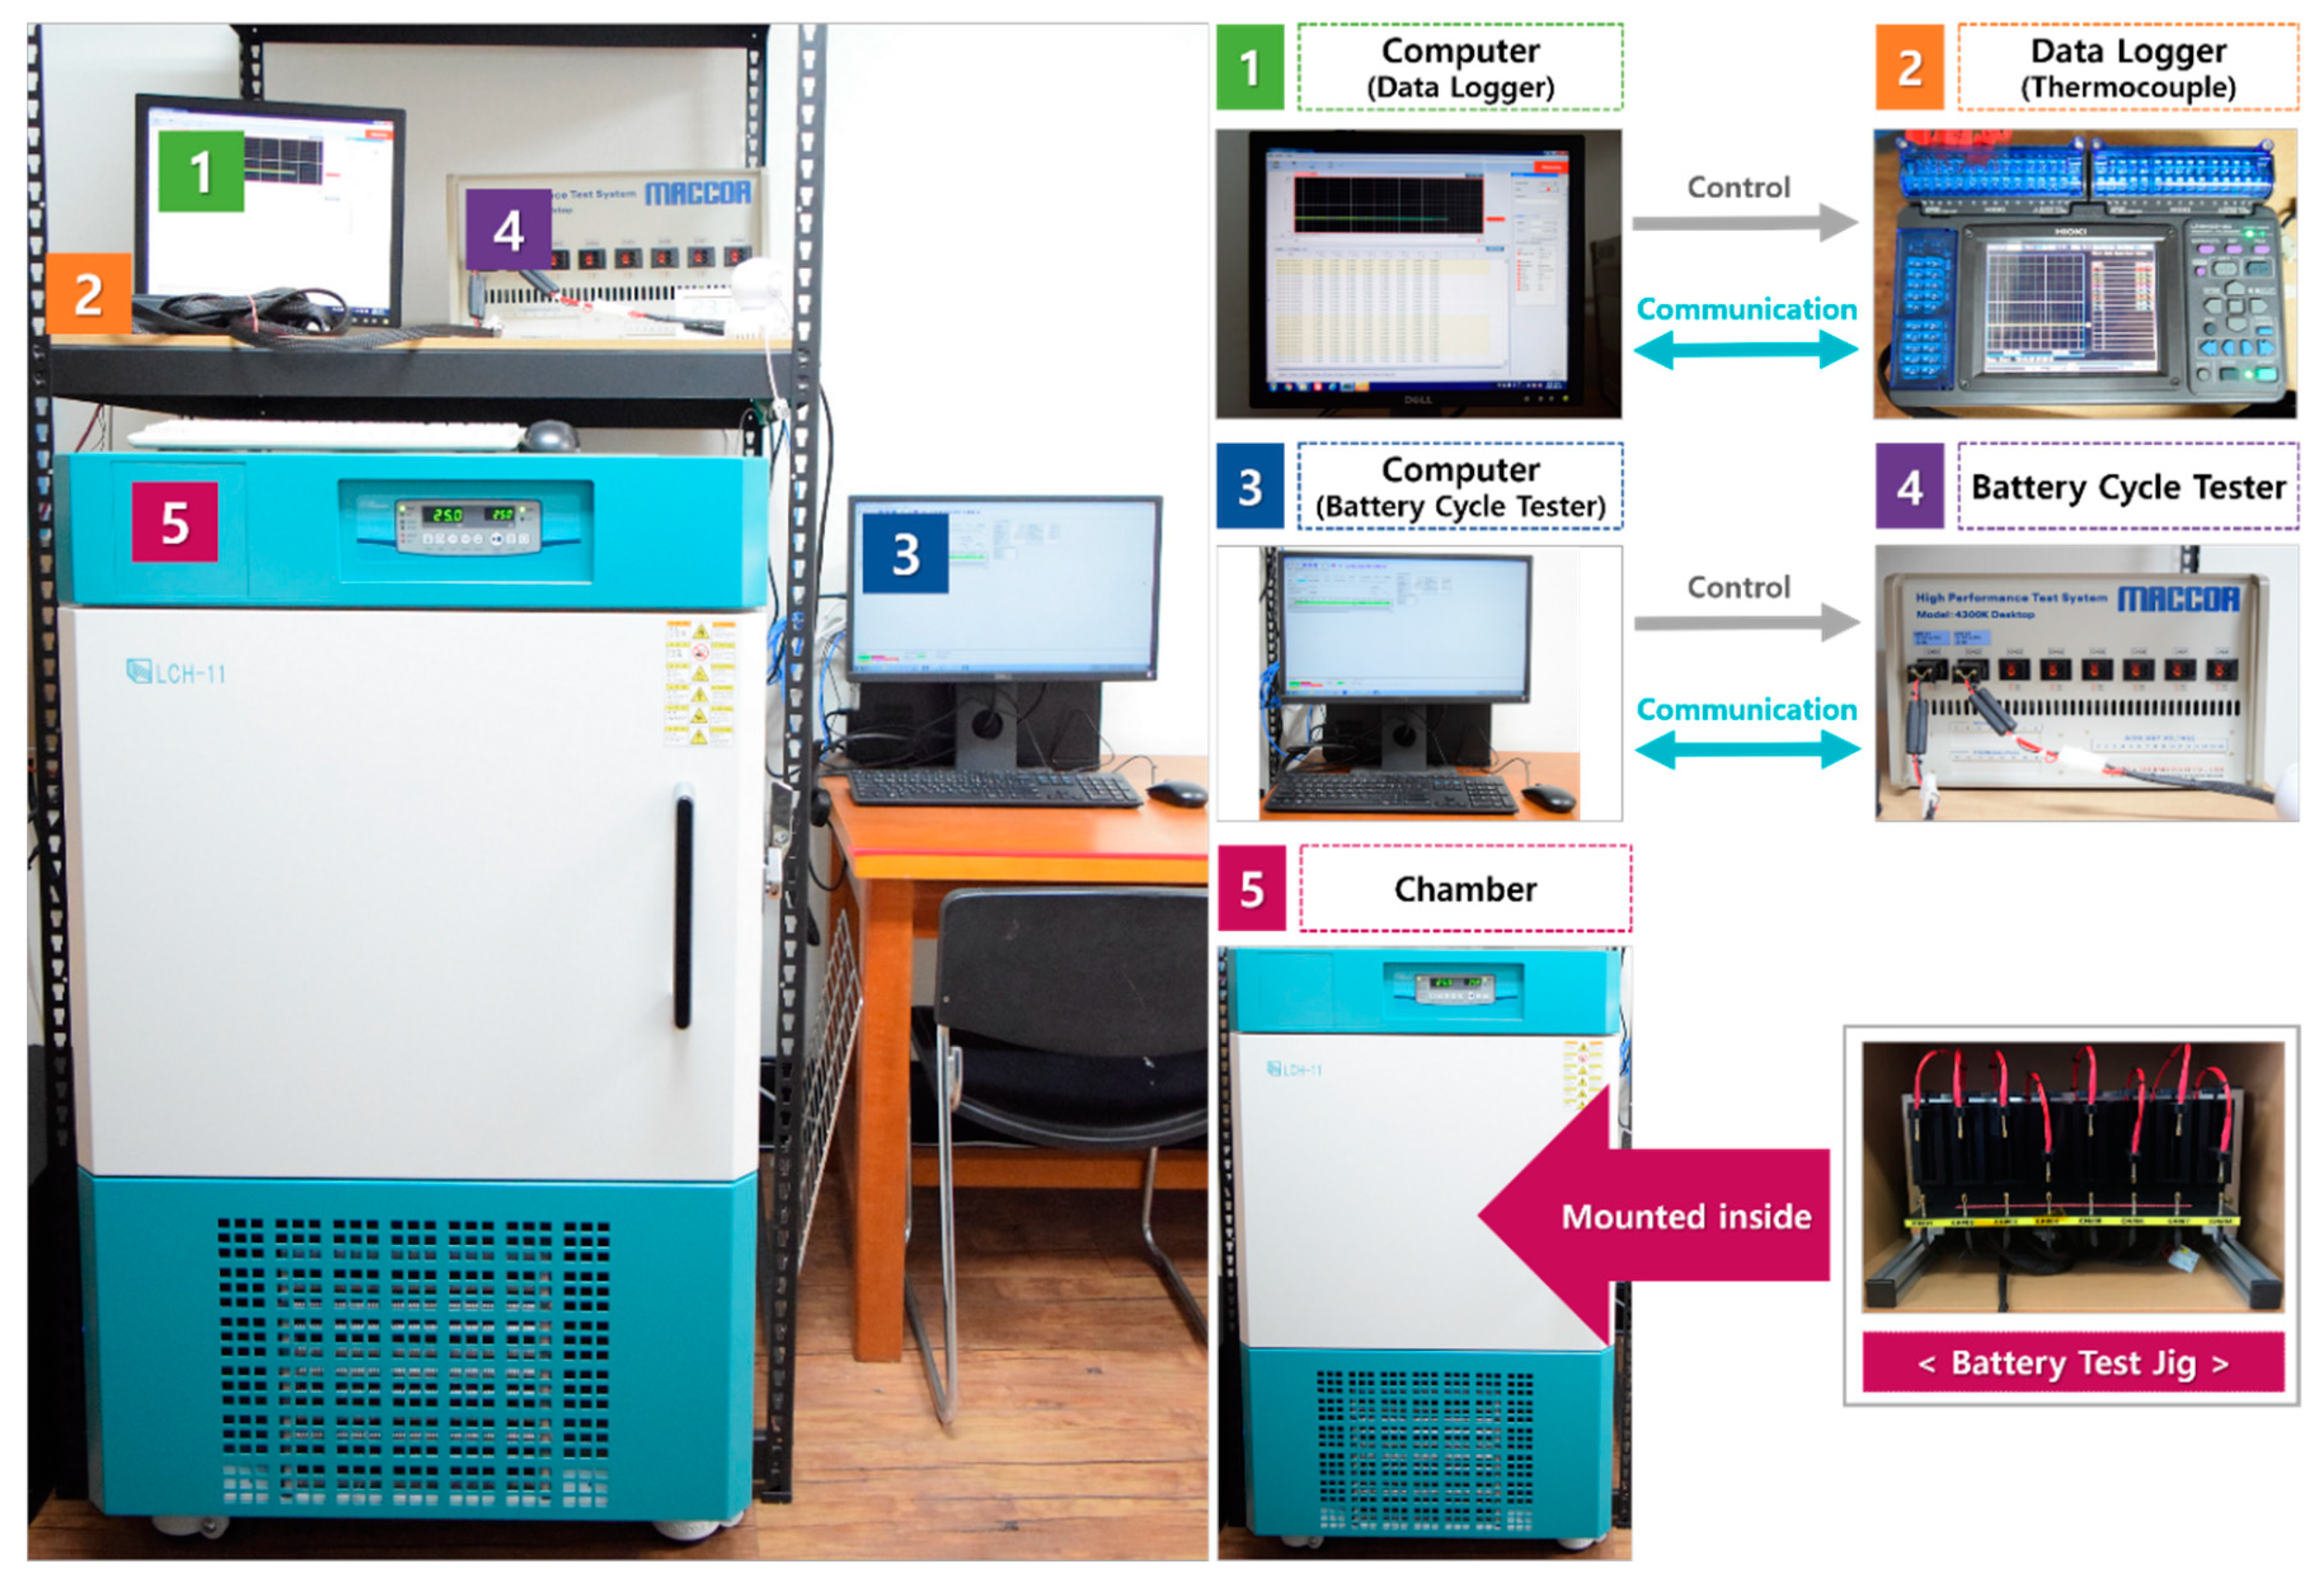
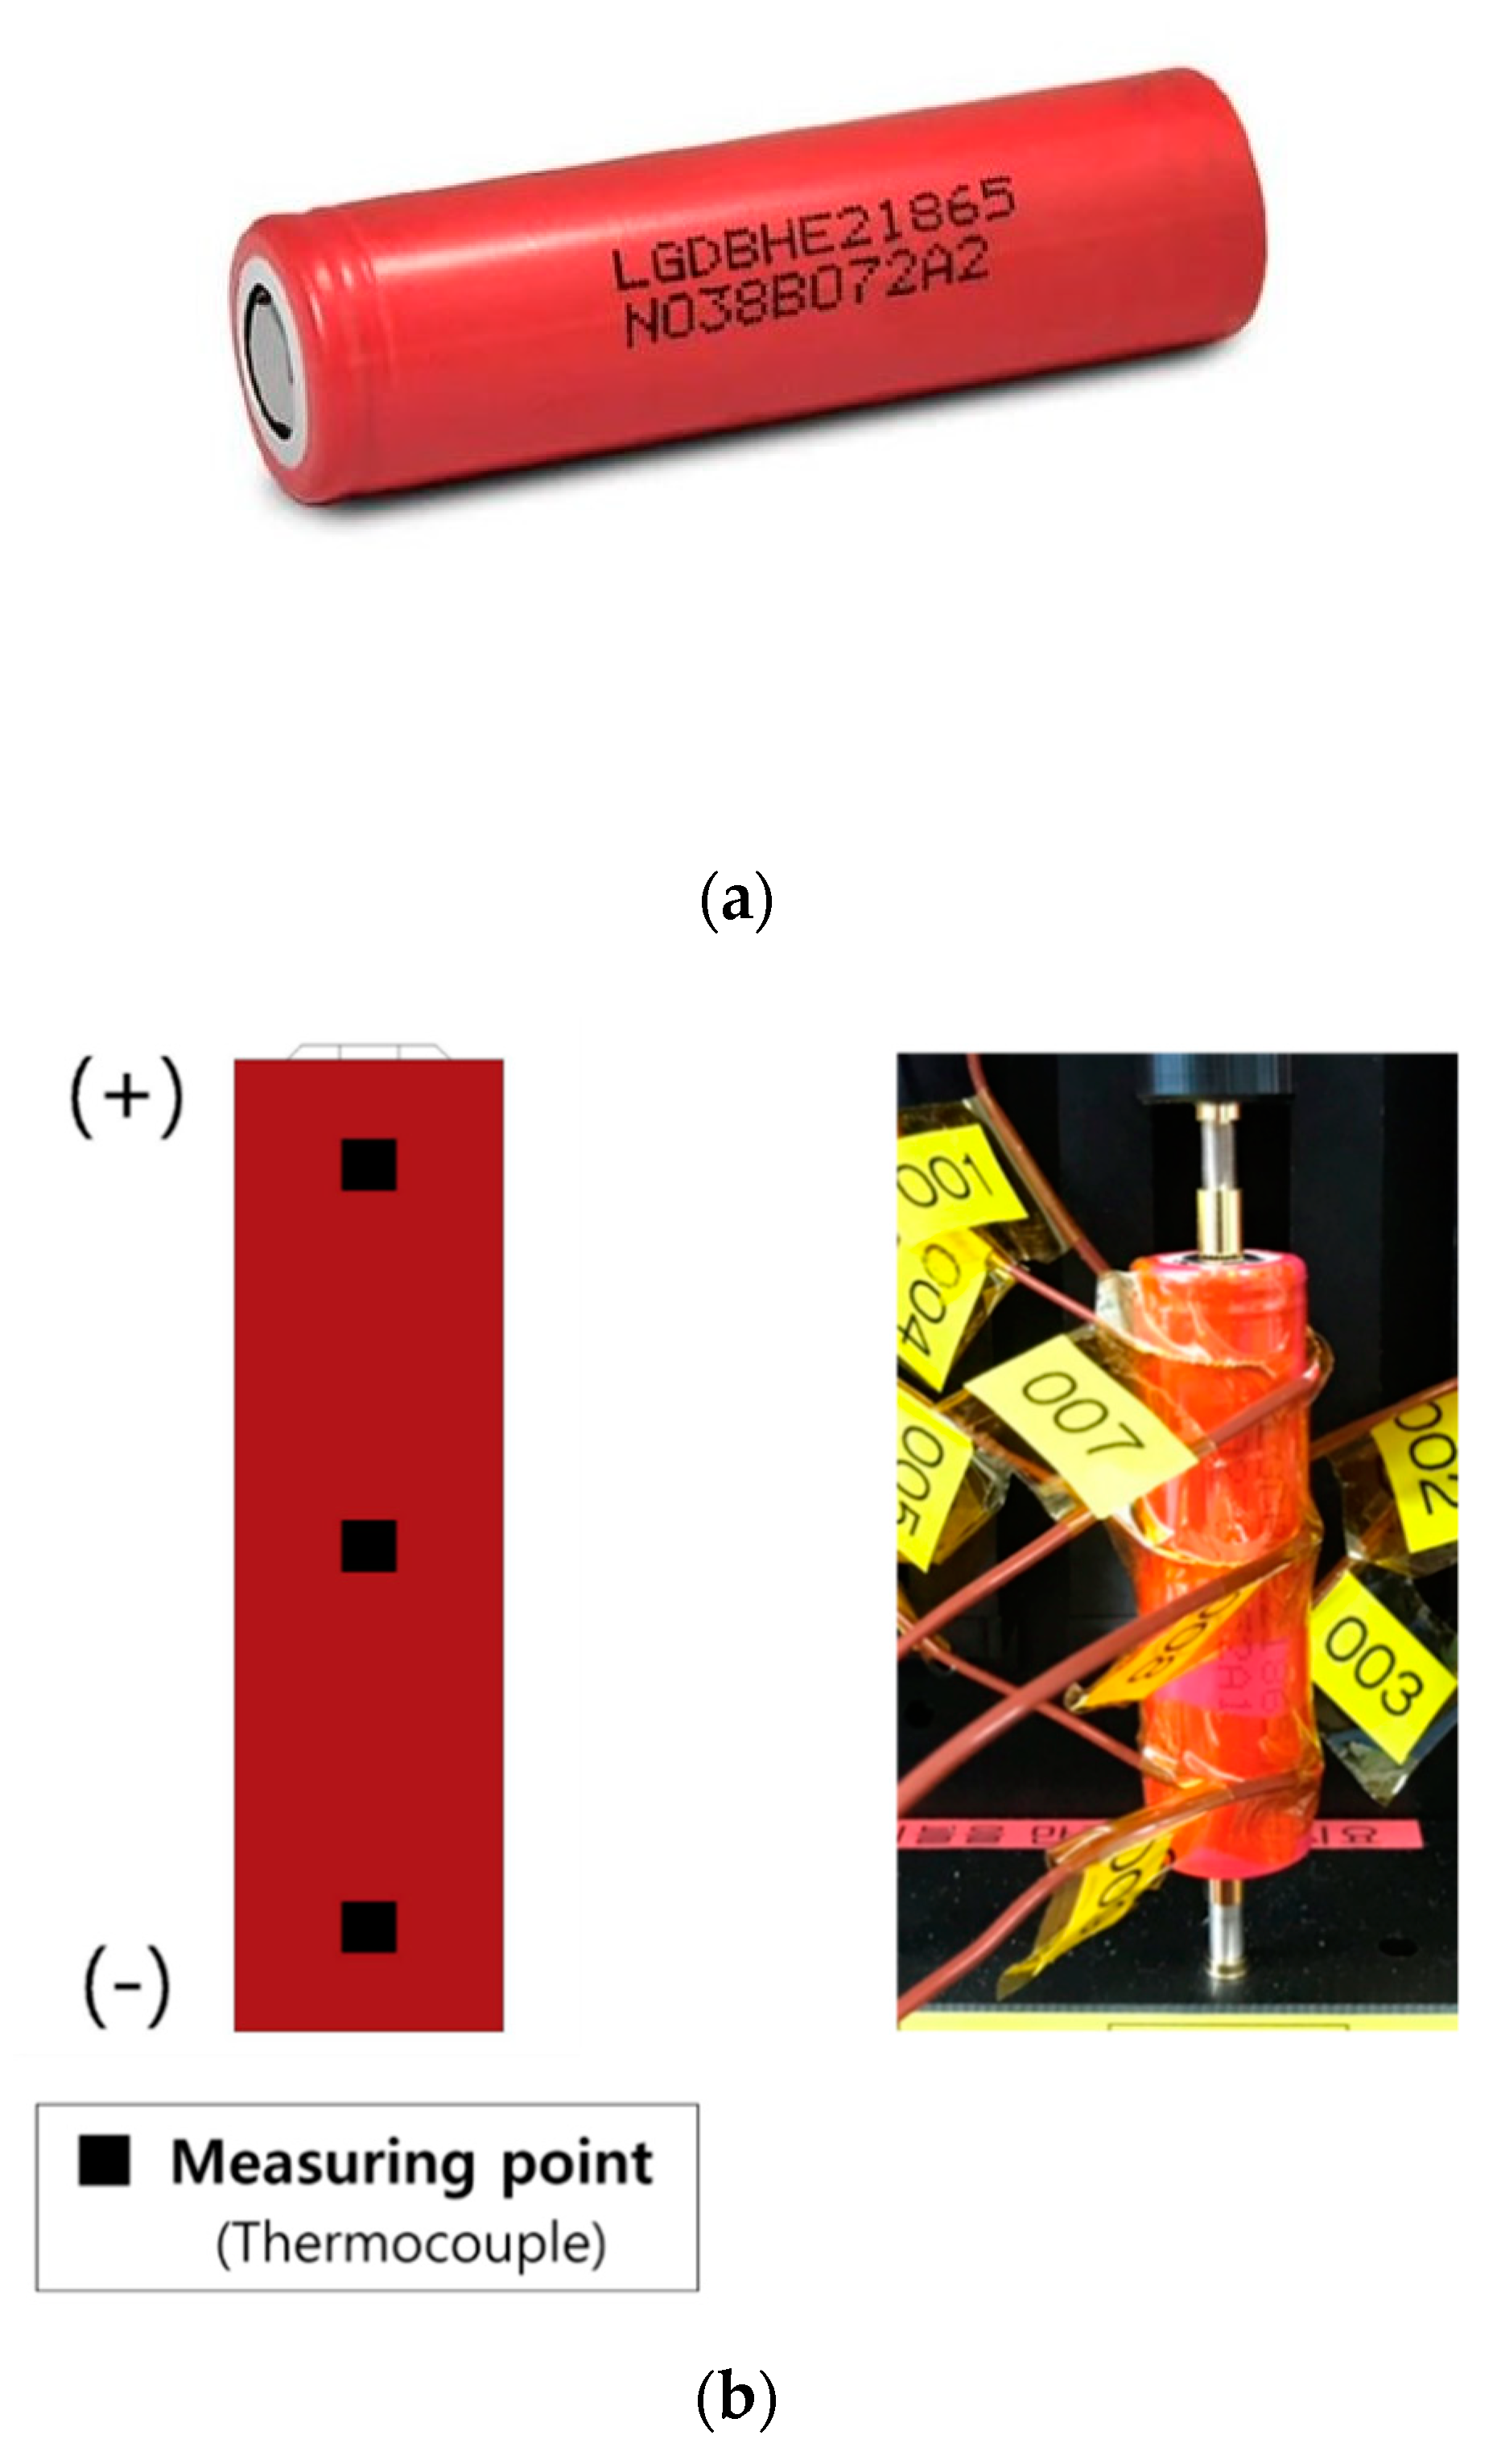
2.2.1. Experimental Setup
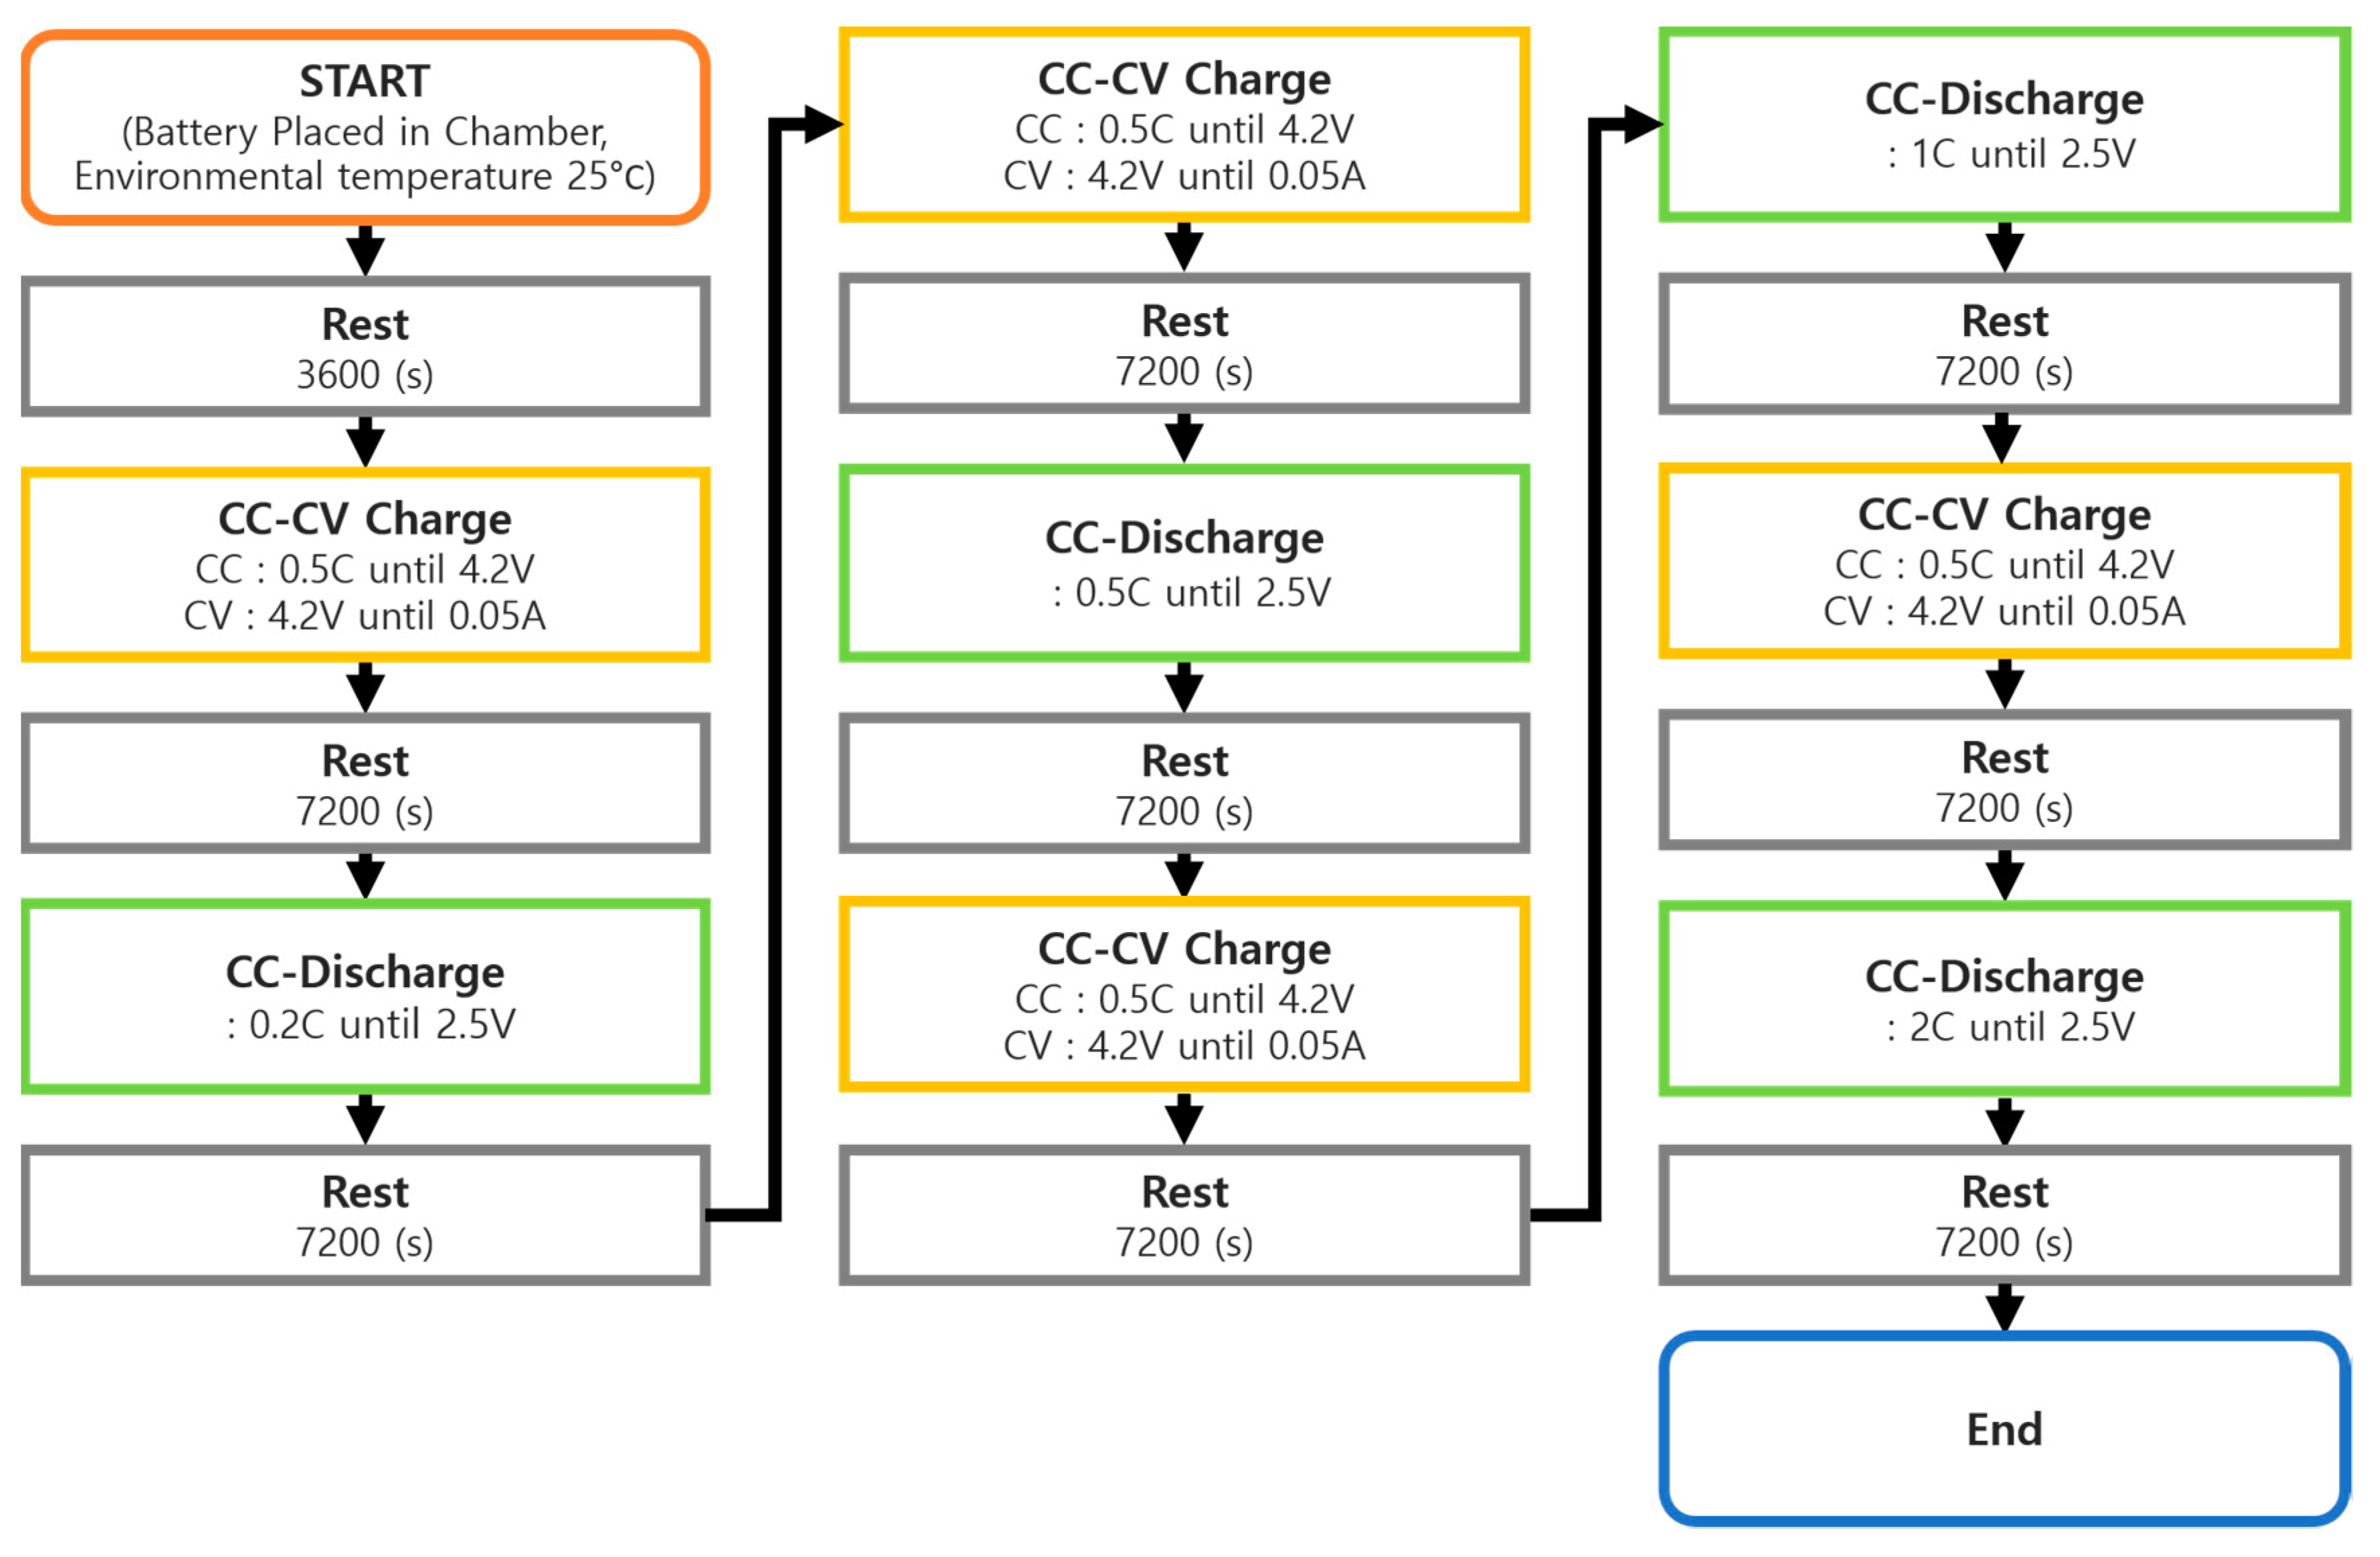
2.2.2. Experimental Method
3. Results and Discussion
3.1. Analysis of Battery Cell Characteristics According to the Type of Positive Electrode Active Material
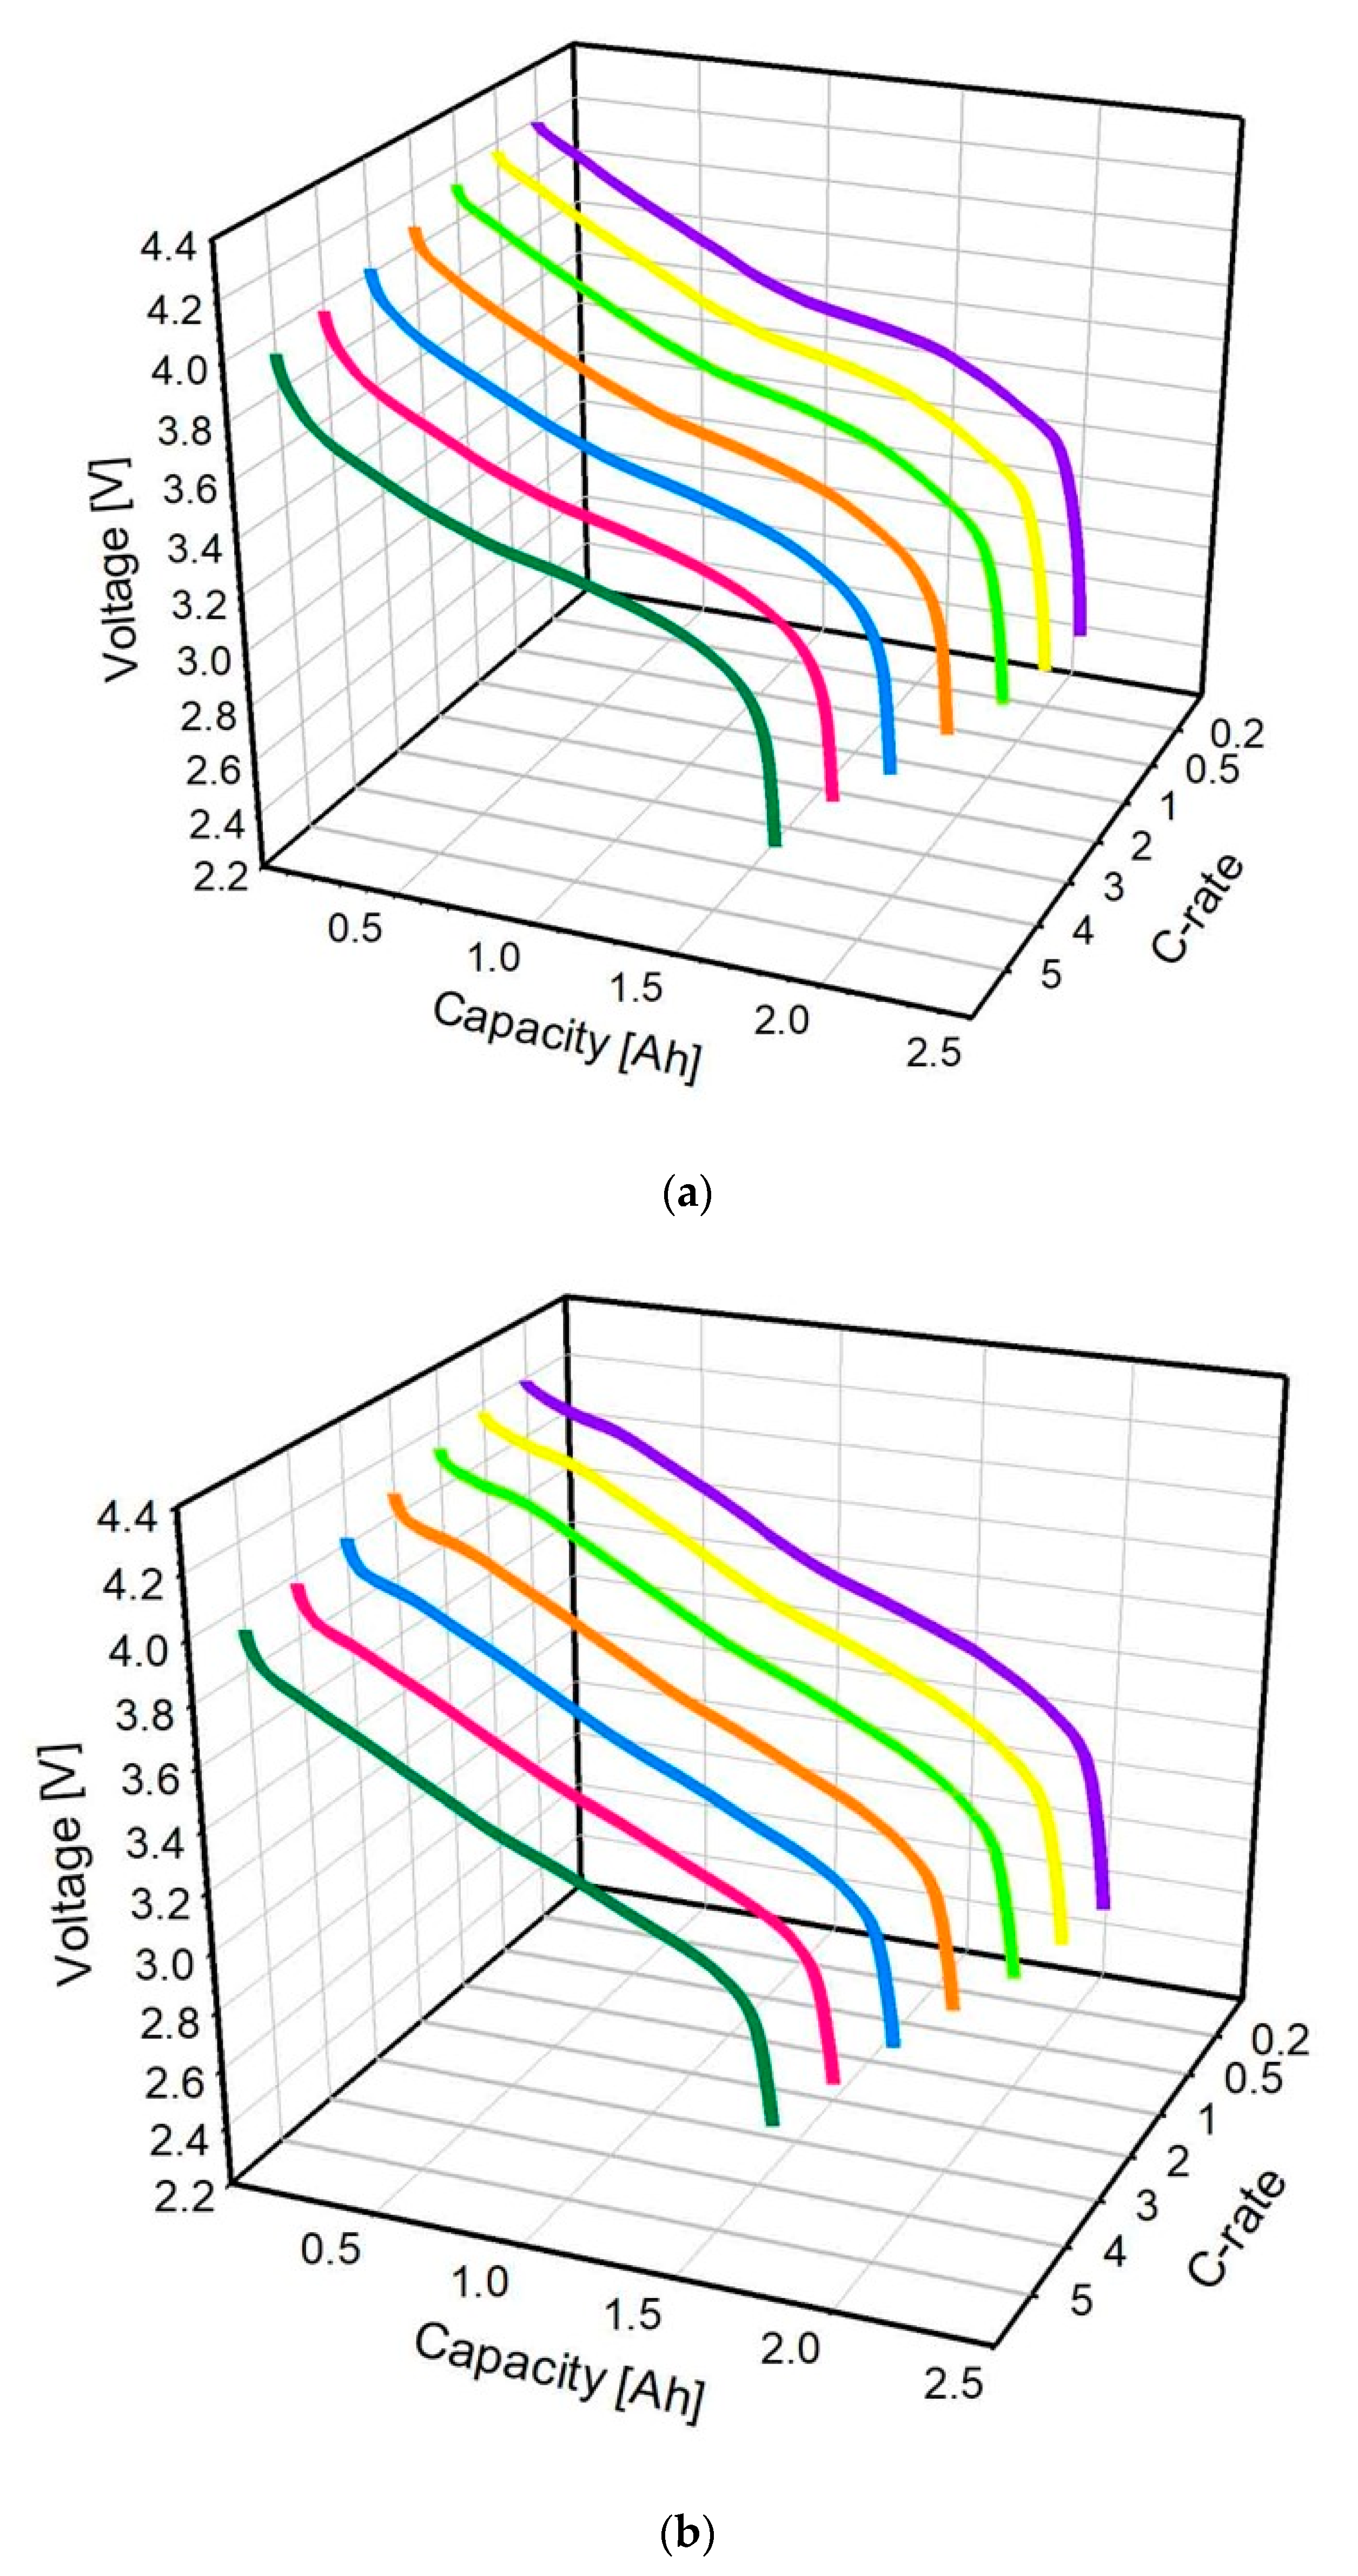
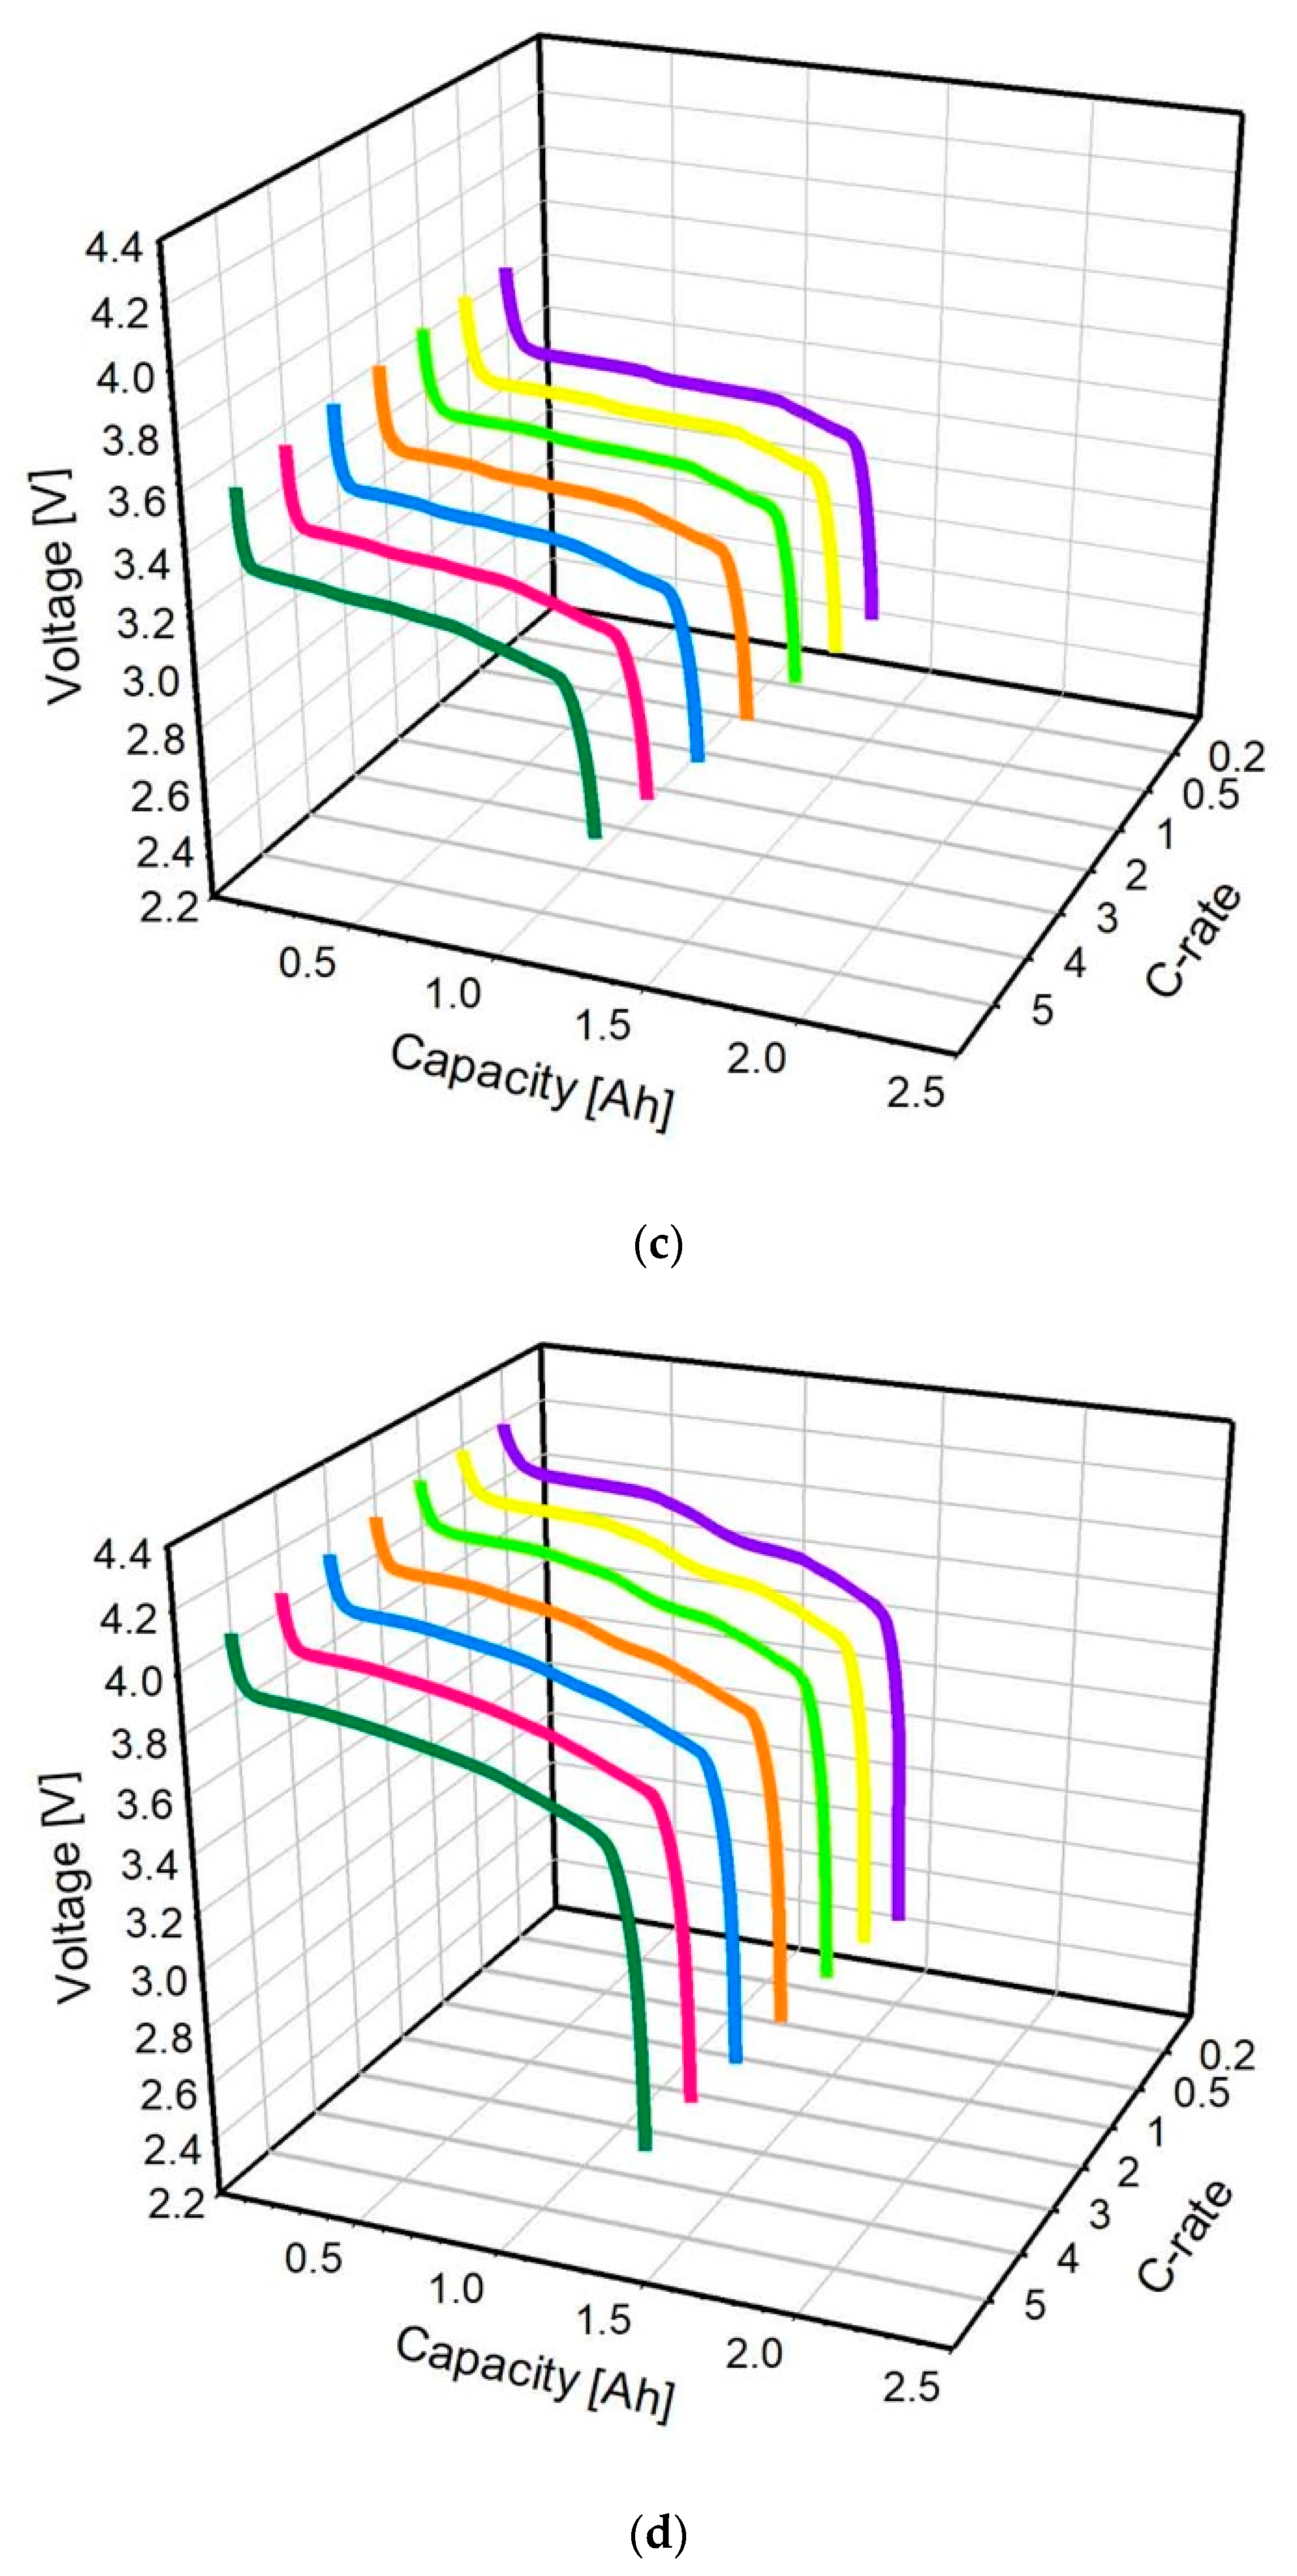
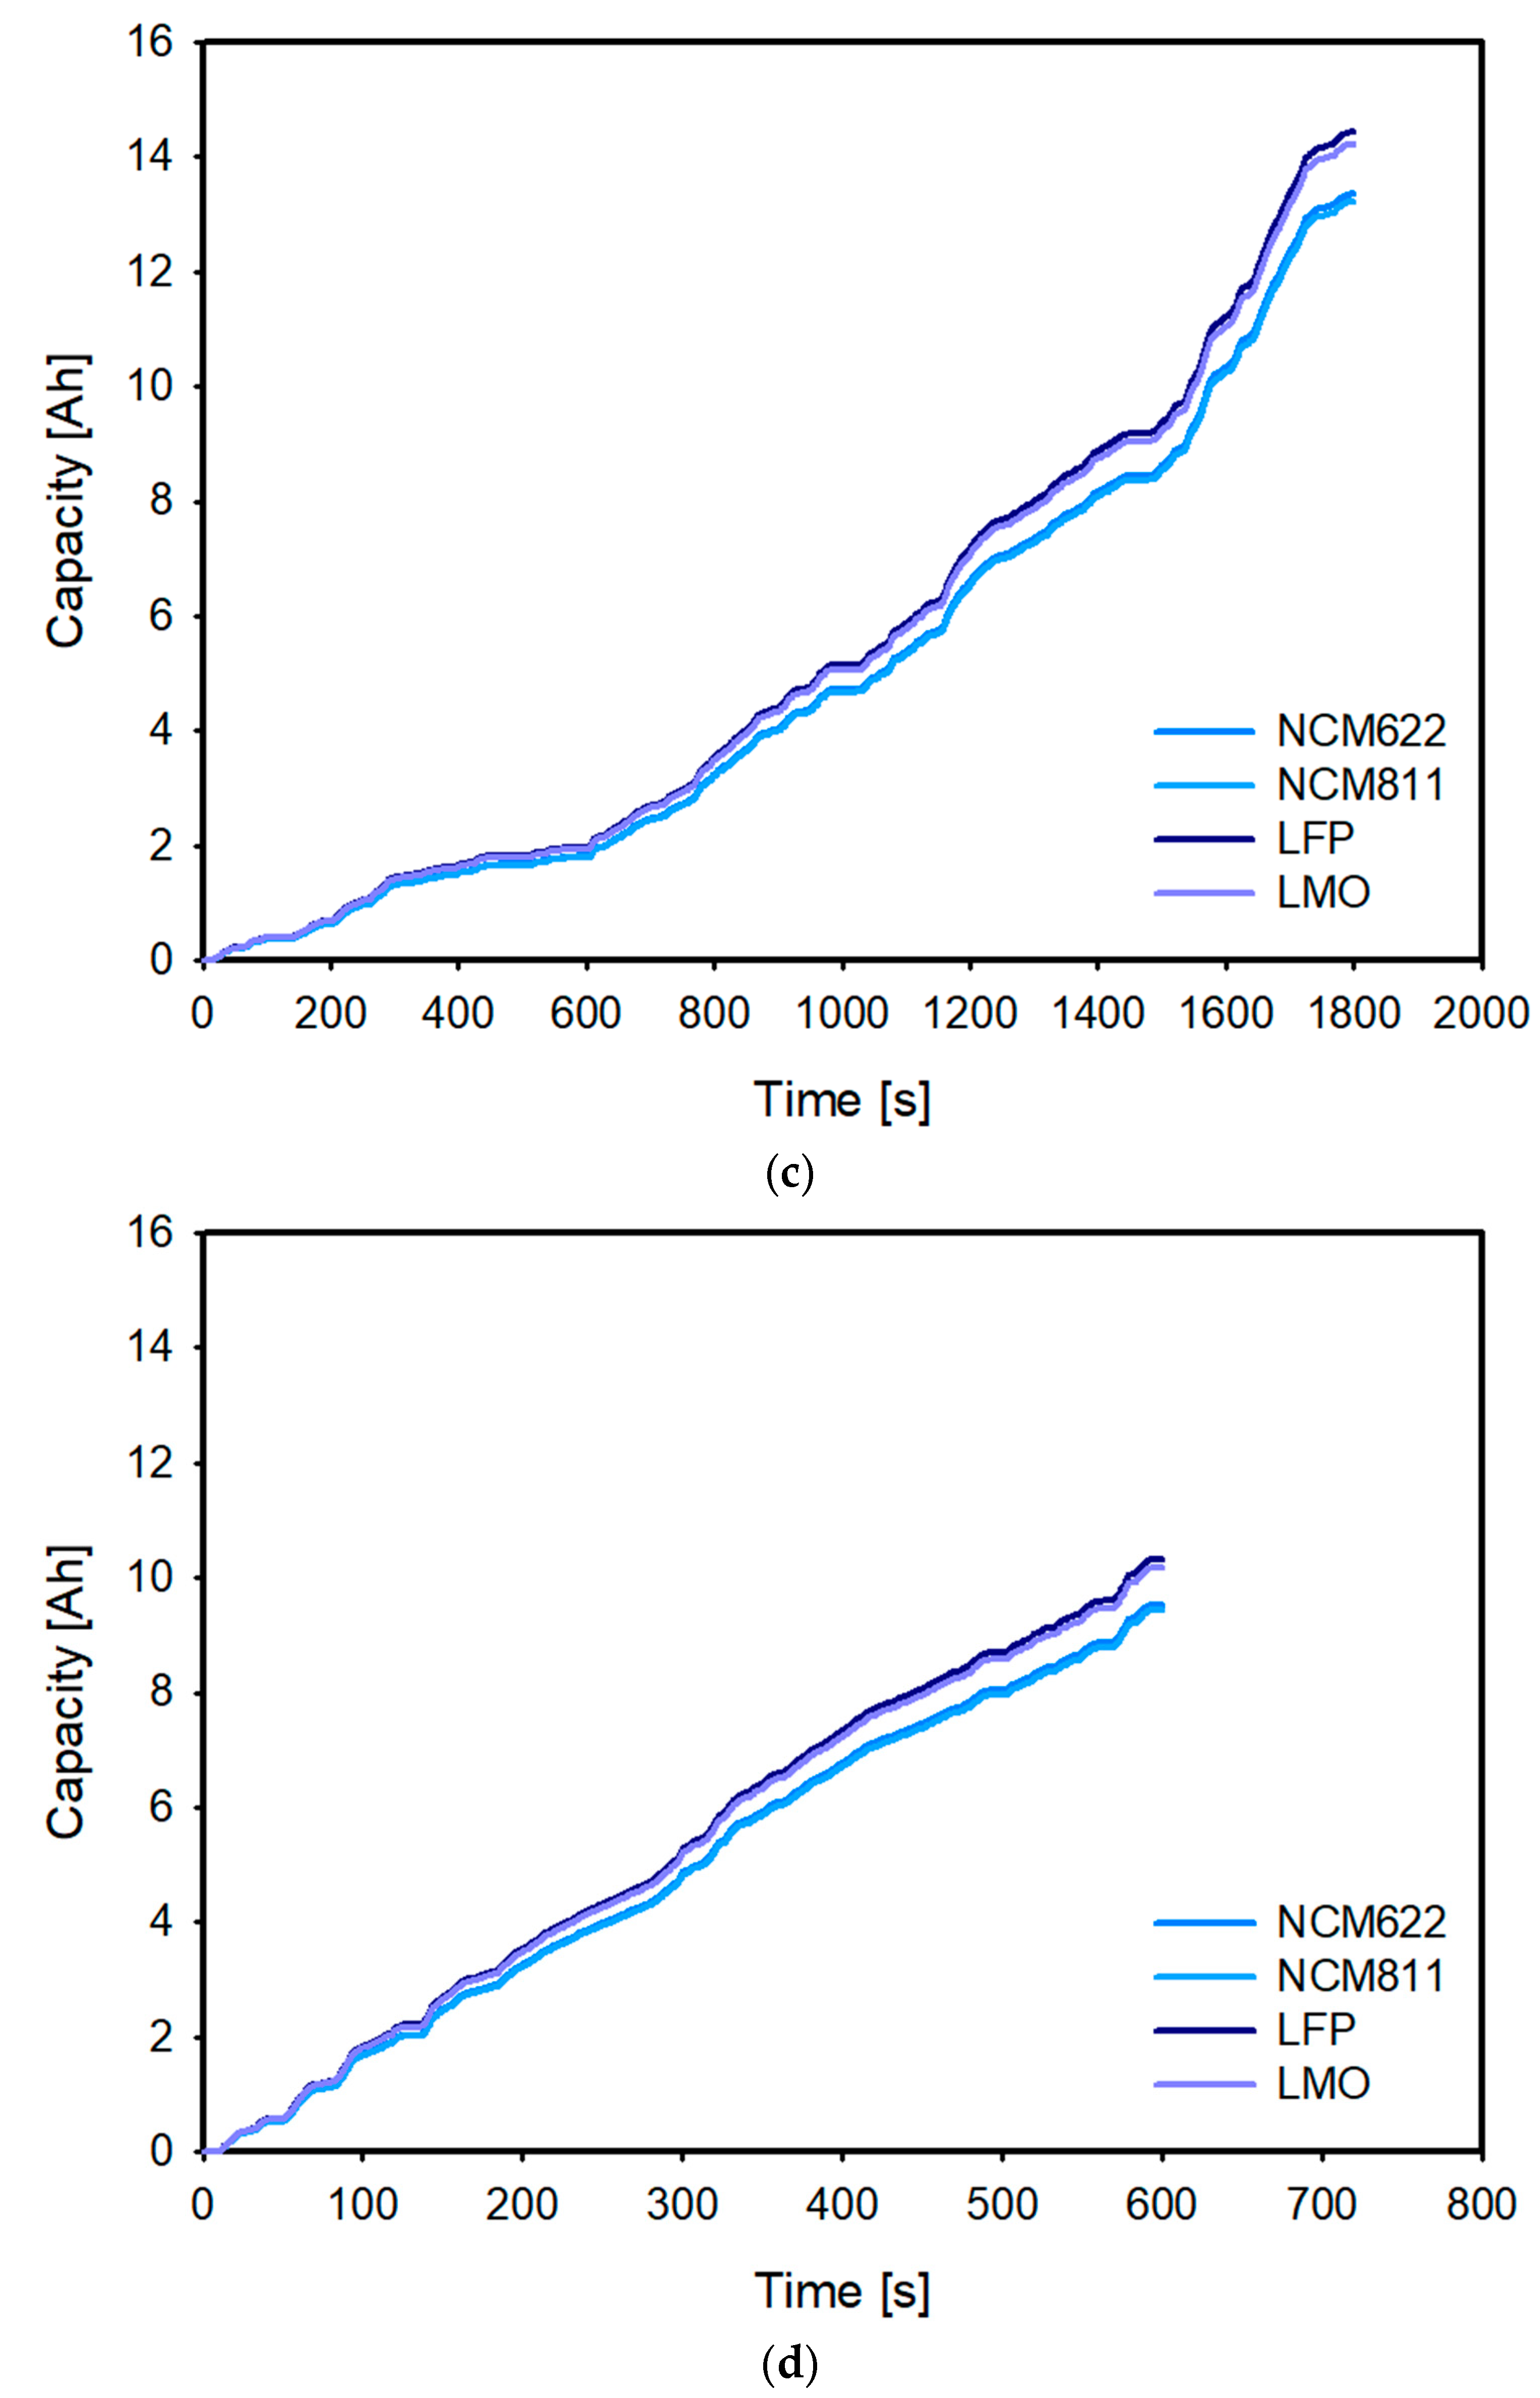
3.1.1. Battery Discharge Performance According to C-Rate Conditions
Capacity Loss
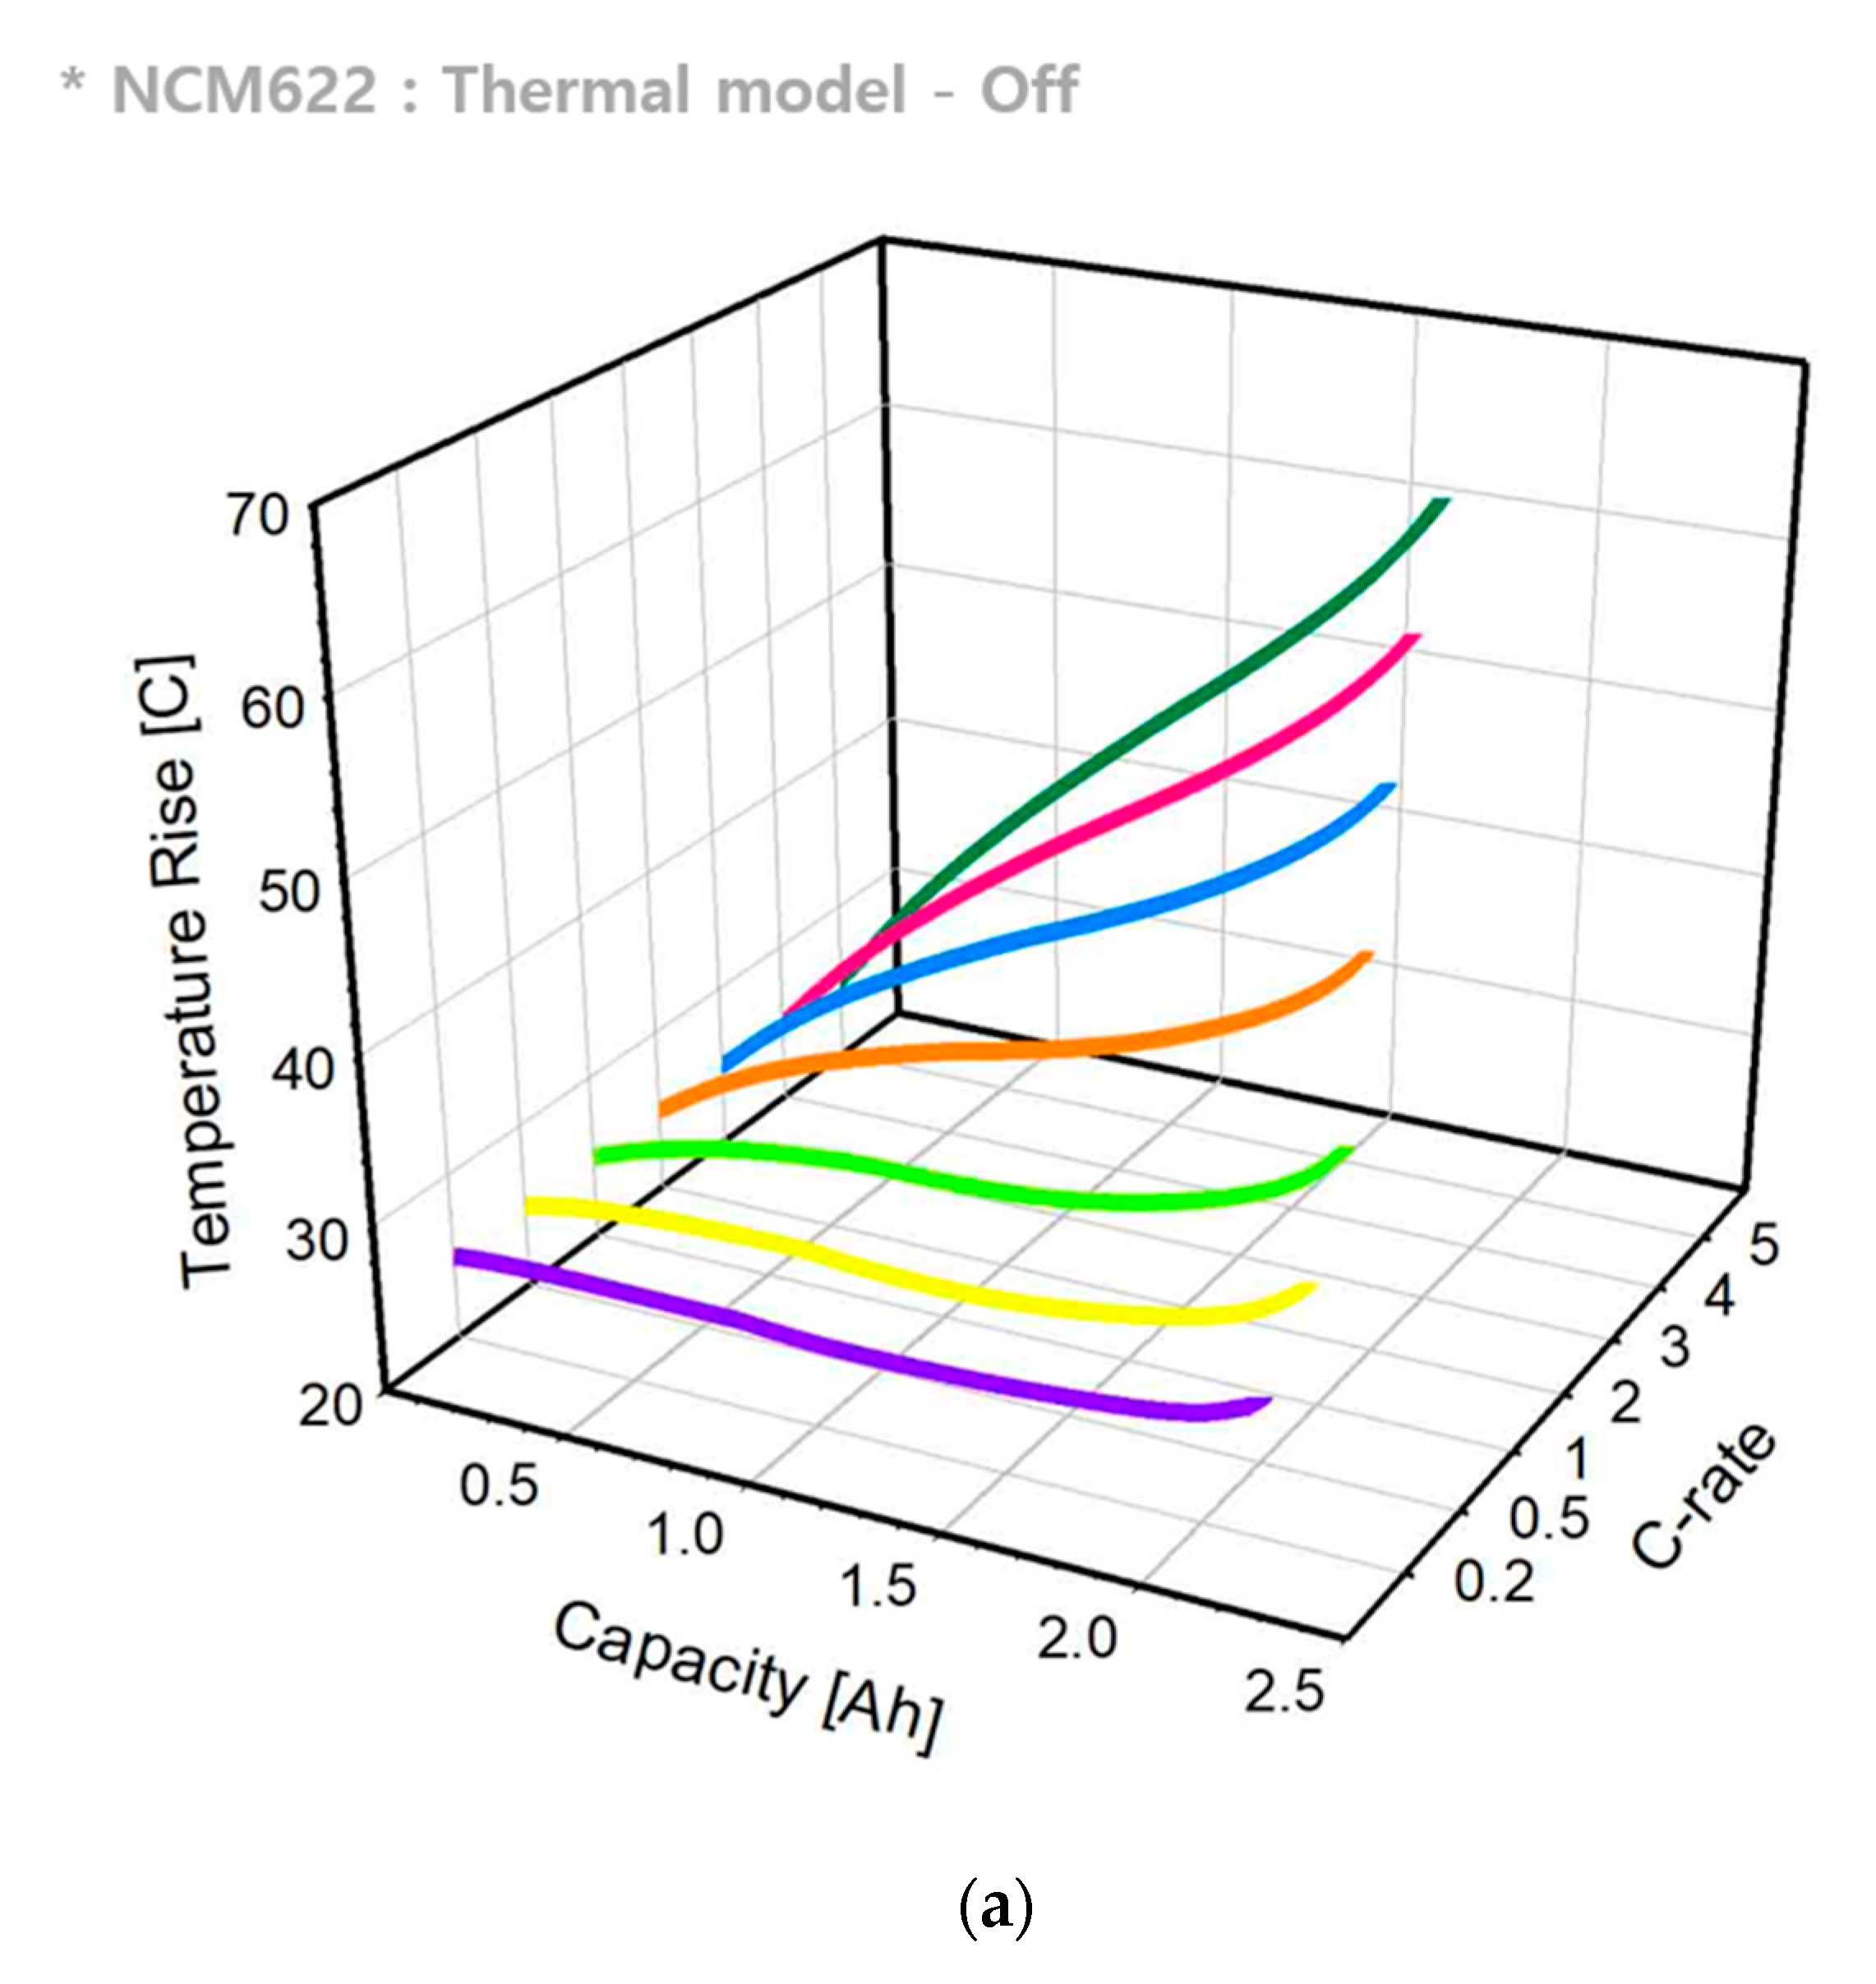
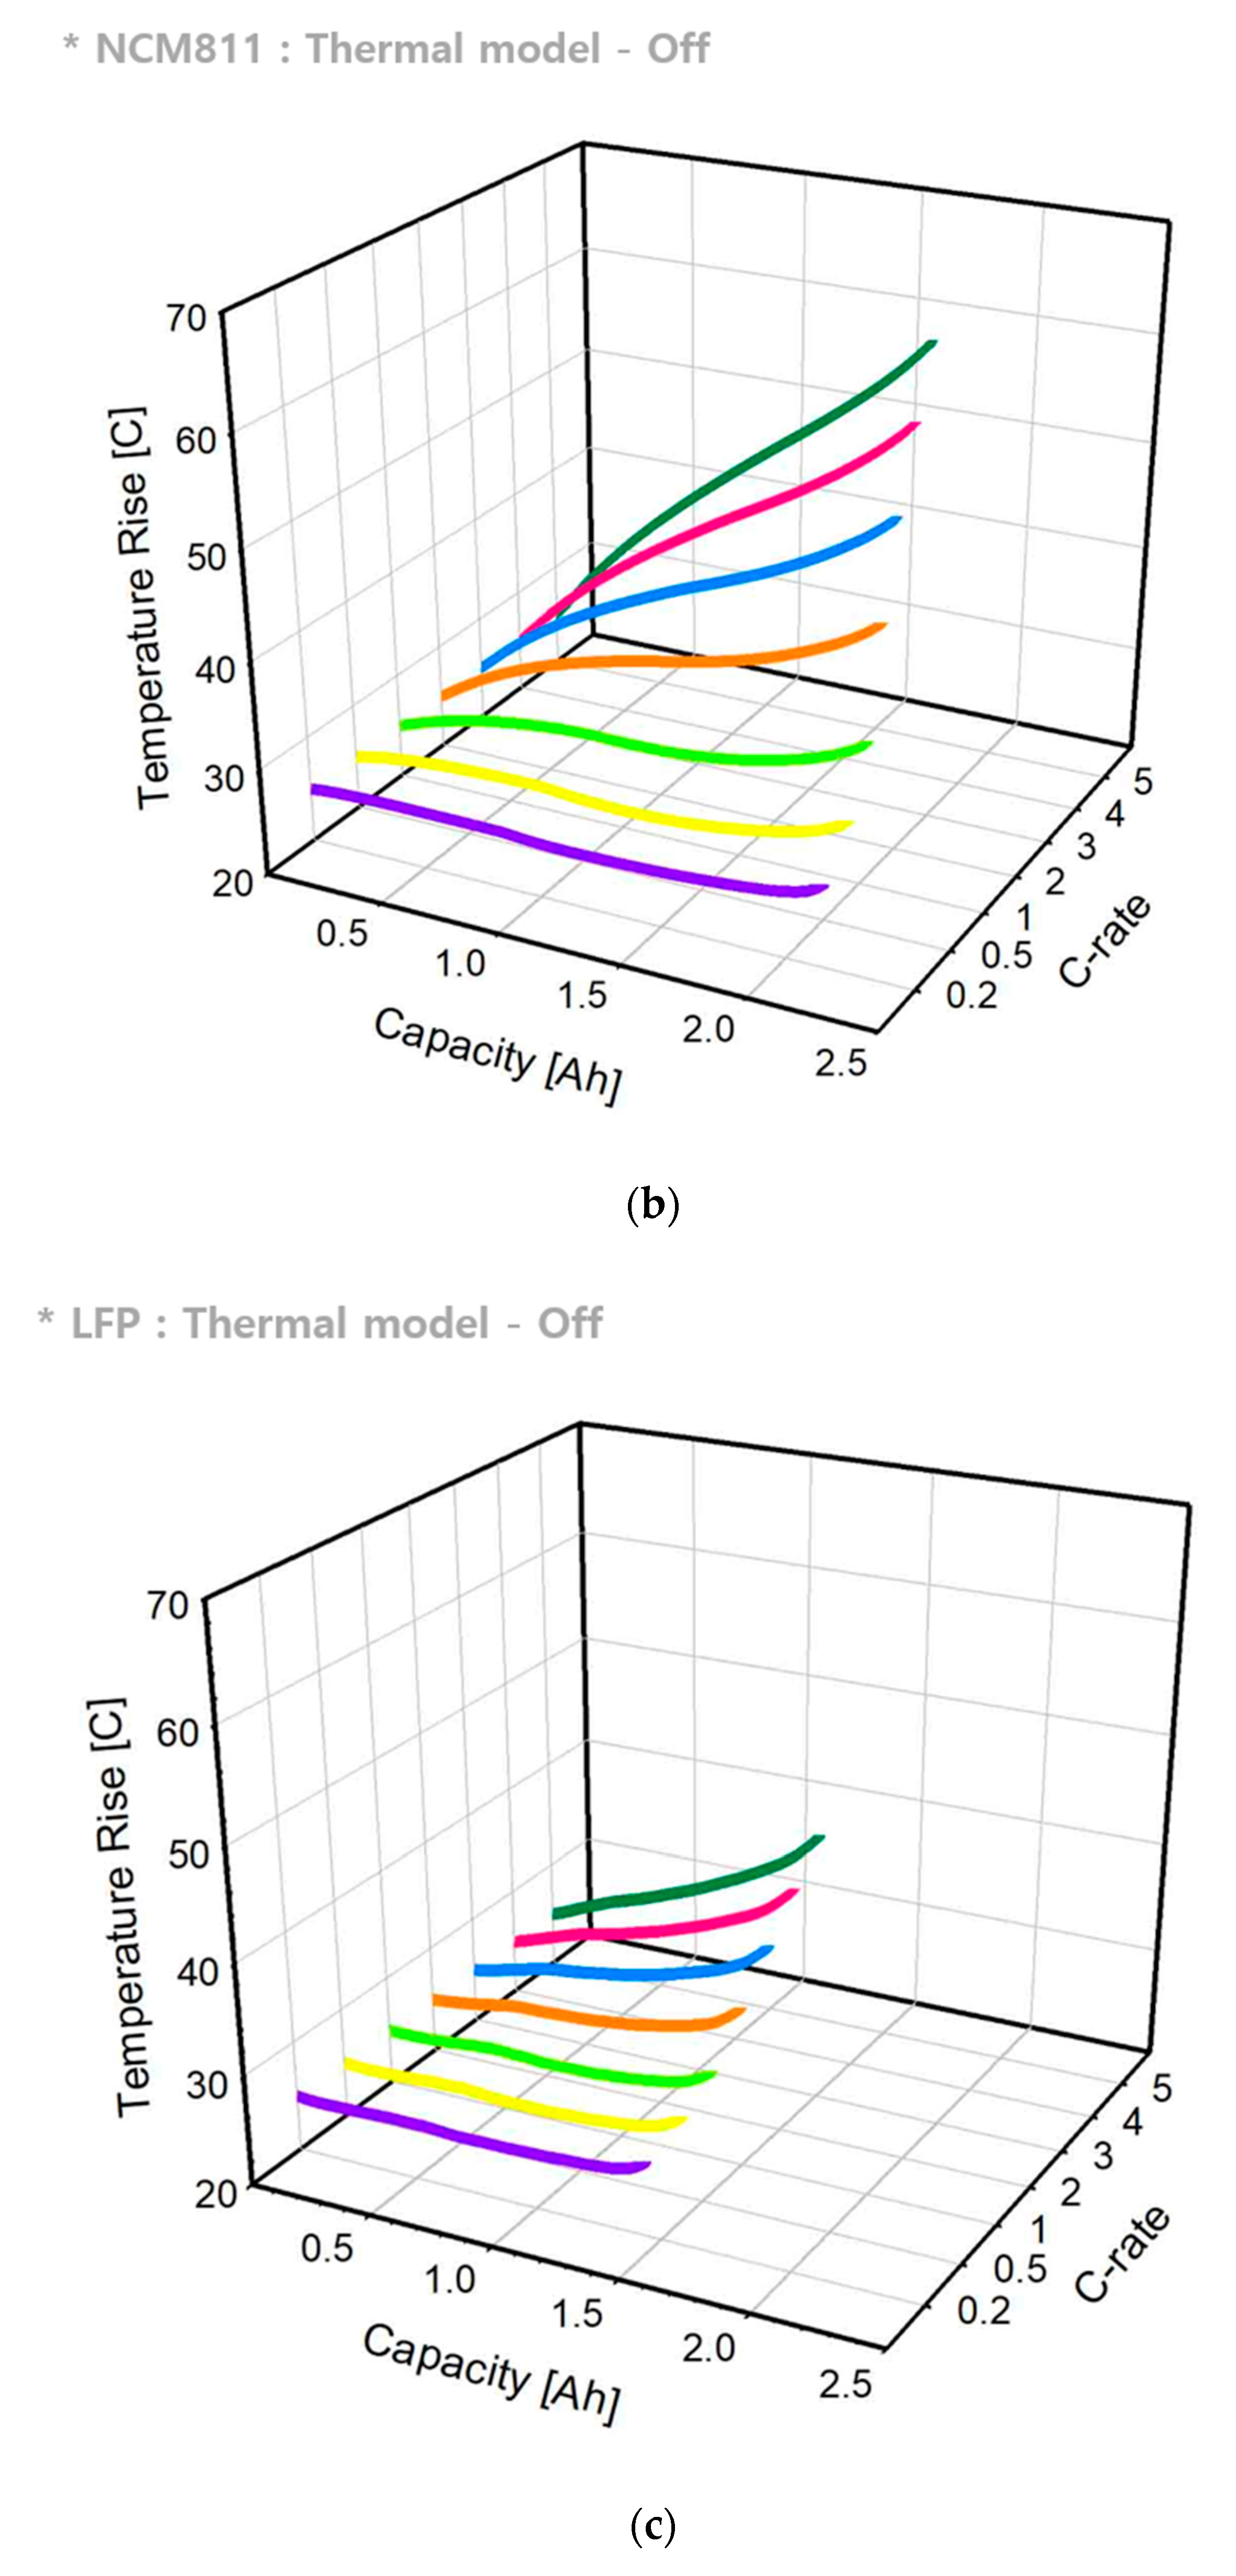
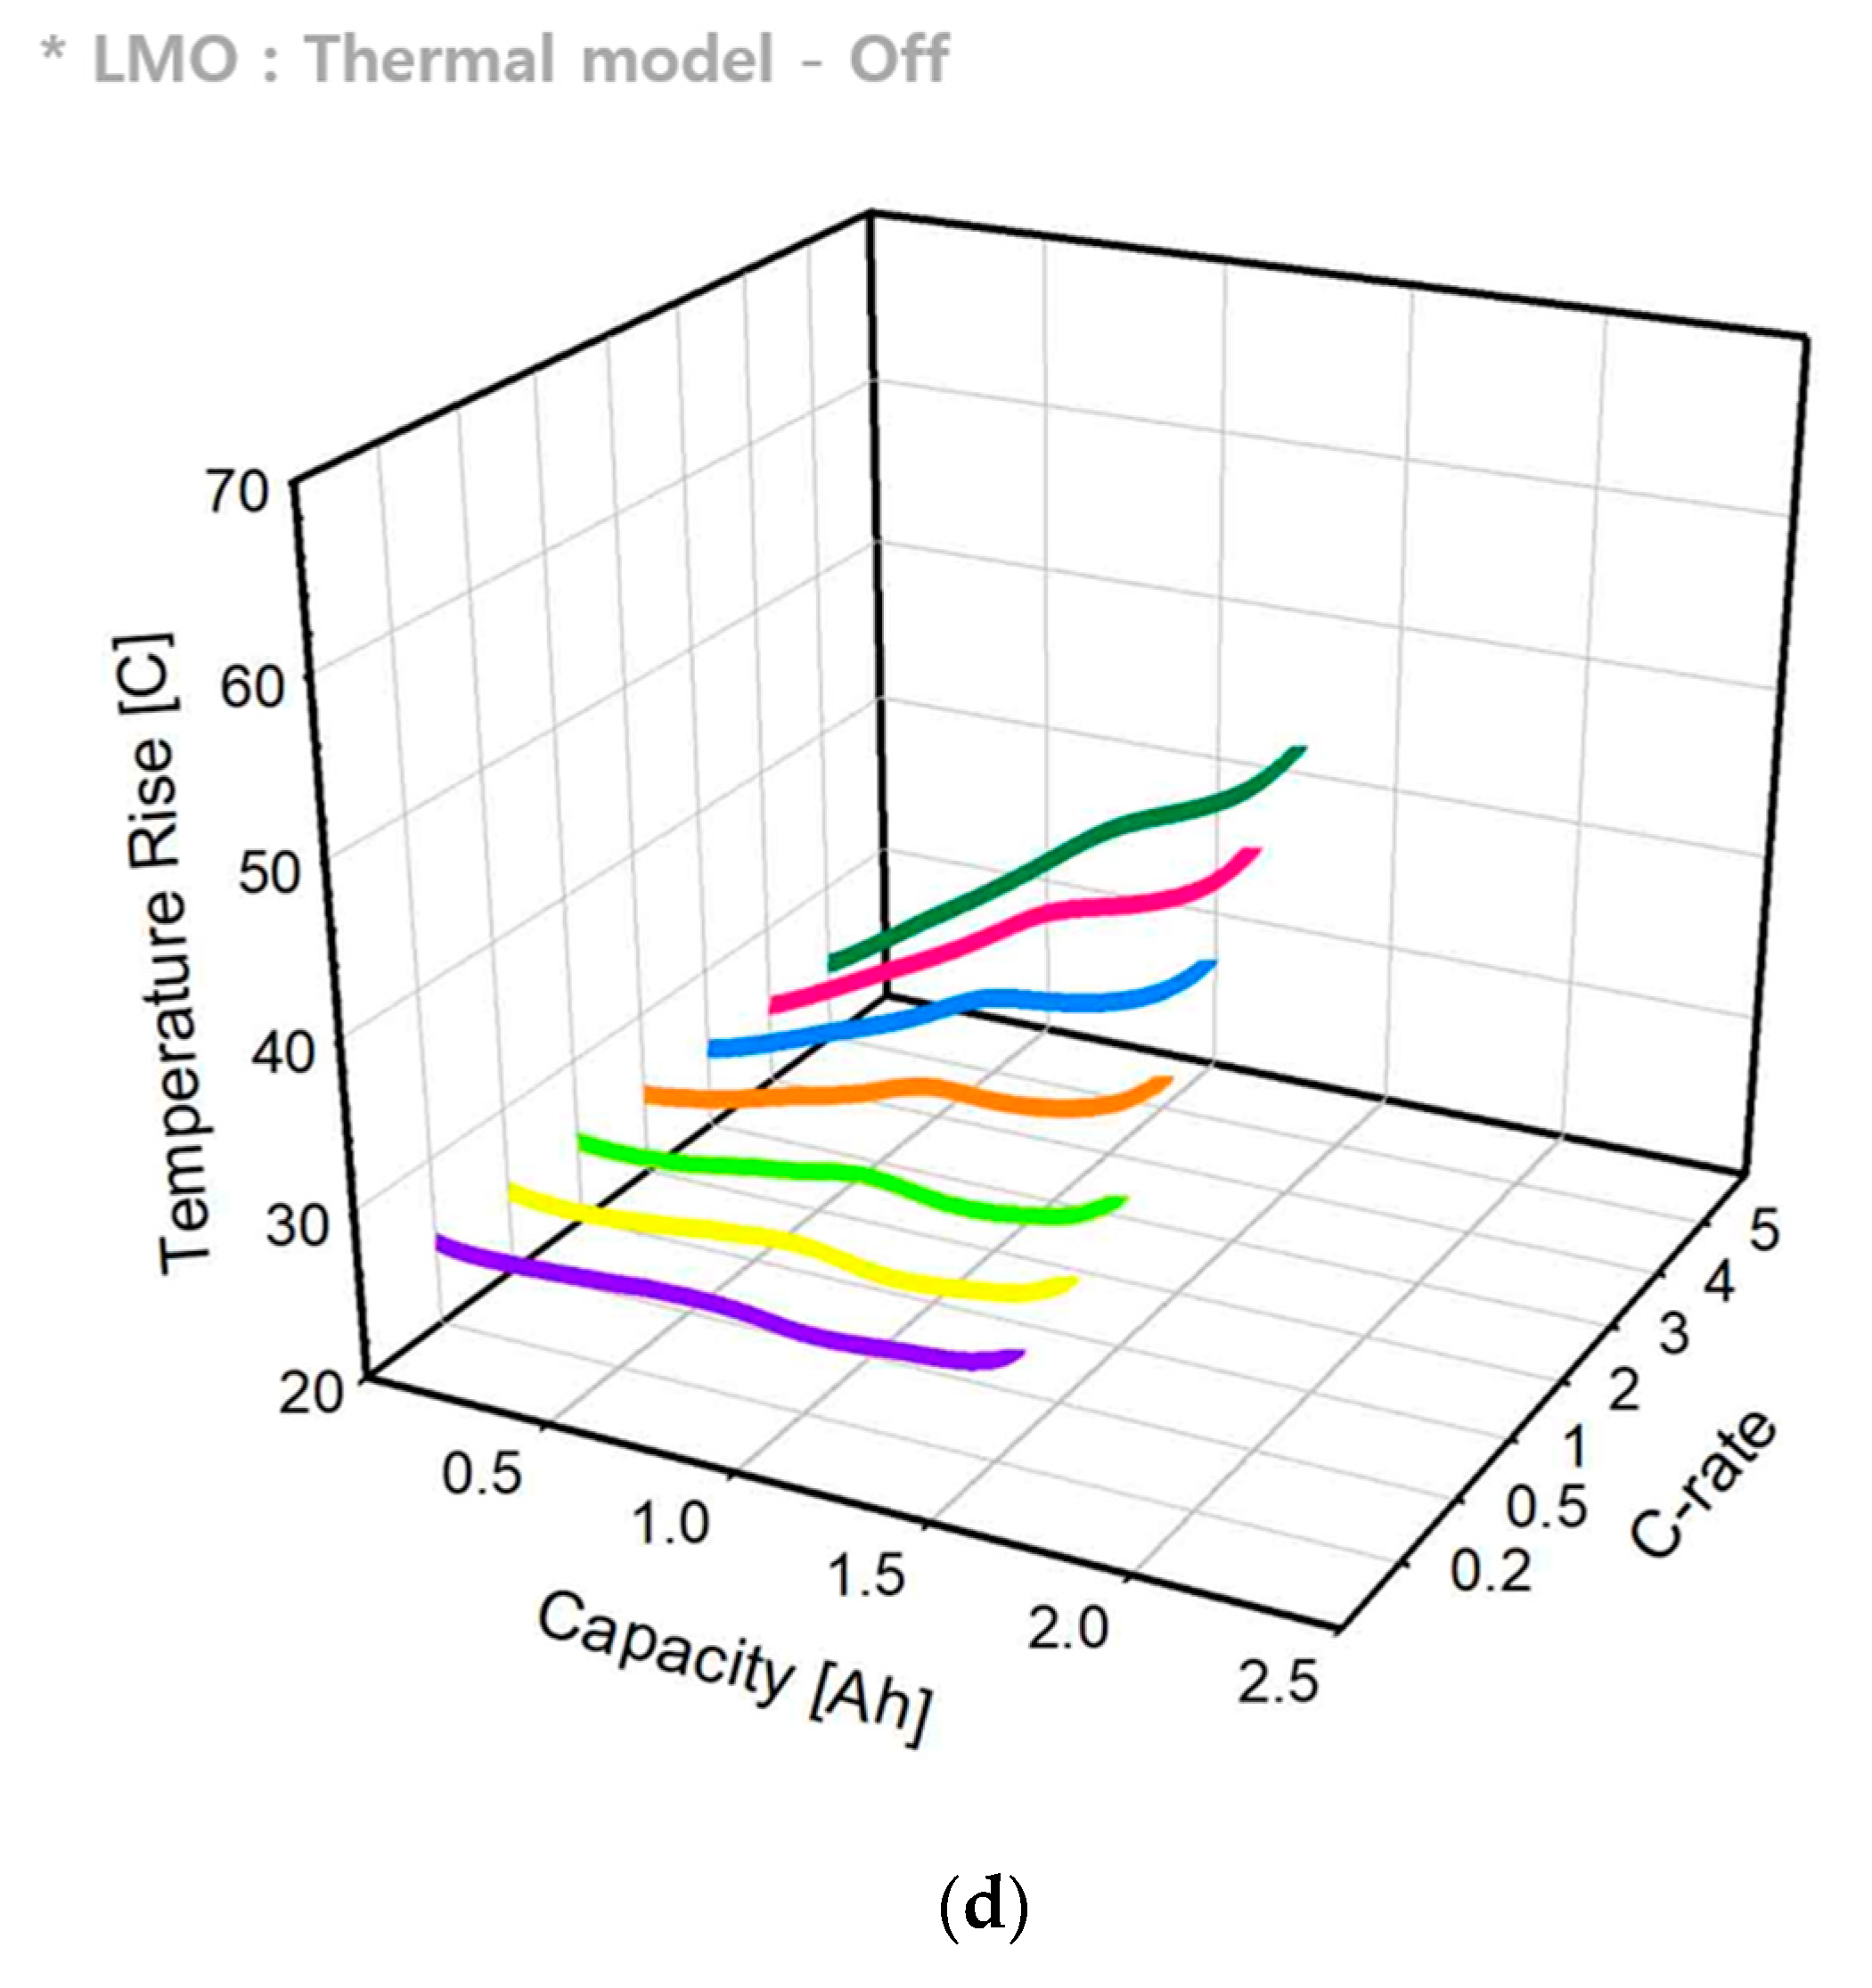
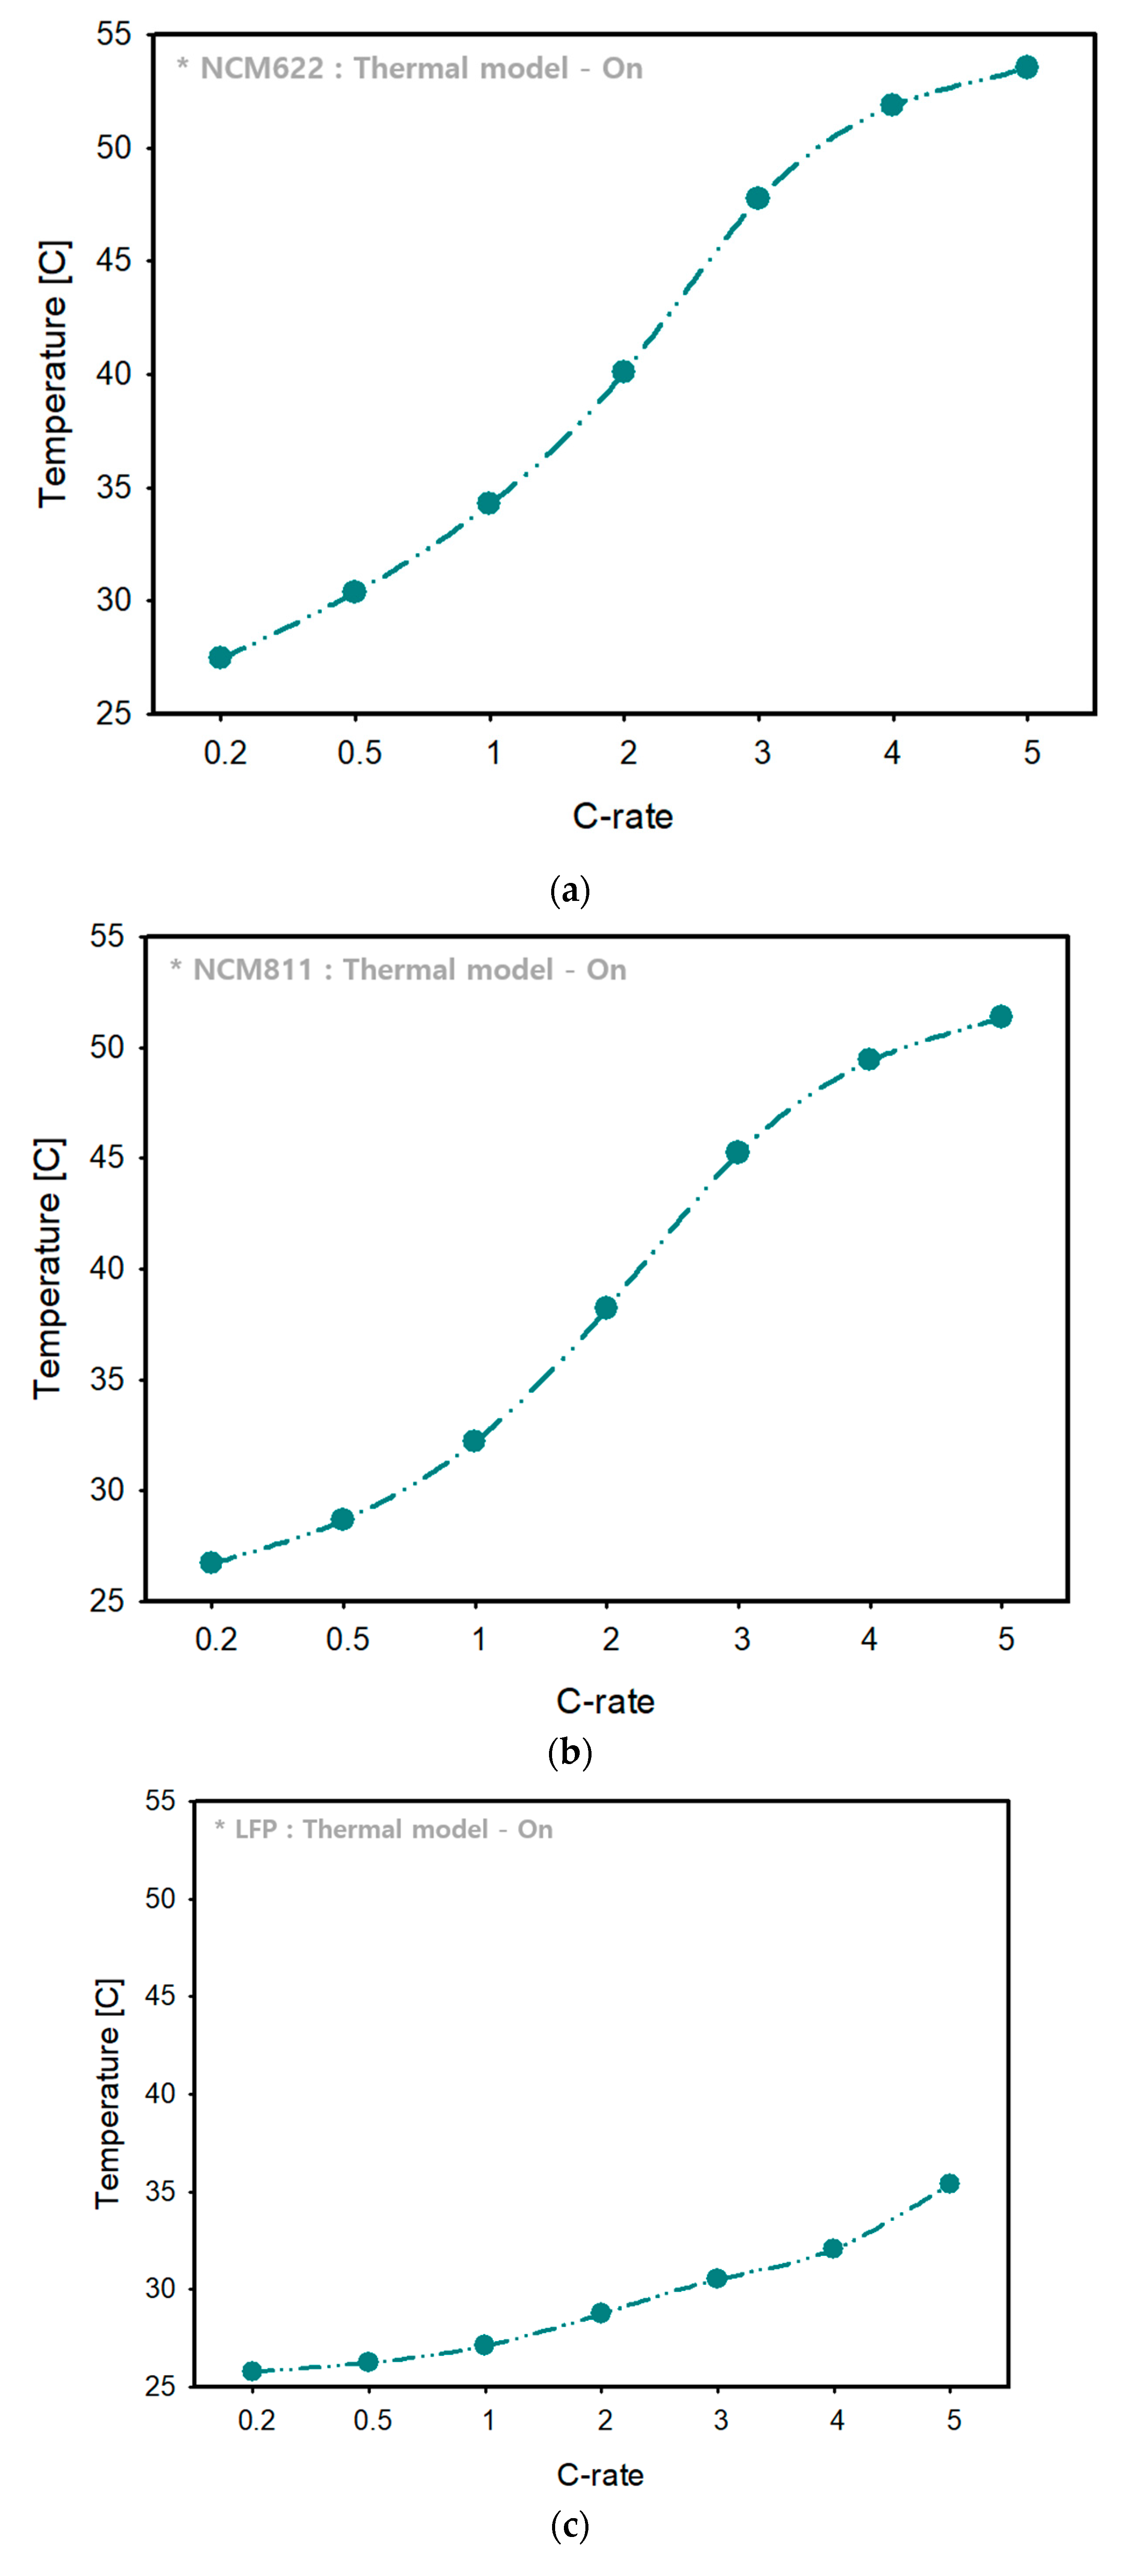
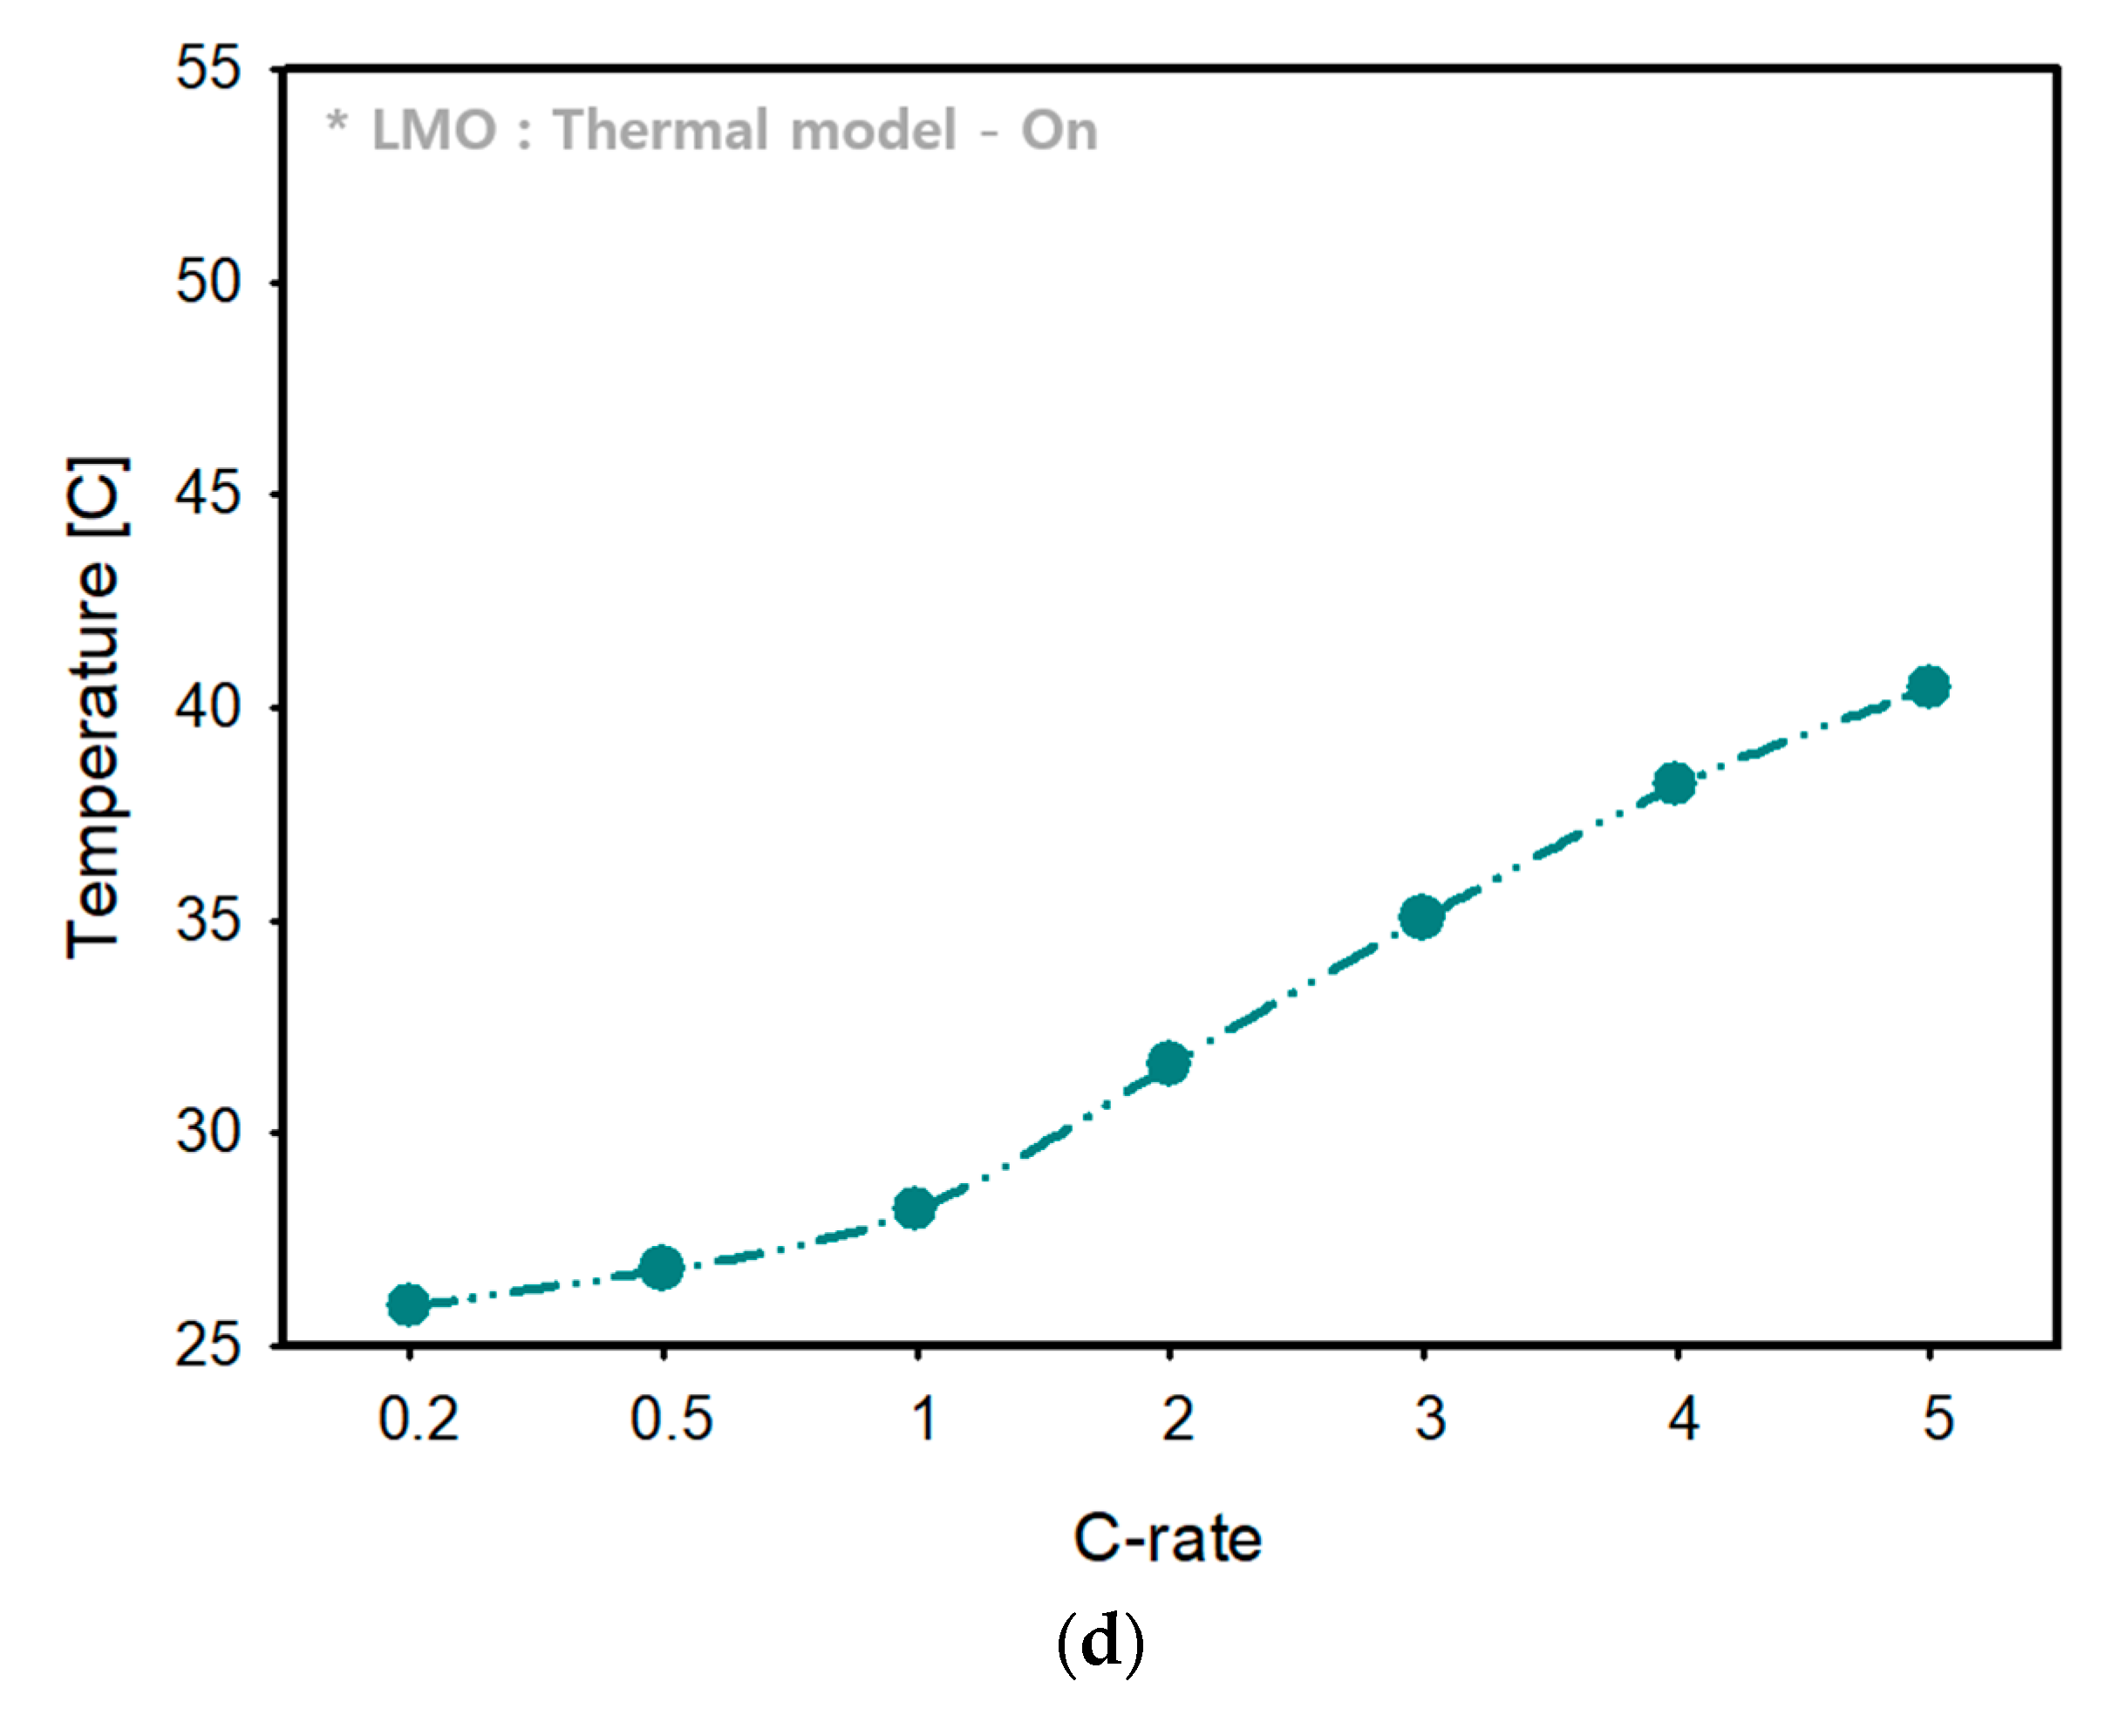
Temperature Change
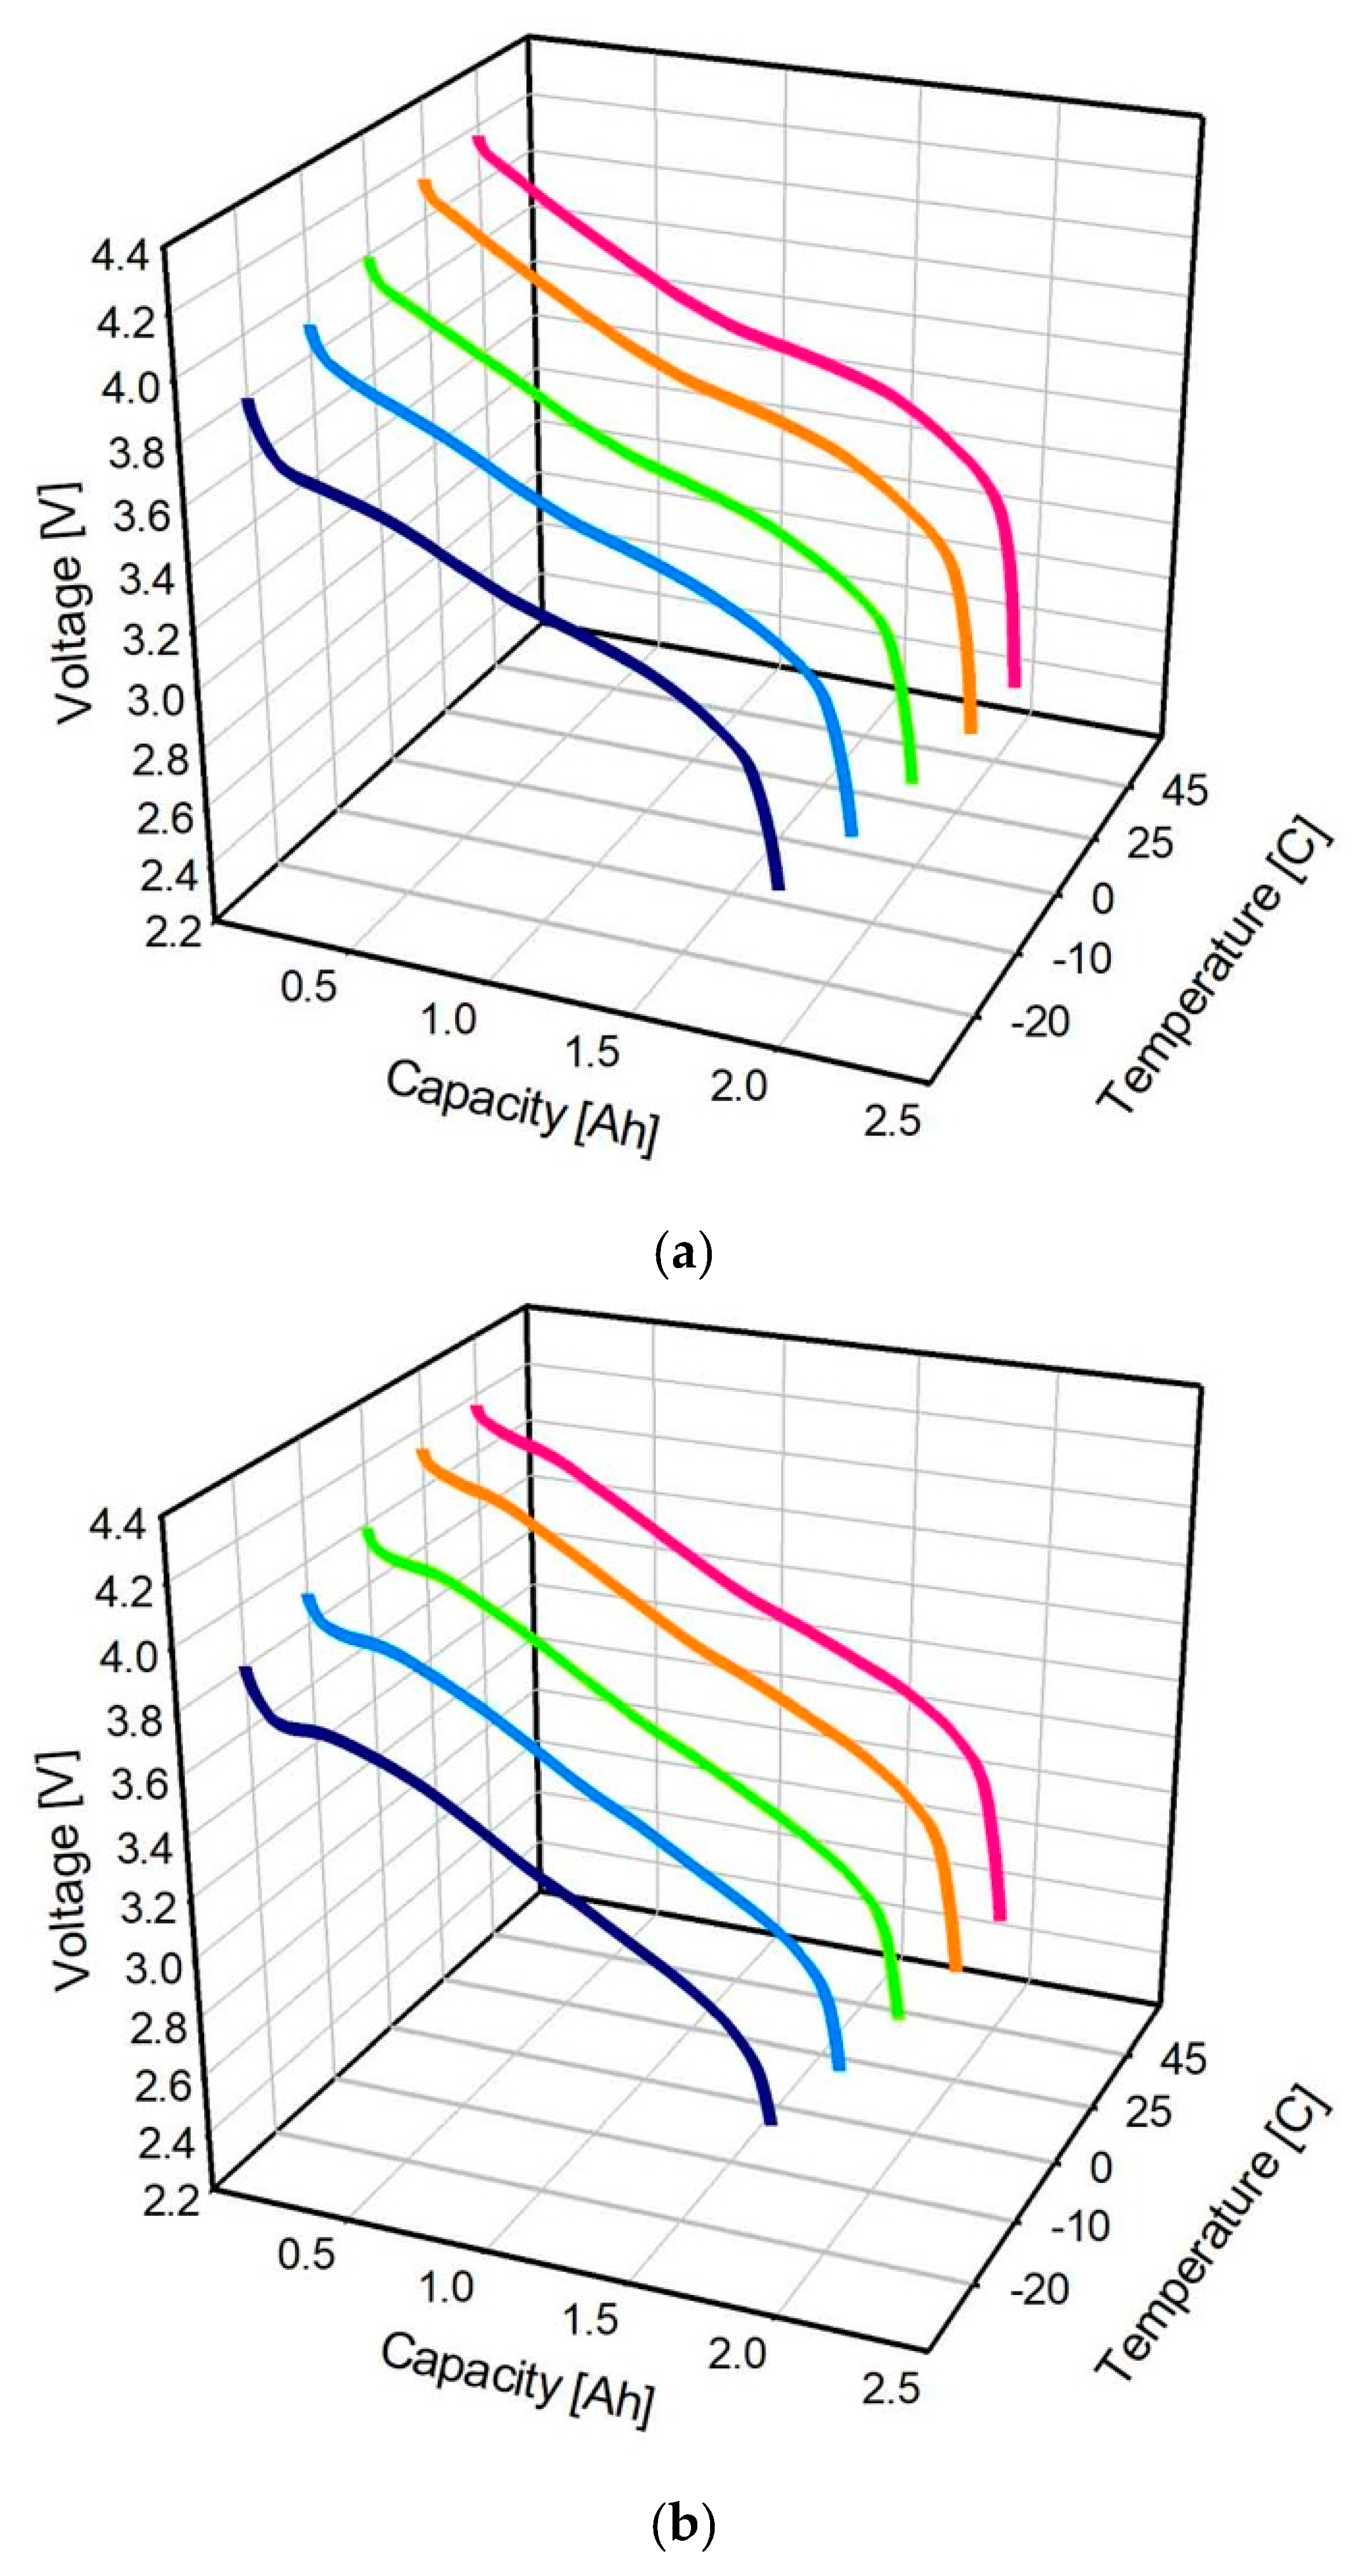
3.1.2. Battery Discharge Performance According to Temperature Conditions
Capacity Loss
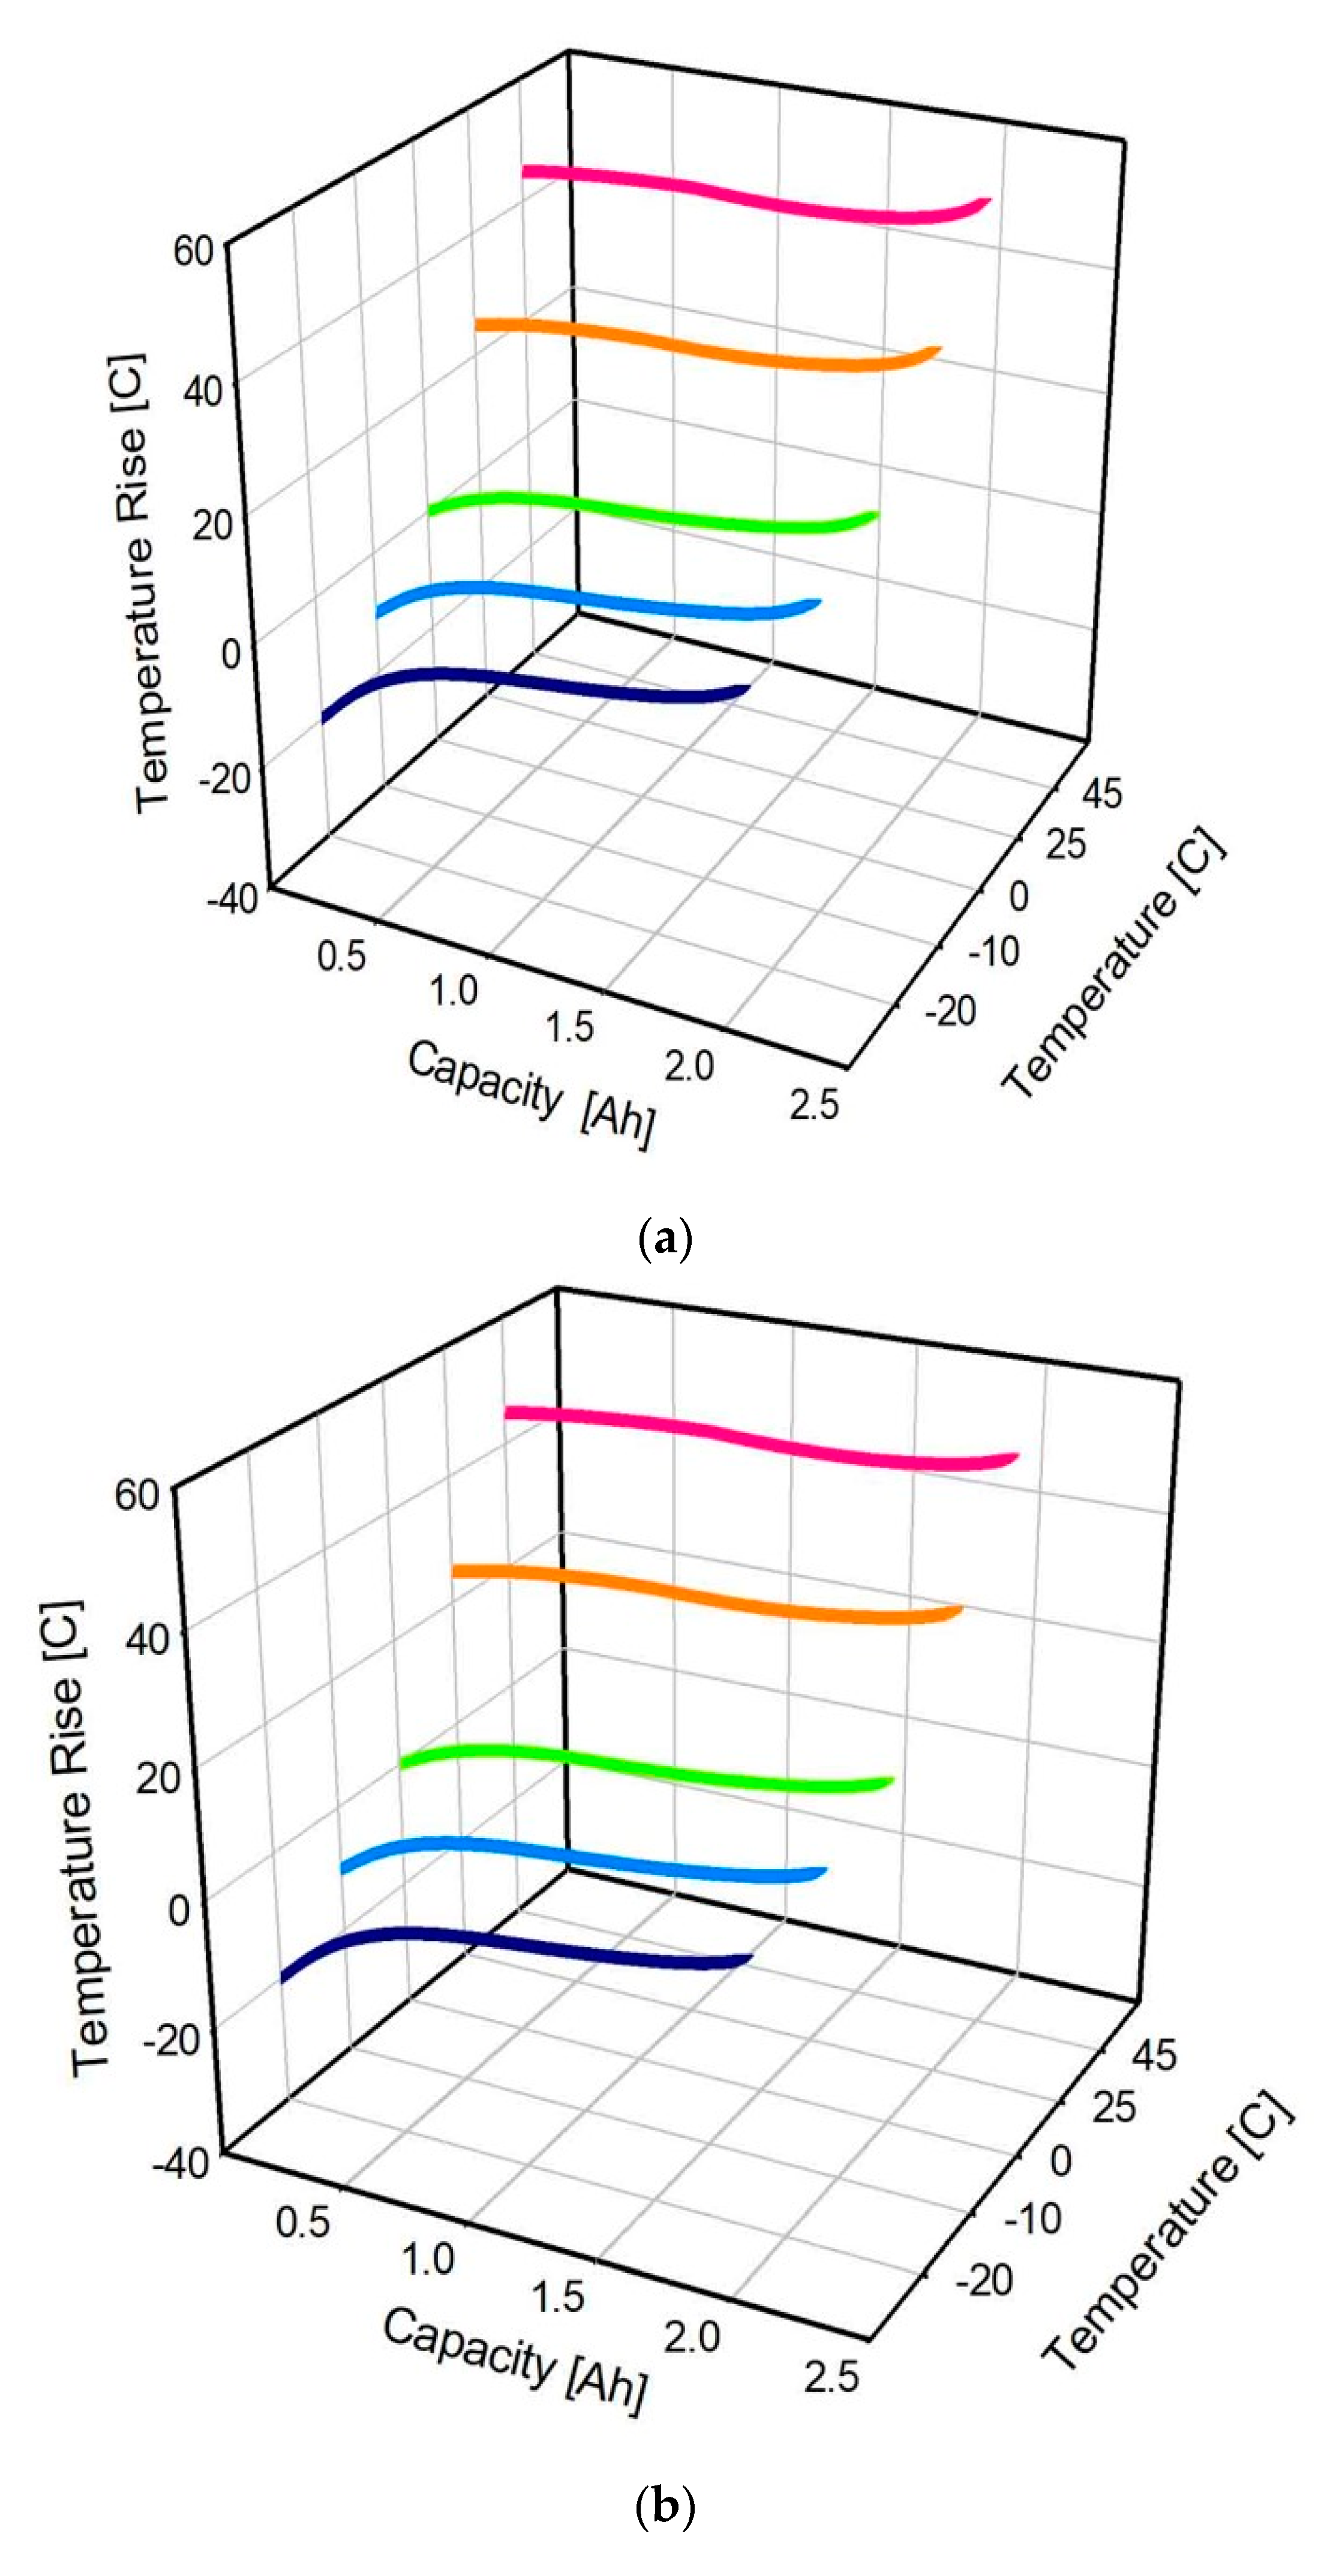
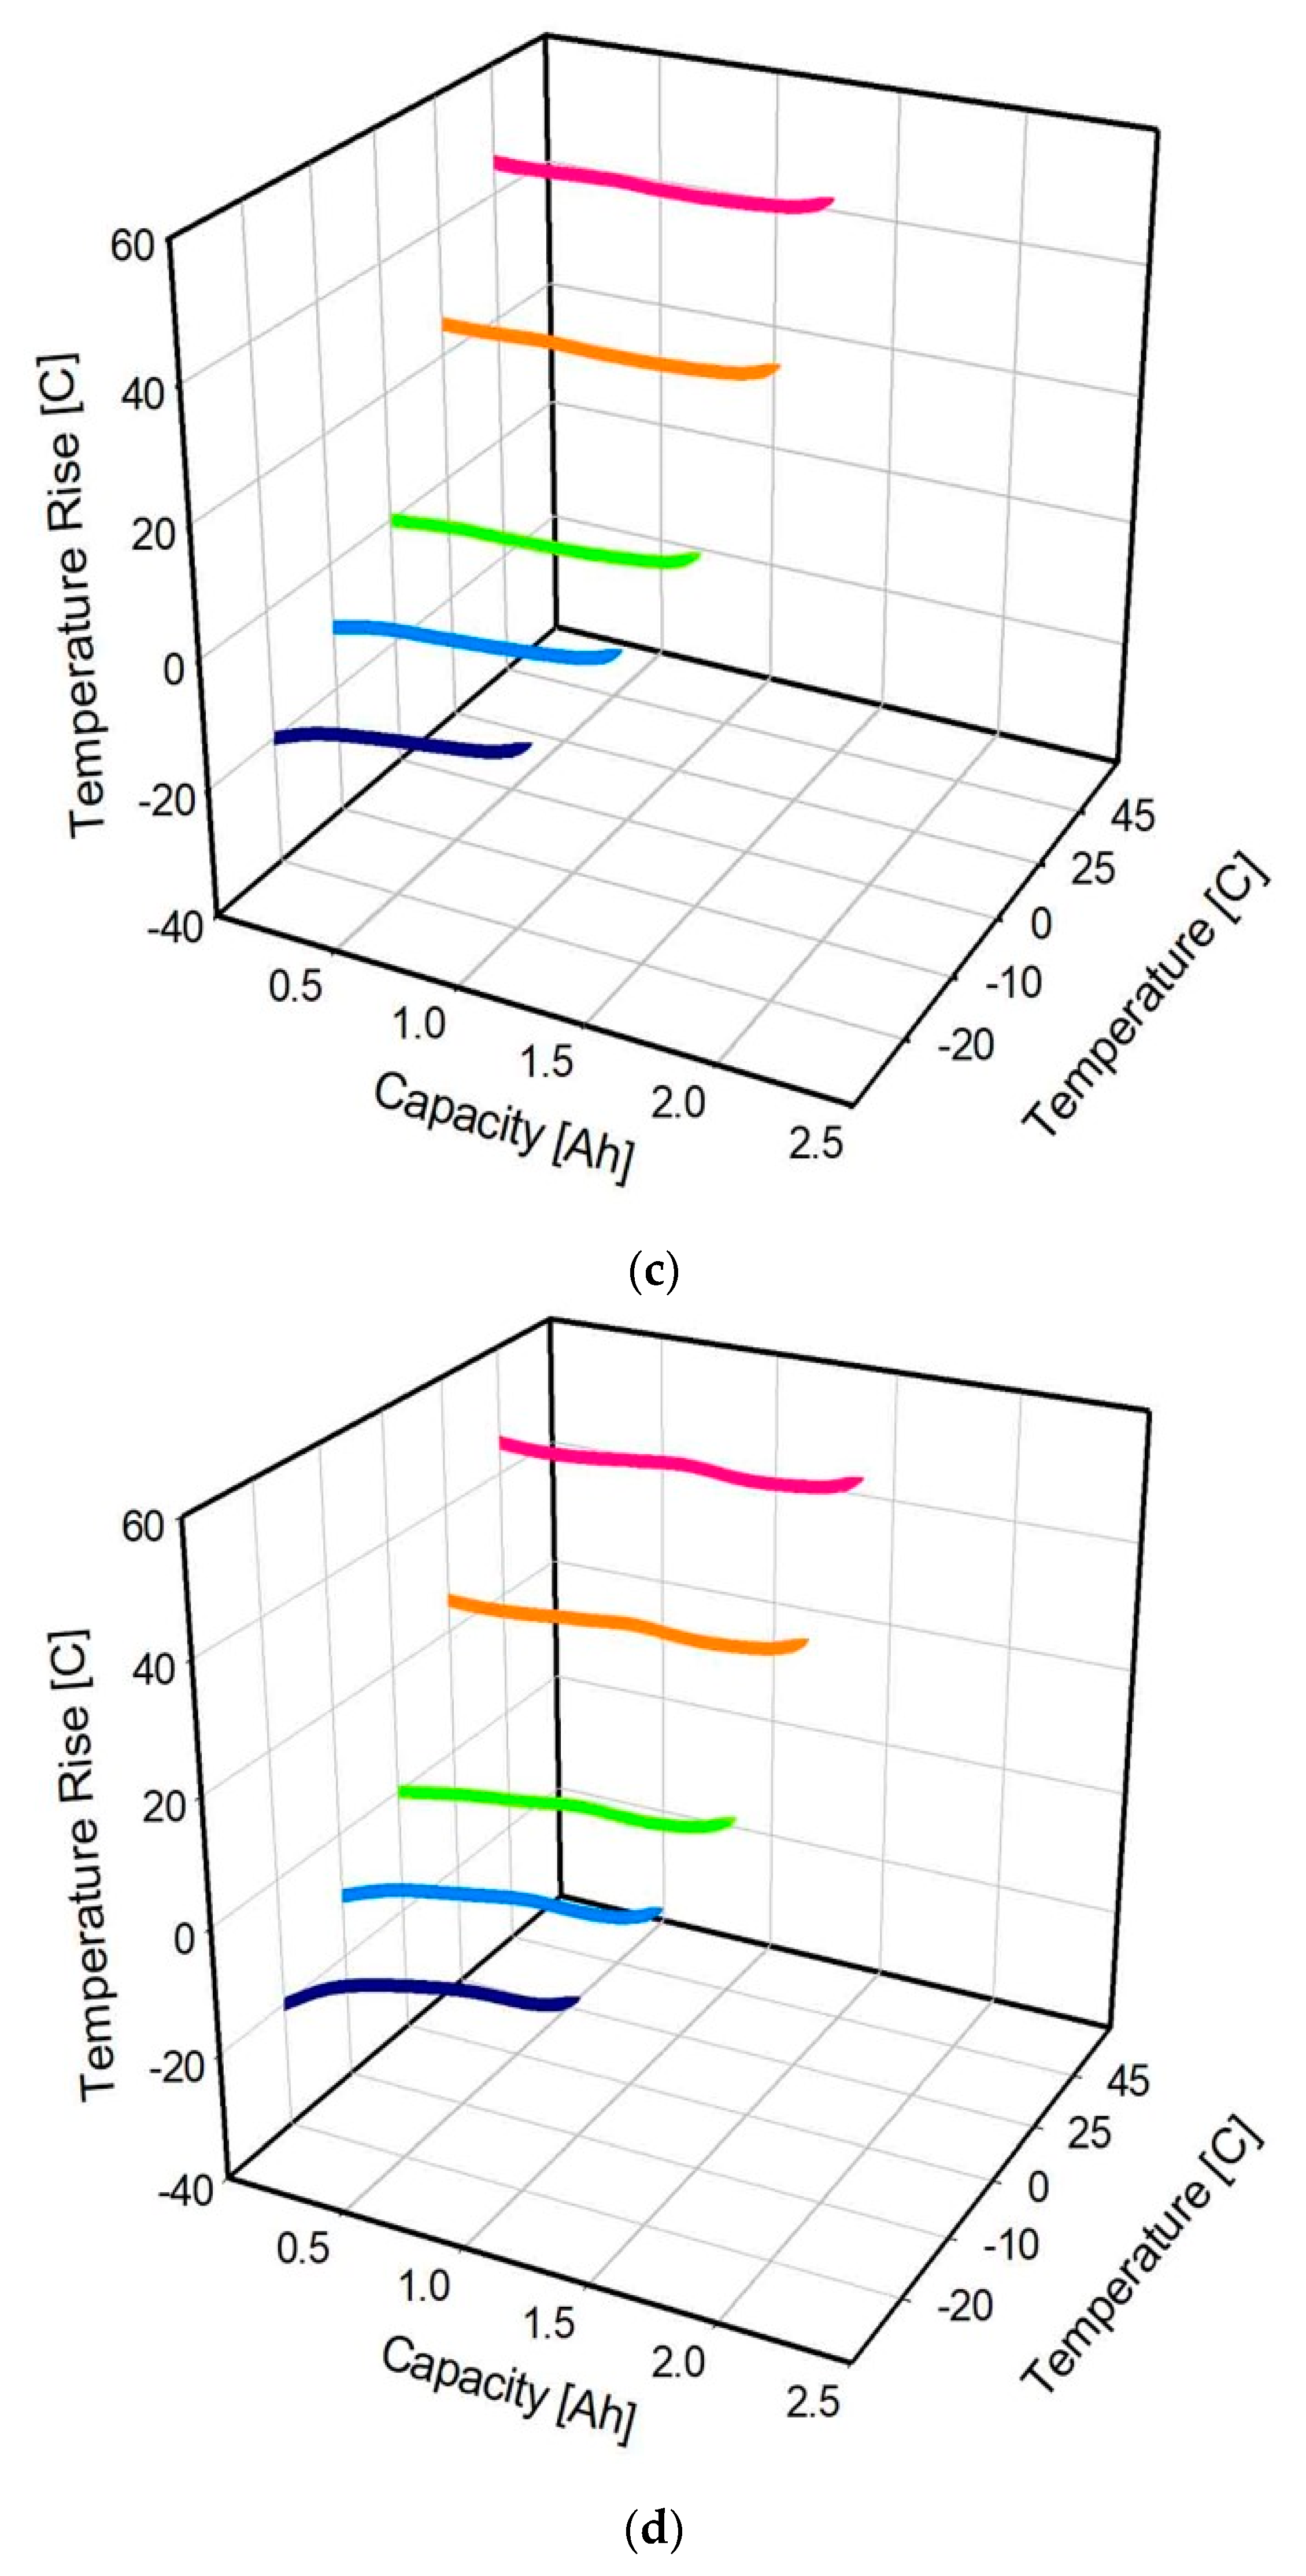
Temperature Change
3.2. Analysis of EV Characteristics According to Battery Pack by Type of Positive Electrode Active Material
3.2.1. Comparison Analysis of Characteristics of the Battery Model According to the Application of the Driving Cycle
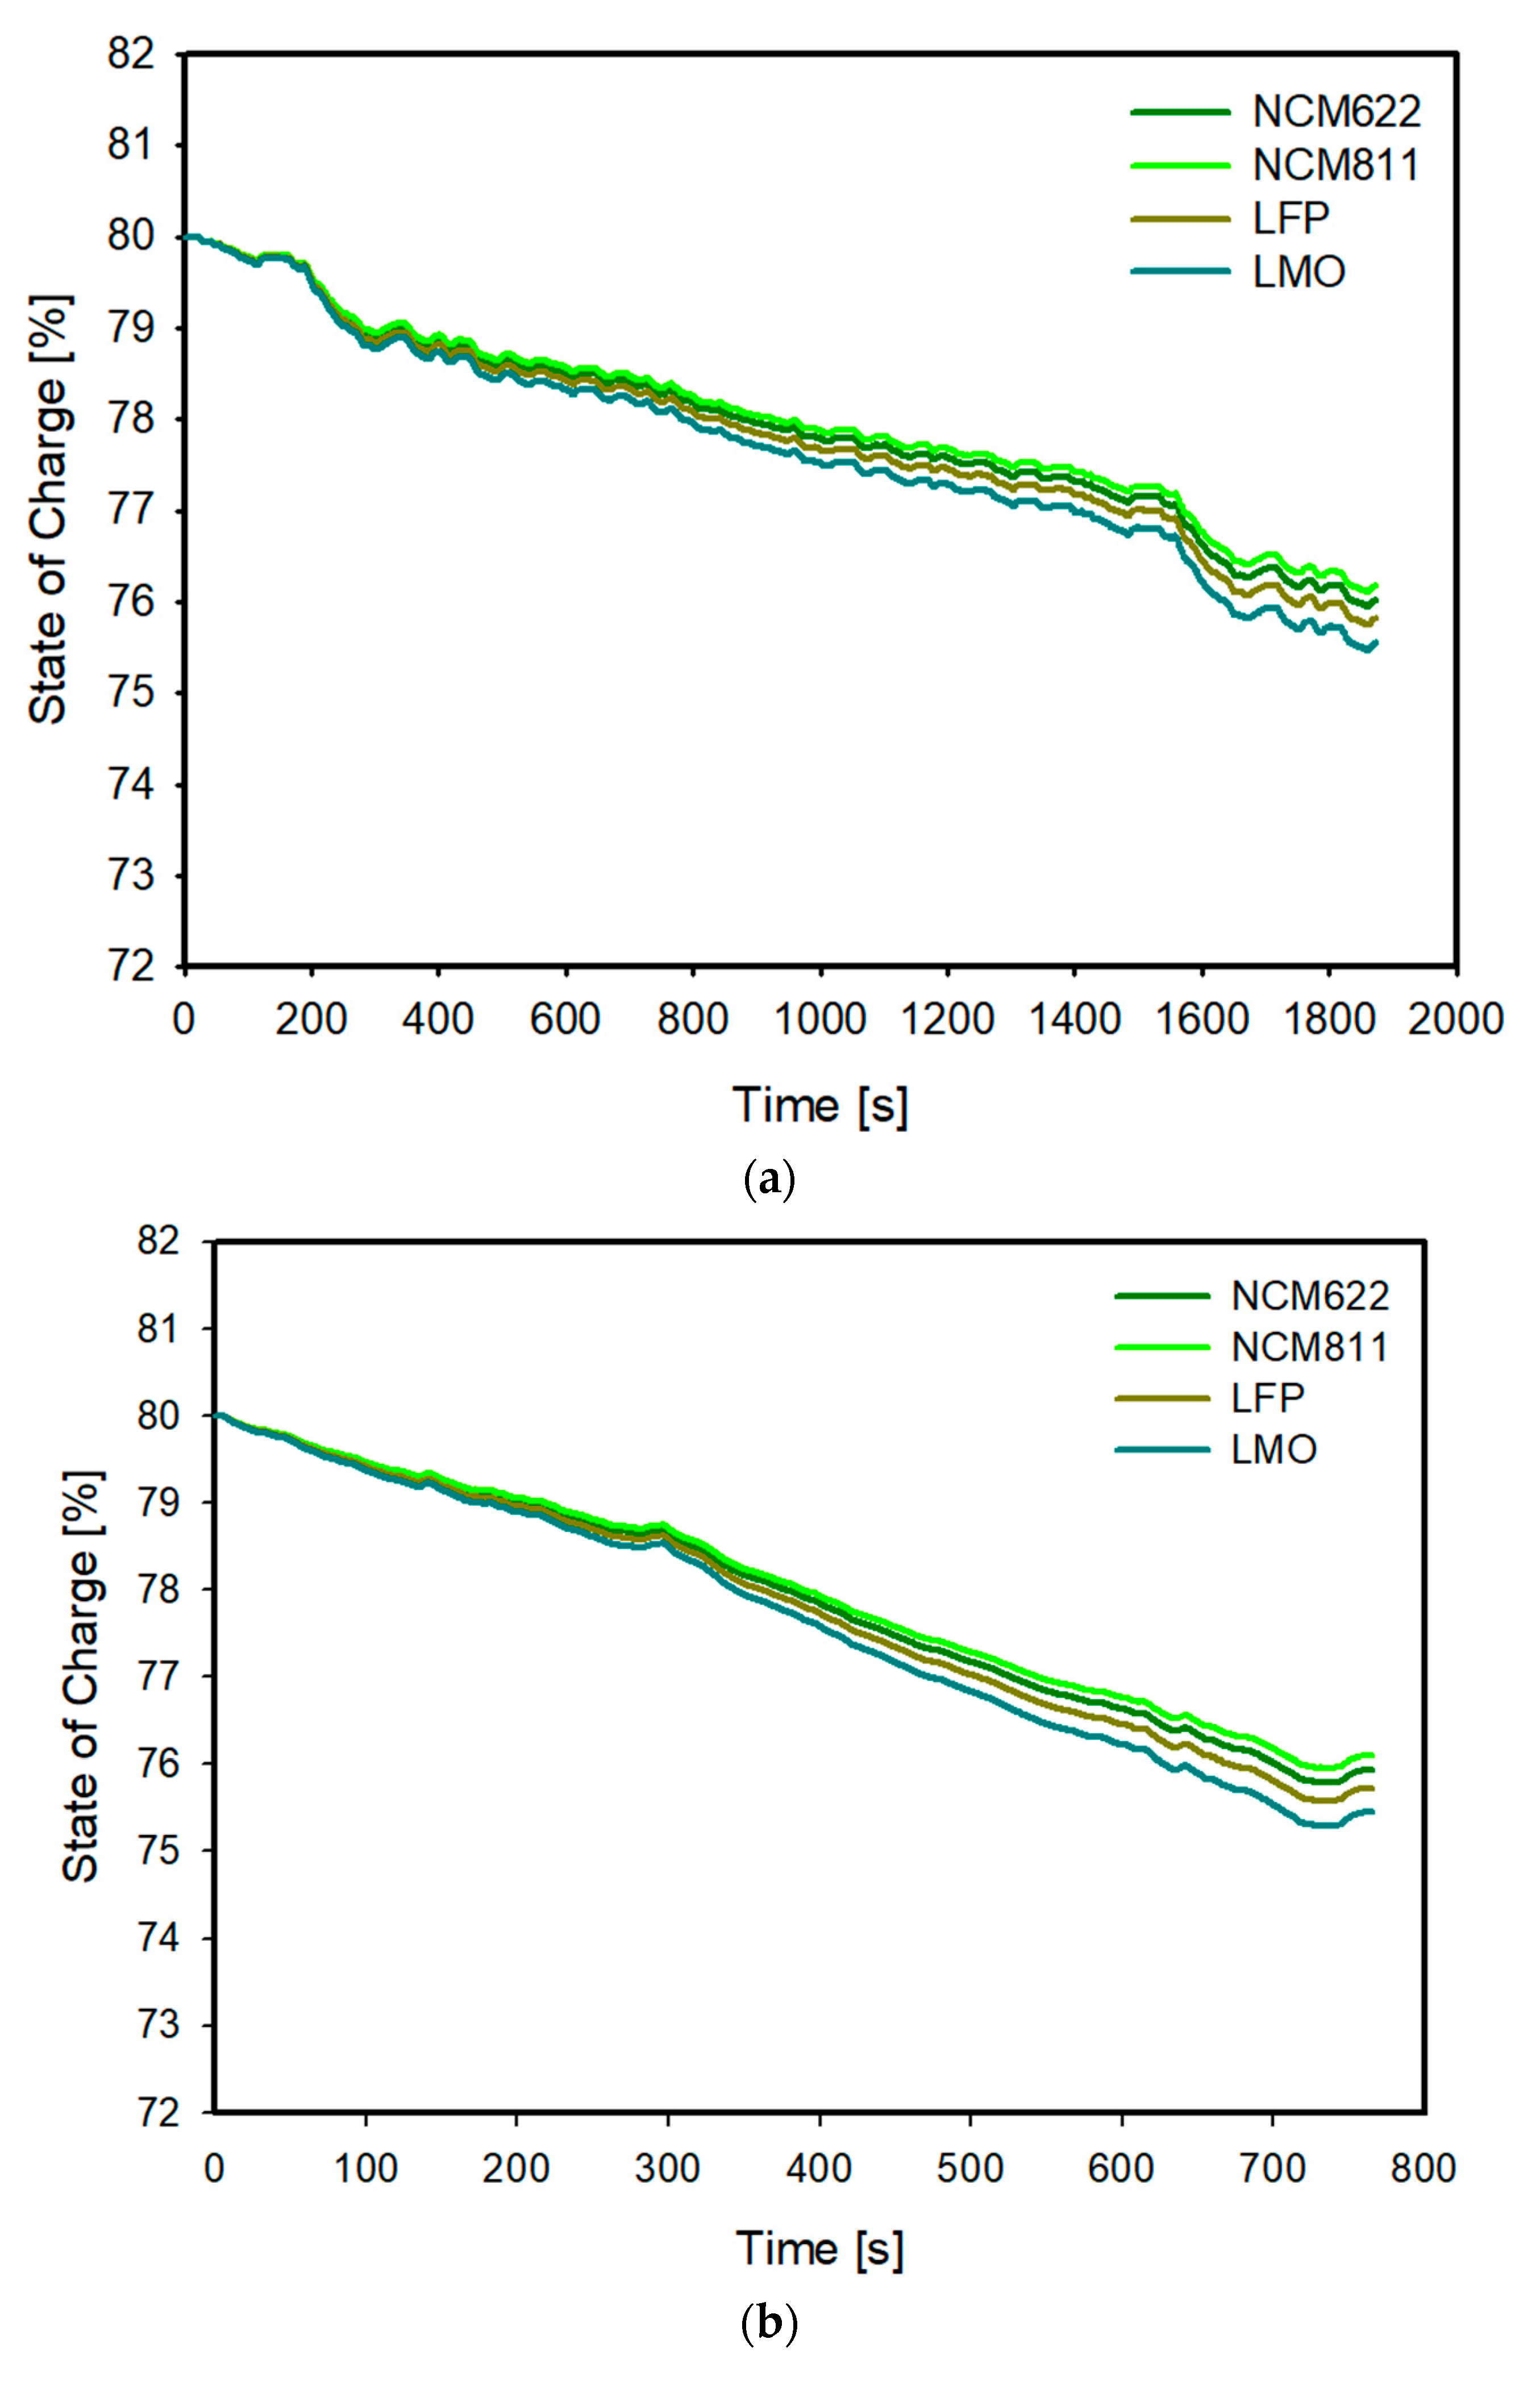
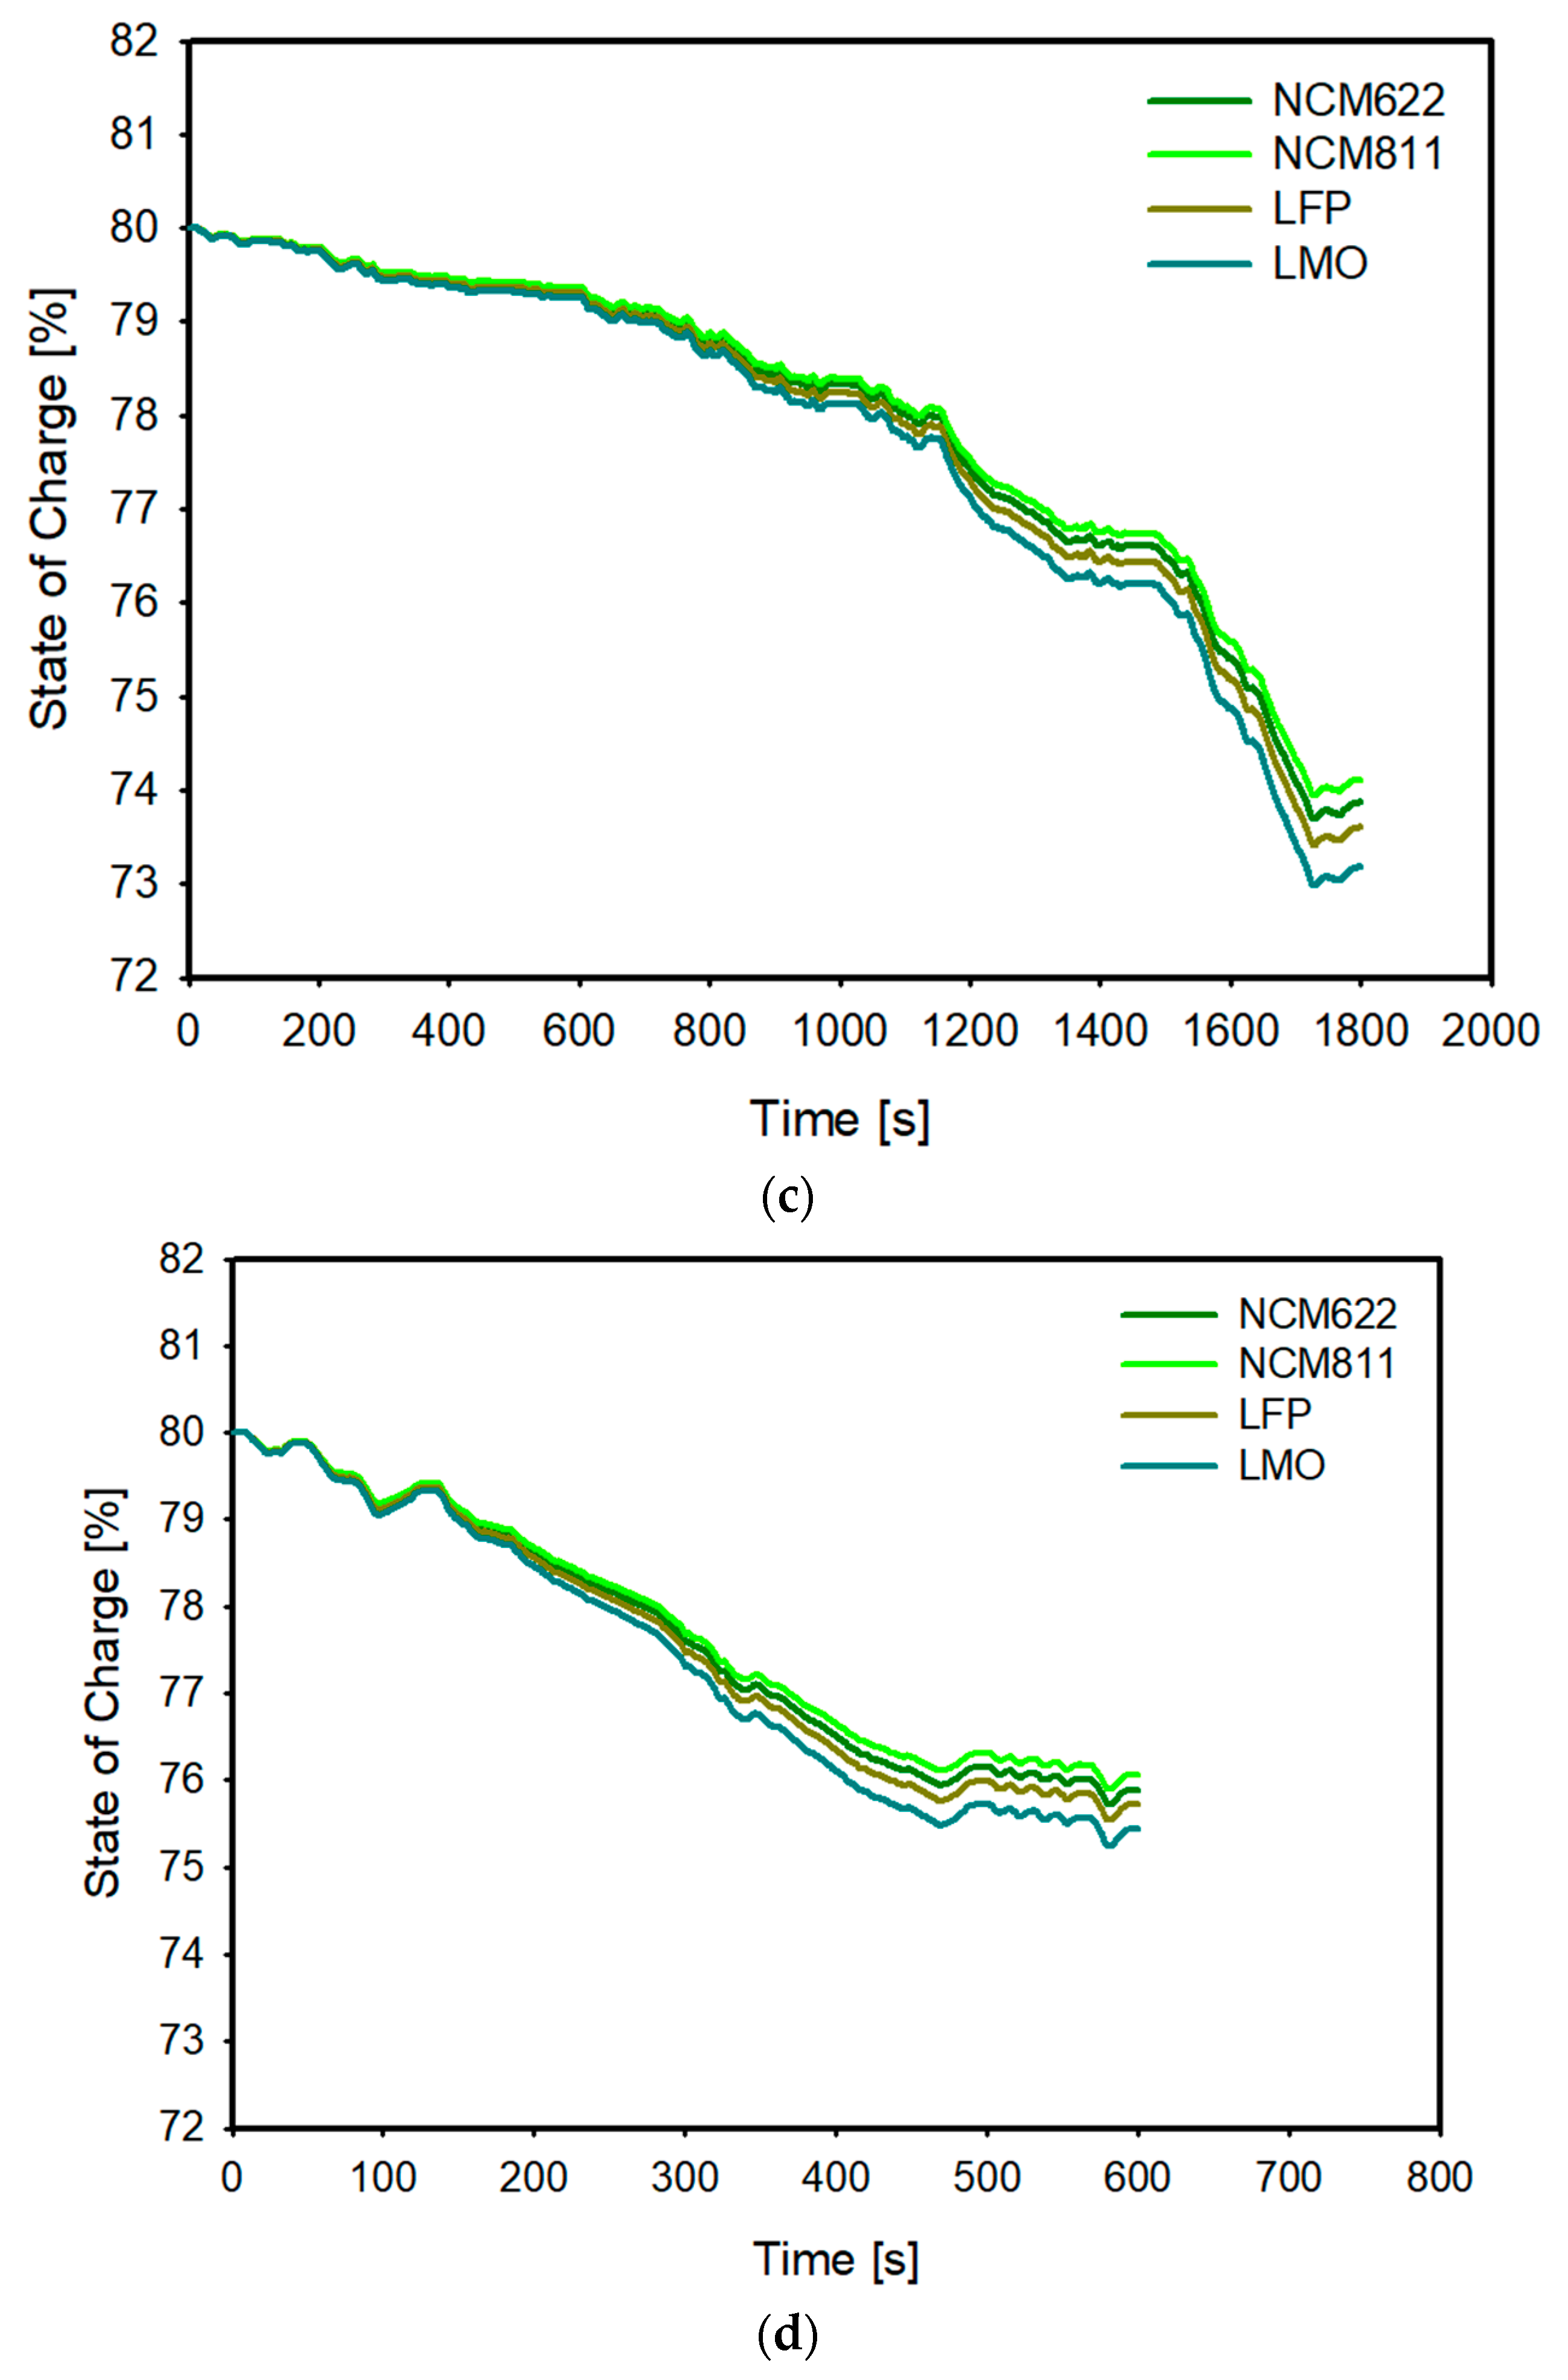
SOC
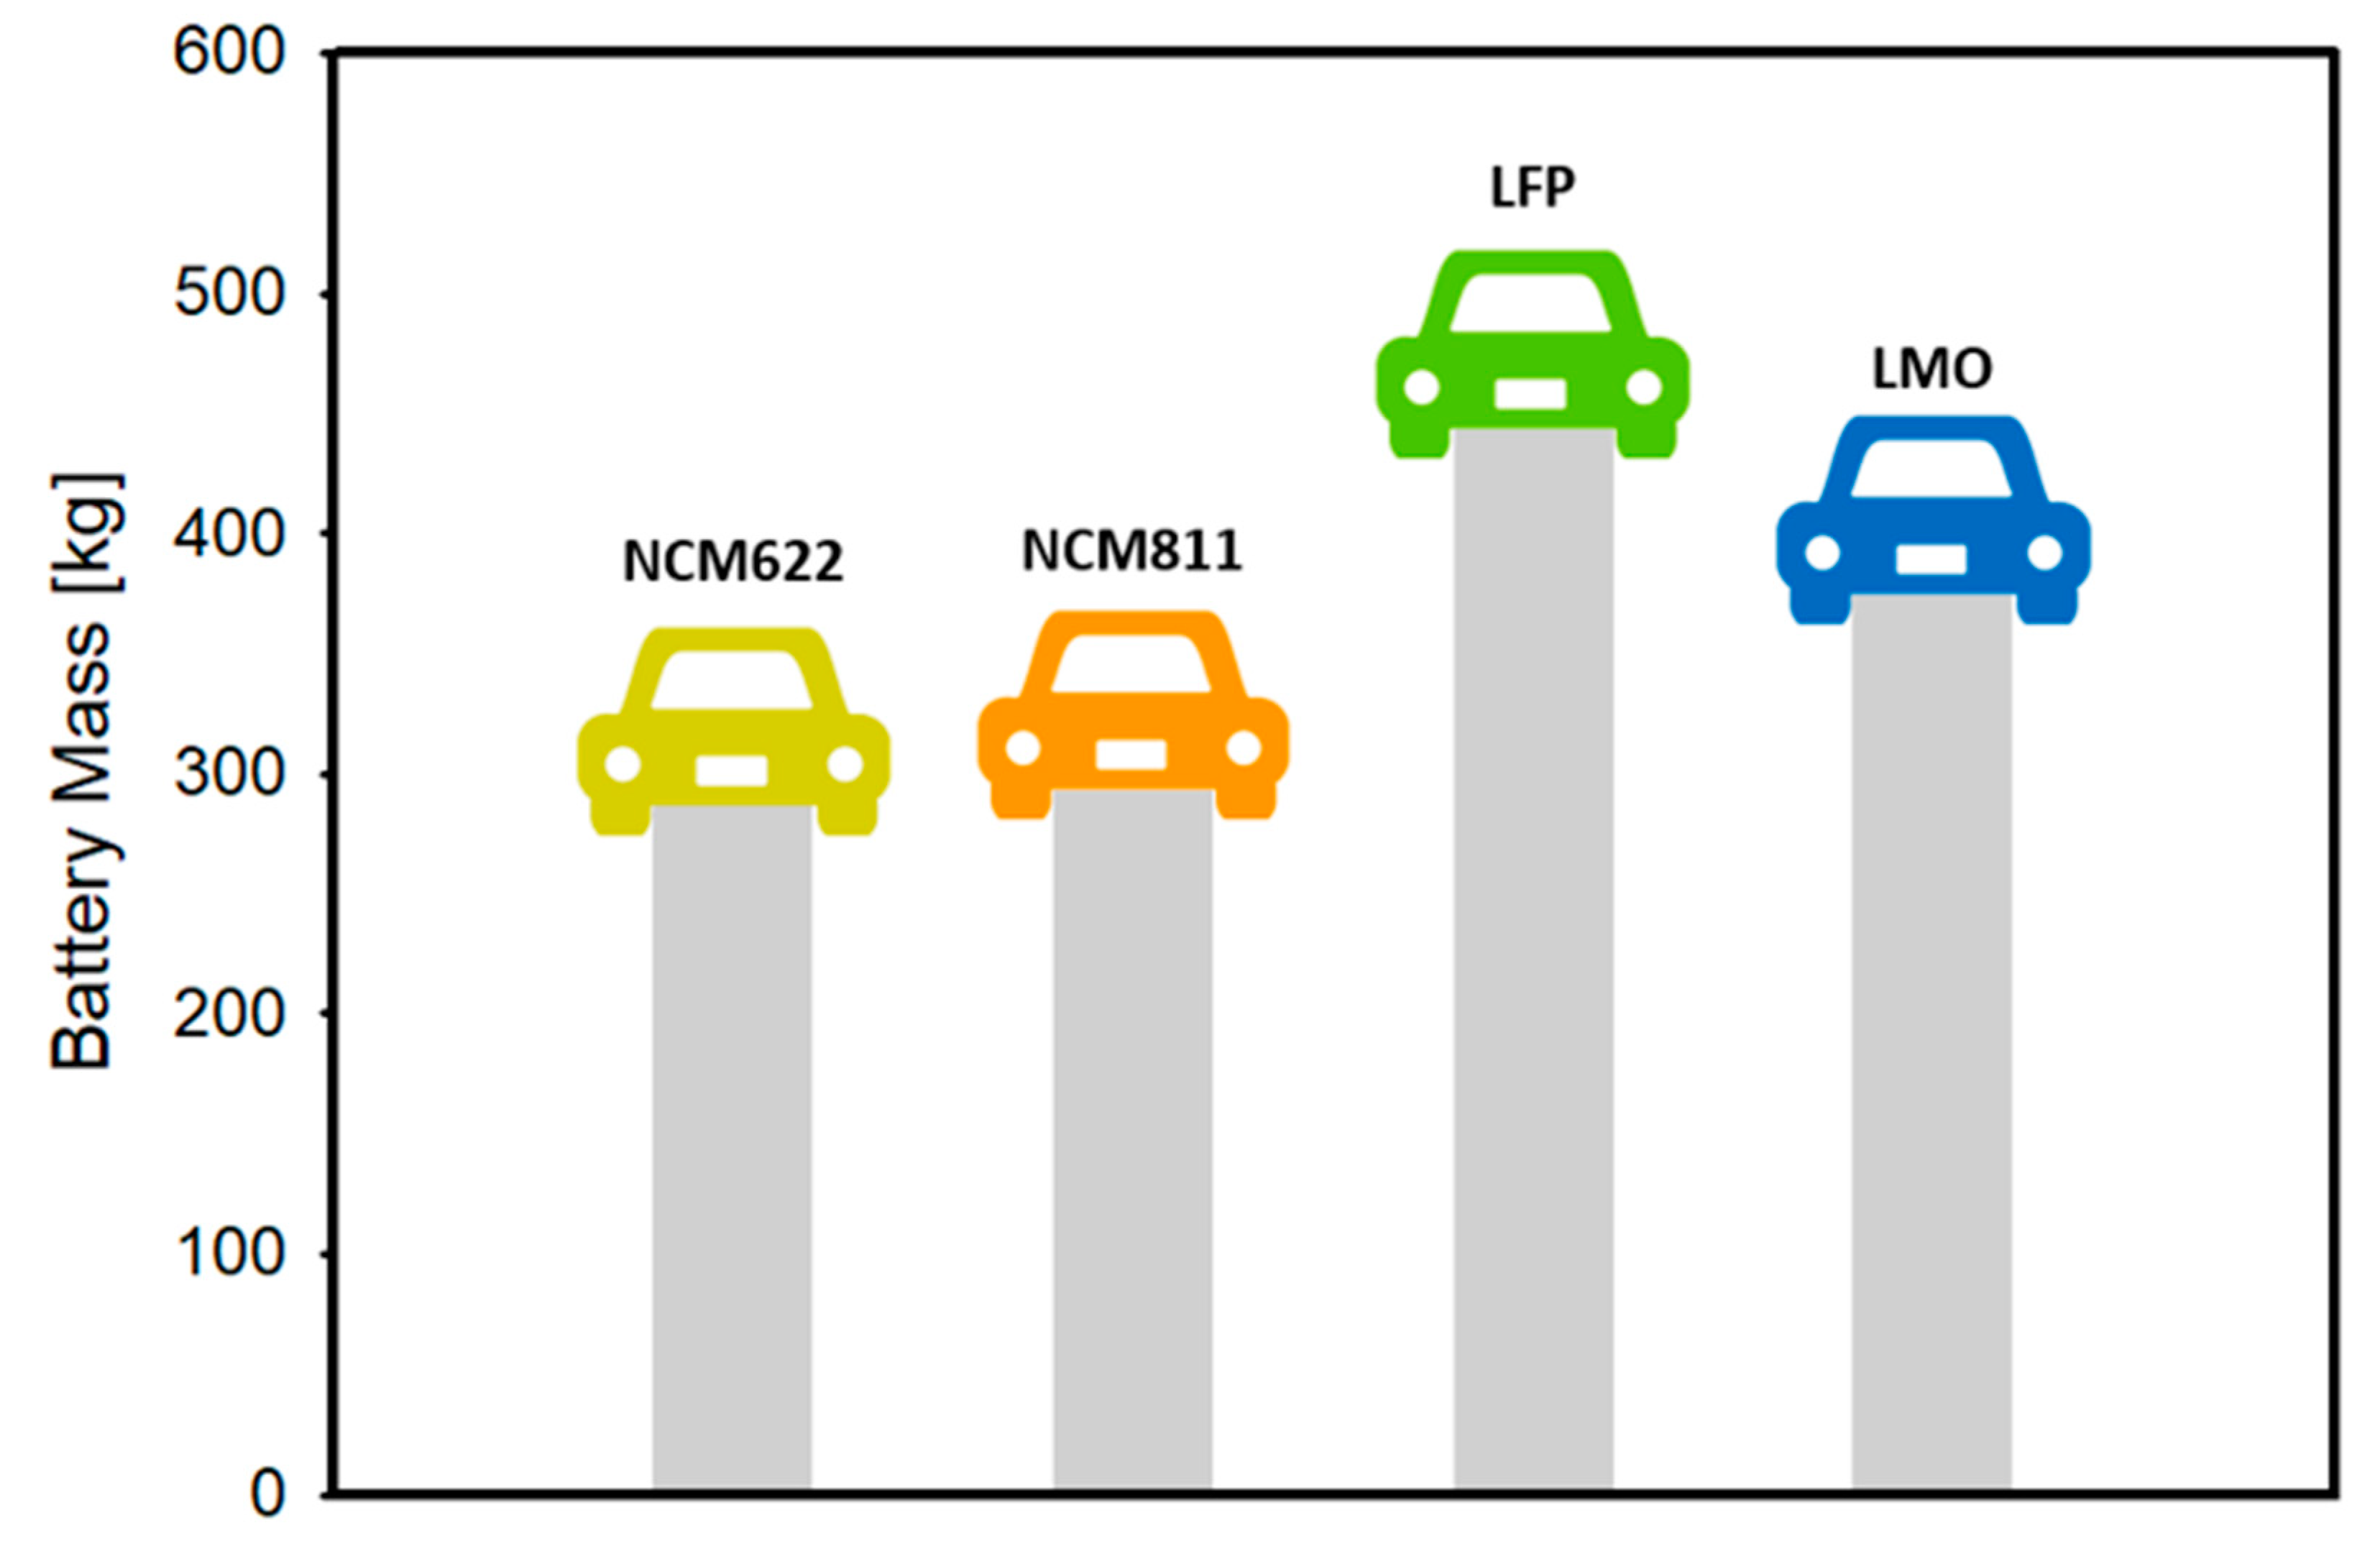
Battery Weight
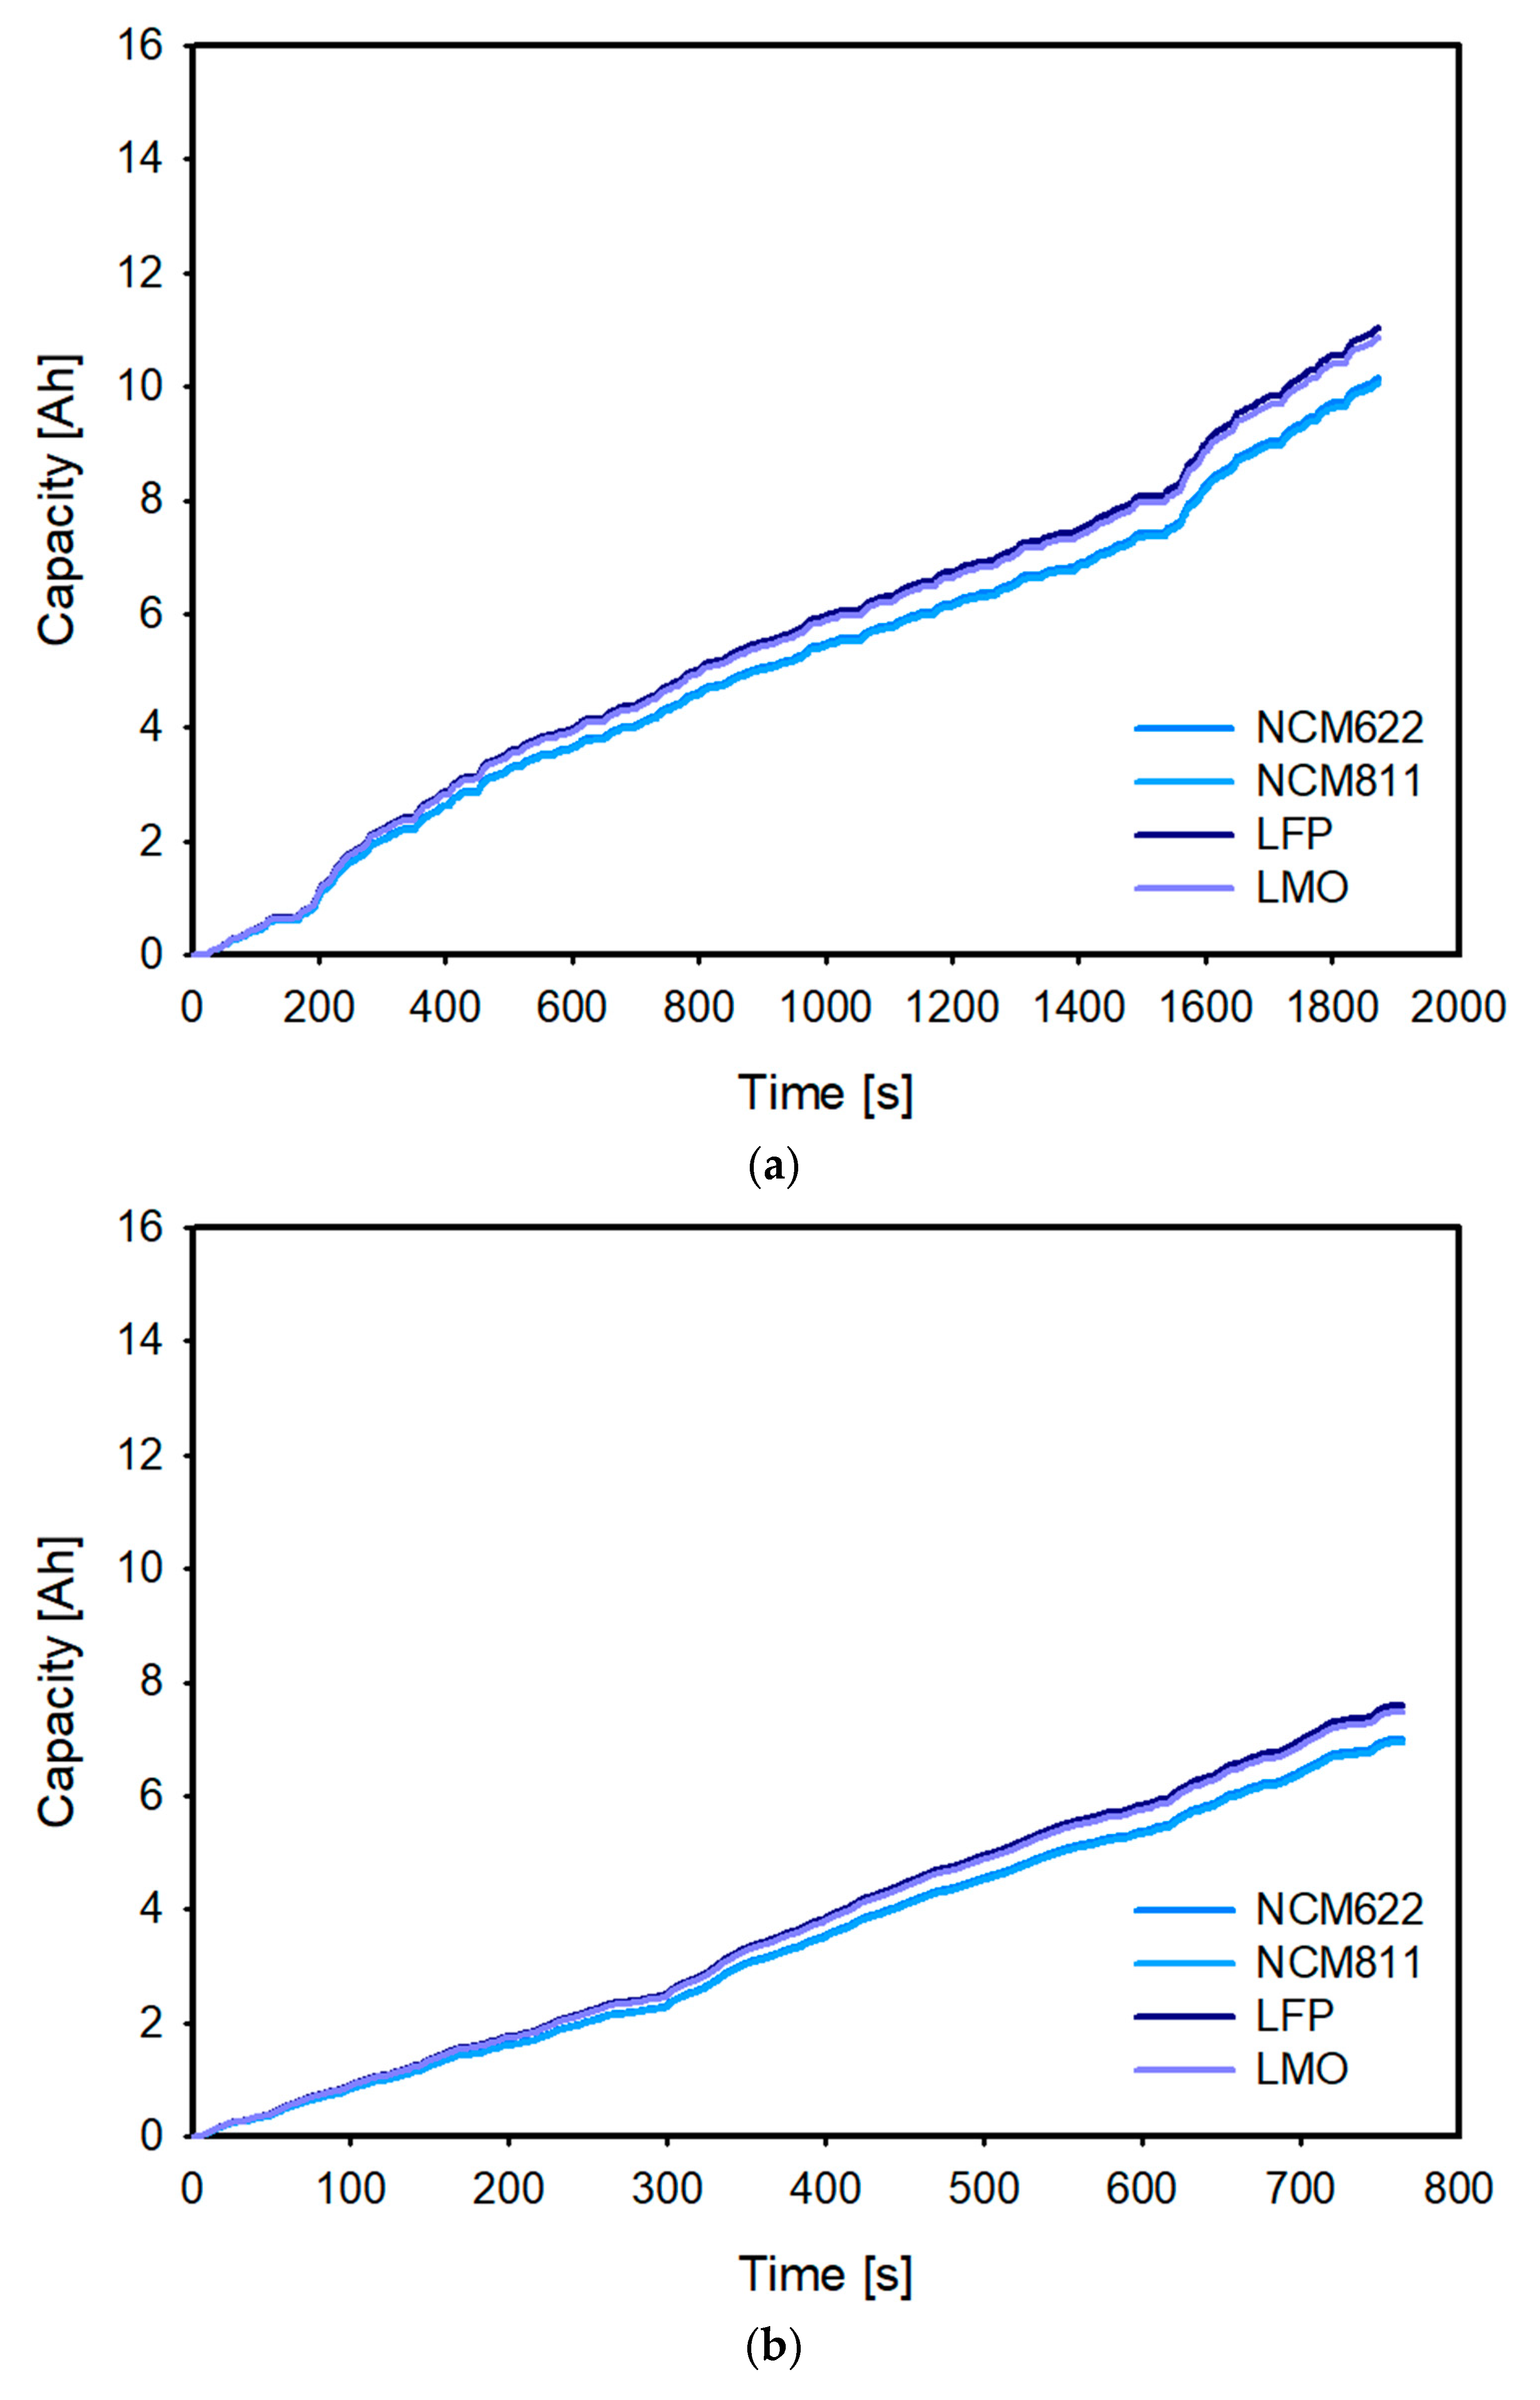
Capacity Loss
3.3. Battery Cell Model: Comparative Analysis of Trends through Experimental and Simulation Results
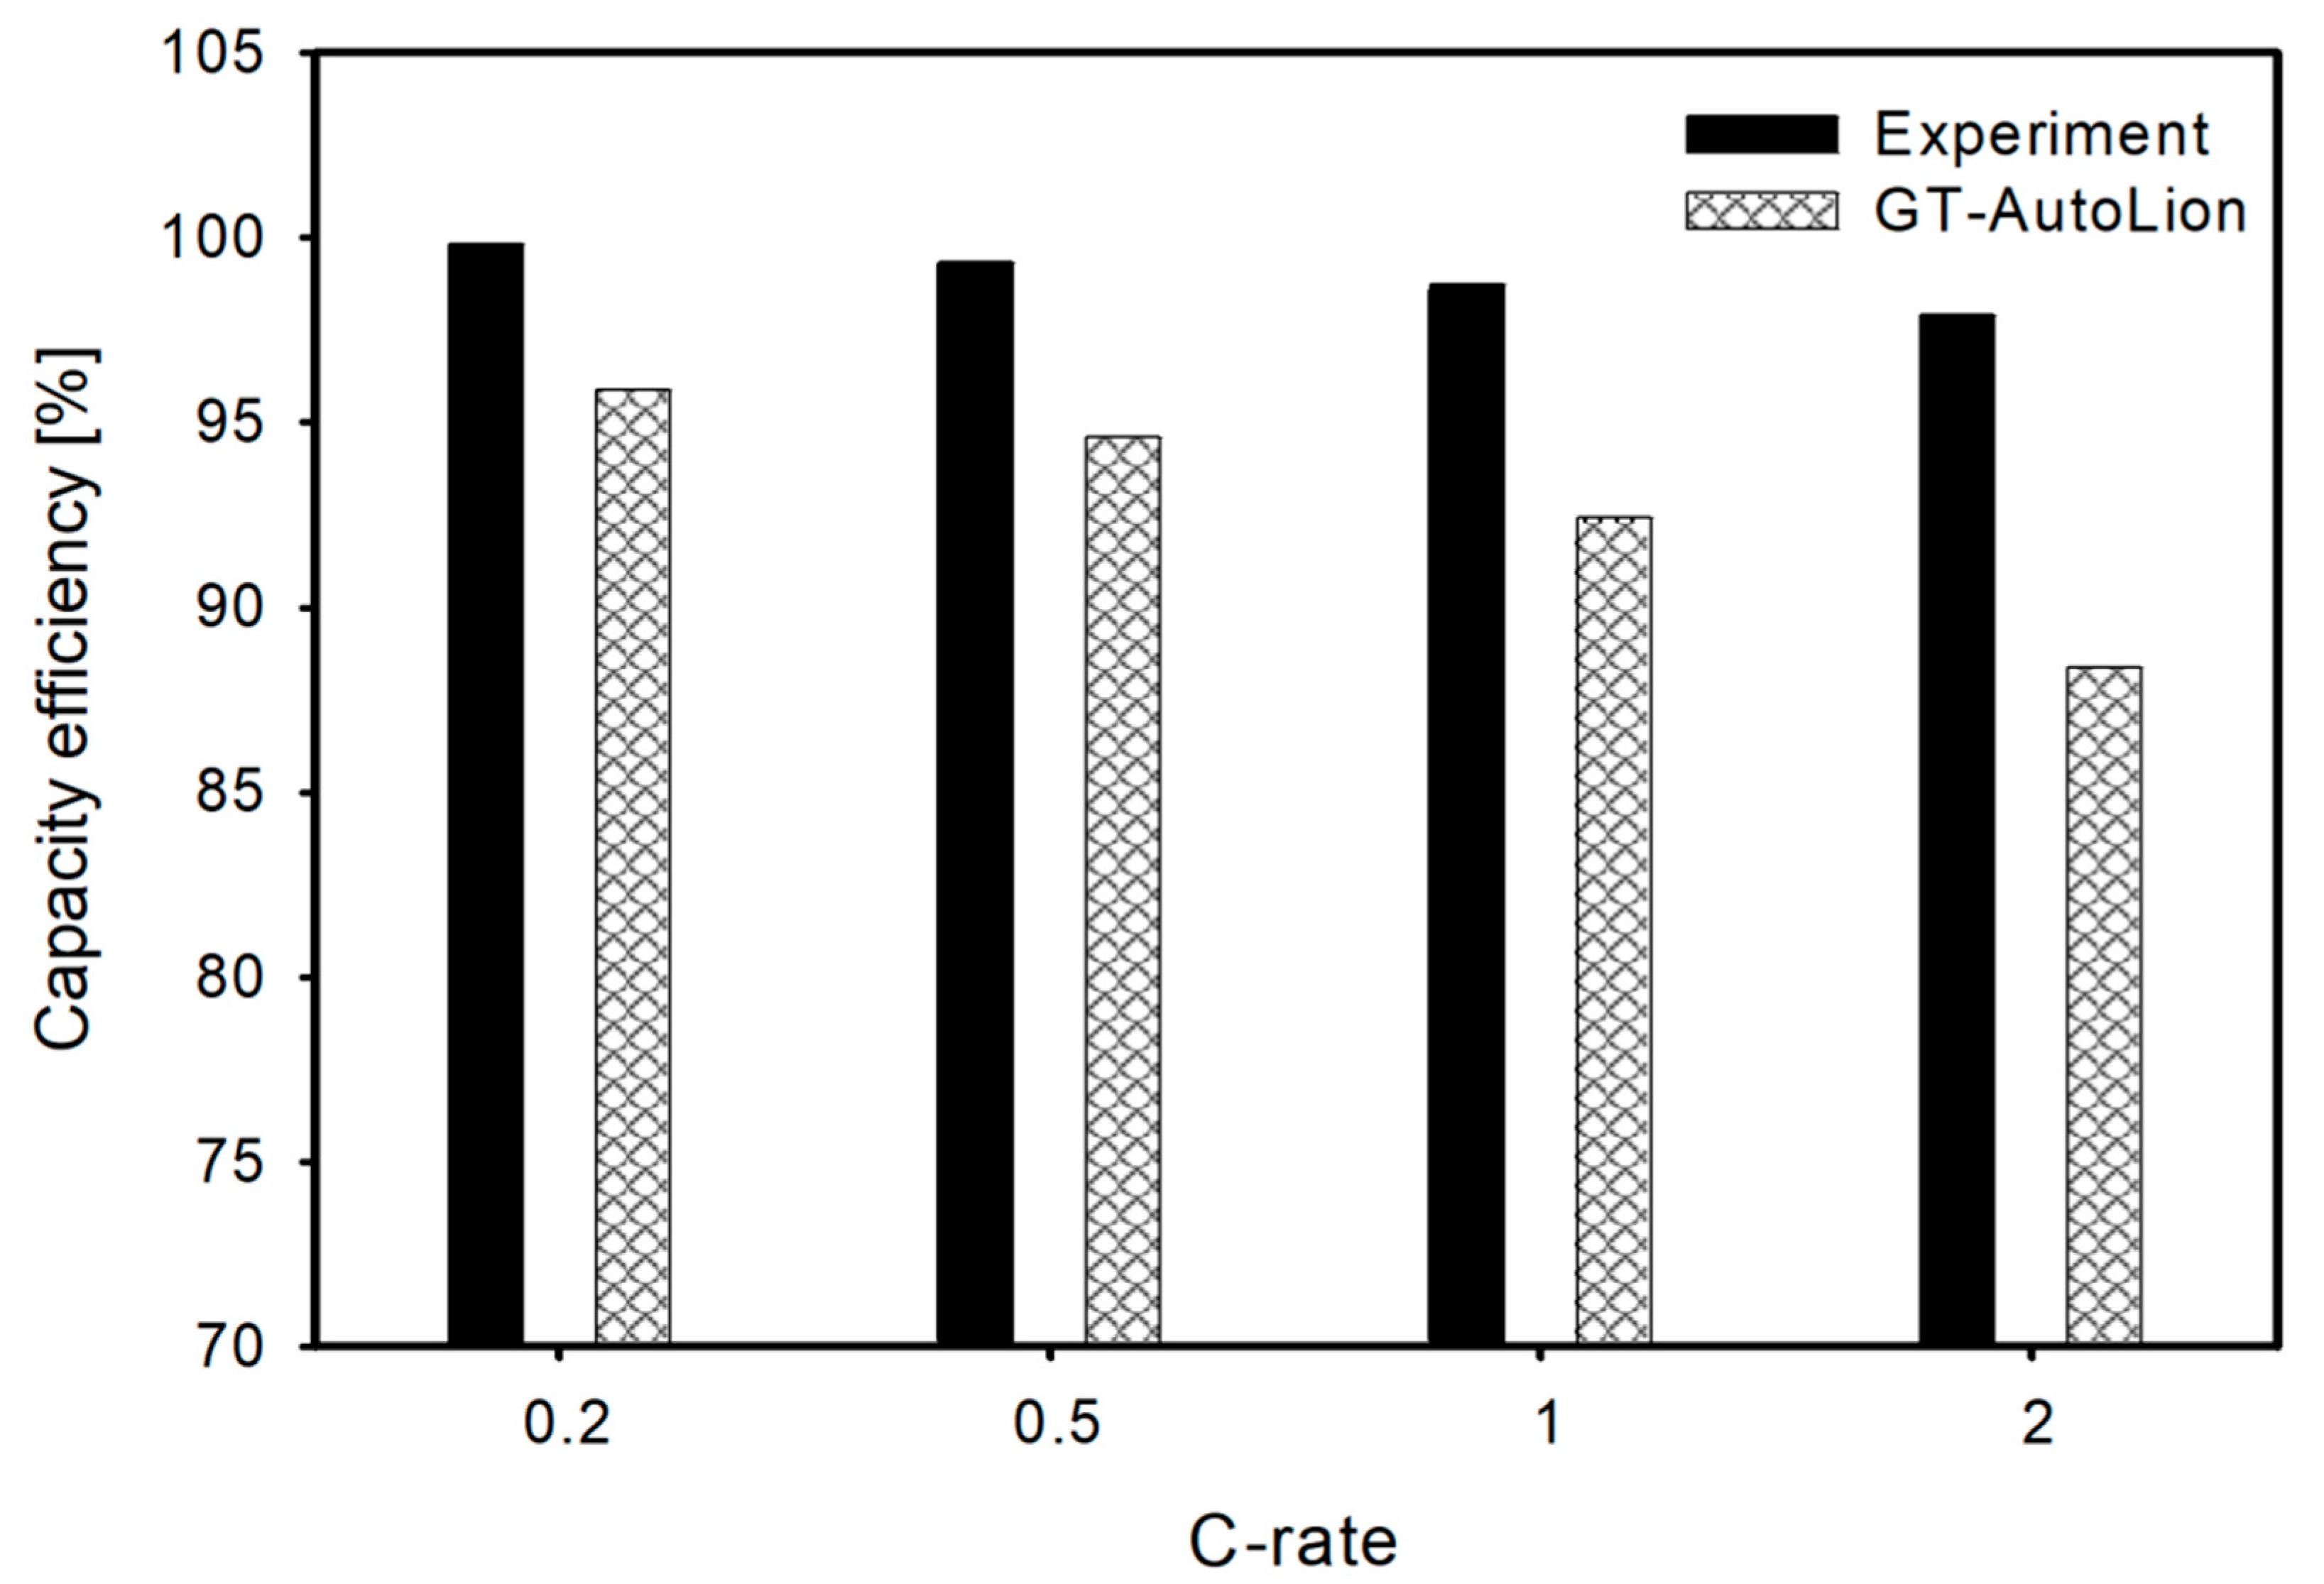
3.3.1. Capacity Loss
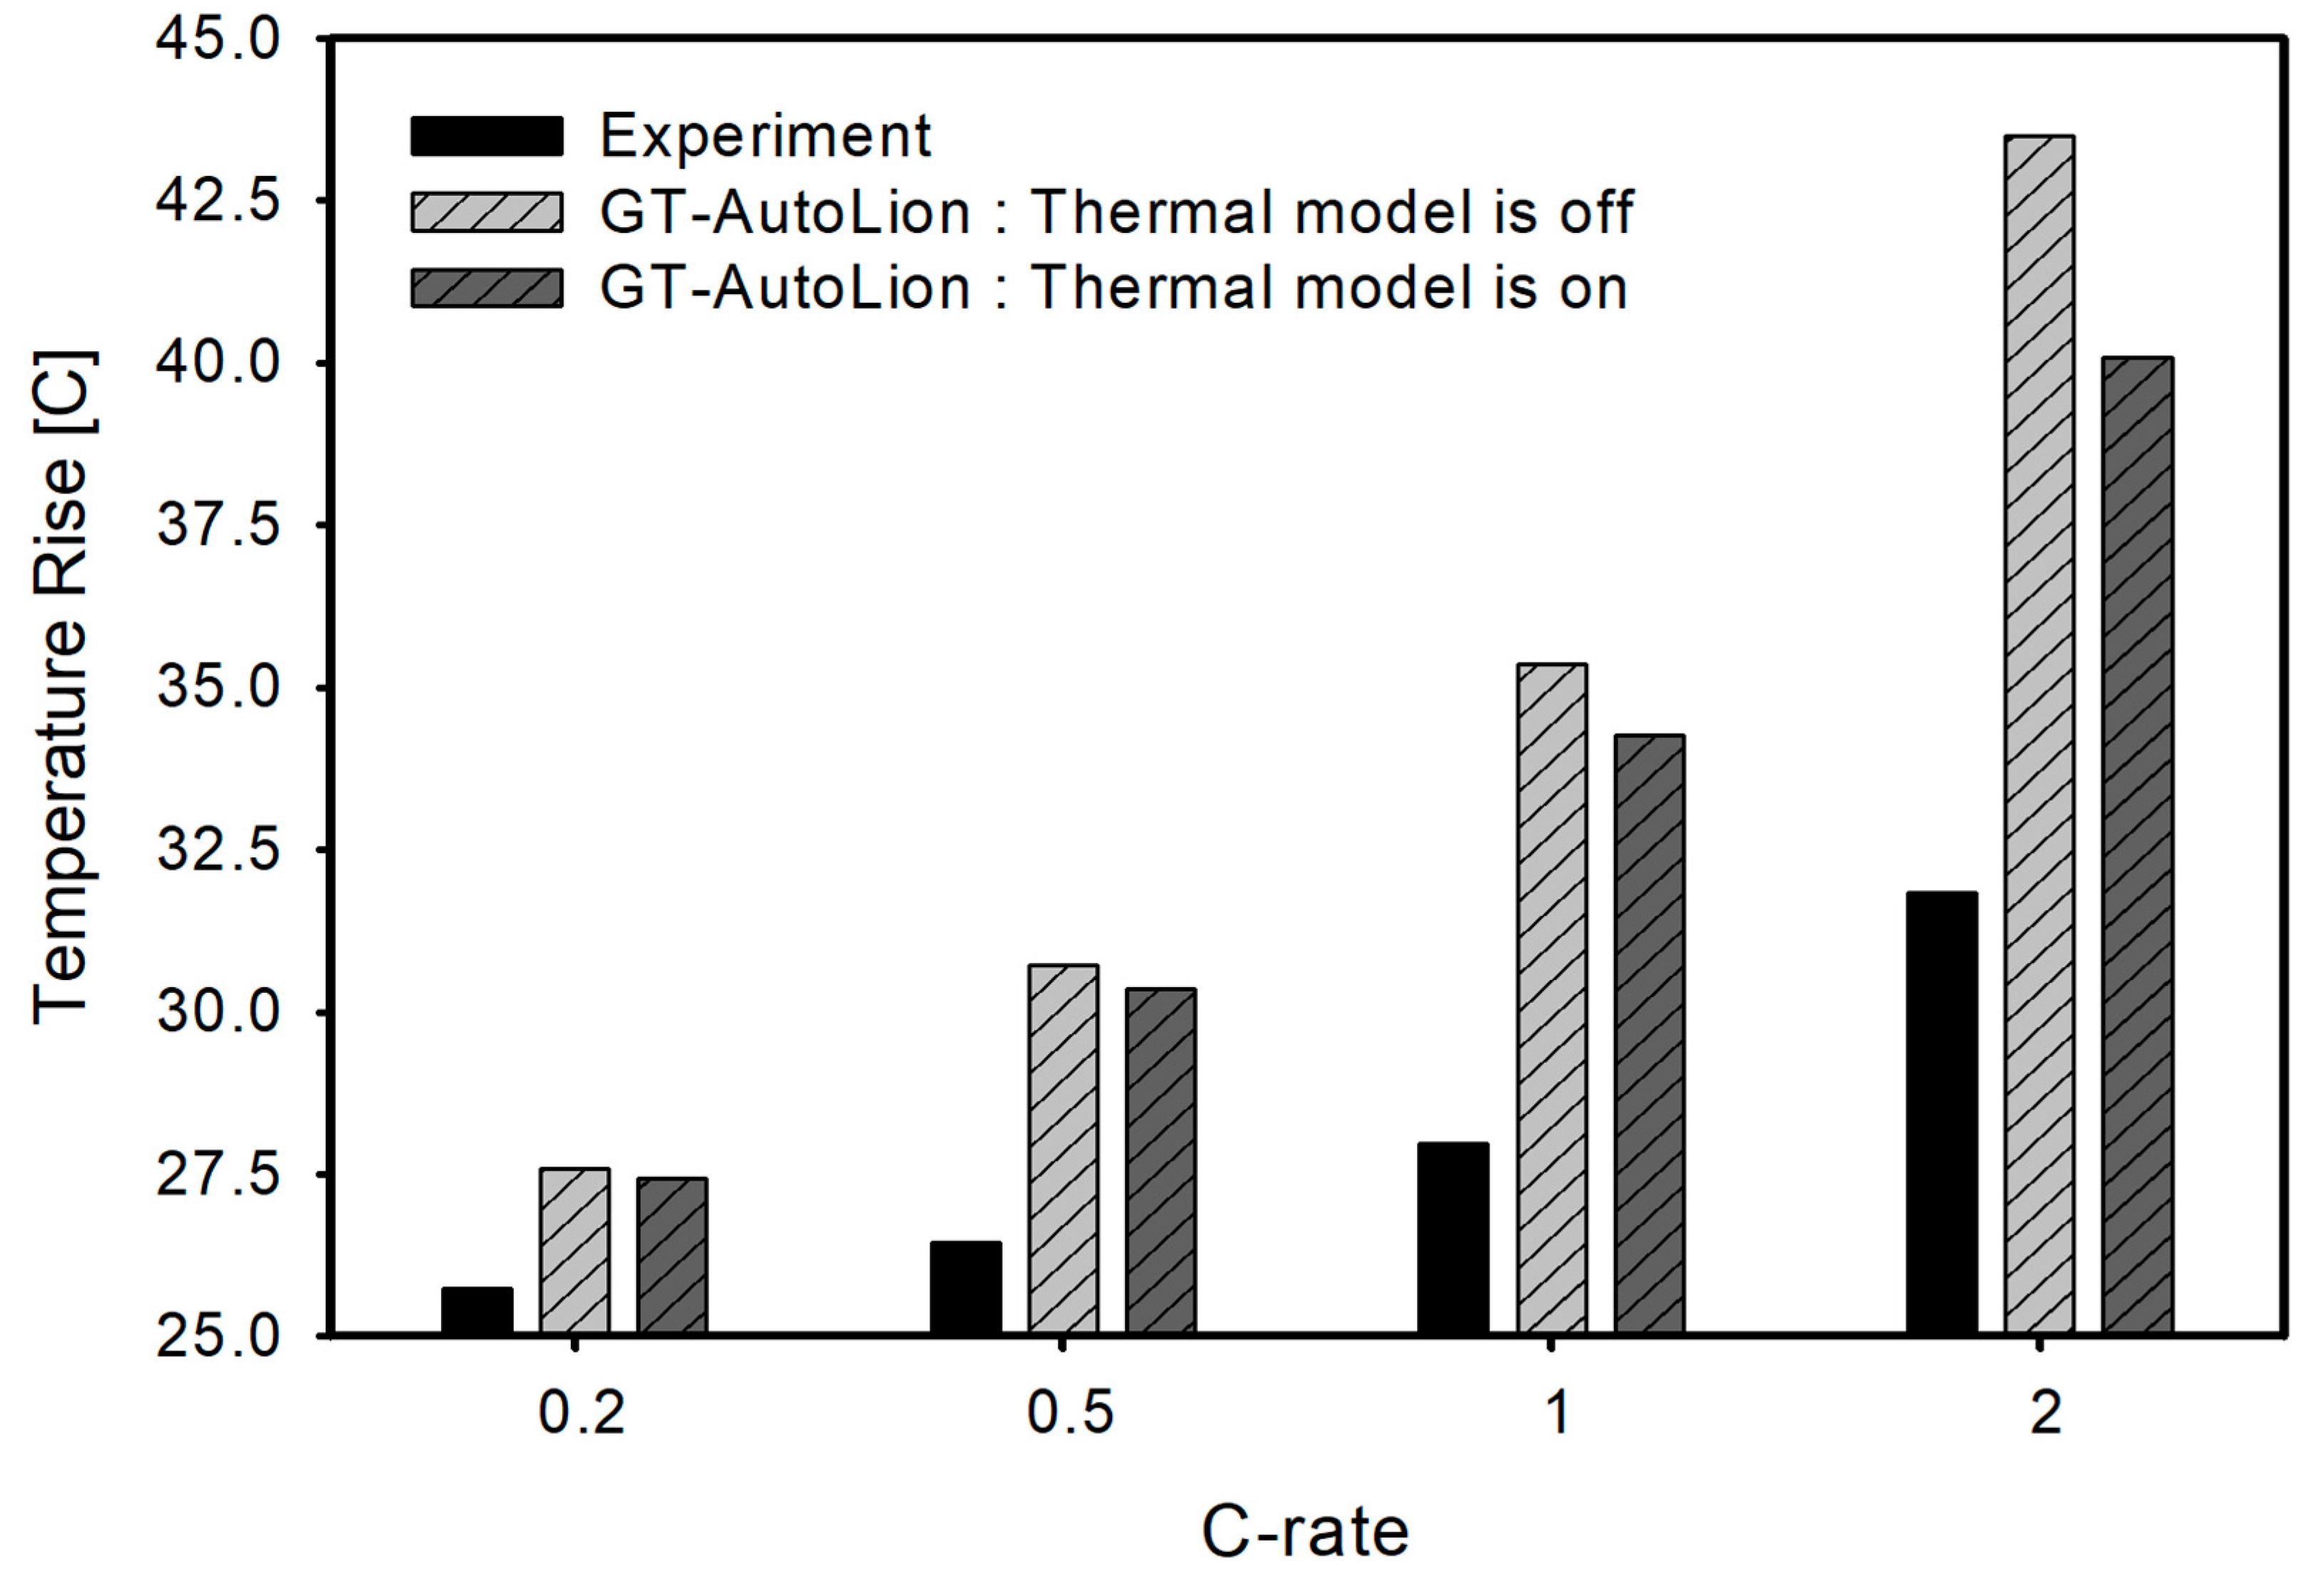
3.3.2. Temperature Change
4. Conclusions and Future Work
- As the C-rate increased, the battery capacity loss and temperature increased, and it was confirmed that the NCM system was more affected by the C-rate than were LFP and LMO. If the safety of an EV is considered first, a higher safety can be secured when LFP, a positive electrode material with excellent thermal characteristics, is applied to a battery, rather than NCM. At room temperature and higher temperatures, LFP and LMO materials showed less capacity loss than did NCM. On the other hand, LFP and LMO materials at low temperatures showed a sharp loss in capacity. This is because NCM is relatively more active in chemical reactions than are LFP and LMO, even at low temperatures. Therefore, it was confirmed that NCM is relatively more stable than LFP and LMO in all temperature regions. Through the cell simulation, as for the state of charge, NCM was excellent, while LFP and LMO were excellent for thermal stability.
- These trends were similar in battery pack and driving cycle transient analysis. However, when considering the weight of the battery in the EV level, NCM is competitive, which is also the reason why NCM is widely used nowadays. Nevertheless, since thermal stability is becoming increasingly important to battery sustainability, hybrid cathode material technology that combines the advantages of each material is needed.
- It can be seen that the battery and EV characteristics with each positive electrode active material can follow the trend without variable tuning. Based on this, complementary studies will be conducted in the future. A cell-by-cell calibration will be performed to access the top-down design. At this time, optimization will be performed by deriving tuning variables that affect thermal stability, SOC maintenance, and vehicle weight.
Author Contributions
Funding
Acknowledgments
Conflicts of Interest
References
- Jiang, L.; Wang, Q.; Sun, J. Electrochemical performance and thermal stability analysis of LiNixCoyMnzO2 cathode based on a composite safety electrolyte. J. Hazard. Mater. 2018, 351, 260–269. [Google Scholar] [CrossRef] [PubMed]
- Zybert, M.; Ronduda, H.; Szczesna, A.; Trzeciak, T.; Ostrowski, A.; Zero, E.; Wieczorek, W.; Rarog-Pilecka, W.; Marcinek, M. Different strategies of introduction of lithium ions into nickel-manganese-cobalt carbonate resulting in LiNi0.6Mn0.2Co0.2O2(NMC622) cathode material for Li-ion batteries. Solid State Ion. 2020, 348, 115273. [Google Scholar] [CrossRef]
- Ma, Z.; Shao, G.; Wang, G.; Zhang, Y.; Du, J. Effects of Nb-doped on the structure and electrochemical performance of LiFePO4/C composites. J. Solid State Chem. 2014, 210, 232–237. [Google Scholar] [CrossRef]
- Liu, Q.; Wang, S.; Tan, H.; Yang, Z.; Zeng, J. Preparation and Doping Mode of Doped LiMn2O4 for Li-Ion Batteries. Energies 2013, 6, 1718–1730. [Google Scholar] [CrossRef]
- Ge, T.; Guo, Z.; Wu, M.; Sun, R.; Li, W.; Yang, G. Preparation and characterization of spinel-layered mixed structural 0.2LiNi0.5Mn1.5O4·0.8Li[Li0.2Ni0.2Mn0.6]O2 as cathode materials for lithium-ion batteries. J. Alloys Compd. 2019, 801, 254–261. [Google Scholar] [CrossRef]
- Ku, L.; Cai, Y.; Ma, Y.; Zheng, H.; Liu, P.; Qiao, Z.; Xie, Q. Enhanced electrochemical performances of layered-spinel heterostructured lithium-rich Li1.2Ni0.13Co0.13Mn0.54O2 cathode materials. Chem. Eng. J. 2019, 370, 499–507. [Google Scholar] [CrossRef]
- Zhao, Y.; Stein, P.; Bai, Y.; Al-Siraj, M.; Yang, Y.; Xu, B.X. A review on modeling of electro-chemo-mechanics in lithium-ion batteries. J. Power Sources 2019, 413, 259–283. [Google Scholar] [CrossRef]
- Ning, F.; Li, S.; Xu, B.; Ouyang, C. Strain tuned Li diffusion in LiCoO2 material for Li ion batteries: A first principles study. Solid State Ion. 2014, 263, 46–48. [Google Scholar] [CrossRef]
- Stein, P.; Xu, B. 3D Isogeometric Analysis of intercalation-induced stresses in Li-ion battery electrode particles. Comput. Methods Appl. Mech. Eng. 2014, 268, 225–244. [Google Scholar] [CrossRef]
- Tealdi, C.; Heath, J.; Islam, M.S. Feeling the strain: Enhancing ionic transport in olivine phosphate cathodes for Li- and Na-ion batteries through strain effects. J. Mater. Chem. A 2016, 4, 6998–7004. [Google Scholar] [CrossRef] [Green Version]
- Salvadori, A.; Mcmeeking, R.; Grazioli, D.; Magri, M. A coupled model of transport-reaction-mechanics with trapping. Part I- small strain analysis. J. Mech. Phys. Solids 2018, 114, 1–30. [Google Scholar] [CrossRef] [Green Version]
- Jia, Z.; Li, T. Stress-modulated driving force for lithiation reaction in hollow nano-anodes. J. Power Sources 2015, 275, 866–876. [Google Scholar] [CrossRef]
- Ji, L.; Guo, Z.; Wu, Y. Computational and Experimental Observation of Li-Ion Concentration Distribution and Diffusion-Induced Stress in Porous Battery Electrodes. Energy Technol. 2017, 5, 1702–1711. [Google Scholar] [CrossRef]
- Chen, C.H.; Liu, J.; Amine, K. Symmetric cell approach and impedance spectroscopy of high power lithium-ion batteries. J. Power Sources 2001, 96, 321–328. [Google Scholar] [CrossRef]
- Park, J.; Lu, W.; Sastry, A.M. Numerical Simulation of Stress Evolution in Lithium Manganese Dioxide Particles due to Coupled Phase Transition and Intercalation. J. Electrochem. Soc. 2011, 158, A201–A206. [Google Scholar] [CrossRef]
- Suthar, B.; Northrop, P.W.C.; Braatz, R.D.; Subramanian, V.R. Optimal Charging Profiles with Minimal Intercalation-Induced Stresses for Lithium-Ion Batteries Using Reformulated Pseudo 2-Dimensional Models. J. Electrochem. Soc. 2014, 161, F3144–F3155. [Google Scholar] [CrossRef]
- Suthar, B.; Northrop, P.W.C.; Rife, D.; Subramanian, V.R. Effect of Porosity, Thickness and Tortuosity on Capacity Fade of Anode. J. Electrochem. Soc. 2015, 162, A1708–A1717. [Google Scholar] [CrossRef] [Green Version]
- Dai, Y.; Cai, L.; White, R.E. Simulation and analysis of stress in a Li-ion battery with a blended LiMn2O4 and LiNi0.8Co0.15Al0.05O2 cathode. J. Power Sources 2014, 247, 365–376. [Google Scholar] [CrossRef]
- Zhao, L.; Zhu, M.T.; Xu, X.M.; Gao, J.K. Thermal runaway characteristics on NCM lithium-ion batteries triggered by local heating under different heat dissipation conditions. Appl. Therm. Eng. 2019, 159, 113847. [Google Scholar]
- An, Z.; Jia, L.; Wei, L.; Yang, C. Numerical modeling and analysis of thermal behavior and Li+ transport characteristic in lithium-ion battery. Int. J. Heat Mass Transf. 2018, 127, 1351–1366. [Google Scholar] [CrossRef]
- Gamma Technologies. GT-AutoLion User Manual; Gamma Technologies: Westmont, IL, USA, 2019. [Google Scholar]
- Butler, K.L.; Ehsani, M.; Kamath, P. A Matlab-Based Modeling and Simulation Package for Electric and Hybrid Electric Vehicle Design. IEEE Trans. Veh. Technol. 1999, 48, 1770–1778. [Google Scholar] [CrossRef]
- Astaneh, M.; Andric, J.; Löfdahl, L.; Maggiolo, D.; Stopp, P.; Moghaddam, M.; Chapuis, M.; Ström, H. Calibration Optimization Methodology for Lithium-Ion Battery Pack Model for Electric Vehicles in Mining Applications. Energies 2020, 13, 3532. [Google Scholar] [CrossRef]
- Wimmer, J.; Papadimitriou, I.; Luo, G. CAE Method for linking electrochemical Lithium-ion models into integrated system-level models of electrified vehicles. SAE Tech. Pap. 2018, 1, 1414. [Google Scholar] [CrossRef]
- Sripad, S.; Viswanathan, V. Evaluation of Current, Future, and Beyond Li-Ion Batteries for the Electrification of Light Commercial Vehicles: Challenges and Opportunities. J. Electrochem. Soc. 2017, 164, E3635–E3646. [Google Scholar] [CrossRef]
- Saw, L.H.; Ye, Y.; Tay, A.A.O. Electrochemical–thermal analysis of 18650 Lithium Iron Phosphate cell. Energy Convers. Manag. 2013, 75, 162–174. [Google Scholar] [CrossRef]
- Yuan, Q.; Zhao, F.; Wang, W.; Zhao, Y.; Liang, Z.; Yan, D. Overcharge failure investigation of lithium-ion batteries. Electrochimica Acta 2015, 178, 682–688. [Google Scholar] [CrossRef]
- Jaguemont, J.; Boulon, L.; Dube, Y. A comprehensive review of lithium-ion batteries used in hybrid and electric vehicles at cold temperatures. Appl. Energy 2016, 164, 99–114. [Google Scholar] [CrossRef]
- Zhang, G.; Cao, L.; Ge, S.; Wang, C.Y.; Shaffer, C.E.; Rahn, C.D. In Situ Measurement of Radial Temperature Distributions in Cylindrical Li-Ion Cells. J. Electrochem. Soc. 2014, 161, A1499–A1507. [Google Scholar] [CrossRef] [Green Version]


| Cell Discretization | Number of Elements |
|---|---|
| Positive electrode | 6 |
| Separator | 4 |
| Negative electrode | 6 |
| Positive electrode particle | 12 |
| Negative electrode particle | 12 |
| Positive Electrode | Negative Electrode | ||
|---|---|---|---|
| Foil | Foil | ||
| Material | Aluminum | Material | Copper |
| Thickness | 15 μm | Thickness | 8 μm |
| Active Material | Active Material | ||
| Material | NCM/LFPO/LMO | Material | Graphite |
| Density | 4.8/3.6/4.28 g/cm3 | Density | 2.24 g/cm3 |
| Weight Percentage | 94% | Weight Percentage | 94% |
| Conductive Agent | Conductive Agent | ||
| Material | Carbon | Material | Carbon |
| Weight Percentage | 3% | Weight Percentage | 3% |
| Binder | Binder | ||
| Material | PVdF | Material | PVdF |
| Weight Percentage | 3% | Weight Percentage | 3% |
| Type | Cylindrical |
|---|---|
| Diameter | 18 mm |
| Height | 65 mm |
| Positive electrode active material | NCM622/NCM811/LFP/LMO |
| Negative electrode active material | Graphite |
| Capacity | 2.2/2.1/1.4/1.5 Ah |
| Discharge cutoff voltage | 2.5 V |
| Charge cutoff voltage | 4.2/4.2/3.65/4.2 V |
| Positive Electrode Active Material | Number of Cells in Series | Number of Cells in Parallel |
|---|---|---|
| NCM622 | 100 | 70 |
| NCM811 | 99 | 73 |
| LFP | 108 | 110 |
| LMO | 91 | 103 |
| Vehicle Mass | 1600 kg |
|---|---|
| Vehicle Drag Coefficient | 0.21 |
| Vehicle Frontal Area | 1.95 m2 |
| Tire Specification | 215/50R17 |
| Battery Pack Energy | 55 kWh |
| Final Drive Ratio | 7.05 |
| Traction Motor Maximum Brake Torque | 360 Nm |
| Traction Motor Maximum Efficiency | 97% |
| Traction Motor Maximum Torque (Continuous) | 300 Nm |
| Traction Motor Maximum Power | 150 kW @ 4000 RPM |
Publisher’s Note: MDPI stays neutral with regard to jurisdictional claims in published maps and institutional affiliations. |
© 2020 by the authors. Licensee MDPI, Basel, Switzerland. This article is an open access article distributed under the terms and conditions of the Creative Commons Attribution (CC BY) license (http://creativecommons.org/licenses/by/4.0/).
Share and Cite
Choi, H.; Lim, N.-g.; Lee, S.J.; Park, J. Feasibility Study for Sustainable Use of Lithium-Ion Batteries Considering Different Positive Electrode Active Materials under Various Driving Cycles by Using Cell to Electric Vehicle (EV) Simulation. Sustainability 2020, 12, 9764. https://0-doi-org.brum.beds.ac.uk/10.3390/su12229764
Choi H, Lim N-g, Lee SJ, Park J. Feasibility Study for Sustainable Use of Lithium-Ion Batteries Considering Different Positive Electrode Active Materials under Various Driving Cycles by Using Cell to Electric Vehicle (EV) Simulation. Sustainability. 2020; 12(22):9764. https://0-doi-org.brum.beds.ac.uk/10.3390/su12229764
Chicago/Turabian StyleChoi, Heewon, Nam-gyu Lim, Seong Jun Lee, and Jungsoo Park. 2020. "Feasibility Study for Sustainable Use of Lithium-Ion Batteries Considering Different Positive Electrode Active Materials under Various Driving Cycles by Using Cell to Electric Vehicle (EV) Simulation" Sustainability 12, no. 22: 9764. https://0-doi-org.brum.beds.ac.uk/10.3390/su12229764