1. Introduction
Sustainable indoor comfort is generally understood as thermal comfort with aspects of humidity comfort, sometimes with air quality as well. Noise and vibration are often neglected during sustainable comfort measurements [
1]. Meanwhile, the EU Environmental Noise Directive of 2002 specifically addresses the prevention of environmental noise pollution [
2]. The directive applies to noise to which humans are exposed, particularly in built-up areas. In 2008, the directive was extended to apply to vibration treated as pollution [
3]. In the directive [
3], direct or the indirect influence of vibration, heat or noise in air, water, or the soil are considered pollution. Despite the directive [
3], both stimuli noise and vibration are not combined together in the context of sustainable indoor comfort. International and national standards mostly treat these factors separately [
4,
5,
6,
7,
8,
9,
10,
11]. Lately, there has been an observable a trend to connect these factors into one vibro-acoustic stimulus [
12,
13,
14,
15,
16,
17,
18,
19,
20]. This appears to be a good direction, because, in most cases when vibration appears, noise appears as well [
21]. This paper includes a proposal of in situ tests and a sustainable comfort evaluation method. Combining different stimuli into a single comfort evaluation method is significant in providing a sustainable approach to the evaluation of the existing state of buildings and during the design process [
22]. The novel element proposed in this paper is an evaluation of comfort using total annoyance from noise and vibration combined. Current practice considers each stimulus separately for evaluation. The work presented in [
12,
13,
14,
15,
16,
17,
18,
19,
20] provides the basis to create novel approach (annoyance levels) to quantitative comfort evaluation presented in this paper. The question stated in this paper is can considering two stimuli together significantly increase the annoyance under assessment in relation to evaluating the relevant stimuli independently?
In this article we are talking about vibroacoustic comfort, which is one part of total comfort. The comfort in the individual room depends on many aspects like for example thermal comfort, humidity, indoor air quality, but one of the aspects especially in buildings located near to dynamic sources like railway, tramway, etc. is vibroacoustic annoyance (discomfort could be dominant).
There are plenty of evaluation methods of acoustic and vibration comfort. Regarding this, noise comfort equivalent sound level (LAeq), Noise Criteria (NC) [
23], Balanced Noise Criteria (NCB) [
24] and Room Criteria [
25] could be considered. These factors are widely used either in the design process for providing satisfactory background noise in interior spaces, or as methods of assigning a single-number rating to a measured noise background.
The most popular method in vibration comfort is RMS method (root mean squared) [
4,
5,
6,
7,
9,
10]. This evaluation method is even called the basic method [
10] while VDV (vibration dose value) and MTTV (maximum transient vibration value) are additional ones. In the last fifteen years the VDV method is becoming more and more popular since it takes into account the time of exposure to vibrations directly, not through factors. An additional advantage is that this method is used in both noise and vibration assessment. That is why VDV method was chosen for the evaluation of human perception in this paper.
In this paper, the sound and vibration source is transient (train passing by). In order to reasonably evaluate effects of a train passing by, proper metrics should be applied. For the purpose of noise evaluation, sound exposure level (SEL) [
26] sometimes with L
Aeq [
27] was chosen.
The main reason why SEL is used is the fact that the test performed on individuals by Howarth and Griffin [
12], which is the basis for annoyance levels idea, is done with vibration dose value (VDV) and sound exposure level (SEL). In this paper this approach is continued. The main novelties in this paper are the annoyance levels and threshold levels of annoyance corresponding to the method of vibro-acoustic comfort evaluation.
1.1. Historical Review
The first mentions of vibration which could cause damages appeared already in the second half of the nineteenth century in a book was published in Manchester by the British Association [
28]. The author mentioned that some typologies of brake systems generated vibrations in train coaches and induced engine damage. However, it was in the USA in 1883 that noise and vibration were first discussed as a nuisance together [
29].
The concept of vibration and/or noise perception appeared as early as the beginning of the twentieth century. In 1907, a paper on the legal aspect of noise was published [
30], while two papers on this subject appeared in 1917 [
31,
32]. Vibration was also discussed in [
31], specifically on how concrete can dampen vibrations. In the second article [
32] we can find first problems arising with noise in residential buildings. As a consequence, in the 1930s, a substantial collection of patents, regarding systems and materials to reduce vibration in buildings and vehicles was registered worldwide, probably also due to the contemporaneous development of the synthetic rubber and fully synthetic thermoplastic materials industry.
The first evaluation criteria appeared in the early 1930s when Reiher and Meister published their human response criteria [
33]. They were based on experimental studies conducted on ten men between twenty and thirty years of age and subjected to harmonic extortion using a shaking table. It is also worth noting that Jacob Pieter Den Hartog, professor of mechanical engineering at MIT, published
Mechanical Vibrations [
34] around the same time. The first scales proposed by Reiher and Meister were based on flawed assumptions as they did not account for damping. This was addressed by Lenzen [
35]. Lenzen noted that if vibrations are damped within five cycles, a person can feel the initial shock. However, if damped vibrations last twelve cycles or more, their perceptibility can be comparable to steady-state vibrations. As a result of his research, Lenzen proposed a significant change to the Reiher–Meister scales, multiplying them by an indicator of 10, resulting in modified Reiher–Meister scales.
There were some groundbreaking moments in the development of studies on human perception during the twentieth century. They included the formulation of the Wiss and Parmelee empirical formula [
36] that became the basis for a procedure included in an ISO standard from 1974 [
9]. The procedure in this first edition of the ISO standard was hardly precise. It included a number of human vibration perception levels, from imperceptible to comfortless (from level 1 to 5). This standard was not very useful, which is why a second edition ISO standard appeared in the mid-1980s [
10]. The evaluation method included in this edition continues to be used in numerous studies and forms the basis of many national standards of human vibration perception. This method, called the Root Mean Squared method (RMS), is the result of research conducted by Irwin [
37]. This is the main procedure for determining human vibration perception.
Over many years, researchers like Griffin, Howarth, and Mansfield analyzed different physical quantities (acceleration and velocity), assessment methods (the running RMS method, the RMS method and the fourth power vibration dose method) and different frequency weighting curves, and evaluated human body comfort. They proposed the vibration dose value (VDV) evaluation method, which is more sensitive to peaks in recorded signals than the RMS method. It is worth noting that the VDV method fully accounts for vibration exposure time. This method is the only one to be included in the British standard of human vibration exposure [
4]. In the latest version of the ISO standard [
38], there is also another assessment method: the running RMS method and the associated maximum transient vibration value (MTVV), but it is not as popular as the RMS or the VDV method.
In first years of the twenty-first century, Haoa published an experimental in situ study [
39], in which he discussed the effects of traffic-induced ground motions on the safety of building structures adjacent to busy roadways, on humans and on normal operations of sensitive equipment housed in those buildings. A recent study and analysis of vibration perception threshold in laboratory conditions can be found in [
40]. In this paper, a useful method of evaluating annoyance was proposed. The authors of [
13] presented a review of previous studies on the human perception of vibration and tolerance thresholds to wind-induced tall building vibrations. Another more recent study was presented in [
14]. In this paper, the authors quantified the amplitudes and frequency content of vibration level measured indoors at the foundation slab and compared them with outdoor measurements. It was found that in the case of surface, train-induced building vibrations, outdoor vibration levels can conservatively be used in the design of buildings. However, due to inconsistencies in observations, a similar conclusion was not drawn for subway-induced building vibrations.
1.2. Perception of Combined Vibro-Acoustic Effects
The idea of simultaneous exposure was developed further in the latest studies [
15,
16,
17,
18,
19]. The results reported in [
15] suggest that there is a relationship between vibrations and railway noise, or at least between subjects’ perception and the noise itself. This was further confirmed by an even stronger relationship between the personal perception of vibration intensity and living in upper-story apartments. In [
16], six socio-acoustic surveys, conducted over the past 20 years in Japan, were used to perform an analysis using logistic regression. The analysis was used to investigate the combined effects of vibration exposure on noise annoyance and noise exposure on vibration annoyance. The study concluded that significant increases of noise and vibration on vibration and noise annoyances confirmed the simultaneous effects of both exposures on annoyance. In [
17], the presented analysis compared the annoyance from vibration and noise from railway traffic. The presence of vibration was reported to have an impact on noise annoyance, but the presence of noise seems to have less impact on annoyance from vibration. In [
18], an association between workplace noise, vibration exposure and insomnia were suggested. From a public health viewpoint, it is important to address problems affecting employee sleep quality as it negatively impacts their health, quality of life, and workplace performance. Still, the cross terms between noise and vibration exposure must be quantified. The study presented in [
19] analyzed a dominant noise and vibration source (a nearby construction site) and its impact on a residential building. The impact of noise was found to be much higher than the impact of vibrations. The proposed dose–response relationship curves correlated objectively measured noise levels and subjective resident responses well. It was concluded that the proposed dose–response relationship can be applied in a similar community environment to evaluate noise annoyance among residents. Resident noise annoyance can be determined based on corresponding noise levels.
International standards and several national laws stipulate methods, thresholds, and limits to quantify and/or to evaluate the effect of vibration in buildings in terms of human perception. As recognized by Griffin in [
20], “comfort”, or “a conscious well-being”, within a building merely requires the absence of ”perceptible” vibration for most of the time’. In general terms, this means that a scientific criterion for quantifying a “subjective response” to vibration can be found. One example is the definition of the lower limits of human perception. The human vibration perception threshold can be determined experimentally and based on consistent statistical analysis. As shown in this paper, in the literature and relevant standards, the perception of vibration in buildings has been analyzed and studied in depth over the past decades. On the other hand, as suggested by Griffin and other authors, the main “discomfort” experienced in buildings seems to be related to a combined effect of noise and vibration. As a matter of fact, noise and vibration occur simultaneously in buildings and, even if the acoustical or vibrational thresholds meet legal or standard limits, their inhabitants nevertheless report annoyance. This is why new human vibro-acoustic perception criteria were proposed in this paper, as based on Griffin’s second paper [
12]. These criteria were investigated during in-situ measurements.
2. Methodology
2.1. General Methodology
The performance of two levels of evaluation has been presented in this paper. These include: the evaluation of mechanical vibration as an exposure to a single stimulus and an evaluation of mechanical vibration with accompanying noise as a combined effect of exposure to two stimuli.
The measurement equipment requirements and evaluation of vibration comfort complied with [
5] and followed the VDV method. This method was chosen because of its compatibility with vibration and noise. The measurement method and equipment requirements concerning ground-borne noise complied with [
7]. The evaluation of ground-borne noise was not performed for a separate value but was assessed together with vibration. For this purpose, the authors used single-incident sound exposure level (SEL) and predicted SEL in given time period.
No exact definition of a single event is provided in either [
5] or [
7]. It is only defined as the passing by of a train. An exact definition of a single event duration time had to be defined for the purposes of this study. We adopted the following definition: a single event duration was assumed to be equal to the time during which the amplitude values of the motion parameter under evaluation (vibration acceleration) are greater than 0.2 of their maximum value.
The evaluation of exposure to two simultaneous stimuli was performed based on [
12] and an annoyance level was introduced. The graphical representation of annoyance level shall be presented in
Figure 1. The following formulas were used to calculate annoyance level from noise
ψn, from vibration
ψv and the total annoyance level
ψtot.
It is worth underlining the fact that summation of annoyance level given in Equation (3) was not taken directly from [
12]. This stems from the fact that the summation, as proposed in [
12], did not feature reasonable values for extreme VDV and SEL values, i.e., highly annoying SEL values were paired with barely annoying VDVs. Equation (3) solves this problem. There is also only a small error (below 0.5) between the proposed Equation (3) and the summation of stimuli annoyance as presented in [
12], when SEL and VDV annoyance are equal.
The introduction of annoyance levels to comfort evaluation can aid in demonstrating the influence of ground-borne noise from vibrating room partitions. It estimates the relative importance of noise and vibration. Radiated noise may increase total annoyance caused by the passage of trains due to exposure not only to vibrations, but also to ground-borne noise.
Annoyance levels are only assessed for single events in general, stemming directly from the methodology presented in [
12]. In this paper, annoyance level is calculated for single events, following the initial purpose of Formulas (1)–(3). To extend the range of analysis, we applied the method to time periods—daytime (6 a.m. to 10 p.m.) and night-time (10 p.m. to 6 a.m.)—which consisted of multiple events.
To quantitatively estimate the influence of ground-borne noise, the following method was applied. First, the calculation of single-stimulus annoyance level was performed (Formulas (1) and (2)). Afterwards, we calculated the total annoyance level for both stimuli using Formula (3). To provide a quantity estimation of the influence of ground-borne noise, formula
ψtot was assumed to become
ψv and Formula (2) was inverted to calculate the equivalent VDV (Formula (4)). The percentage increase of equivalent VDV as compared with VDV as measured shows an estimation of the influence of ground-borne noise.
Algorithm for general methodology presented in this article is shown in
Figure 2.
For the purposes of this article, a questionnaire was conducted to answer two problems raised in this paper. The questionnaire consisted of two parts: dominant stimulus and general annoyance. The questionnaires were sent to residents of the analyzed room. Eight people took part in the questionnaire—4 residents and 4 neighbors. Each person had to observe 5 cargo trains and 5 passenger trains. Each person made 10 observations which gives 80 observations in total.
In the part related to the domination of the stimulus, it was necessary to answer the question for each of the observed events: “Which of the stimuli is dominant in your opinion: vibrations (V), noise (N) or both stimuli equivalent (E)?”
In the part related to the general annoyance, it was necessary to answer whether the respondent could complain about the train passing—on a three-step scale: negligible (A), perceptible (B), extremely perceptible (Z).
Two people were required to complete the survey. The first person watched the type of train. At the same time, the second person completed the questionnaire. This was done to avoid any self-suggestion related to the type of train that could influence on the survey data.
2.2. Measurement Overview
Simultaneous vibration and noise measurements were performed on 11 September 2018. As part of the measurements, 20 single events (train passage) were used as a sample of daily railway activity.
The building subjected to testing was located 15.5 m from the nearest active railway track. The vibro-acoustic excitation tested was the passage of trains along the railroad track of the Central Rail Line. The building has two floors and an attic. The building has a partial cellar. It was built using traditional masonry technology. The decks were made using timber, while the attic deck was made of reinforced concrete slab supported by beams made from the same material. The building elevation from the side of the railway is presented in
Figure 3.
The tested room was located on the first floor. None of the room partitions were located in the elevation facing the railroad track. The partitions of the tested room comprised two masonry, and two gypsum plasterboard walls. The upper floor was made of reinforced concrete and the lower floor was made of timber. The room was fully furnished and thus reverberation time correction for noise level was omitted. The surface layer of the floor was made of wooden panels covered with a carpet at the site of the measurement point. The dimensions and drawings of building subjected to testing are shown in
Figure 4.
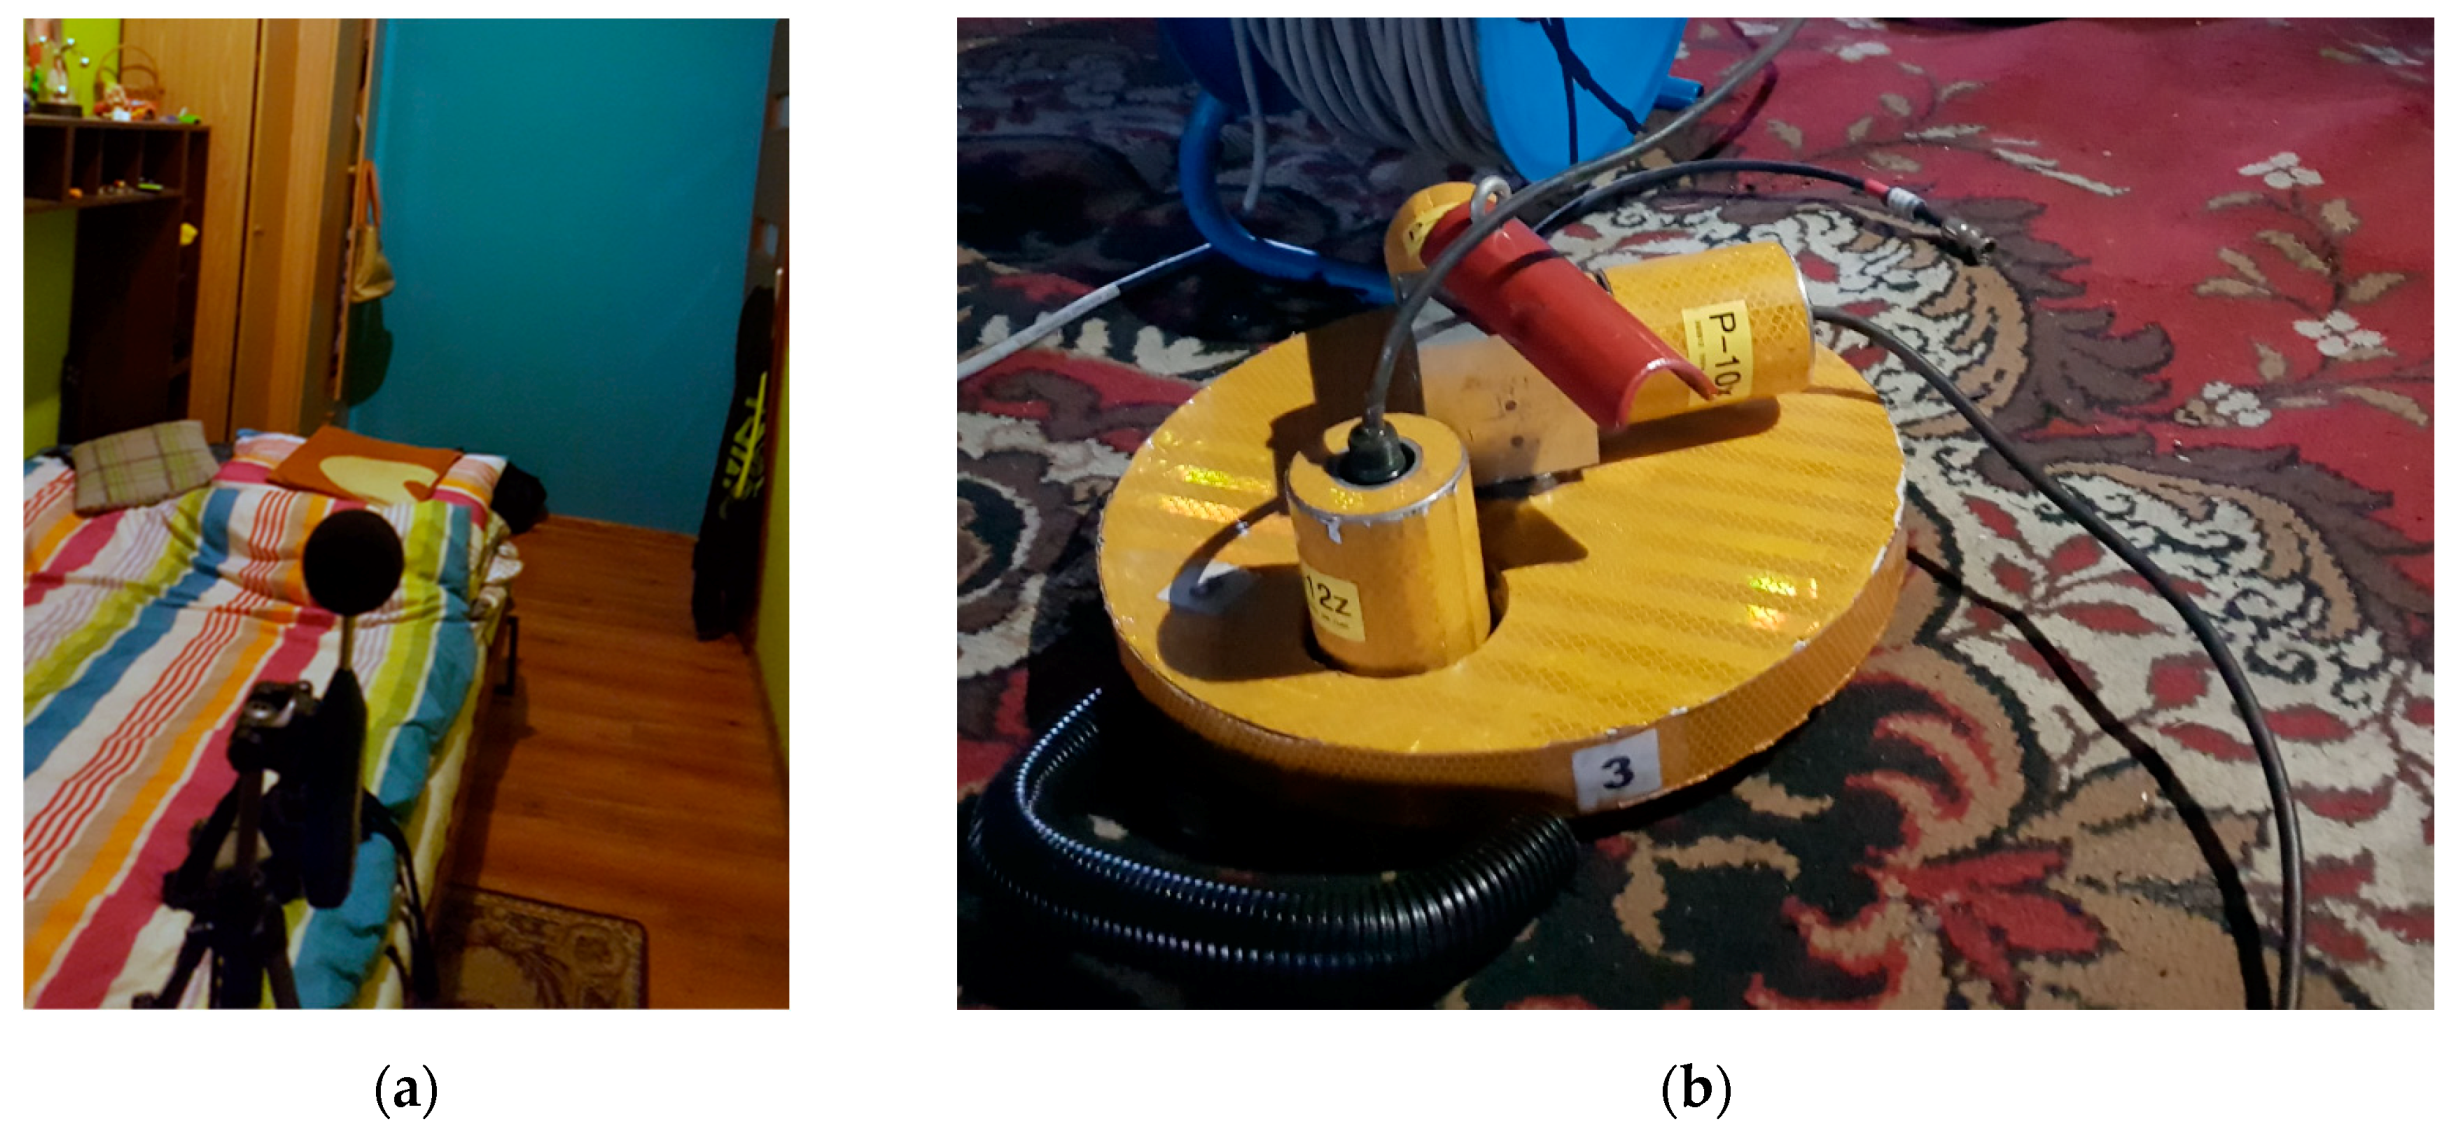
The microphone measuring points were at the center (point P1) and 1/3 of the room span (point P2) in order to obtain logarithmic average of the results of noise measurement. The accelerometer was set in the middle of the room’s span (at microphone position P1, on the floor) with the X and Y axes in the floor plane and the Z axis perpendicular to the floor plane. To provide initial load on the floor, a 30 kg lead disc was placed on the floor together with 3 measuring accelerometers. The measurement positions are presented in
Figure 5 and
Figure 6.
Sample signal recordings from the measurements are presented in
Figure 7 for vibration acceleration and in
Figure 8 for noise level during an event.
In order to ensure that noise presented in the tested room was not influenced by the external airborne noise of train passage, an estimation of normalized level difference
Drt,2m,n was performed using the global railway traffic method [
8]. A microphone was placed outside the building, 1.5 m above the floor of the tested room and 2 m from the building’s facade, pointing towards the railroad track. The microphones inside tested room were placed at points P1 and P2 (see
Figure 5). The same microphone positions were used for reverberation time estimation using the integrated impulse response method with engineering precision [
11]. The estimated value of
Drt,2m,n was equal to 58 dB, which lends evidence to the statement that there was a neglected amount of external airborne noise in the tested room.
Room equipment (ex. furniture, layers) could be evaluated using reverberation time correction for noise level. The method of comfort evaluation in this paper aims for assessment of current situation. The effect of room equipment and reverberation time correction was not taken into consideration.
Potential background noise was removed from the analysis, because this method of comfort evaluation does not take into consideration typical background noise. The laboratory test performed by Howarth and Griffin [
12] considered only train passby, without additional background noise. That is why only noise/vibration source was taken into evaluation.
The method shown in this article is designated only for the evaluation of a single room. This article shows that omitting one factor, either noise or vibration, can lead to underestimation of annoyance due to these stimuli.
3. Results
The measurement results for a single dynamic event are listed in
Table 1. It presents SEL and VDVs. We performed an analysis of annoyance levels for single events and the given time periods based on these results.
As it can be seen from the results presented in
Table 1, sound exposure levels varied between 49.1 and 60.3 dBA. The vibration dose values fit between 0.0483 and 0.1559 m/s
1.75. Specifically, VDVs for passenger trains ranged from 0.0483 to 0.0660 m/s
1.75 and corresponded with SEL values that ranged from 49.1 to 56.6 dBA. For cargo trains, the stimulus values were higher, with ranges between 55.8 and 60.3 dBA and between 0.1123 and 0.1559 m/s
1.75. The average values were obtained by estimation using Formulas (5) for SEL and (6) for VDV. It was assumed that the duration of each event was constant for these formulas. Of course, the duration for each event varied, yet within an acceptable range, thus the averaging was called an estimation.
where:
N—number of events,
i—subsequent event number.
Table 2 presents annoyance levels for single stimuli (vibration and noise separately) together with the total annoyance for both stimuli for single dynamic event. The annoyance was calculated as single-stimulus annoyance from noise (Formula (1)), from vibration (Formula (2), and total annoyance combined from both stimuli (Formula (3)) together with an equivalent VDV (Formula (4)).
Considering annoyance levels, the results presented in
Table 2 indicate that noise tended to dominate as the more annoying stimulus in every event.
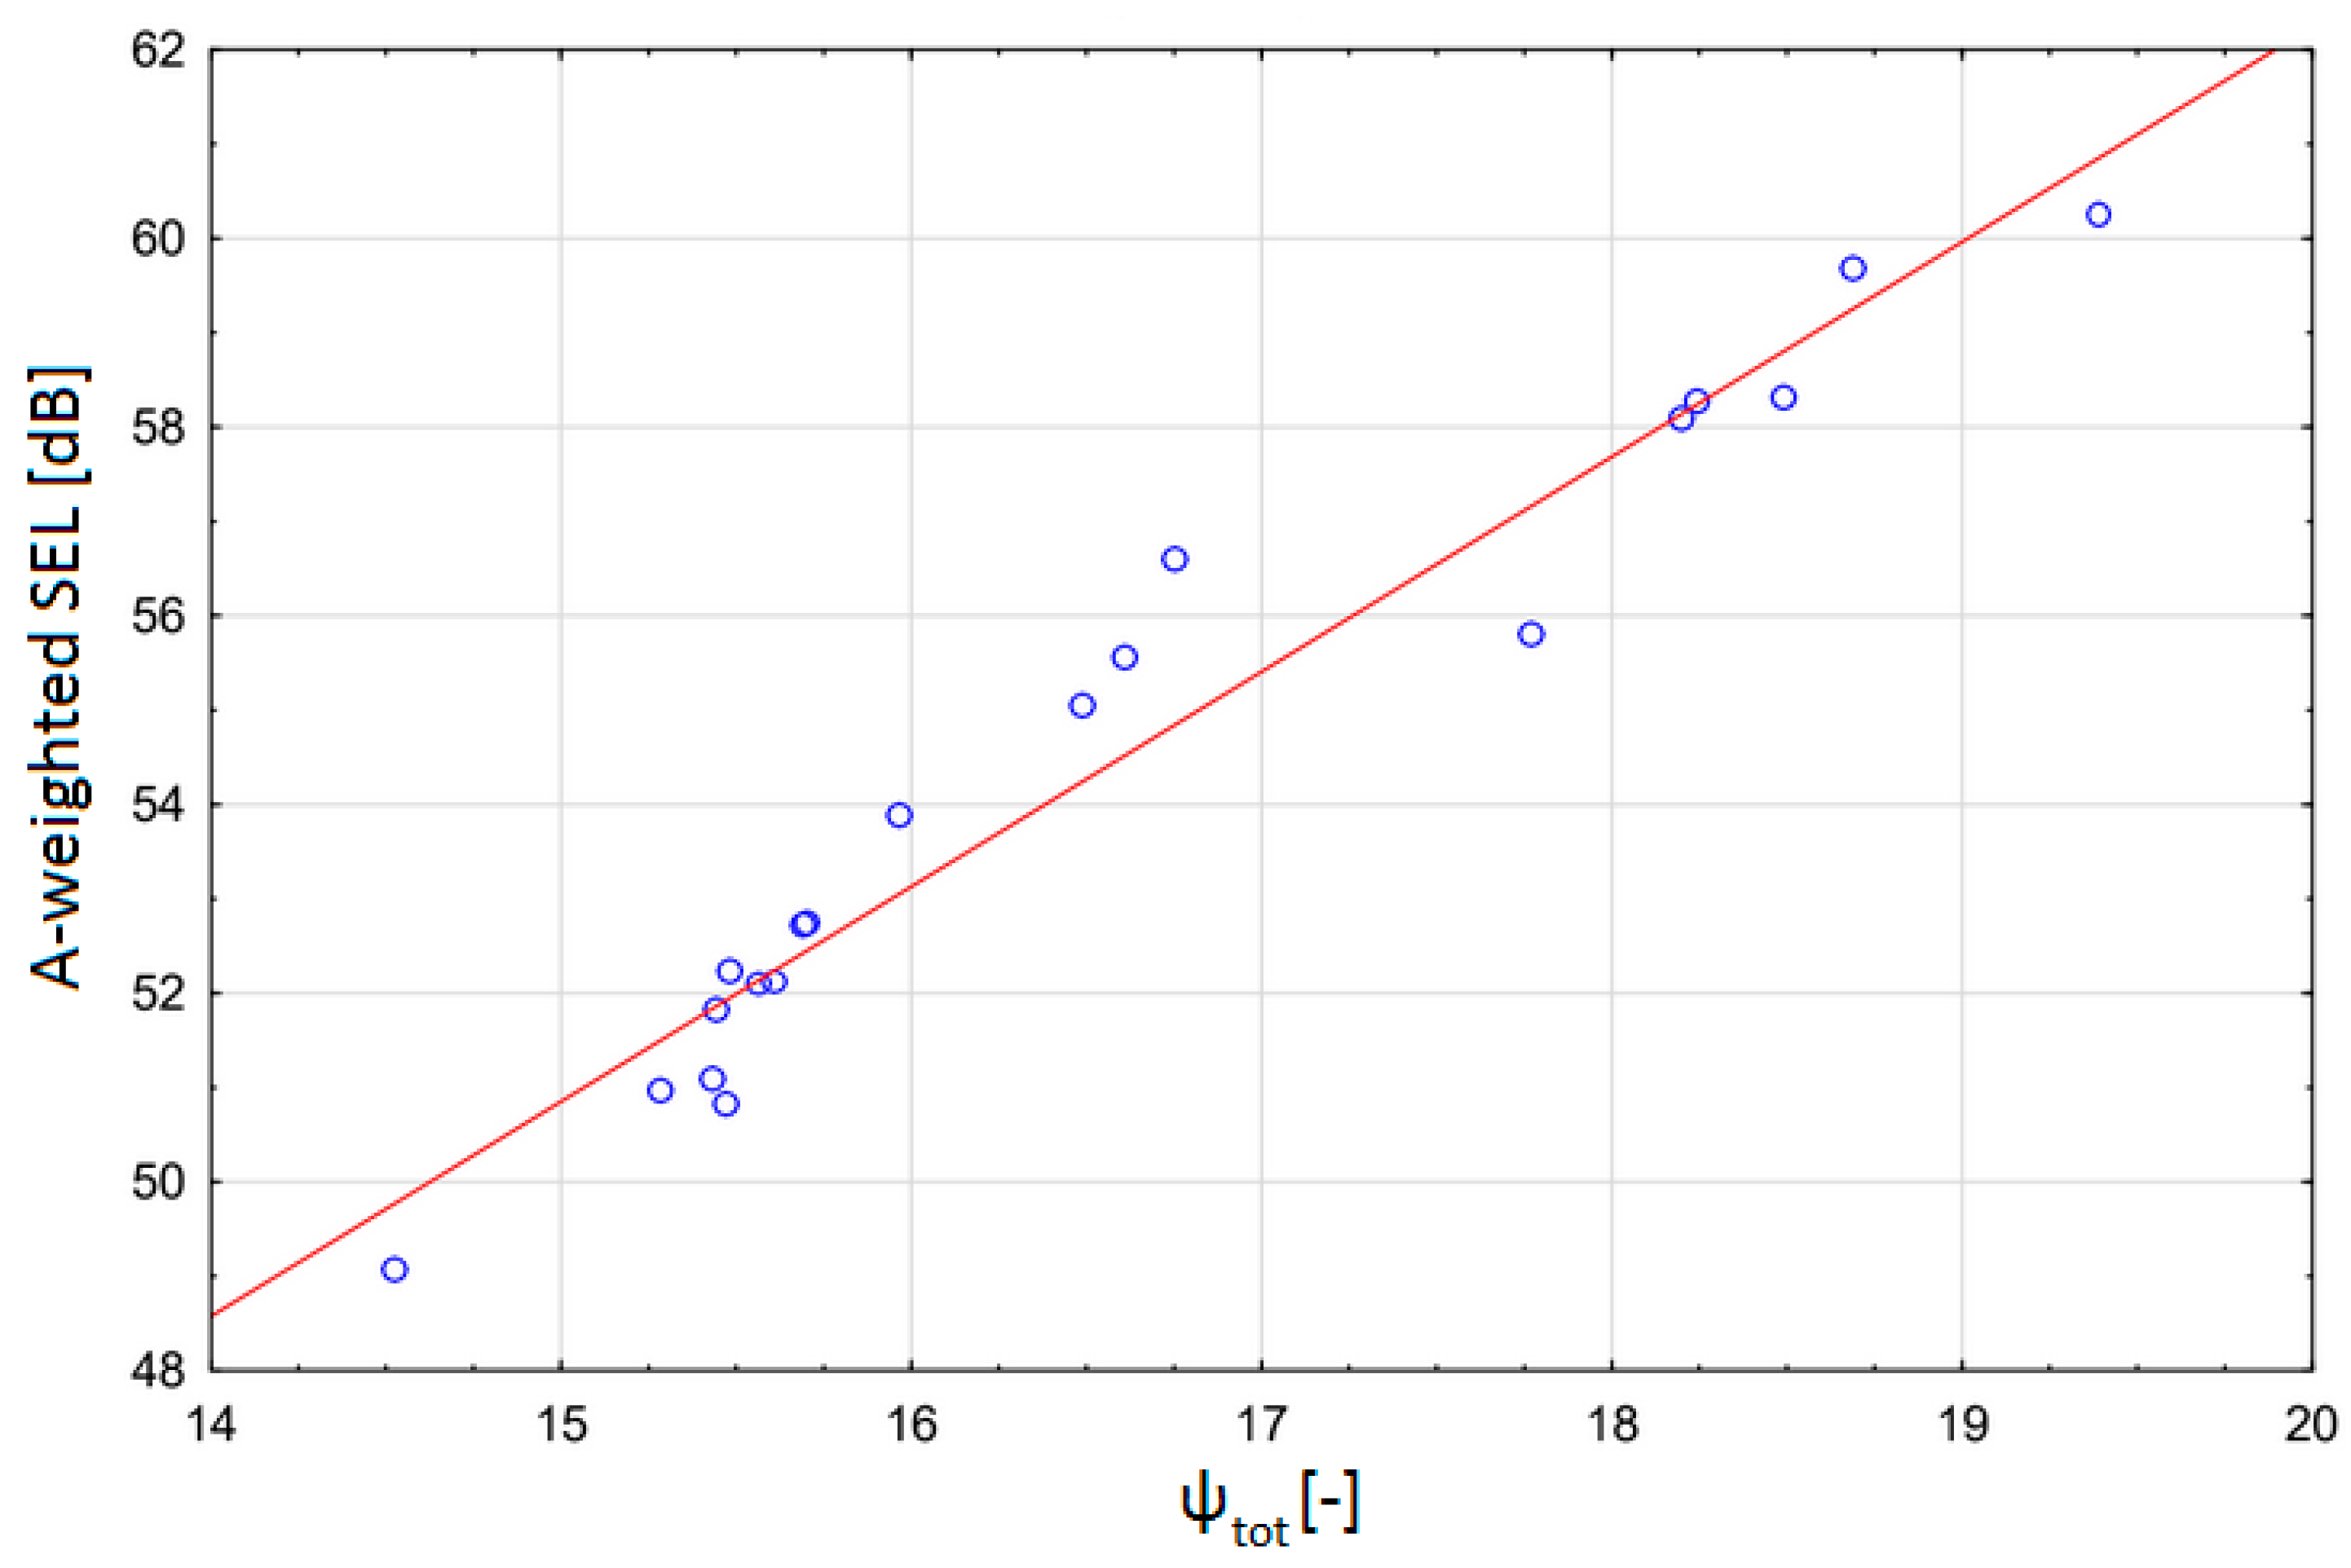
In order to validate the method, a statistical analysis in the form of multiple linear regression was performed. The first step was to create a linear regression model where the total annoyance values were variables and the SEL values were grouping variables. The results of this model are shown in
Figure 9.
As can be seen from
Figure 9 value of SEL could be modelled as given in Formula (7):
where:
ψtot—is total annoyance
The coefficient of determination is equal R2 = 0.94 and p value is equal 0.000153 for factor and p = 0.000000 for intercept. It means that the null hypothesis should be rejected, and in practice this means that the results are conclusive.
The same analysis was made for VDV values. The results are shown in
Figure 10.
This time values of VDV could be modelled as follows with Formula (8):
With the coefficient of determination R2 = 0.92, p = 0.000000 for both factor and intercept.
Both the statistical analyses confirm that both stimuli noise (in the value SEL) and vibration (in the VDV form) have an impact on the total annoyance value.
A very interesting relation could be to find when the total annoyance will be modelled as a function of duration (
Figure 11).
Unfortunately, due to a small number of cargo trains observed during the measurement it was impossible to make such kind of analysis for the duration and the train type.
Based on data obtained from the Polish State Railways and observed in situ, daytime and night-time numbers for events are given in
Table 3.
Based on the averaged results for measurements listed in
Table 1 and the number of events in the given time periods (see
Table 3), the time period stimuli quantities were calculated. The results are listed in
Table 4. First, the sound exposure level and vibration dose value for the analyzed periods were calculated using the Formulas (9) and (10) as presented below. Afterwards, annoyance levels were calculated for all of the periods under analysis using Formulas (1)–(3). Finally, the equivalent VDV was calculated using Formula (4).
where:
N(period,car)—number of cargo train events during the given period,
N(period,pas)—number of passenger train events during the given period
In both cases—for single-event analysis and averaged time period analysis—noise was the dominant stimulus. This could be observed when comparing noise and vibration annoyance levels. During daytime, noise annoyance level (ψn,daytime = 21.56) was higher than the vibration annoyance level (ψv,daytime = 18.84). A similar situation occurred during night-time, with ψn,night-time = 18.62 and ψv,night-time = 16.95. Background noise and background vibration were omitted in the analysis because they were not a part of it. In order to provide an outline of the irrelevance of the influence of background noise on the measured data, an approximate check was performed. Increases in SEL during night-time was registered to be up to 2 dB and daytime up to 1 dB, with VDV 1% to 0.5%, respectively, using background noise registered in situ. Such increases are considered irrelevant because the increase in noise and vibration annoyance was 0.72 (for 2 dB SEL increase) and 0.05 (for 1% VDV increase), respectively. Moreover, stimulus domination (noise or vibration) did not change by using background noises in this case.
4. Discussion
In order to evaluate the current state of annoyance in relation to the probability of adverse comments, the authors used [
4]. VDV ranges are listed in
Table 5.
When comparing the analysis results listed in
Table 4 with the vibration criteria from
Table 5, it can be concluded that, based on VDV measurements (vibration only) and daytime and night-time railway activity, a low probability of adverse comments was present. Using equivalent VDV (taking into account noise and vibration) to evaluate the current state, both during daytime and night-time, adverse comments were determined to be probable.
To have somewhat better picture of the situation, using [
6], maximum sound exposure levels can be estimated. Estimations with permissible values are listed in
Table 6. These values should be approached cautiously due to the fact that indoor ambient noise levels for dwellings are a total sum of structure-borne and airborne noise, but according to this standard ground-borne noise is assessed separately.
Considering noise only, comparing results of noise exposure levels from
Table 4 with permissible values from
Table 6 it can be seen that permissible SEL is not exceeded, with a considerable reserve of 5 dB to 8 dB.
Comparing annoyance levels from
Table 5 and
Table 6 it can be seen that acoustic requirements are more liberal and comparable with the VDV method at the level of possible adverse comments. Having the same levels of annoyance gives a total annoyance value that is higher by value of 3. This begs the question as to whether the permissible total annoyance values should be increased by 3 or taken either from noise or vibration.
For the purpose of validating the analyses presented in this article, a questionnaire study was conducted. To illustrate the results of the study, mustache-box charts were made. In
Figure 12 the dominant stimulus is shown. It can be seen that for cargo trains the median is in the equivalent level and the dominant range is from noise to equivalent, but for passenger trains the median is for noise and this stimulus is dominant for this type of train.
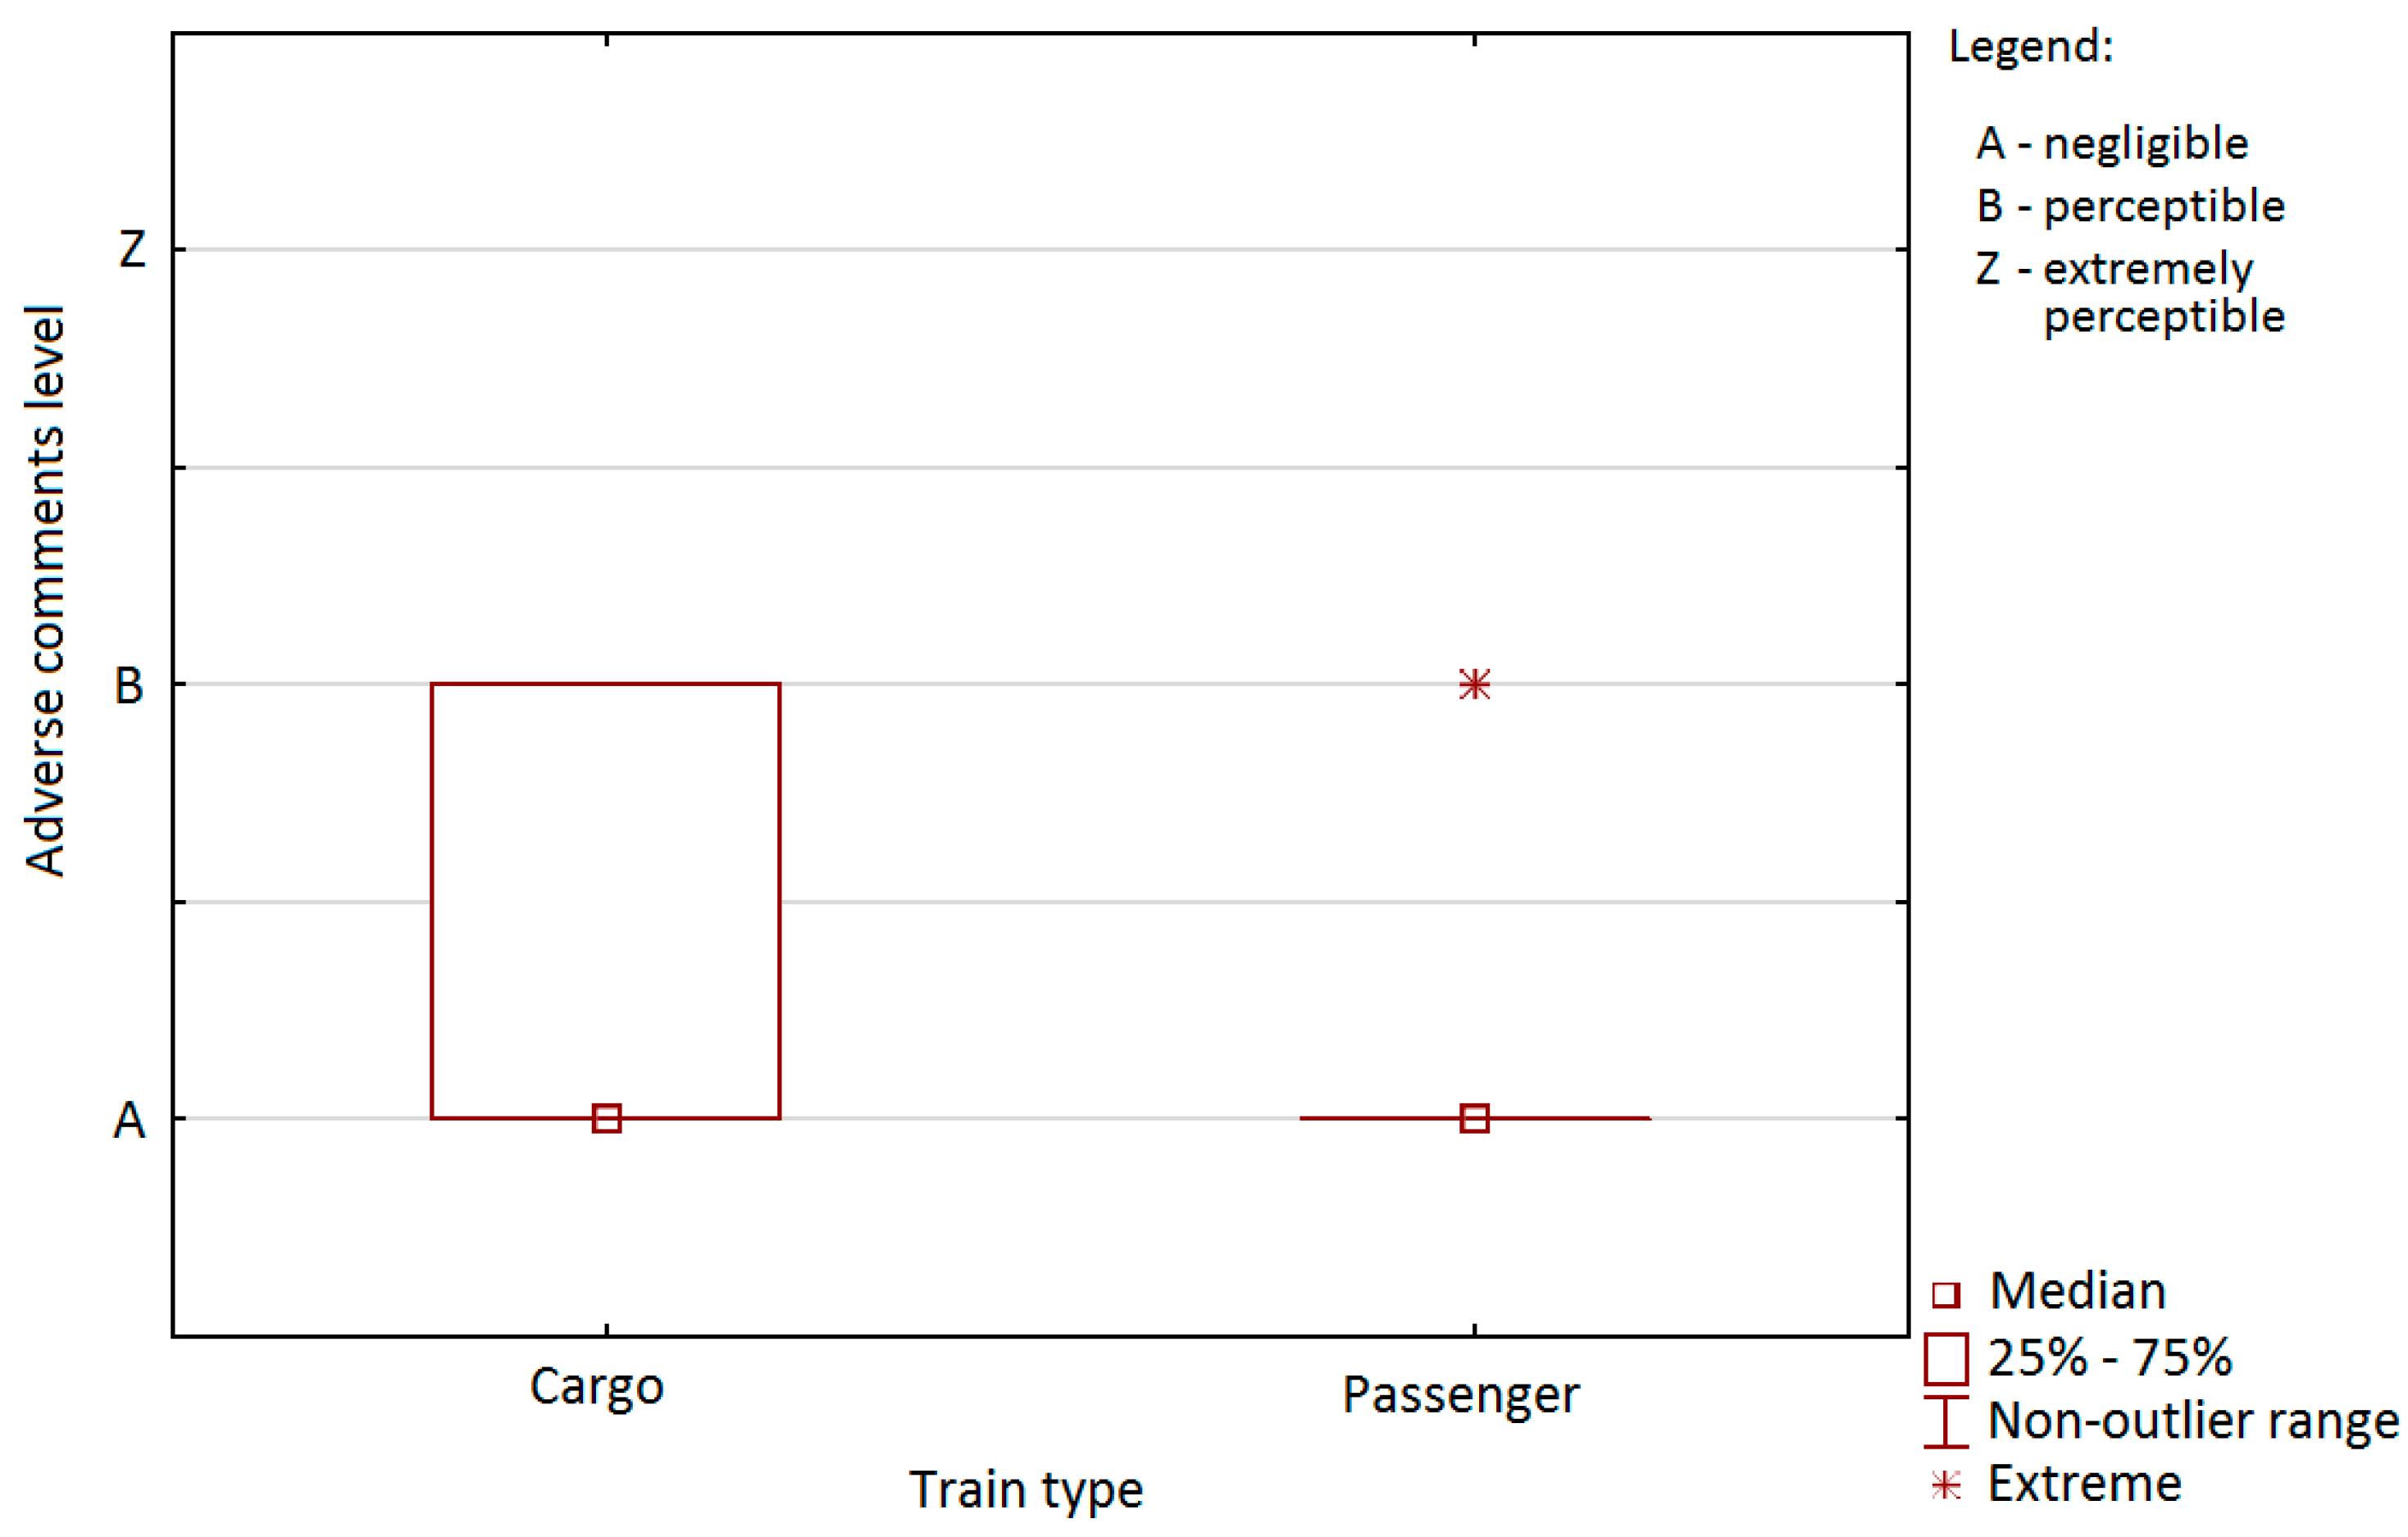
In
Figure 13 the annoyance level for different types of trains is shown. For cargo trains the median value is for A–negligible annoyance but the range of dominant is from negligible to perceptible annoyance. This means that in most cases both noise and vibration are imperceptible but from time to time one of them or both are perceptible (rather noise than vibration–
Figure 12). For passenger trains both median and the dominant range is the same–negligible perception but very rarely, for single events perceptible.
5. Conclusions
5.1. General Concusions
The analysis of vibration exposure only may lead to an underestimation of indoor comfort. It does not stem from incorrect assumptions as stipulated in vibration evaluation standards and methods. The current development of vibration evaluation methods [
41] shows good compliance with the actual total body vibration response. The problem seems to be the exposure to two stimuli in the form of noise and vibration.
In the tested room it was shown that the noise accompanying the vibration (ground-borne noise) was the dominant stimulus. In both cases, noise and vibration, as analyzed separately, met the requirement of comfort. However, in analyses of simultaneous exposure, it was shown that comfort may not be provided.
It is interesting that there is no ‘pure’ vibration event during the passage of a train. Every event had corresponding ground-borne noise. Moreover, noise tended to be the dominant stimulus. The proposed method of comfort evaluation can be seen as more comprehensive than the ones currently applied in engineering practice.
In order to verify the correctness of the proposed method, statistical analyses were performed using multiple linear regression. Both noise (represented by SEL factor) and vibration (represented by VDV value) can influence largely on the result of total annoyance.
Because of the individual nature of noise and vibration perception, it is good to have measurements with individual residents. In order to enrich the measurements with studies involving humans, it was decided to send questionnaires to residents of analyzed building. Eight people took part in questionnaires: four residents of investigated room and four neighbors but living in the same building. The results are as follows:
- -
the noise is dominant stimuli for passenger trains,
- -
for cargo trains, both noise and vibration are equivalent for most people,
- -
generally, in analyzed room the annoyance of both stimuli is negligible, but for cargo trains there are some events in which annoyance could be perceptible.
5.2. Limitations
The method can be used only for room comfort evaluation. Due to fact that this method was based on a laboratory test in [
12], it does not consider other types of sources than trains. It should therefore not be used directly to evaluate other sources of noise and vibration. Moreover, people with hearing loss may perceive noise and vibration in a different manner than people without a hearing impairment. This method will give false results of comfort evaluation if inhabitants show any problems with hearing.
5.3. Further Studies
The influence of hearing loss can be added to the analysis during further research. People with hearing problems are more sensible to low frequency noise, thus the annoyance caused by ground-borne noise may be higher in such individuals.
The other human senses may also be considered from the perspective of comfort in buildings. Aside from noise and vibration, light temperature, humidity, and air quality can considerably influence general comfort. That is why a multidimensional function describing sustainable comfort should be evaluated [
42].
Additional survey research with different approaches can prove to be useful. The current method gives interesting results. The influence of vibration on noise perception resulting in total annoyance can be used a form of validation.
A transfer function for noise and ground-borne vibration can be proposed for different types of structures. Due to various structural and architectural solutions, it may vary depending on room location and vibration source. Numerous laboratory and on-site tests must be performed because of this.


