Article

Climate Change and Sustainability of Crop Yield in Dry Regions Food Insecurity

by
Samira Shayanmehr
1,
Shida Rastegari Henneberry
2,
Mahmood Sabouhi Sabouni
1 and
Naser Shahnoushi Foroushani
1,*
1
Department of Agricultural Economics, Ferdowsi University of Mashhad, Mashhad 9177948974, Iran
2
Department of Agricultural Economics, Oklahoma State University, Stillwater, OK 74078, USA
*
Author to whom correspondence should be addressed.
Sustainability 2020, 12(23), 9890; https://0-doi-org.brum.beds.ac.uk/10.3390/su12239890
Submission received: 17 October 2020 / Revised: 20 November 2020 / Accepted: 23 November 2020 / Published: 26 November 2020
(This article belongs to the Special Issue Effects of Climate Change on Sustainable Agriculture)

Abstract

:
The main purpose of the study was to investigate the effects of climatic change on potato yield and yield variability in Agro-Ecological Zones (AEZs) of Iran during 2041–2070 (2050s). The Statistical Downscaling Model (SDSM) was performed in this study to downscale the outputs of the General Circulation Model (GCM) and to obtain local climate projections under climate scenarios for a future period. The Just and Pope Production function was used to investigate the impacts of climatic change on potato yield. The results showed that the effects of future climatic change on potato yield and its variability would vary among the different AEZs. Potato yield would change in the range from −11% to 36% across different AEZs during the 2050s. Yield variability is expected to vary from −29% to 6%. Much more generally, the results indicated that the major potato producing zones would experience a decrease in mean potato yield in the presence of climate change. Our findings would help policymakers and planners in designing appropriate policies to allocate the lands under potato cultivation among different zones. These results also have important implications for adopting ecological zone-specific strategies to mitigate the reduction in potato yield and meet food security.

Graphical Abstract

1. Introduction

Changes in the global climate have become one of the most crucial challenges facing agriculture in the twenty-first century [1,2]. Climatic change is mainly characterized by a rise in greenhouse gas emissions and global average temperature as well as changes in precipitation levels and patterns [3,4,5]. Undoubtedly, these changes affect the growth and productivity of agricultural production, and thus food security in many parts of the world [6]. At present, supplying sufficient food for each country relies on the management of climatic variables that affect agricultural productions [7]. Therefore, the investigation of climate change impacts on agricultural production and food security is essential. There has been an increasing effort set out to assess the impacts of climate change on crop production at various geographical locations around the world: Shayanmehr et al. [1] in Iran, Chen et al. [8] in USA, Chen and Chang [9] in Taiwan, De-Graft and Kweku [10] in Ghana, Bozzola et al. [11] in Italy, Wei et al. [12] in China, Sarker et al. [13] in Bangladesh, Azad et al. [14] in Iran, Sinnarong et al. [15] in Thailand, and Chavas et al. [16] in Italy.
The effects of climatic change on agricultural production is expected to be most severe in global dry and semi-arid regions like Iran [7]. Mean annual rainfall in Iran is around 250 mm, which is less than a third of the global mean rainfall [17,18] and most parts of this country experience severe dry conditions [19,20,21]. Therefore, Iran could face a serious challenge in meeting food security in the presence of climate change [1,7]. Furthermore, dramatic population growth and the increase in food demand along with a scarcity of water resources exert more pressure on the agriculture of Iran [22,23,24]. The potato is the second most critical food crop after wheat [25] and also one of the most affordable and staple food resources in Iran, which has been identified as one strategic crop to achieve food security [26,27]. This crop is cultivated on about 147,000 hectares with an average yield of more than 34 tons per ha in Iran. This country, with an annual production of approximately 5 million tons of potato, is the twelfth country in the world for potato production, and the fourth in Asia [
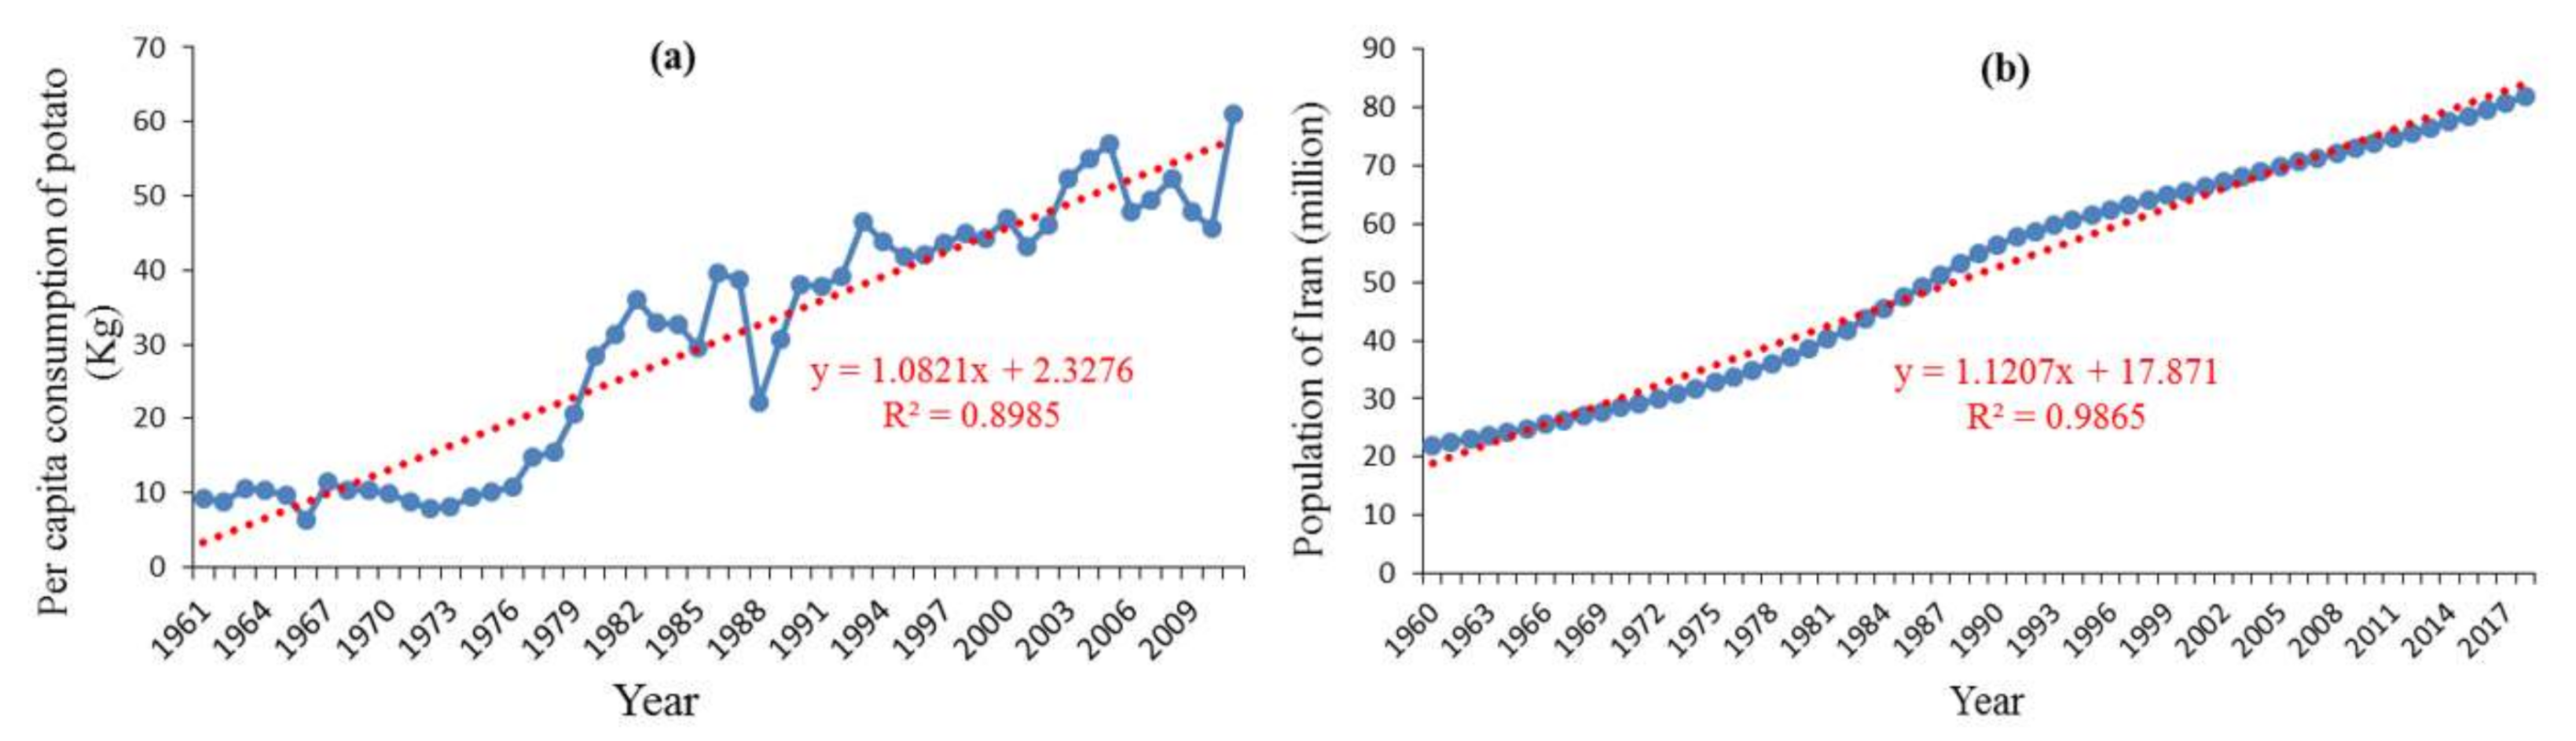
28]. Per capita consumption of potato in Iran has increased from almost 9 kg in 1961 to 60.97 kg in 2011 (see Figure 1a). Potato production is highly sensitive to changing climate conditions, and climatic change is one of the major challenges to potato production to meet the rising food security concerns [29]. Hence, feeding the ever-growing population (see Figure 1b) will be a major challenge in Iran. Accordingly, evaluating the impact of climatic change on Iran’s potato production in the future to ensure food security and decrease the adverse impacts of climate change is a vital need.
Previous studies regarding the evaluation of climate change impacts commonly have used two models: (1) crop simulation models [30,31,32,33,34,35] and (2) regression models [2,10,12,36,37,38]. Crop simulation models, including APSIM-Potato, CERES-Rice, SUBSTOR-Potato, and CERES-Maize are employed in controlled agronomic experiments to predict the effects of climatic change on crop yield under different climatic scenarios [13,39]. The weak point of using these models is that they only focus on crop physiology, and predict the potential climatic effect on crop yields without considering farmers’ adaptation behavior [40]. Accordingly, crop simulation models result in an underestimation of the positive climate impacts and an overestimation of the negative climate impacts [38]. In contrast to the crop simulation models, regression models are more flexible, because this group of models uses historical crop yield and climate data for estimation. This approach is used as a powerful tool to measure the future relationships between climate parameters and crop yields that correspond to the past, even without using field and management data [15].
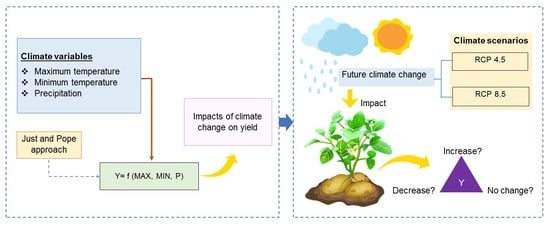
Farmers in developing countries face uncertainty as well as stochastic threats to crop production. These uncertainties should be considered in the distribution of production function data [38]. Hence, this study used the regression approach, i.e., Just and Pope [41] production function (Just-Pope) to measure the climatic change impact on yield distributions. This method provides the possibility of analyzing the effects of the independent variables on both average yield and yield risk [42]. The Just-Pope is extensively applied in climate and crop yield studies [1,2,8,37,38,43,44,45,46,47,48]. Moreover, this study employed a panel data model because it is able to increase sample size and degrees of freedom considerably, and can also control individual heterogeneity [13]. Having these aspects in mind, this study applied the Just-Pope in the context of panel data to measure the impact of climatic change on the mean yield and yield variance of potato in Iran.
In relation to Iran, the impacts of climatic change on crop yield have been investigated both for historical conditions [49,50,51,52,53] and future climate projections using data taking either user-determined fixed decremental-incremental scenarios [54,55,56,57] or some coarse-resolution GCM outputs [58,59,60]. These studies fundamentally recommend using more refined datasets of climate for improving the understanding of climatic change effects on crop yield. Recently, improved datasets of climatic projections are accessible from GCMs for Representative Concentration Pathways (RCPs). Thus, this study applied Coupled Model Intercomparison Project phase 5-second generation Canadian Earth System Model (CMIP5-CanESM2) outputs to project future climatic conditions.
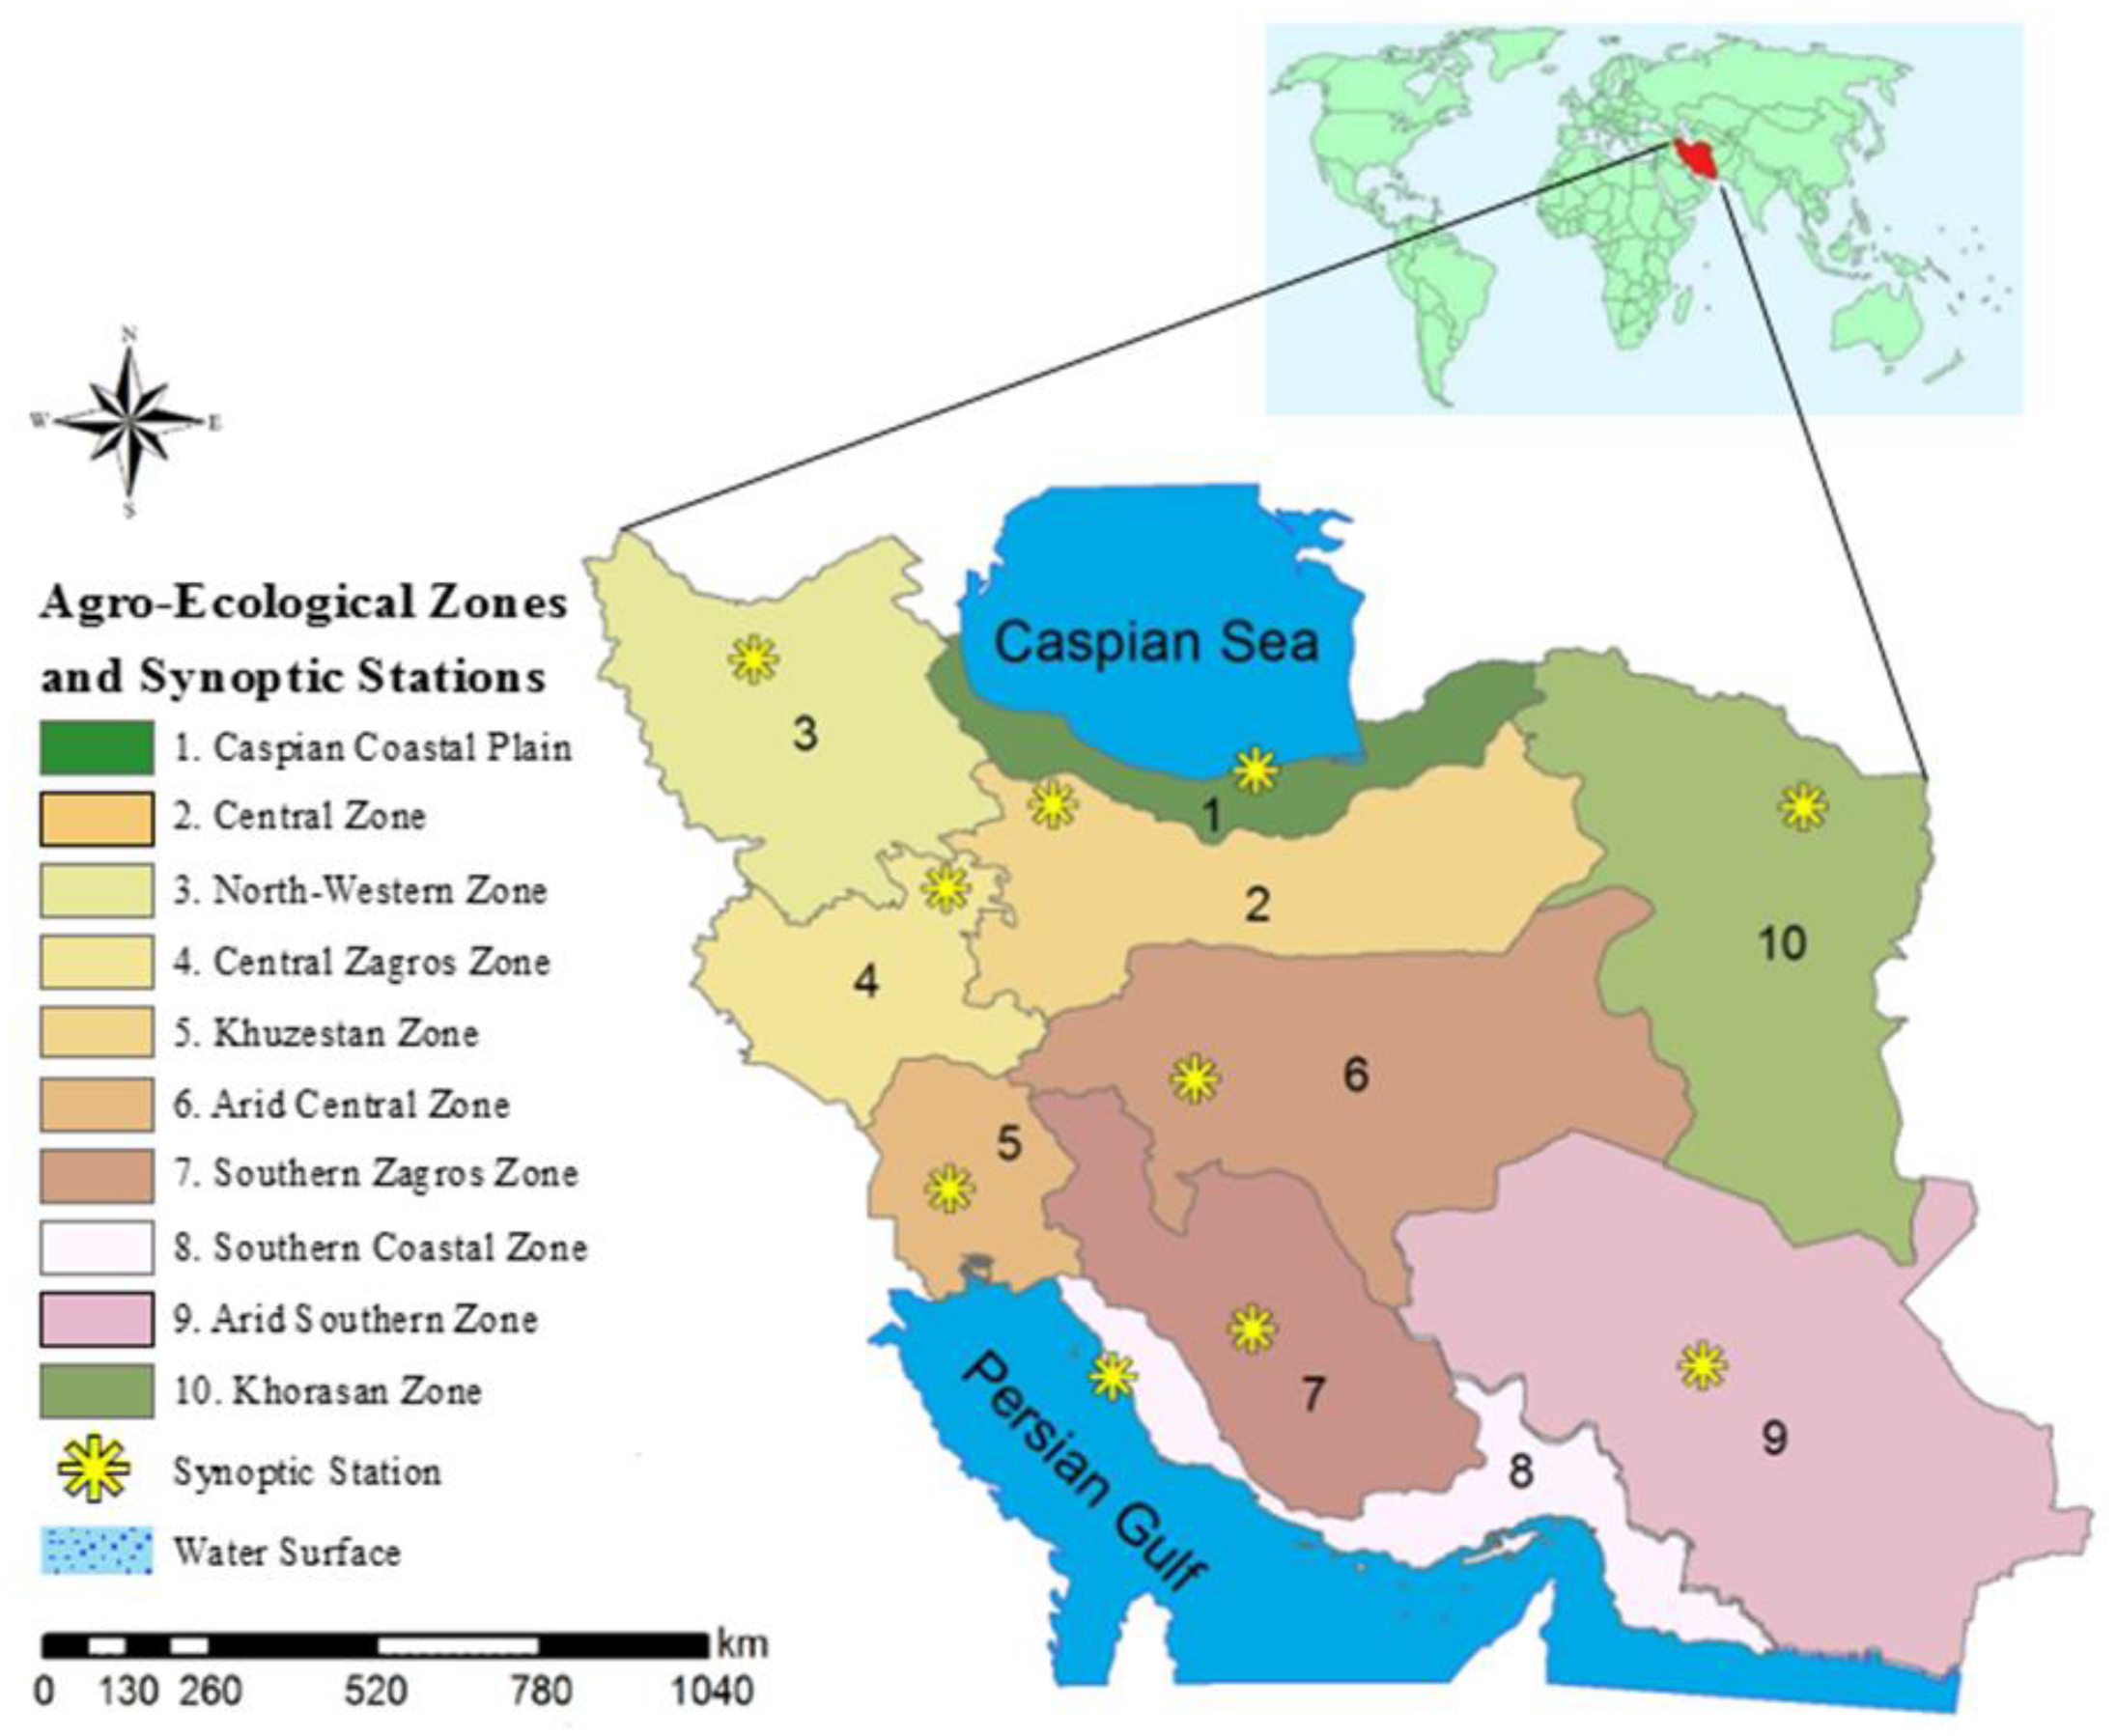
The studies implemented regarding the investigation of climatic change impacts on crop yield in Iran have been typically using the political boundaries, which are not similar in terms of soil and climatic conditions for agriculture. In this paper, to make an improvement over the previous studies, we considered Agro-Ecological Zones (AEZs) of Iran to evaluate the effect of climate change on potato yield because AEZs are regarded as geographic areas having homogeneous climate and soil for crop production [61]. A similar concept has been used in other regions and countries [33,62,63,64,65,66,67,68,69,70,71,72].
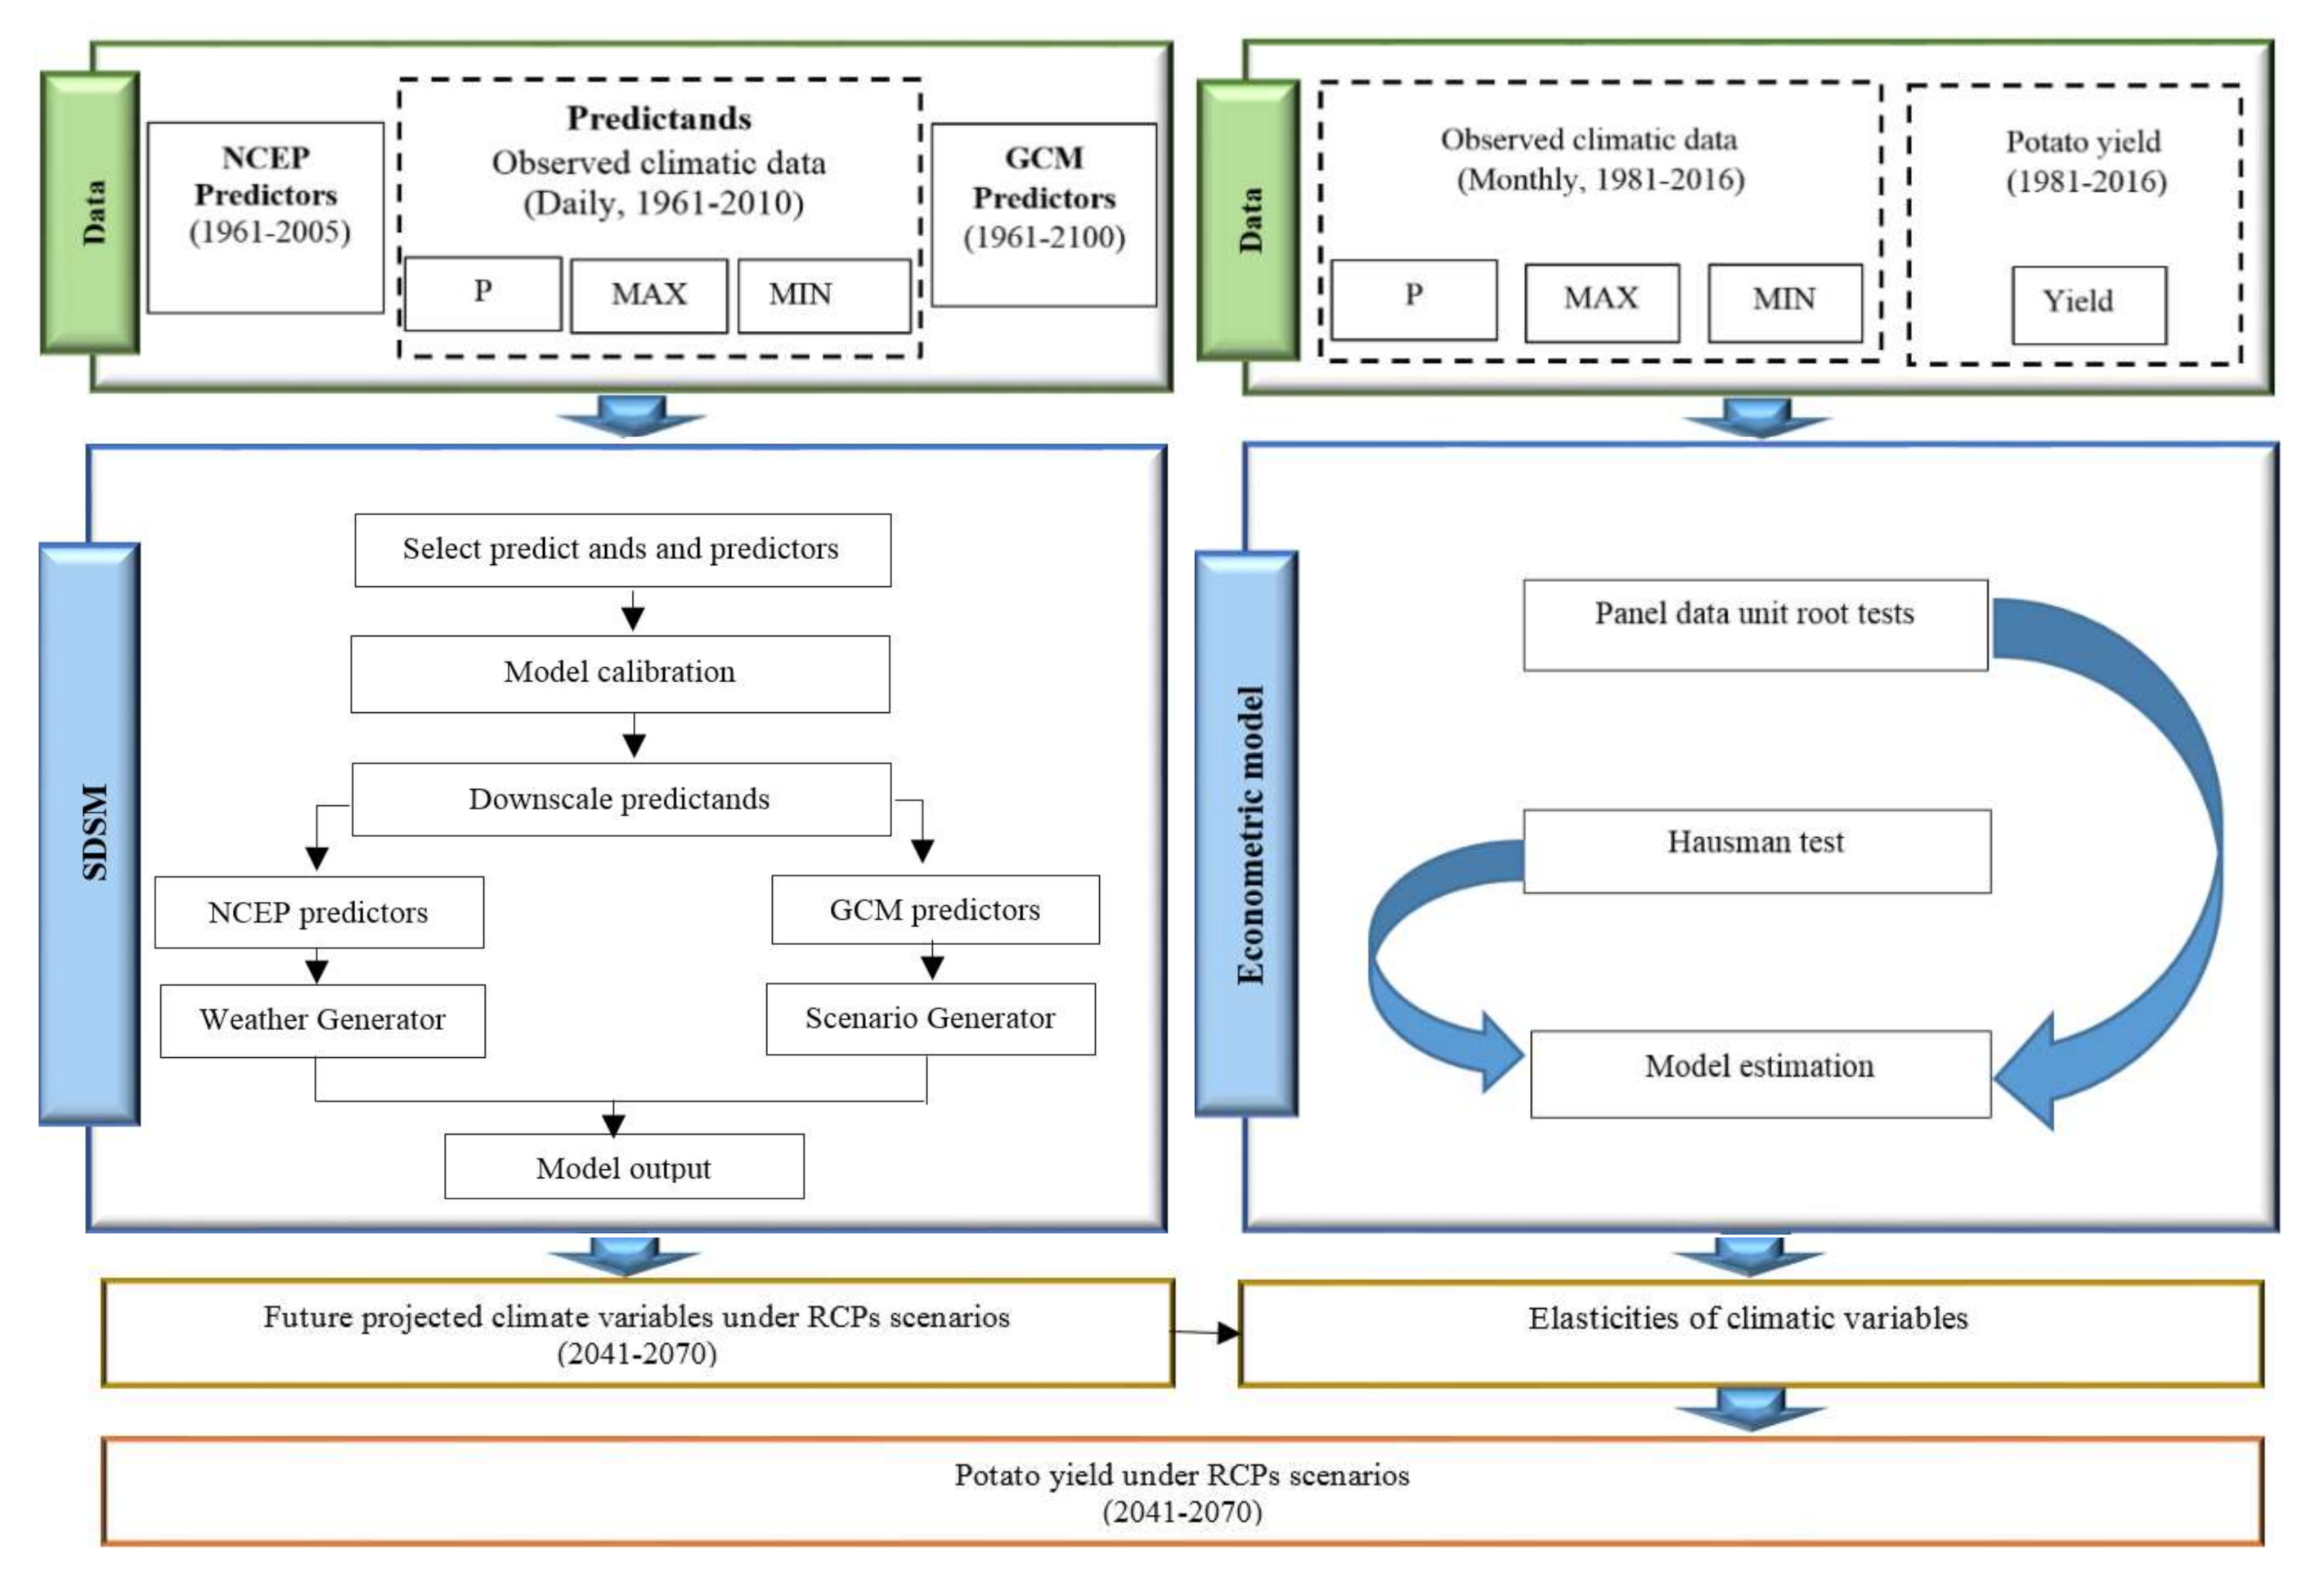
This study contributes to the existing literature in three ways. First, in terms of the case study, it is carried out for AEZs of Iran, where no such study has been conducted so far. Second, to our knowledge, this is the first attempt to employ the Just-Pope in panel data estimation to evaluate the impact of climate change on potato yield and its variability for Iran. The third contribution of the current study is in its use of an integrated econometric (Just-Pope model) and climate (statistical downscaling model) approaches to evaluate the effect of climate change on potato yield.
In the current study, we evaluated the future climatic change on potato yield and yield risk under the two emission scenarios (RCP 4.5 and 8.5) in all the AEZs of Iran. As specific objectives, we intend to: (1) employ CanESM2 to simulate climatic parameters at large scales and to project climate scenarios for the future, (2) use Statistical Downscaling Model (SDSM) to downscale the CanESM2 projections to local scales, (3) apply the Just-Pope in the framework of panel data to assess the relations between the yield of potato and climatic parameters such as minimum and maximum air temperature, and precipitation in all AEZs, (4) identify the effect of future climate parameters on mean yield and yield risk of potato in AEZs of Iran. The results of the paper are expected to contribute to an accurate assessment of how climatic change affects potato yield in each AEZ. The findings could be used by both scientists and policymakers in Iran to design policy related to appropriately allocating the lands under potato cultivation among different zones.
In the next section, we briefly describe the study area, datasets, and methodology. Results and discussions of projected climate change impact on potato yield and yield risk are presented in Section 3, and the final section concludes with research and policy implications of these findings.

2. Data and Methodology

2.1. Case Study Site

Iran is located in southwest Asia. Geographically, it has been extended from latitude 25° to 40° N and longitude 44° to 63° E. In this area, the altitude varies from −59 m (Caspian coasts) to >5300 m (Damavand mountain), which has a considerable influence on the diversity of the climate [53,73]. Therefore, Iran’s climatic conditions have fluctuated from hyper-humid (with annual precipitation of more than 1000 mm) in the northern parts to hyper-arid (with annual precipitation of less than 100 mm) in southern regions. As a whole, arid and semi-arid climatic conditions prevail in the climate of the country. This area is categorized as a very sensitive and vulnerable area to climatic change [7].
Iran is divided into ten AEZs, which are taken as a study area for this paper (see Figure 2). The main potato producing areas fall in AEZ-3, 4, and 6 (see Figure 3); their collective area constituted about 65% (95,604 ha) of the country’s potato growing areas. In this study, 10 synoptic stations were selected for projecting future climatic data. The location and general information for the selected synoptic stations are shown in Figure 2 and Table 1. The linear trends in climate parameters (maximum temperature, minimum temperature, and precipitation) of potato growing season in all the AEZs of Iran during 1981–2016, are proposed in Figure 4.

2.2. Data Collection

2.2.1. Data for Projecting Future Climate Change

The daily observed data for maximum temperature (MAX), minimum temperature (MIN), and precipitation (P) is provided from the Meteorological Organization of Iran (MOI) for 1961–2010. The daily reanalysis data for the period (1961–2005) are obtained from the National Centers for Environmental Prediction (NCEP). The large scale daily predictors for the CanESM2 model were developed by the CCCma for all listed stations. These data are used to predict climate parameters under two climatic scenarios (RCP 4.5 and 8.5) for the period of 2041–2070 (2050s).

2.2.2. Data for Estimating the Econometric Model

Potato yield data are obtained from the Ministry of Agriculture Jihad of Iran for 28 provinces during 1981–2016. Selected provinces and the growing seasons for all three potato crops (winter potato, spring potato, and summer potato) are illustrated in Table 2. Before estimating research models, we convert monthly climate data to monthly mean averages of MAX and MIN and a total monthly average of P for the potato growing season. The climatic data are collected from the MOI for 28 stations for 1981–2016. Selected stations are shown in Table 2.

2.3. Modeling Materials

The main aim of the study is the investigation of projected climate change effect on potato yield and its variability. To reach this objective, two models were integrated. (i) The SDSM is applied to predict MAX, MIN, and P under two RCP scenarios for selected stations. (ii) An econometric model is used to determine the relationship between climate variables and potato yield to estimate potato yield based on the projected climatic parameters’ levels. Our study framework is depicted in Figure 5.

2.3.1. Projecting Climate Parameters

GCMs have been defined as the most comprehensive and powerful models for examining the consequences of climatic change [1,7]. GCMs are able to simulate the effects of increasing CO2 emissions as climatic scenarios. Local changes in climate variables are related to local and global geography and topography, hence they are usually not adequately represented in GCM results because of model grid resolution. Consequently, GCM results must be downscaled for producing local climatic parameters [74]. This study used SDSM to downscale GCM-CanESM2 output. SDSM model, one of the most used models globally, is applied to downscale future climate projections using the 26 predictors derived from a large-scale climate model. This model was improved by Wilby et al. [75] and generates local climate parameters by a linear regression method and stochastic weather generator to make a statistical relationship between local climatic variables and large-scale predictors [76,77]. SDSM contains five steps: the selection of predictand and predictor variables, model calibration, generation of weather, model validation, and scenario generation for the future [1].

Downscaling Daily Climate Variables Time Series

Daily observed P, MAX, MIN are selected as predictand variables for the downscaling model. These parameters are obtained from the Meteorological Organization of Iran for 1961–2005. The predictors are derived from the NCEP data for 45 years (1961–2005). The climatic data for the future emissions scenarios were obtained from CanESM2 model outputs related to the location of selected synoptic stations. Ultimately, data were extracted for the period of 2041–2070.

SDSM Calibration and Validation

Time series from 1961 to 1990 are utilized for model calibration, and the time series from 1991 to 2005 is employed for the validation of SDSM. The calibration of SDSM computes the regression parameters for a set of predictors and one predictand [77,78]. Then the SDSM performance is assessed by R, R2, RMSE, MAE, and NSE indicators that are calculated from Equations (1)–(5).
R = i = 1 n ( E i E ¯ ) M i M ¯ i = 1 n ( E i E ¯ ) 2 i = 1 n ( M i M ¯ ) 2
R 2 = i = 1 n ( E i E ¯ M i M ¯ ) 2 i = 1 n ( E i E ¯ ) 2 i = 1 n ( M i M ¯ ) 2
R M S E = i = 1 n ( E i M i ) 2 n
M A E = i = 1 n E i M i n
N S E = 1 i = 1 n ( E i M i ) 2 i = 1 n ( M i M ¯ ) 2
where M i   are the measured values, E i are the estimated values, n denotes the number of events,     E ¯ is the average of the estimated values, and M ¯ is the average of the measured values.

2.3.2. Econometric Technique

In the current study, a production function technique developed by Just and Pope [41] is applied to investigate the effects of climate variables on the mean and variance of potato yield. This technique consists of two parts: the first component is relating to the yield levels and the second part is related to the yield variance. The general form of the estimated equation is as follows:
y = h X , α + g X , β ε
where y is the potato yield (winter, spring, and summer potato crops) and h(.) and g(.) are the production and risk functions, respectively. X is a set of independent variables (MAX, MIN, P, location, and time trend); α and β are the vectors of estimated parameters associated with X. ε denotes an exogenous production shock.
All the parameters in Equation (6) can be estimated by the maximum likelihood estimation (MLE) approach and a three-step feasible generalized least squares (FGLS) procedure [79]. Many past studies have used the FGLS method, while the use of the MLE approach is more efficient when the sample size is small [1,13]. Hence, this study employs the FGLS approach because of the large sample size.
To estimate the Just-Pope using FGLS, the three steps are performed that are as follows:
Firstly, we apply the panel data model to estimate the Equation (7) and get the error term η.
y = h X ,   α   +   η
Secondly, the logarithm of the squared of η is regressed on X that can be formulated as:
ln η ^ 2 = g X ,   β   +   ε
Finally, the Equation (7) is modified by exponential predicted values of ln η ^ 2 as weights to omit the impact of heteroscedasticity and obtain a final estimate of α that can be defined as:
y g 0.5 X , β ^   = h   X , α g 0.5 X , β ^   +   η g 0.5 X , β ^
where alpha indicates that how a change in X influences average yield.
Three functional forms (translog, quadratic, and Cobb-Douglas) have been utilized for the Just-Pope [13,80]. For the translog function form, the Just and Pope postulates are violated, due to the multiplicative interaction between the average function and variance function [13,81]. Thus, quadratic functional form (QFF) and Cobb-Douglas functional form (CDFF) can be employed for Just-Pope estimation.
The average yield production function is represented as:
Quadratic form:
y = β 0 + β t T + j β 1 j x j + j β 2 j x j 2 + j h h j β j h x j x h + s β 4 s x s
Cobb-Douglas form:
l n y = β 0 + β t T + j β 1 j l n x j + s β 2 s x s
where T represents the time trend, which is a proxy variable for technological progress, xj and xh are climatic factors during the potato growing period, xs indicates regional dummy variables, and β’s implies coefficients to be estimated.
Following Koundouri and Nauges [82], Just and Pope [79], and Sarker et al. [83] the variance function is defined in a CDFF as follows:
l n η 2 = β 0 + β t T + j β 1 j l n x j
where β   ’s indicate parameters to be estimated, and xj is climate variable during the potato growing period.

3. Results

First, we look at the outcomes of the statistical downscaling model for synoptic stations. Then the Just and Pope production function estimations are examined. Finally, the results of the two previous steps were used to forecast the future climate change impacts on potato yield and yield risk under different climate scenarios.

3.1. Projecting Future Climate Change

3.1.1. SDSM Model

In this section, five parts of this model are performed: the predictor variables are selected and then, model calibration, generation of weather, and model validation are conducted, and finally, future climatic parameters are generated.

3.1.2. Selection of Predictor Variables

The selection of predictors is the main issue in employing the statistical downscaling model because the better outputs of this model depend on the choice of suitable predictors. The observed daily NCEP data for 1961–2005 is utilized to determine the predictors. In this paper, the procedure of choosing proper predictor variables is according to the studies of Wilby et al. [75], Adham et al. [77]. All selected predictors variables of 10 stations for different climate parameters (MAX, MIN, and P) are presented in Table 3:

3.1.3. Evaluation of the SDSM Performance

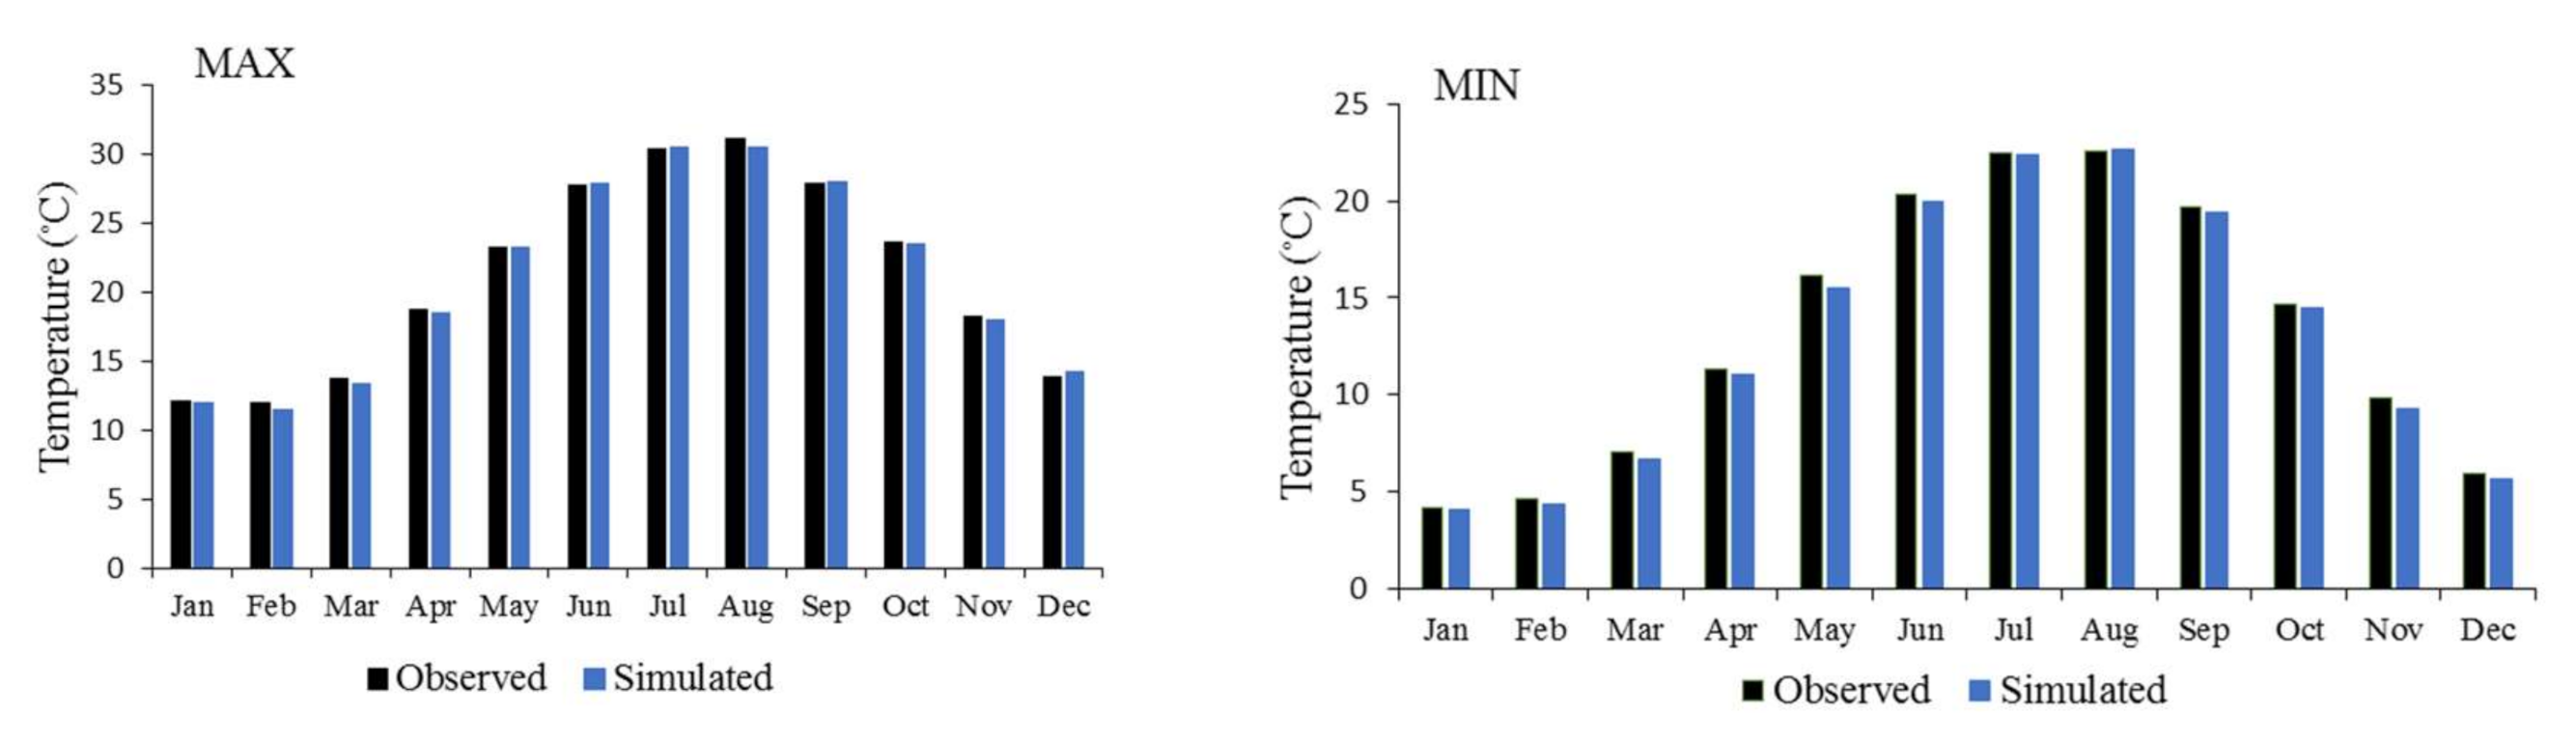
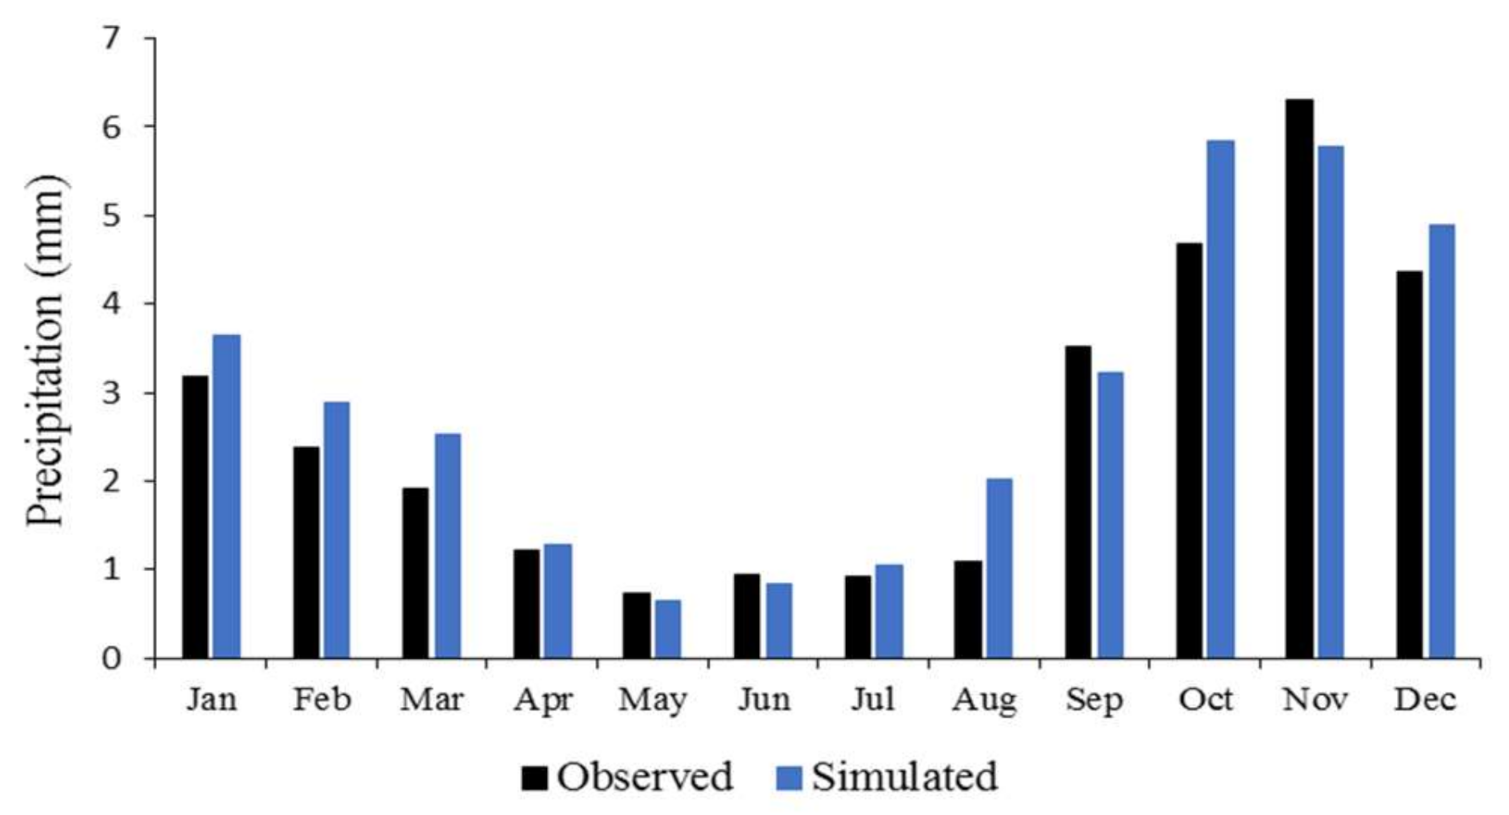
The model calibration was applied for the first 30 years (1961–1990) and after that the weather-generator module is utilized to evaluate the SDSM performance. Taking Babolsar station as an example, the observed and simulation data are compared by the summary and frequency analysis for the period of 1991–2005, as is indicated in Figure 6. Evaluations of the monthly average of MAX, MIN, and P demonstrated a satisfactory agreement between the measured and estimated data for MAX and MIN so that they are too similar. Although the rainfall output deferred more, specifically in October, it may be because of missing values of P that negatively impact the model performance [1].
The performance of the SDSM model is examined using R, R2, RMSE, NSE, and MAE indices (see Table 4). The assessment of these indices indicates that the model performs well for downscaling the MAX, MIN, and P. The lower values of MAE (0.06–1.6) and RMSE (0.09–2.11), and upper values of R (>0.85), R2 (>0.74), and NSE (>0.50) values for the validation period reveal that the simulating data of MAX, MIN, and P is acceptable.

3.2. Long-Term Projections of Agro-Climatic Indicators

After validation, we generate future climate change scenarios by downscaling CanESM2 outputs. The future climatic parameters are extracted for a future period (2050s) under the RCP 4.5 and 8.5. Then, to identify the consequences of climate change on the potato yield, agro-climate indicators are evaluated for the 2050s. Finally, these indicators are compared with the base period (1981–2010) at the selected synoptic stations. These indicators are the minimum and maximum temperature of potato growth season and precipitation of potato growth season.
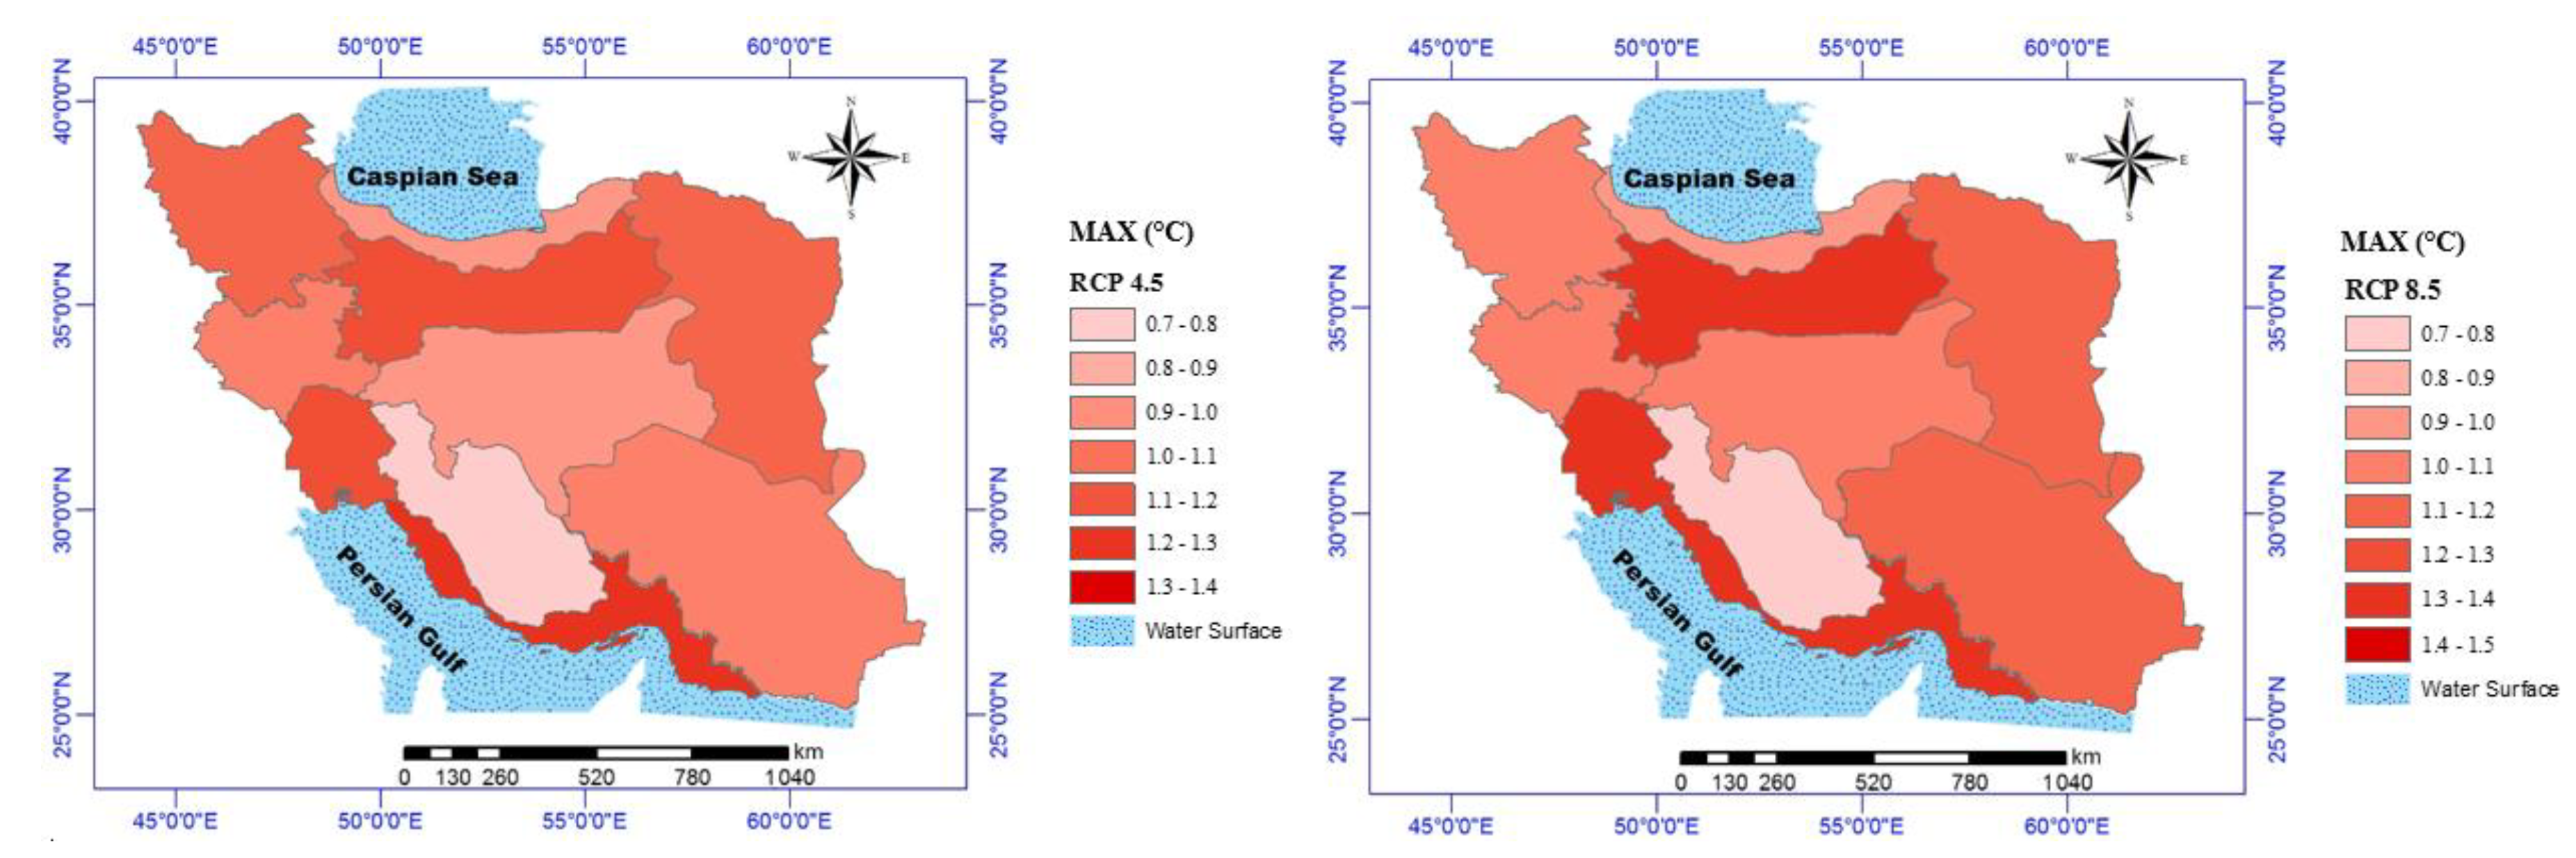
As can be seen in Figure 7, the mean MAX of potato growth season under RCP 4.5 would be increased by 1.31 °C in the 2050s, above the baseline period, among all the zones. The increases in this index under the RCP 8.5 scenario would be 1.41 °C in the 2050s, compared to the baseline period, among all AEZs. The present research is the first time to model CMIP5 under RCP scenarios to these zones. However, these outcomes are consistent with a growing trend for the current century.
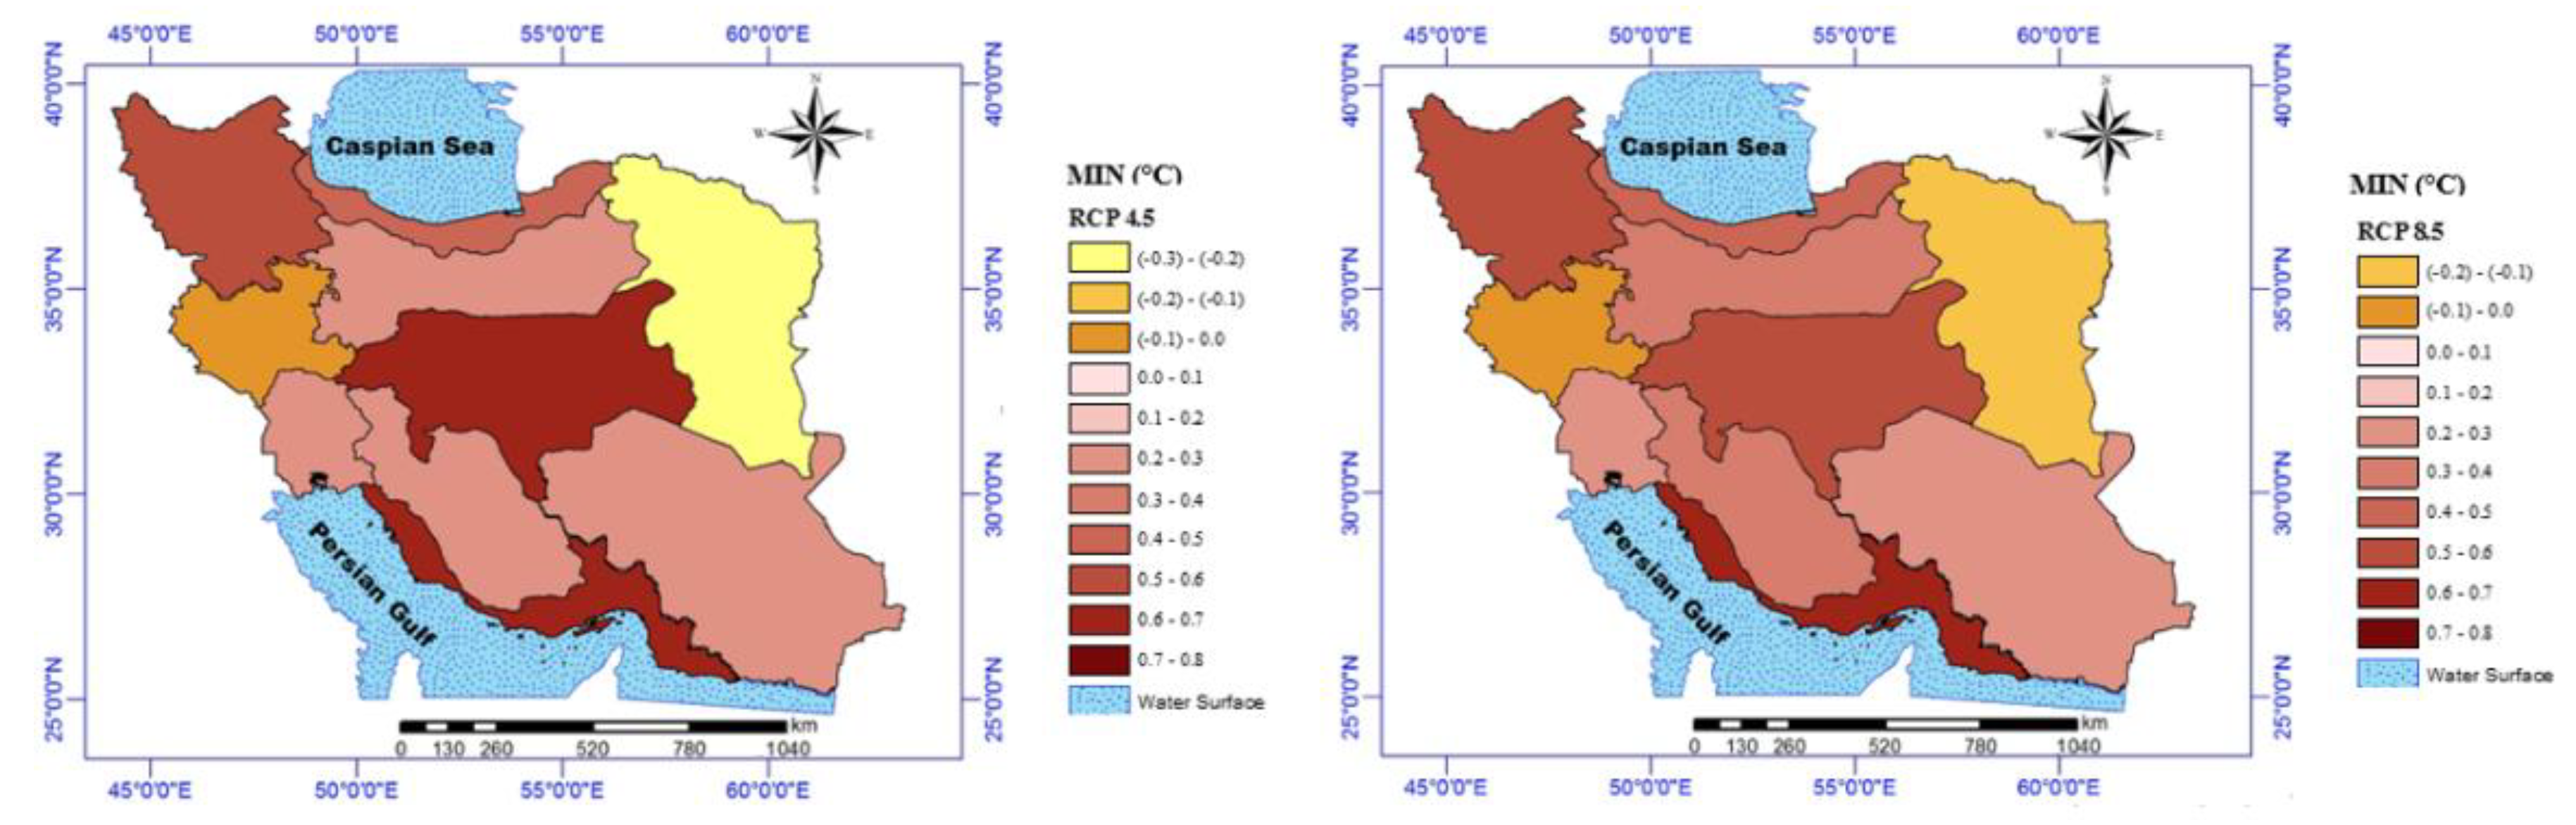
The outcomes indicated a −0.23 to 0.75 °C change, with respect to baseline, in the mean MIN of potato growth season under three RCP 4.5, among all periods. Under the RCP 8.5 scenario, the range of changes will be from −0.15 to 0.63 °C in the 2050s, compared to the baseline period. In total, this index would be increased in most of the zones (see Figure 8). The percentage changes in MAX and MIN of potato growing season under different RCPs for the 2050s, compared to the base period, are shown in Table 5.
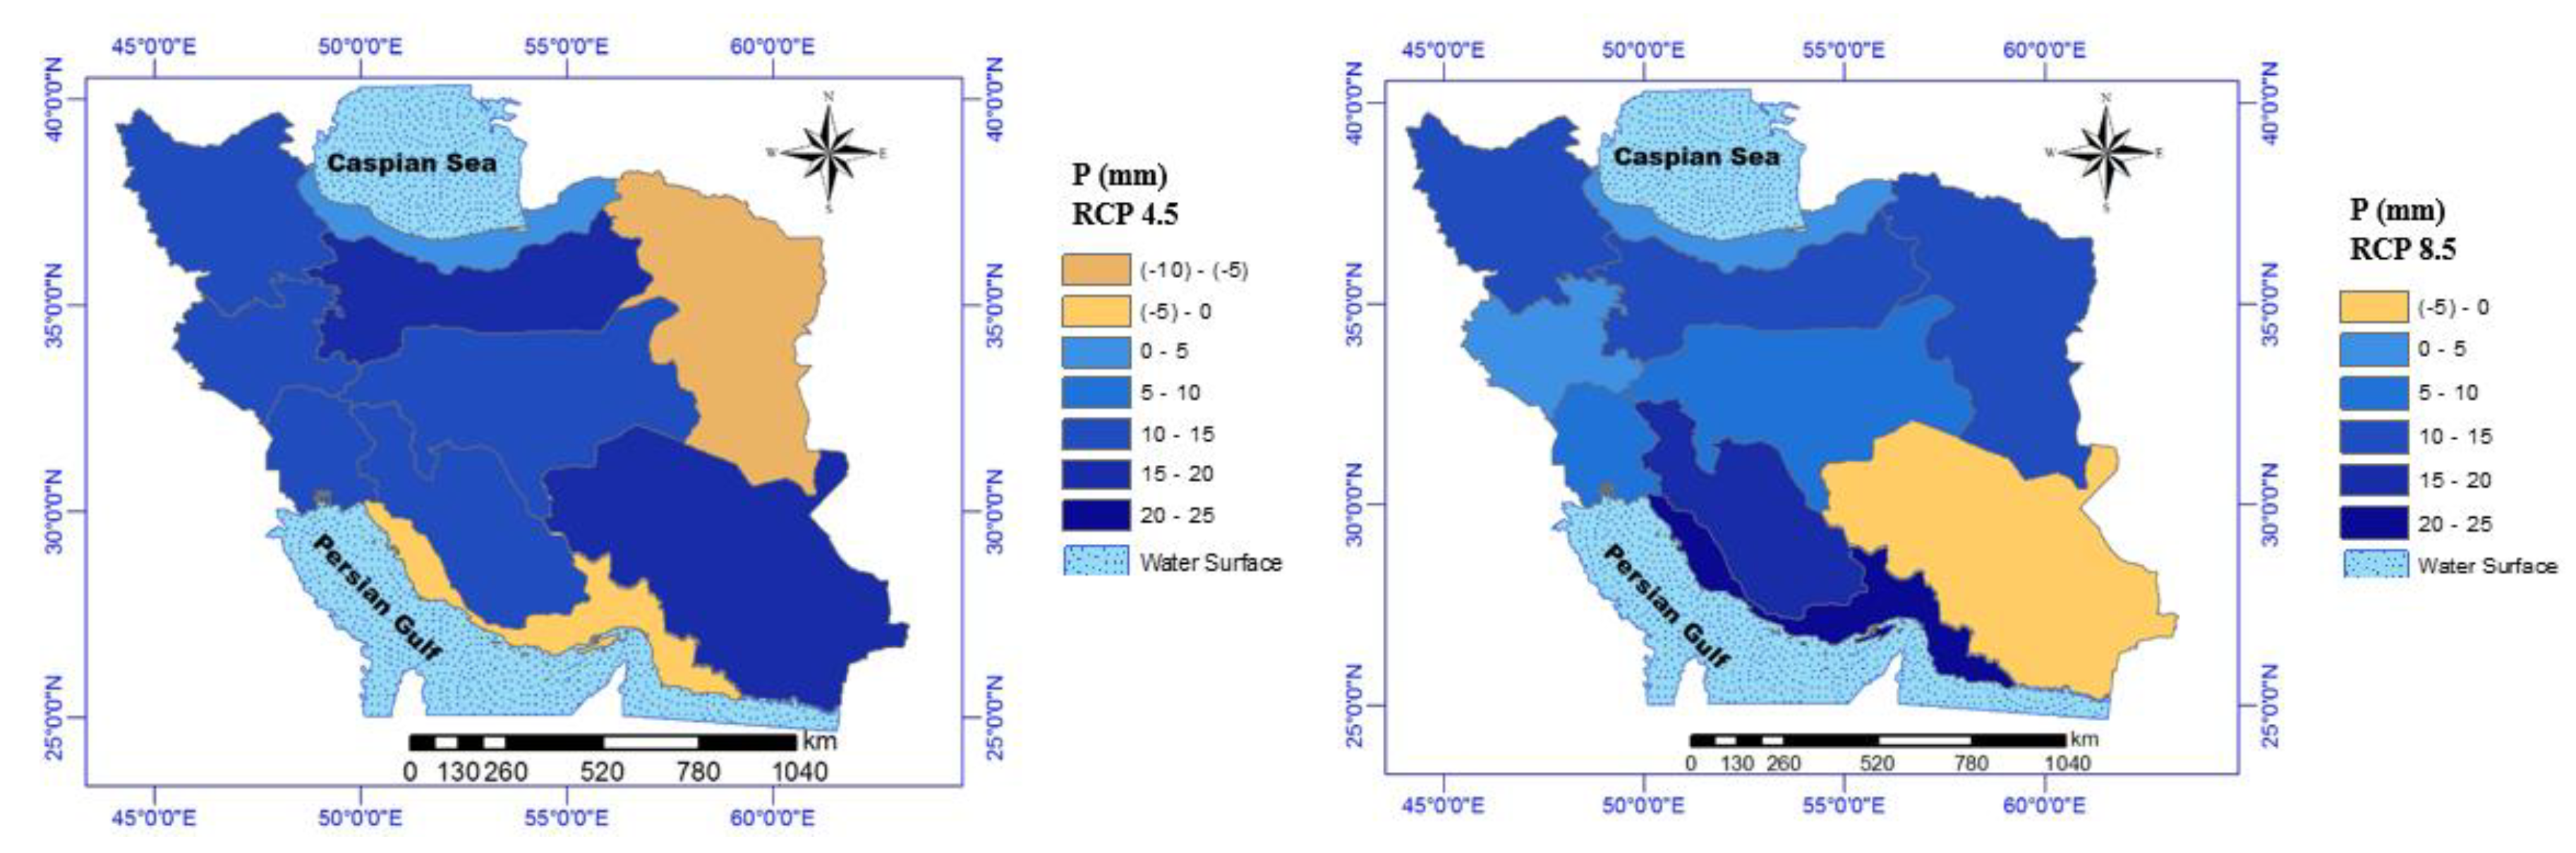
The percentage change in P of potato growing season under different RCPs for the 2050s, compared to the base period, are presented in Table 5. For the RCP 4.5, the mean P for potato growth season would be varied from −5.62 to 20.02%, among all zones in the 2050s. Under RCP 8.5, the range of changes would be between −4.50 and 24.06% in the 2050s period (see Figure 9).

3.3. Pre-Estimation Specification Tests

Prior to applying the data for the Just-Pope model, we examine the stationarity of the data using the ADF-Fisher-type and Levin, Lin, and Chu (LLC) tests, following the argument made by Poudel and Kotani [84] and Sarker et al. [83]. The outcomes of both tests were reported in Table 6. Results implied that the variables are stationary for all equations.
Then, the Breusch-Pagan-Godfrey and White heteroscedasticity tests are used to determine whether the variance of residuals is dependent on the values of independent variables. The results of these tests indicate that the null hypothesis of homoscedasticity is rejected (see Table 7). Therefore, we proceeded with the Just-Pope model. Finally, the Hausman test is employed to determine that the random or fixed-effects model should be used. The results of the Hausman test reveals that the fixed-effect model is better (Table 7).

3.4. Econometric Model

The FGLS estimation procedure is performed to estimate parameters of average yield function under QFF and CDFF, as well as parameters of yield variance function under CDFF. Regional dummy variables are included in the average yield functions, but not in the yield variance functions. In order to avoid the dummy variable trap, the number of dummy variables is considered one less than the number of categories [85]. The outcomes of mean yield and its variance estimations for three potato crops are shown in Table 8 and Table 9.

3.4.1. Impact of Climatic Change on Potato Mean Yield and Its Variability under QFF

The results in Table 8 indicate that MIN is positively and significantly related to the mean yield of spring potato. The negative sign on the P indicates that an increase in P declines the potato yield. The negative connection between potato yield and MAX uncovered by the current study is in line with the results of Kumar et al. [86], Srivastava et al. [87], Vashisht et al. [88], and Resop et al. [89]. In fact, a higher temperature can lead to decreased leaf area and increased senescence rate, a shortened growing period, consequently, a decrease in potato yield [89]. Quadratic terms for both MAX and P variables are insignificant with positive effects on average yield. Another quadratic term has a positive impact on mean yield. The interaction of MIN with P is positively and significantly associated with mean yield while the other interaction terms are negatively and insignificantly related to mean yield. On the other hand, all regional dummy variables have a positive and significant effect on average yield except the Caspian Coastal plain zone. The trend variable as a proxy for technological advances increases average yield as expected. This finding indicates that potato yield rises over time due to technological progress such as increased use of fertilizer and using better seed. The result is in agreement with the findings of Isik and Devadoss [80], Sarker et al. [13], and Sinnarong et al. [15]. The regression coefficients for yield risk reveals that a rise in P and MIN contributes positively to yield variability. In contrast, the link between MAX and yield risk is negative. The time trend variable is positively and significantly associated with yield risk. This finding is consistent with the finding of Chen et al. [8], and Kumar et al. [86].
P and MIN are positively and significantly correlated with the average yield of the summer potato while the effect of MAX on the average yield is negative with statistical significance. No quadratic or interaction variables are significant excluding the quadratic term of MAX. The regional dummy variable has a negative and significant effect on the average yield. The time trend variable is negatively associated with the average summer potato yield. In terms of the yield variability, the impacts of MAX, MIN, and P on yield risk of the summer potato are negative. The time trend variable has a positive and significant effect on yield risk.
The impact of the MAX variable on the average yield of winter potato is negative and significant. On the contrary, MIN has a positive and significant effect on mean yield. P is negatively related to the average yield, whereas, the relative effect of time trend is positive and significant on mean yield. None of the three quadratic terms are significant except for the quadratic term of MAX. On the other hand, all of the interactions are insignificant statistically excluding the interaction of MAX with MIN. All of the regional dummy variables are positively related to the average yield. From the viewpoint of the yield risk, the impacts of P and MIN on yield variance of the winter potato are positive and significant while that of MAX is negative and significant. Finally, the time trend variable is positively related to yield risk.

3.4.2. Impact of Climatic Change on Potato Mean Yield and Its Variability under CDFF

The results in Table 9 indicate that P is negatively and significantly related to the average yield of spring potato. The negative sign on the MAX indicates that a higher mean of MAX declines the potato yield. MIN is positively and significantly related to the average yield of spring potato. On the other hand, all regional dummy variables are negatively associated with the average yield. The regression coefficients for yield risk reveals that a rise in P and MAX contributes negatively to yield risk. Meanwhile, the relationship between MIN and yield risk is positive. The time trend variable has a negative effect on yield risk. This result is in line with the results of Chen et al. [8] and Kumar et al. [86].
The MAX has an adverse and significant impact on the average yield of the summer potato. P and MIN are negatively and insignificantly correlated with the average yield. The regional dummy variable is negatively and significantly associated with the average yield. The trend variable positively and significantly contributes to the average summer potato yield. In terms of the yield risk, the impacts of P and MAX on the yield risk of the summer potato are negative. These results imply that P and MAX are risk-decreasing factors while MIN is risk-increasing inputs. The trend variable has an adverse and significant effect on yield risk.
The impacts of the MAX and P variables on the average yield of the winter potato are negative and significant. Conversely, MIN has a positive and significant effect on mean yield. The relative effect of time trend is positive and significant on average yield. All of the regional dummy variables are positively and significantly related to average yield. From the viewpoint of the yield variability, the impacts of MAX and Trend on yield variance of the winter potato are negative. Increasing the MIN and P raise the yield risk of the winter potato. These findings demonstrate that yield risk is negatively influenced by MAX and positively influenced by P and MIN.

3.5. Elasticities of Climate Variables

Elasticities enable us to analyze and compare the impacts of climatic parameters in either production function. The coefficients of MAX, MIN, and P were translated into elasticities by multiplying them by the mean of the weather parameter and dividing by the mean yield [13]. The estimated elasticities of weather variables are presented in Table 10.
The elasticity values of MAX range between −2.23 and 6.60 and between −6.79 and 3.48 in average yield and yield variability functions, respectively. The results indicate that an increase in MAX declines the yield variability of spring, summer, and winter potato crops in the QFF and the yield variability of winter potato in CDFF, while it increases the yield variability of spring and summer potato crops in the CDFF. The estimated elasticities of the yield variability for all potato crops are greater than unity and thus are considered elastic. From the viewpoint of the average yield, a rise in MAX decreases the average yield of potato crops in either production functional form. The estimated elasticities of the average yield are elastic for the spring, summer, and winter potato crops are inelastic. Overall, these findings lead to the conclusion that MAX is mostly a yield-decreasing and risk-decreasing factor.
The elasticities of MIN vary from −0.39 to 3.48 in the yield variability functions, and that for mean yield, functions vary from −0.06 to 1.58. The sign of the elasticities indicates that MIN increases the yield risk for spring and winter potato crops in QFF and CDFF but declines the yield risk for the summer potato in CDFF.
The elasticities of P range between −0.22 and 0.25 and between −0.42 and 0.16 in the yield variability and mean yield functions, respectively. As these values are less than one, the response of yield average and variability of spring, summer, and winter potato crops to the changes in the precipitation is inelastic in both production functional forms. A rise in P reduces the variance of summer potato in both forms that imply it is a risk-decreasing factor, whereas P for winter potato is a risk-increasing input. P for spring potato is a risk-increasing input in QFF and a risk-decreasing input in the CDFF.

3.6. Forecast Potato Yield and Yield Risk under Climate Scenarios

The changes in potato yield and yield risk under future climate change are gauged by the results of the two last steps (percentage changes in climatic parameters and the elasticity values). The percentage changes in potato yield and yield risk in QFF and CDFF for each AEZ under RCP 4.5 and 8.5 scenarios in the 2050s, as compared to the baseline period, are presented in Figure 10, Figure 11, Figure 12 and Figure 13.
It is very clear from 
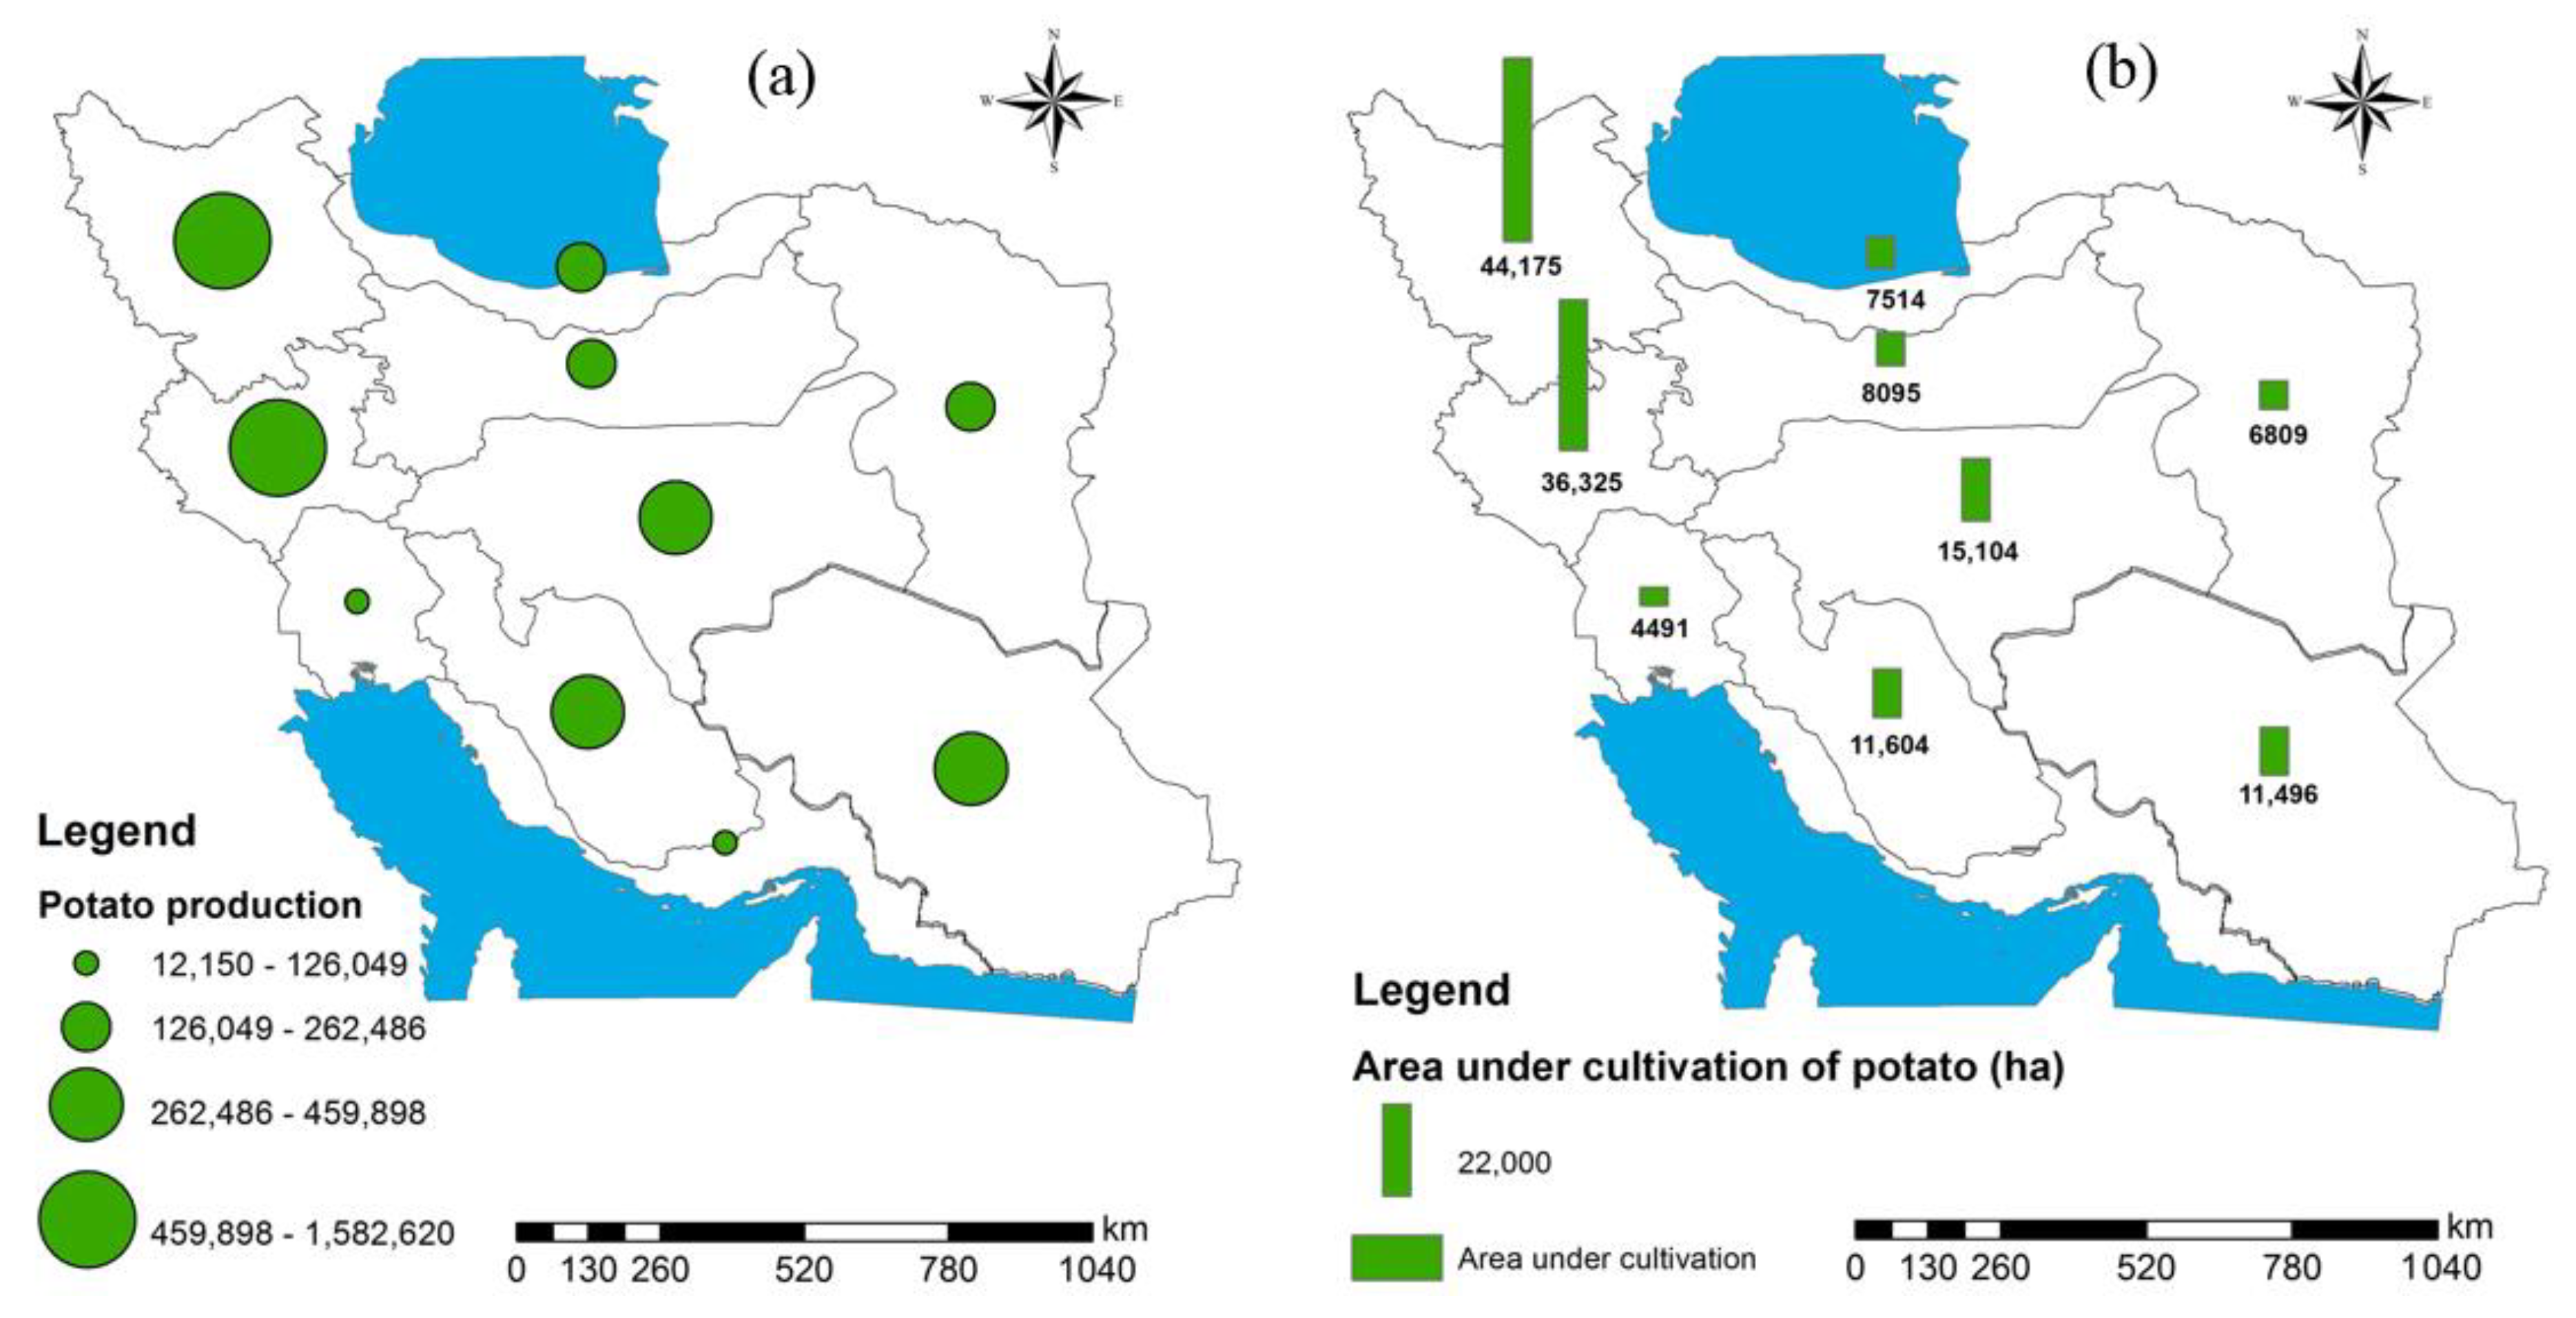
Figure 10 that under the QFF, climate scenarios would decrease the average yield of AEZ-3, 5, 7, and 9 during the 2050s, with respect to the baseline period. Whereas, AEZ-3, 5, and 9 are susceptible to experience the changes of average yield below −6% and are anticipated to emerge as high vulnerable zones by the end of the 2050s. It is important to note that out of these zones, AEZ-3 is the second-largest potato producer in Iran (see Figure 3a). AEZ-1, 2, 4, 6, 8, and 10 are expected to have an increase in mean yield under two scenarios. These findings lead to the conclusion that yield in relatively more AEZs is predicted to increase under different RCP scenarios during 2041–2070.
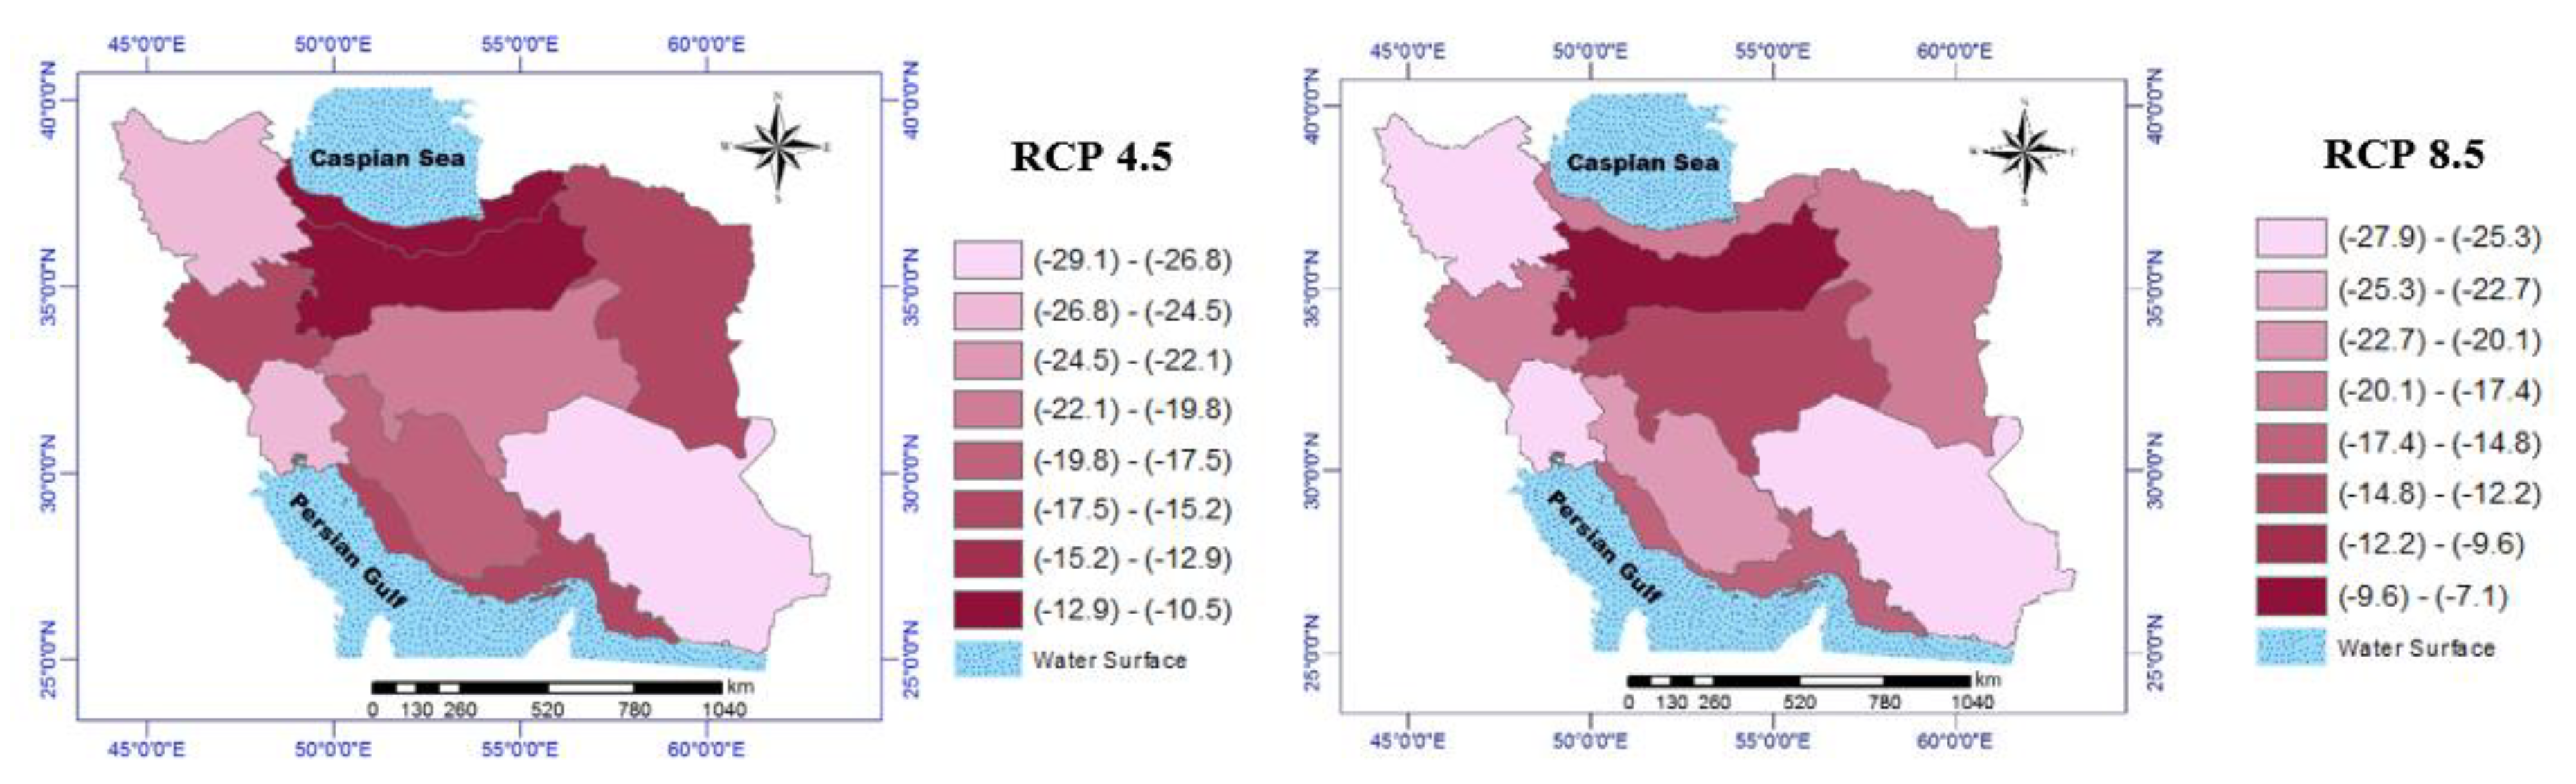
In QFF, the potato yield variance appears to be decreasing in all the AEZs under two RCPs in the 2050s (see Figure 11). Variance changes will vary from −10.5 to −29.1%, and from −7.1 to −27.9% in the RCP 4.5 and 8.5 scenarios, respectively.
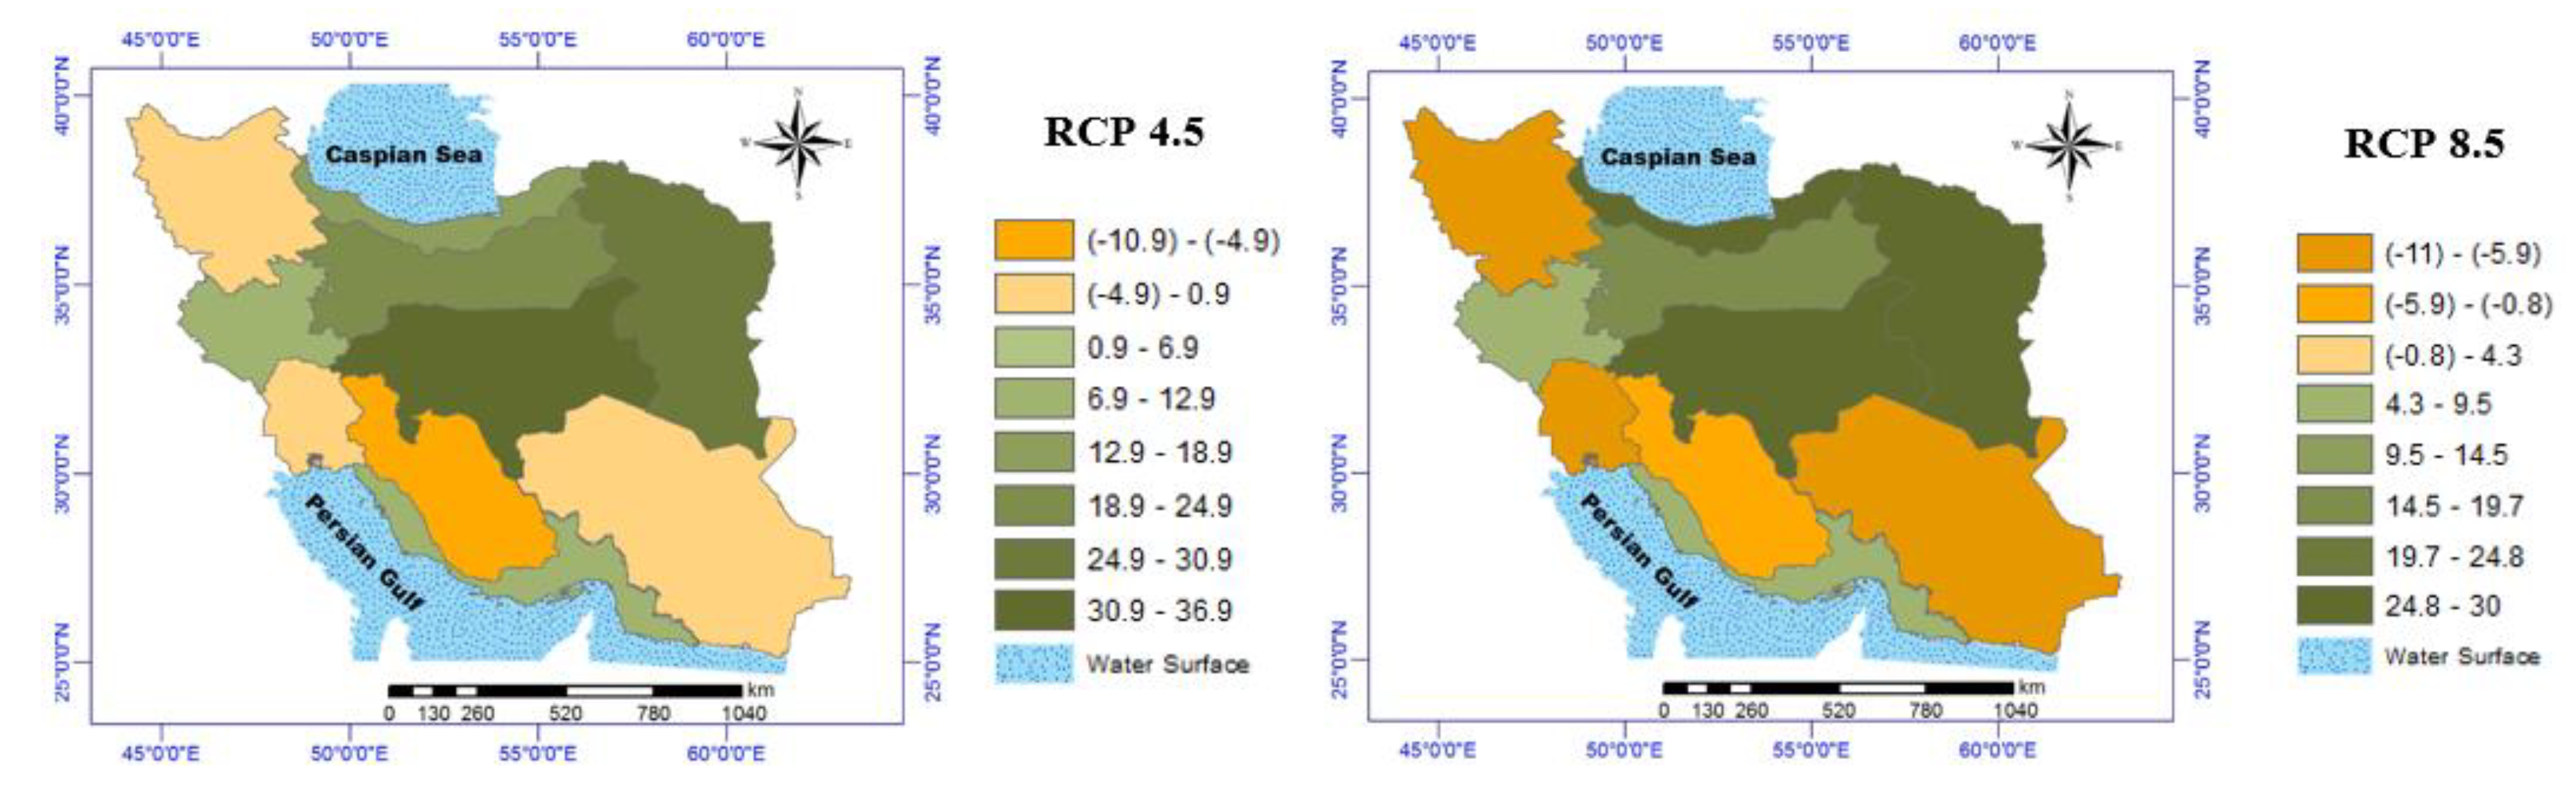
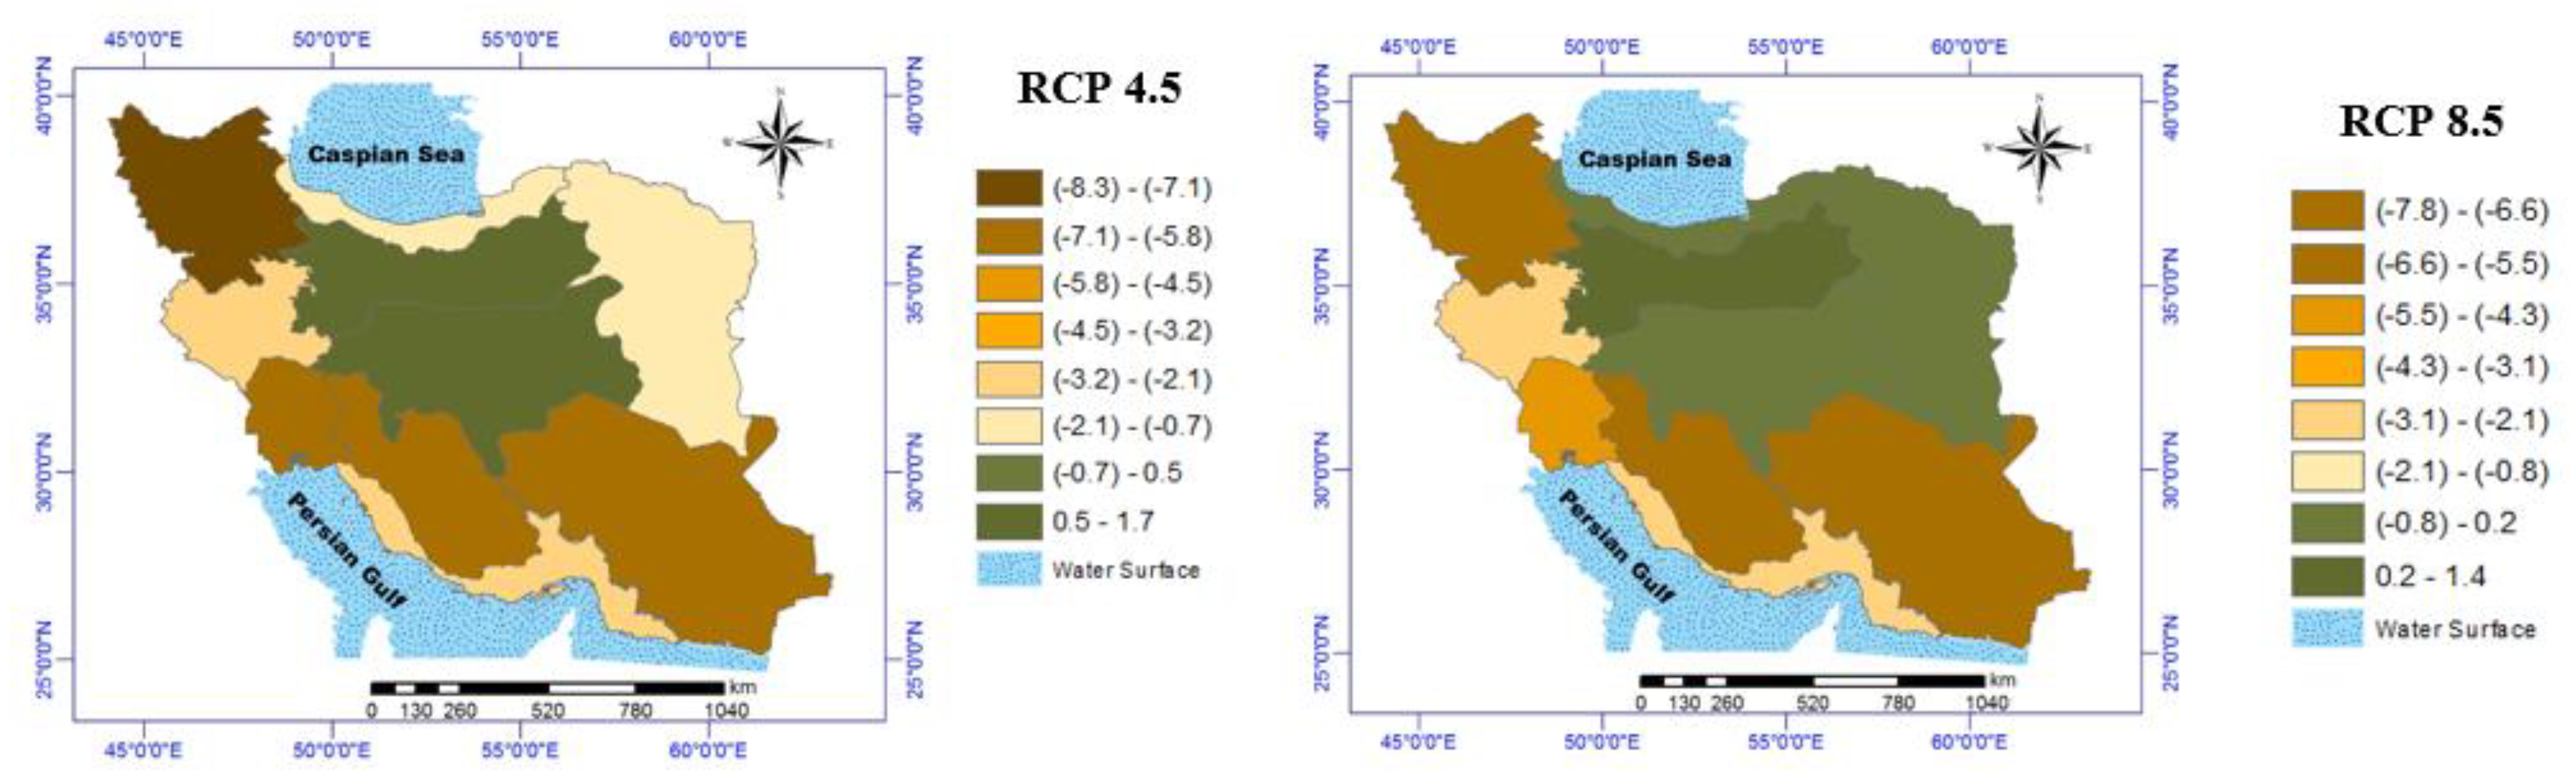
The results imply that under CDFF, the mean yield for AEZ-3, 4, 5, 7, 8, and 9 would fall in response to two future climate scenarios in the 2050s (see Figure 12). Out of these zones, AEZ-3 and 4 are the major potato producing zones in Iran. It should be noted that AEZ-3 is prone to experience a decrease in mean yield around 8.3% and it is expected to emerge as a highly vulnerable zone by the 2050s. As can be seen in Figure 12, the average yield in AEZs which are in eastern (AEZ-10), northern (AEZ-1), and central (AEZ-2 and 6) parts of Iran are expected to increase a maximum of about 1.4% in response to RCP 8.5 scenario by the end of 2050s. In total, mean yield changes would vary from −8.3 to 1.7% and −7.8 to 1.4% in the RCP 4.5 and 8.5, respectively.
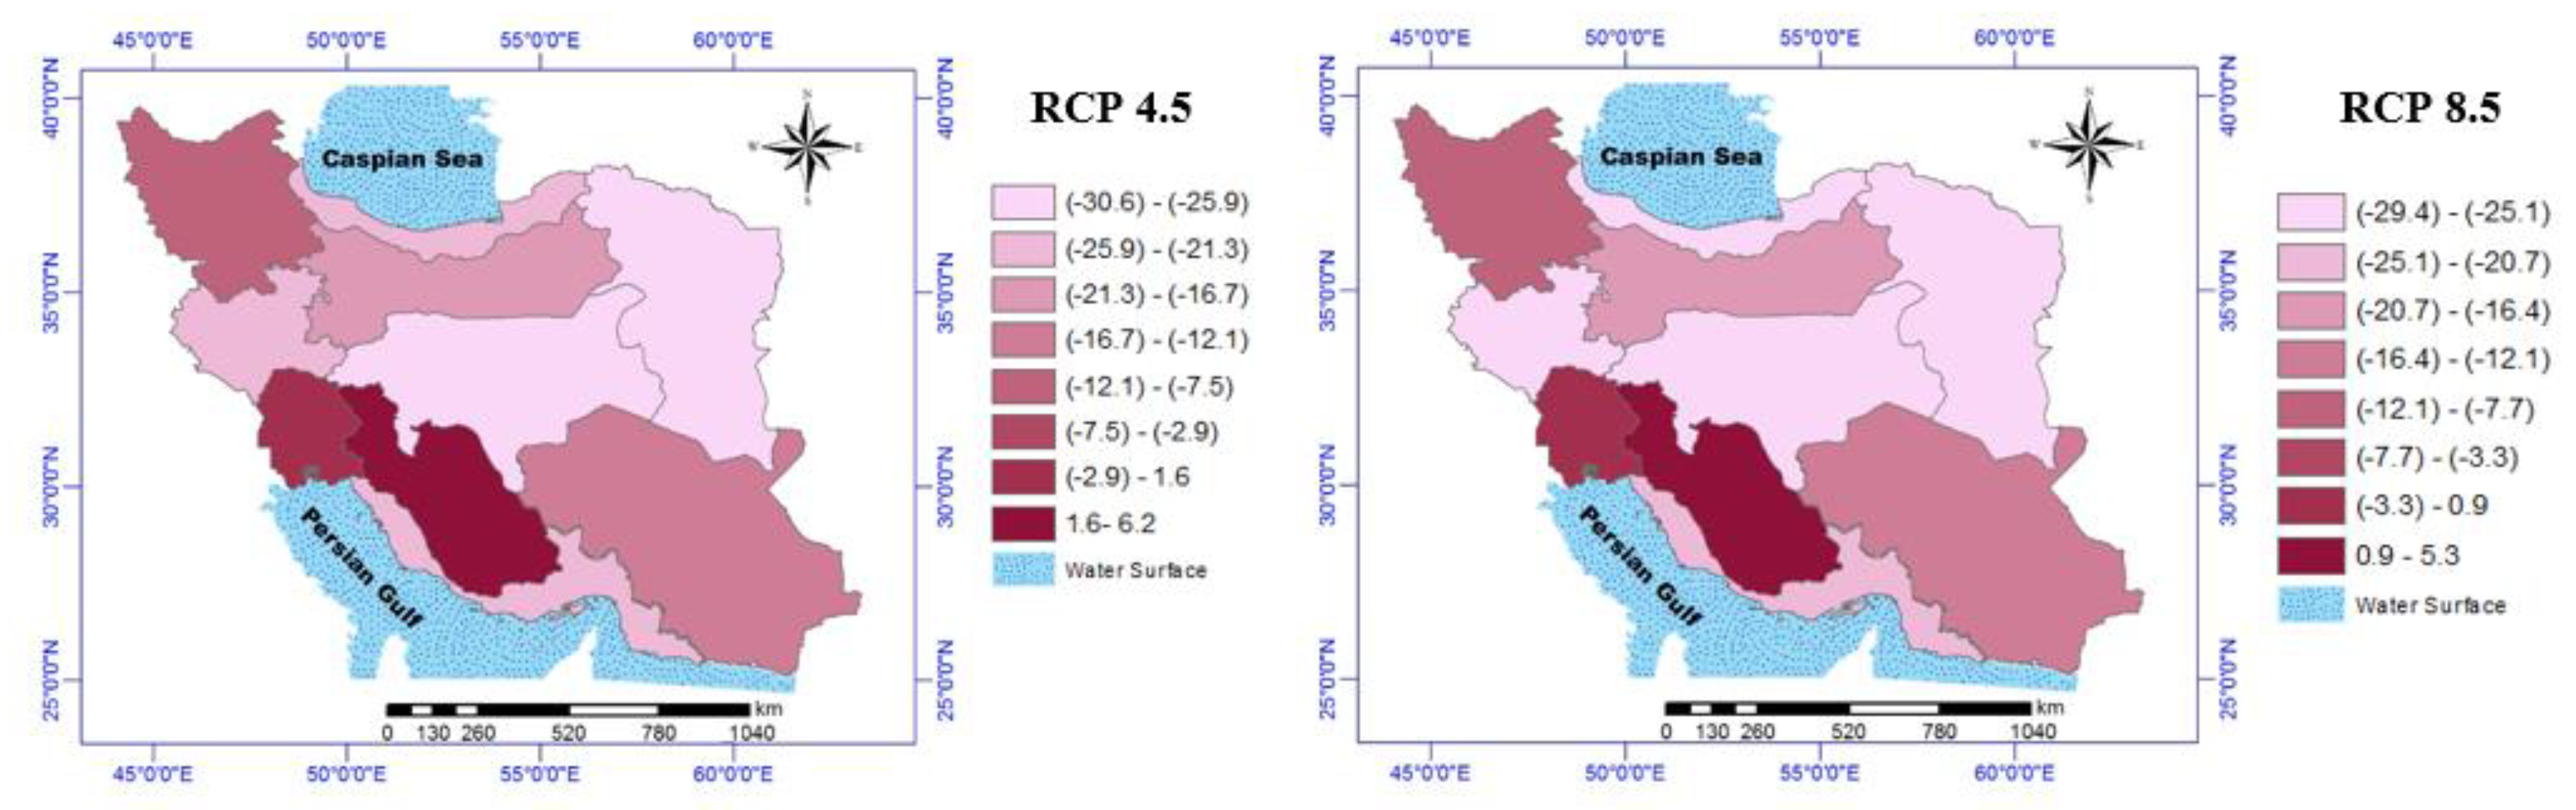
From the viewpoint of the yield risk, under the RCP 4.5 and 8.5 scenarios, the variance of yield relatively more AEZs (AEZ-1, 2, 3, 4, 6, 8, 9, and 10) would evolve as decreasing in the 2050s with respect to the baseline period. Figure 13 indicates that the yield risk of the rest of the zones is predicted to increase a maximum of almost 6.2% under different climate scenarios.

4. Conclusions and Policy Implications

The main purpose of this study was to evaluate the effects of climatic change on potato yield and its variability in the agro-ecological zones of Iran during 2041–2070 (2050s). To achieve this aim, the SDSM model was performed to downscale the CanESM2 outputs, and to project the local climate parameters for the potato growing season under two emission scenarios (RCP 4.5 and 8.5) for the future period. Then, we applied the Just-Pope production function in the context of the panel data model to estimate the effects of climatic change on potato average yield and yield variability.
Evaluating the effect of future climate conditions on potato mean yield implied that the negative impacts of climatic change on mean yield are forecasted in AEZ-3, 5, 7, and 9 for RCP scenarios in the 2050s under the QFF and CDFF. It is worth noting that AEZ-3 is the largest potato producer in Iran and it would face a decline in mean potato yield. AEZ-3 is susceptible to experiencing a decrease in mean yield of around 8.3% and 11% under RCP 4.5 and 8.5, respectively, and it is predicted to emerge as a highly vulnerable zone in the 2050s. The average yield in other AEZs is forecasted to increase by a maximum of almost 36.9% in response to climatic scenarios by the end of this period. In terms of the yield variability, under the RCP 4.5 and 8.5 scenarios, the yield variability of more AEZs (AEZ-1, 2, 3, 4, 6, 7, 8, and 10) would evolve to decrease in the 2050s.
These results provided considerable evidence regarding the potential yield losses that would occur under future climatic change. Furthermore, the majority of the regional dummy variables were significantly related to potato mean yield, whereas their impacts were different in various spatial positions. This revealed the fact that climatic change affected various agro-ecological zones differently. Consequently, the severity of climatic change impacts on potato yield would vary among these zones. This certifies the requirement for further location-specific studies on climatic change and crop production. Although the findings of the present study provide a comprehensive insight into the impact of climate change on potato yield, other factors affecting production can be considered for future studies. One of the important aspects of future studies could be considering agricultural land-use changes and crop production changes in AEZs of Iran due to climatic change.
Our findings have significant implications on the design of policies related to appropriately allocating the lands under potato cultivation among different agro-ecological zones. Moreover, the results recommend that ecological zone-specific adaptation strategies be adopted to mitigate the decrease in potato yield and meet food security in the presence of climatic change. Overall, the outcomes based on CanESM2 and different scenarios used in the study could be very insightful for deep analysis related to food security to ensure the mitigation of risk on the agricultural sector, especially on staple foods such as potato.

Author Contributions

Conceptualization, S.S., and N.S.F.; methodology, S.S.; software, S.S.; validation, S.S., S.R.H., M.S.S., and N.S.F.; formal analysis, S.S.; investigation, S.S.; resources, S.S., S.R.H., and N.S.F.; data curation, S.S.; writing—original draft preparation, S.S.; writing—review and editing, S.S., S.R.H., N.S.F., and M.S.S.; supervision, N.S.F., M.S.S., and S.R.H. All authors have read and agreed to the published version of the manuscript.

Funding

This research received no external funding.

Conflicts of Interest

The authors declare no conflict of interest.

References

  1. Shayanmehr, S.; Henneberry, R.S.; Sabouni, M.S.; Foroushani, N.S. Drought, climate change, and dryland wheat yield response: An econometric approach. Int. J. Environ. Res. Public Health 2020, 17, 5264. [Google Scholar] [CrossRef] [PubMed]
  2. Sarker, M.A.R.; Alam, K.; Gow, J. Exploring the relationship between climate change and rice yield in Bangladesh: An analysis of time series data. Agric. Syst. 2012, 112, 11–16. [Google Scholar] [CrossRef]
  3. Kohansal, M.R.; Shayanmehr, S. The interplay between energy consumption, economic growth and environmental pollution: Application of spatial panel simultaneous-equations model. Iran. Energy Econ. 2016, 19, 179–216. [Google Scholar]
  4. Anjum, S.A.; Farooq, M.; Xie, X.-Y.; Liu, X.-J.; Ijaz, M.F. Antioxidant defense system and proline accumulation enables hot pepper to perform better under drought. Sci. Hortic. 2012, 140, 66–73. [Google Scholar] [CrossRef]
  5. Falco, S.D.; Adinolfi, F.; Bozzola, M.; Capitanio, F. Crop insurance as a strategy for adapting to climate change. J. Agric. Econ. 2014, 65, 485–504. [Google Scholar] [CrossRef]
  6. Dey, M.M.; Gosh, K.; Valmonte-Santos, R.; Rosegrant, M.W.; Chen, O.L. Economic impact of climate change and climate change adaptation strategies for fisheries sector in Solomon Islands: Implication for food security. Mar. Policy 2016, 67, 171–178. [Google Scholar] [CrossRef]
  7. Ahmadi, H.; Ghalhari, G.F.; Baaghideh, M. Impacts of climate change on apple tree cultivation areas in Iran. Clim. Chang. 2019, 153, 91–103. [Google Scholar] [CrossRef]
  8. Chen, C.-C.; McCarl, B.A.; Schimmelpfennig, D.E. Yield variability as influenced by climate: A statistical investigation. Clim. Chang. 2004, 66, 239–261. [Google Scholar] [CrossRef] [Green Version]
  9. Chen, C.C.; Chang, C.C. The impact of weather on crop yield distribution in Taiwan: Some new evidence from panel data models and implications for crop insurance. Agric. Econ. 2005, 33, 503–511. [Google Scholar] [CrossRef]
  10. De-Graft, A.H.; Kweku, K.C. The effects of climatic variables and crop area on maize yield and variability in Ghana. Russ. J. Agric. Socio-Econ. Sci. 2012, 10, 10–13. [Google Scholar]
  11. Bozzola, M.; Massetti, E.; Mendelsohn, R.; Capitanio, F. A Ricardian analysis of the impact of climate change on Italian agriculture. Eur. Rev. Agric. Econ. 2018, 45, 57–79. [Google Scholar] [CrossRef] [Green Version]
  12. Wei, T.; Cherry, T.L.; Glomrød, S.; Zhang, T. Climate change impacts on crop yield: Evidence from China. Sci. Total Environ. 2014, 499, 133–140. [Google Scholar] [CrossRef] [PubMed] [Green Version]
  13. Sarker, M.A.R.; Alam, K.; Gow, J. Assessing the effects of climate change on rice yields: An econometric investigation using Bangladeshi panel data. Econ. Anal. Policy 2014, 44, 405–416. [Google Scholar] [CrossRef]
  14. Azad, N.; Behmanesh, J.; Rezaverdinejad, V.; Rezaie, H.T. Climate change impacts modeling on winter wheat yield under full and deficit irrigation in Myandoab-Iran. Arch. Agron. Soil Sci. 2018, 64, 731–746. [Google Scholar] [CrossRef]
  15. Sinnarong, N.; Chen, C.-C.; McCarl, B.; Tran, B.-L. Estimating the potential effects of climate change on rice production in Thailand. Paddy Water Environ. 2019, 4, 1–9. [Google Scholar] [CrossRef]
  16. Chavas, J.-P.; Di Falco, S.; Adinolfi, F.; Capitanio, F. Weather effects and their long-term impact on the distribution of agricultural yields: Evidence from Italy. Eur. Rev. Agric. Econ. 2019, 46, 29–51. [Google Scholar] [CrossRef]
  17. Araghi, A.; Mousavi-Baygi, M.; Adamowski, J. Detecting soil temperature trends in Northeast Iran from 1993 to 2016. Soil Tillage Res. 2017, 174, 177–192. [Google Scholar] [CrossRef]
  18. Tavana, A.; Javid, A.E.; Houshfar, E.; Andwari, A.M.; Ashjaee, M.; Shoaee, S.; Maghmoomi, A.; Marashi, F. Toward renewable and sustainable energies perspective in Iran. Renew. Energy 2019, 139, 1194–1216. [Google Scholar] [CrossRef]
  19. Bannayan, M.; Sanjani, S.; Alizadeh, A.; Lotfabadi, S.S.; Mohamadian, A. Association between climate indices, aridity index, and rainfed crop yield in northeast of Iran. Field Crop. Res. 2010, 118, 105–114. [Google Scholar] [CrossRef]
  20. Mortazavi, S.A.; Hezareh, R.; Ahmadi Kaliji, S.; Shayan Mehr, S. Application of linear and non-linear programming model to assess the sustainability of water resources in agricultural patterns. Int. J. Agric. Manag. Dev. 2014, 4, 27–32. [Google Scholar]
  21. Radmehr, R.; Ghorbani, M.; Kulshreshtha, S. Selecting strategic policy for irrigation water management (case study: Qazvin plain, Iran). J. Agric. Sci. Technol. 2020, 2, 579–593. [Google Scholar]
  22. Radmehr, R.; Ghorbani, M.; Ziaei, A.N. Quantifying and managing the water-energy-food nexus in dry regions food insecurity: New methods and evidence. Agric. Water Manag. 2020, 1, 1–19. [Google Scholar] [CrossRef]
  23. Radmehr, R.; Shayanmehr, S. The determinants of sustainable irrigation water prces in Iran. Bulg. J. Agric. Sci. 2018, 24, 893–919. [Google Scholar]
  24. Hezareh, R.; Hassani, U.; Shayanmehr, S. The impact assessment of different agricultural sector policies on its productivity indicators in Qazvin plain. Iran. Water Res. J. 2017, 10, 73–83. [Google Scholar]
  25. Nourollahi, F.; Mohammaddoust-Chamanabad, H.; Hassanpanah, D.; Anvar, M. Evaluating the competitive ability of potato cultivars with weeds. Appl. Ecol. Environ. Res. 2019, 17, 8835–8845. [Google Scholar] [CrossRef]
  26. Ahmadi, H.; Asadi, S.; Moradkhani, H. Spatial distribution and deviation from optimum temperature conditions of phenological stages of potato cultivation in West Azerbaijan. Int. J. Environ. Sci. Technol. 2019, 16, 3523–3538. [Google Scholar] [CrossRef]
  27. Siebring, J. Emulating Vision: An Object-Based Image Analysis Approach to Trait Retrieval of Potato Plants; Wageningen University & Research: Wageningen, The Netherlands, 2018. [Google Scholar]
  28. Dadrasi, A.; Torabi, B.; Rahimi, A.; Soltani, A.; Zeinali, E. Parameterization and evaluation of a simple simulation model (SSM-iCrop2) for potato (Solanum tuberosum L.) growth and yield in Iran. Potato Res. 2020, 1, 1–19. [Google Scholar]
  29. Jaitawat, R.R.; Swain, D.K.; Bernhardt, H. Irrigation and nitrogen management for sustainable potato production under climate change scenario: A simulation study. 39. Gil-Jahrestag. Digit. Für Landwirtsch. Betr. Kleinstrukturierten Reg.-Ein Widerspruch Sich? 2019. Available online: https://dl.gi.de/handle/20.500.12116/23070 (accessed on 24 November 2020).
  30. Arora, V.; Nath, J.; Singh, C. Analyzing potato response to irrigation and nitrogen regimes in a sub-tropical environment using SUBSTOR-Potato model. Agric. Water Manag. 2013, 124, 69–76. [Google Scholar] [CrossRef]
  31. Brown, H.; Huth, N.; Holzworth, D. A potato model built using the APSIM Plant.NET Framework. In Proceedings of the 19th International Congress on Modelling and Simulation, Perth, Australia, 12–16 December 2011; pp. 12–16. [Google Scholar]
  32. Cammarano, D.; Ceccarelli, S.; Grando, S.; Romagosa, I.; Benbelkacem, A.; Akar, T.; Al-Yassin, A.; Pecchioni, N.; Francia, E.; Ronga, D. The impact of climate change on barley yield in the Mediterranean basin. Eur. J. Agron. 2019, 106, 1–11. [Google Scholar] [CrossRef]
  33. Gupta, R.; Mishra, A. Climate change induced impact and uncertainty of rice yield of agro-ecological zones of India. Agric. Syst. 2019, 173, 1–11. [Google Scholar] [CrossRef]
  34. Lobell, D.B.; Burke, M.B. On the use of statistical models to predict crop yield responses to climate change. Agric. For. Meteorol. 2010, 150, 1443–1452. [Google Scholar] [CrossRef]
  35. Lone, B.A.; Tripathi, S.; Fayaz, A.; Singh, P.; Qayoom, S.; Kumar, S.; Dar, Z.A. Simulating the impact of climate change on growth and yield of maize using CERES-Maize model under temperate kashmir. Curr. J. Appl. Sci. Technol. 2019, 1, 1–11. [Google Scholar] [CrossRef] [Green Version]
  36. Doğan, H.G.; Kan, A. The effect of precipitation and temperature on wheat yield in Turkey: A panel FMOLS and panel VECM approach. Environ. Dev. Sustain. 2019, 21, 447–460. [Google Scholar] [CrossRef]
  37. Hasanthika, W.; Edirisinghe, J.; Rajapakshe, R. Climate variability, risk and paddy production. J. Environ. Prof. Sri Lanka 2014, 2, 57–65. [Google Scholar] [CrossRef] [Green Version]
  38. Mahmood, N.; Arshad, M.; Kächele, H.; Ma, H.; Ullah, A.; Müller, K. Wheat yield response to input and socioeconomic factors under changing climate: Evidence from rainfed environments of Pakistan. Sci. Total Environ. 2019, 688, 1275–1285. [Google Scholar] [CrossRef]
  39. Onyekuru, N.A.; Marchant, R. Assessing the economic impact of climate change on forest resource use in Nigeria: A Ricardian approach. Agric. For. Meteorol. 2016, 220, 10–20. [Google Scholar] [CrossRef]
  40. Finger, R. Modeling farmers’ adaptation to climate change–integrating a biophysical and an economic model. IOP Conf. Ser. Earth Environ. Sci. 2009, 37, 1–2. [Google Scholar] [CrossRef]
  41. Just, R.E.; Pope, R.D. Stochastic specification of production functions and economic implications. J. Econom. 1978, 7, 67–86. [Google Scholar] [CrossRef]
  42. Dam, T.H.T.; Amjath-Babu, T.; Bellingrath-Kimura, S.; Zander, P. The impact of salinity on paddy production and possible varietal portfolio transition: A Vietnamese case study. Paddy Water Environ. 2019, 4, 771–782. [Google Scholar] [CrossRef]
  43. Boubacar, I. The effects of drought on crop yields and yield variability in Sahel. In Proceedings of the Southern Agricultural Economics Association Annual Meeting, Orlando, FL, USA, 6–9 February 2010. [Google Scholar]
  44. Cabas, J.; Weersink, A.; Olale, E. Crop yield response to economic, site and climatic variables. Clim. Chang. 2010, 101, 599–616. [Google Scholar] [CrossRef]
  45. Kim, M.-K.; Pang, A. Climate change impact on rice yield and production risk. J. Rural Dev. Nongchon-Gyeongje 2009, 32, 17–29. [Google Scholar]
  46. McCarl, B.A.; Villavicencio, X.; Wu, X. Climate change and future analysis: Is stationarity dying? Am. J. Agric. Econ. 2008, 90, 1241–1247. [Google Scholar] [CrossRef]
  47. Palanisami, K.; Ranganathan, C.; Kakumanu, K.; Nagothu, U.S. A hybrid model to quantify the impact of climate change on agriculture in Godavari basin, India. Energy Environ. Res. 2011, 1, 32. [Google Scholar] [CrossRef] [Green Version]
  48. Ranganathan, C. Quantifying the impact of climatic change on yields and yield variability of major crops and optimal land allocation for maximizing food production in different agro-climatic zones of Tamil Nadu, India: An econometric approach. Res. Inst. Humanit. Nat. 2009, 1–56. [Google Scholar]
  49. Kheiri, M.; Soufizadeh, S.; Ghaffari, A.; AghaAlikhani, M.; Eskandari, A. Association between temperature and precipitation with dryland wheat yield in northwest of Iran. Clim. Chang. 2017, 141, 703–717. [Google Scholar] [CrossRef]
  50. Rezaei, E.E.; Lashkari, A. The consequences of change in management practices on maize yield under climate warming in Iran. Theor. Appl. Climatol. 2019, 137, 1001–1013. [Google Scholar] [CrossRef]
  51. Saei, M.; Mohammadi, H.; Ziaee, S.; Barkhordari, S. The impact of climate change on grain yield and yield variability in Iran. Iran. Econ. Rev. 2019, 23, 509–531. [Google Scholar]
  52. Salehnia, N.; Salehnia, N.; Ansari, H.; Kolsoumi, S.; Bannayan, M. Climate data clustering effects on arid and semi-arid rainfed wheat yield: A comparison of artificial intelligence and K-means approaches. Int. J. Biometeorol. 2019, 63, 861–872. [Google Scholar] [CrossRef]
  53. Zarei, A.R.; Shabani, A.; Mahmoudi, M.R. Comparison of the climate indices based on the relationship between yield loss of rain-fed winter wheat and changes of climate indices using GEE model. Sci. Total Environ. 2019, 661, 711–722. [Google Scholar] [CrossRef]
  54. Hajarpoor, A.; Soltani, A.; Zeinali, E.; Sayyedi, F. Simulating climate change impacts on production of chickpea under water-limited conditions. Agric. Sci. Dev. 2014, 3, 209–217. [Google Scholar]
  55. Khanlari, A. The effect of climate change on land use and Agricultural Sector Operation of Mazandaran Province. Ph.D. Thesis, University of Zabol, Zabol, Iran, 2013. [Google Scholar]
  56. Meghdadi, N.; Soltani, A.; Kamkar, B.; Hajarpoor, A. Simulating the impact of climate change on production of chickpea in Zanjan province. Electr. J. Crop Prod. 2015, 7, 1–22. [Google Scholar]
  57. Momeni, S.; Zibaei, M. The potential impacts of climate change on the agricultural sector of fars province. J. Agric. Econ. Dev. 2013, 3, 169–179. [Google Scholar]
  58. Ashraf Vaghefi, S.; Mousavi, S.; Abbaspour, K.; Srinivasan, R.; Yang, H. Analyses of the impact of climate change on water resources components, drought and wheat yield in semiarid regions: Karkheh River Basin in Iran. Hydrol. Process. 2014, 28, 2018–2032. [Google Scholar] [CrossRef]
  59. Mosammam, H.M.; Mosammam, A.M.; Sarrafi, M.; Nia, J.T.; Esmaeilzadeh, H. Analyzing the potential impacts of climate change on rainfed wheat production in Hamedan Province, Iran, via generalized additive models. J. Water Clim. Chang. 2016, 7, 212–223. [Google Scholar] [CrossRef] [Green Version]
  60. Nassiri, M.; Koocheki, A.; Kamali, G.; Shahandeh, H. Potential impact of climate change on rainfed wheat production in Iran: (Potentieller Einfluss des Klimawandels auf die Weizenproduktion unter Rainfed-Bedingungen im Iran). Arch. Agron. Soil Sci. 2006, 52, 113–124. [Google Scholar] [CrossRef]
  61. Van Wart, J.; van Bussel, L.G.; Wolf, J.; Licker, R.; Grassini, P.; Nelson, A.; Boogaard, H.; Gerber, J.; Mueller, N.D.; Claessens, L. Use of agro-climatic zones to upscale simulated crop yield potential. Field Crop. Res. 2013, 143, 44–55. [Google Scholar] [CrossRef] [Green Version]
  62. Armah, F.A.; Odoi, J.O.; Yengoh, G.T.; Obiri, S.; Yawson, D.O.; Afrifa, E.K. Food security and climate change in drought-sensitive savanna zones of Ghana. Mitig. Adapt. Strateg. Glob. Chang. 2011, 16, 291–306. [Google Scholar] [CrossRef]
  63. Arshad, M.; Amjath-Babu, T.; Aravindakshan, S.; Krupnik, T.J.; Toussaint, V.; Kächele, H.; Müller, K. Climatic variability and thermal stress in Pakistan’s rice and wheat systems: A stochastic frontier and quantile regression analysis of economic efficiency. Ecol. Indic. 2018, 89, 496–506. [Google Scholar] [CrossRef]
  64. Browne Klutse, N.A.; Owusu, K.; Adukpo, D.C.; Nkrumah, F.; Quagraine, K.; Owusu, A.; Gutowski, W.J. Farmer’s observation on climate change impacts on maize (Zea mays) production in a selected agro-ecological zone in Ghana. Res. J. Agric. Environ. Manag. 2013, 2, 394. [Google Scholar]
  65. Bunn, C.; Läderach, P.; Jimenez, J.G.P.; Montagnon, C.; Schilling, T. Multiclass classification of agro-ecological zones for Arabica coffee: An improved understanding of the impacts of climate change. PLoS ONE 2015, 10, e0140490. [Google Scholar] [CrossRef]
  66. Hochman, Z.; Gobbett, D.; Holzworth, D.; McClelland, T.; van Rees, H.; Marinoni, O.; Garcia, J.N.; Horan, H. Reprint of “Quantifying yield gaps in rainfed cropping systems: A case study of wheat in Australia”. Field Crop. Res. 2013, 143, 65–75. [Google Scholar] [CrossRef] [Green Version]
  67. Mereu, V.; Carboni, G.; Gallo, A.; Cervigni, R.; Spano, D. Impact of climate change on staple food crop production in Nigeria. Clim. Chang. 2015, 132, 321–336. [Google Scholar] [CrossRef]
  68. Seo, S.N.; Mendelsohn, R.; Dinar, A.; Hassan, R.; Kurukulasuriya, P. A Ricardian Analysis of the Distribution of Climate Change Impacts on Agriculture Across Agro-Ecological Zones In Africa. Environ. Resour. Econ. 2009, 43, 313–332. [Google Scholar] [CrossRef] [Green Version]
  69. Sommer, R.; Glazirina, M.; Yuldashev, T.; Otarov, A.; Ibraeva, M.; Martynova, L.; Bekenov, M.; Kholov, B.; Ibragimov, N.; Kobilov, R. Impact of climate change on wheat productivity in Central Asia. Agric. Ecosyst. Environ. 2013, 178, 78–99. [Google Scholar] [CrossRef]
  70. Xiong, W.; Conway, D.; Holman, I.; Lin, E. Evaluation of CERES-Wheat simulation of wheat production in China. Agron. J. 2008, 100, 1720–1728. [Google Scholar] [CrossRef]
  71. Yahaya, O.; Atanda, E.; Rodiya, A.; Okafor, M. Prediction of climate change effects on plantain yield in Ondo State, Nigeria. History 2019, 57, 65. [Google Scholar] [CrossRef]
  72. Yu, Y.; Huang, Y.; Zhang, W. Changes in rice yields in China since 1980 associated with cultivar improvement, climate and crop management. Field Crop. Res. 2012, 136, 65–75. [Google Scholar] [CrossRef]
  73. Abbaspour, K.C.; Faramarzi, M.; Ghasemi, S.S.; Yang, H. Assessing the impact of climate change on water resources in Iran. Water Resour. Res. 2009, 45, W1043. [Google Scholar] [CrossRef] [Green Version]
  74. Hashempour, Y.; Nasseri, M.; Mohseni-Bandpei, A.; Motesaddi, S.; Eslamizadeh, M. Assessing vulnerability to climate change for total organic carbon in a system of drinking water supply. Sustain. Cities Soc. 2020, 53, 101904. [Google Scholar] [CrossRef]
  75. Wilby, R.L.; Dawson, C.W.; Barrow, E.M. SDSM—A decision support tool for the assessment of regional climate change impacts. Environ. Model. Softw. 2002, 17, 145–157. [Google Scholar] [CrossRef]
  76. Zhang, Y.; You, Q.; Chen, C.; Ge, J. Impacts of climate change on streamflows under RCP scenarios: A case study in Xin River Basin, China. Atmos. Res. 2016, 178, 521–534. [Google Scholar] [CrossRef]
  77. Adham, A.; Wesseling, J.G.; Abed, R.; Riksen, M.; Ouessar, M.; Ritsema, C.J. Assessing the impact of climate change on rainwater harvesting in the Oum Zessar watershed in Southeastern Tunisia. Agric. Water Manag. 2019, 221, 131–140. [Google Scholar] [CrossRef]
  78. Dibike, Y.B.; Coulibaly, P. Hydrologic impact of climate change in the Saguenay watershed: Comparison of downscaling methods and hydrologic models. J. Hydrol. 2005, 307, 145–163. [Google Scholar] [CrossRef]
  79. Just, R.E.; Pope, R.D. Production function estimation and related risk considerations. Am. J. Agric. Econ. 1979, 61, 276–284. [Google Scholar] [CrossRef]
  80. Isik, M.; Devadoss, S. An analysis of the impact of climate change on crop yields and yield variability. Appl. Econ. 2006, 38, 835–844. [Google Scholar] [CrossRef]
  81. Tveteros, R. Production risk and productivity growth: Some findings for Norwegian salmon aquaculture. J. Product. Anal. 1999, 12, 161–179. [Google Scholar] [CrossRef]
  82. Koundouri, P.; Nauges, C. On production function estimation with selectivity and risk considerations. J. Agric. Resour. Econ. 2005, 3, 597–608. [Google Scholar]
  83. Sarker, M.A.R.; Alam, K.; Gow, J. Performance of rain-fed Aman rice yield in Bangladesh in the presence of climate change. Renew. Agric. Food Syst. 2019, 34, 304–312. [Google Scholar] [CrossRef]
  84. Poudel, S.; Kotani, K. Climatic impacts on crop yield and its variability in Nepal: Do they vary across seasons and altitudes? Clim. Chang. 2013, 116, 327–355. [Google Scholar] [CrossRef]
  85. Damodar, N. Basic Econometrics; Mc-Graw Hill Publishing, Co.: New York, NY, USA, 2004. [Google Scholar]
  86. Kumar, A.; Sharma, P.; Ambrammal, S.K. Effects of climatic factors on productivity of cash cropsin India: Evidence from state-wise panel data. Glob. J. Res. Soc. Sci. 2015, 1, 9–18. [Google Scholar]
  87. Srivastava, R.; Talla, A.; Swain, D.; Panda, R. Quantitative approaches in adaptation strategies to cope with increased temperatures following climate change in potato crop. Potato Res. 2019, 62, 175–191. [Google Scholar] [CrossRef]
  88. Vashisht, B.; Nigon, T.; Mulla, D.; Rosen, C.; Xu, H.; Twine, T.; Jalota, S. Adaptation of water and nitrogen management to future climates for sustaining potato yield in Minnesota: Field and simulation study. Agric. Water Manag. 2015, 152, 198–206. [Google Scholar] [CrossRef] [Green Version]
  89. Resop, J.P.; Fleisher, D.H.; Timlin, D.J.; Reddy, V. Biophysical constraints to potential production capacity of potato across the US eastern seaboard region. Agron. J. 2014, 106, 43–56. [Google Scholar] [CrossRef] [Green Version]
Figure 1. (a) Per capita consumption of potato in Iran, 1961–2011. (b) Population of Iran, 1961–2018.
Sustainability 12 09890 g001
Figure 2. Map of study area displaying the Agro-Ecological Zones (AEZs) and spatial distribution of selected synoptic stations.
Sustainability 12 09890 g002
Figure 3. (a) Potato production in AEZs of Iran. (b) The area under the cultivation of potato in AEZs of Iran.
Sustainability 12 09890 g003
Figure 4. (aj) The linear trends in maximum temperature, minimum temperature, and precipitation of potato growing season during 1981–2016.
Sustainability 12 09890 g004
Figure 5. The framework of the proposed methodology.
Sustainability 12 09890 g005
Figure 6. Validation of Statistical Downscaling Model (SDSM) performance for climate parameters by comparing the monthly average for the measured and estimated data for Babolsar station during 1991–2005.
Sustainability 12 09890 g006aSustainability 12 09890 g006b
Figure 7. Change in MAX (°C) of potato growing season for the 2050s, with respect to the base period (1981–2010), under Representative Concentration Pathways (RCP) 4.5 and 8.5.
Sustainability 12 09890 g007
Figure 8. Change in MIN (°C) of potato growing season for the 2050s, with respect to the base period (1981–2010), under RCP 4.5 and 8.5.
Sustainability 12 09890 g008
Figure 9. Percentage change in P of potato growing season for the 2050s, with respect to the base period (1981–2010), under RCP 4.5 and 8.5.
Sustainability 12 09890 g009
Figure 10. Percentage change in mean yield with respect to the base period (1981–2010) under QFF.
Sustainability 12 09890 g010
Figure 11. Percentage change in yield risk with respect to the base period (1981–2010) under QFF.
Sustainability 12 09890 g011
Figure 12. Percentage change in mean yield with respect to the base period (1981–2010) under CDFF.
Sustainability 12 09890 g012
Figure 13. Percentage change in yield risk with respect to the base period (1981–2010) under CDFF.
Sustainability 12 09890 g013
Table 1. Geographical parameters of selected synoptic stations.
No.AEZStation NameLatitude (°N)Longitude (°E)Altitude (m)
1Caspian Coastal Plain ZoneBabolsar36.7252.65−21
2Central ZoneQazvin36.1550.031279.2
3North-Western ZoneTabriz38.0546.171361
4Central Zagros ZoneHamedan35.1248.431679.7
5Khuzestan ZoneAhvaz31.2048.4022.5
6Arid Central ZoneEsfahan32.3751.401550.4
7Southern Zagros ZoneShiraz29.3252.361484
8Southern Coastal ZoneBushehr29.0658.219
9Arid Southern ZoneBam28.5850.491066.9
10Khorasan ZoneMashhad36.1659.38999.2
Table 2. Selected provinces, synoptic stations, and growing seasons for three potato crops in Iran.
AEZProvince NamesStation NamesPotato CropsGrowing Seasons
1Golestan, Mazandaran, GilanGorgan, Babolsar, RashtSpring potatoMarch/April–July/August
2Qazvin, Tehran, Markazi, SemnanQazvin, Mehrabad, Arak, SemnanSummer potatoMay/June–September/October
3East Azerbaijan, West Azerbaijan, Ardabil, Kurdistan, ZanjanTabriz, Urmia, Ardabil, Sanandaj, ZanjanSummer potatoMay/June–September/October
4Hamedan, Kermanshah, LorestanHamedan, Kermanshah, KhorramabadSpring potatoMarch/April–July/August
5KhuzestanAhvazWinter potatoJanuary/February–May/June
6Esfahan, YazdEsfahan, YazdSpring potatoMarch/April–July/August
7Fars, Kohgiluyeh and Boyer-Ahmad, Chaharmahal and BakhtiariShiraz, Yasuj, ShahrekordWinter potatoJanuary/February–May/June
8Bushehr, HormozganBushehr, Bandar AbbasWinter potatoJanuary/February–May/June
9Kerman, Sistan and BaluchestanBam, ZahedanWinter potatoJanuary/February–May/June
10North Khorasan, Razavi Khorasan, South KhorasanBojnurd, Mashhad, BirjandSpring potatoMarch/April–July/August
Table 3. List and descriptions of the National Centers for Environmental Prediction (NCEP) and the second generation Canadian Earth System Model (CanESM2) daily predictors used model calibration and projection.
IndexLong NameMAXMINP
mslpglMean sea level pressure
pl-uglSurface zonal velocity
pl-vglSurface meridional velocity
plzhglSurface divergence
p5-ugl500 haPa airflow strength
p5-zgl500 hPa meridional
p500gl500 hPa geopotential height
P850gl850 hPa geopotential height
p8zhgl850 hPa divergence
prcpglPrecipitation
s500glSpecific humidity at 500 hPa
s850glSpecific humidity at 850 hPa
shumglSurface specific humidity
tempglMean temperature at 2 m
Table 4. SDSM performance results.
AEZStation NamesClimate FactorsRR2RMSENSEMAE
1 MAX0.990.990.300.990.24
BabolsarMIN0.990.990.350.990.31
P0.960.920.550.890.45
2 MAX0.990.990.710.990.50
QazvinMIN0.990.990.870.980.63
P0.950.900.300.800.20
3 MAX0.990.991.350.980.95
TabrizMIN0.990.991.400.971.15
P0.950.900.180.860.12
4 MAX0.990.991.030.990.76
HamedanMIN0.990.991.710.941.45
P0.920.860.240.840.18
5 MAX0.990.990.290.990.24
AhvazMIN0.990.990.650.990.59
P0.940.880.270.860.18
6 MAX0.990.990.520.990.46
EsfahanMIN0.990.990.400.990.29
P0.920.850.180.680.11
7 MAX0.990.990.380.990.33
ShirazMIN0.990.990.470.990.43
P0.980.970.340.910.20
8 MAX0.990.990.460.990.36
BushehrMIN0.990.990.680.980.65
P0.940.890.800.500.65
9 MAX0.990.990.380.990.24
BamMIN0.990.990.240.990.20
P0.850.740.090.700.06
10 MAX0.990.990.470.990.42
MashhadMIN0.990.992.110.921.60
P0.980.960.100.960.08
Table 5. Change in climate variables (%).
RCPsChange in Climate Variables (%) RCPsChange in Climate Variables (%)
MAXMINPMAXMINP
Zone1 Zone6
4.54.032.441.46 4.53.264.1814.04
8.53.852.400.78 8.53.573.866.85
Zone2 Zone7
4.53.992.1715.72 4.53.423.0912.68
8.54.402.3813.94 8.53.183.6119.52
Zone3 Zone8
4.54.073.4112.34 4.54.783.71−2.78
8.53.903.6013.91 8.54.793.5124.06
Zone4 Zone9
4.54.19−0.4913.72 4.53.861.5520.02
8.54.10−0.640.07 8.53.941.82−4.50
Zone5 Zone10
4.54.211.6910.79 4.54.14−1.67−5.62
8.54.391.798.08 8.54.07−1.0910.14
Table 6. Unit root test results.
Potato CropsVariableFisher-ADFLLC
Without TrendWith TrendWithout TrendWith Trend
Spring potato
MAX (°C)148.80 ***208.10 ***−3.987 ***−5.80 ***
MIN (°C)71.69 ***189.39 ***−2.781 ***−5.24 ***
P (mm)322.09 ***295.18 ***−8.274 ***−6.93 ***
Yield (tone/ha)57.168 ***113.09 ***−1.244 *−4.393 ***
Summer potato
MAX (°C)62.58 ***134.25 ***−2.97 ***−4.28 ***
MIN (°C)75.26 ***96.85 ***−3.92 ***−4.06 ***
P (mm)255.79 ***214.27 ***−9.70 ***−7.79 ***
Yield (tone/ha)57.65 ***96.41 ***−1.55 **−2.95 ***
Winter potato
MAX (°C)89.79 ***121.10 ***−2.99 ***−3.80 ***
MIN (°C)71.34 ***171.17 ***−2.48 ***−5.11 ***
P (mm)191.78 ***164.23 ***−10.57 ***−8.72 ***
Yield (tone/ha)32.151 ***100.39 ***−1.43 *−4.09 ***
*, **, and *** respectively, denote rejection of the unit root hypothesis at the 10%, 5%, and 1% significance levels.
Table 7. Panel data model specification tests.
Spring PotatoSummer PotatoWinter Potato
Heteroscedasticity tests
White’s test125.91 ***95.57 ***118.37 ***
Breusch-Pagan-Godfrey test7.80 ***9.54 ***5.60 ***
Fixed effects versus Random effects
Hausman test35.85 ***11.21 **14.24 ***
** and *** respectively, significance at the 5% and 1% levels.
Table 8. Estimation results for potato yield mean function and yield risk under quadratic functional form (QFF).
Spring PotatoSummer PotatoWinter Potato
Coef.Std. err.Coef.Std. err.Coef.Std. err.
Yield risk function
Constant23.943 ***9.38613.6869.43715.773 ***5.922
Trend0.034 ***0.0100.043 ***0.0120.0040.010
MAX−6.792 ***2.858−3.1603.354−5.051 **2.214
MIN0.1791.139−0.3981.4181.101 *0.645
P0.1280.170−0.2160.1480.259 *0.145
Yield average function
Constant−0.8321.1998.203 ***1.9531.5881.656
Trend0.458 ***0.076−0.1330.12012.259 ***0.877
MAX−2.389 *1.373−4.289 ***1.611−0.523 ***1.717
MIN7.811 ***2.4585.250 **2.7216.592 ***2.472
P−0.1220.2840.848 *0.526−0.2700.366
MAX, squared0.0700.0520.095 **0.0500.176 ***0.074
MIN, squared−0.0610.070−0.0270.0510.1010.077
P, squared0.000070.0006−0.0040.0040.00040.0007
MAX * MIN−0.1940.122−0.0680.101−0.288 *0.154
MAX * P−0.0110.009−0.0080.015−0.0070.018
MIN * P0.027 ***0.009−0.0160.0140.00030.014
Arid Central Zone14.567 ***4.555
Caspian Coastal Plain Zone−0.7465.871
Khorasan Zone11.533 ***4.031
Central Zagros ZoneOmitted
Central Zone −8.675 ***2.969
North-Western Zone Omitted
Khuzestan Zone 14.620 **7.212
Arid Southern Zone 8.1016.344
Southern Zagros Zone 17.213 **8.740
Southern Coastal Zone Omitted
Model statistics
F-test31.997 12.752 60.463
Prob > F0.000 0.000 0.000
Log likelihood−593.551 −596.991 −403.886
AIC1215.102 1217.982 835.773
BIC1270.842 1263.351 887.055
No. of obs.396 324 288
*, **, and *** respectively, significance at the 10%, 5%, and 1% levels.
Table 9. Estimation results for potato yield mean function and yield risk under Cobb-Douglas functional form (CDFF).
Spring PotatoSummer PotatoWinter Potato
Coef.Std. err.Coef.Std. err.Coef.Std. err.
Yield risk function
Constant−4.3350.29514.5387.18118.216 *9.651
Trend−0.0100.010−0.040 ***0.016−0.0120.010
MAX−2.0703.242−6.7505.784−6.554 *3.577
MIN3.487 ***1.4202.2422.3510.2311.689
P−0.1120.172−0.2250.1640.0480.170
Yield average function
Constant6.819 ***2.4224.855 ***1.2851.878 ***0.480
Trend0.561 ***0.0680.044 ***0.0050.033 ***0.001
MAX−1.539 ***0.769−0.540 ***0.180−0.549 ***0.207
MIN0.216 ***0.074−0.0670.2741.154 ***0.235
P−0.132 ***0.046−0.0250.024−0.049 ***0.018
Arid Central Zone−0.614 **0.291
Caspian Coastal Plain Zone−0.7590.814
Khorasan Zone−0.0010.349
Central Zagros ZoneOmitted
Central Zone −0.924 **0.137
North-Western Zone Omitted
Khuzestan Zone 1.288 ***0.197
Arid Southern Zone 0.487 **0.223
Southern Zagros Zone 1.097 ***0.271
Southern Coastal Zone Omitted
Model statistics
F-test120.824 1064.995 604.773
Prob > F0.000 0.000 0.000
Log likelihood−624.135 −626.861 −360.569
AIC1266.270 1265.723 737.139
BIC1302.103 1288.408 766.443
No. of obs.396 324 288
*, **, and *** respectively, significance at the 10%, 5%, and 1% levels.
Table 10. Elasticities of climate variables.
Potato CropsProduction Function FormClimate VariablesAverage YieldYield Risk
Spring potatoQuadraticMAX−2.231−6.792
MIN1.1040.179
P−0.0800.128
Cobb-DouglasMAX−1.539−2.070
MIN0.2163.487
P−0.132−0.112
Summer potatoQuadraticMAX0.371−3.160
MIN1.585−0.398
P0.161−0.216
Cobb-DouglasMAX−0.540−6.750
MIN−0.0672.242
P−0.025−0.225
Winter potatoQuadraticMAX6.606−5.051
MIN1.1351.101
P−0.4230.259
Cobb-DouglasMAX−0.549−6.554
MIN1.1540.231
P−0.0490.048
Publisher’s Note: MDPI stays neutral with regard to jurisdictional claims in published maps and institutional affiliations.

