Sustainable Production, Non-Tariff Measures, and Trade Performance in RCEP Countries


1
Faculty of Business, Economics and Social Development, Universiti Malaysia Terengganu, Kuala Nerus 21030, Terengganu, Malaysia
2
Faculty of Economics and Management, Universiti Kebangsaan Malaysia, Bangi 43600, Selangor, Malaysia
*
Author to whom correspondence should be addressed.
Sustainability 2020, 12(23), 9969; https://0-doi-org.brum.beds.ac.uk/10.3390/su12239969
Submission received: 15 October 2020
/
Revised: 7 November 2020
/
Accepted: 25 November 2020
/
Published: 28 November 2020
(This article belongs to the Special Issue Footprints on Sustainable Consumption and Production in Emerging Economies)
Abstract
:The main objective of this paper is to reinvestigate the impacts of non-tariff measures (NTMs) on bilateral exports among Regional Comprehensive Economic Partnership (RCEP) countries. The study adds to the literature in two areas. First, we calculate coverage ratios for NTMs related to specific sustainable development goals (SDGs) imposed on bilateral trade between RCEP member countries. Second, to avoid aggregation bias, the analysis covers four major sectors, namely agrifood, health, logistics, and other manufacturing. The results of a Poisson pseudo maximum likelihood (PPML) regression in a gravity model, using average import data from 2016 to 2018 at the Harmonized Commodity Description and Coding Systems (HS) two-digit level (97 subsectors), show that the effects of SDG-related NTMs vary by sector. NTMs related to SDG 3 (good health and well-being) distort trade in health but enhance trade in logistics. NTMs related to SDG 12 (responsible consumption and production) have a negative impact on logistics but a positive impact on other manufacturing exports. The findings provide new perspectives on the varying impacts of SDG-related NTMs on trade. Interestingly, the study finds that NTMs addressing SDGs 3 and 12 have positive trade impacts. Policymakers should, however, regulate NTM implementation, to minimize negative impacts and ensure that domestic firms comply to promote sustainable production.
1. Introduction
Environmental degradation arising from recent economic progress threatens future development and survival [1]. It leads to resource depletion, which then distorts the outputs of various stages of production, from raw materials to final goods. According to World Population Prospects 2019 [2], the global population is expected to reach approximately 9.7 billion by 2050: The equivalent of almost three planets would be required to provide sufficient natural resources to sustain current lifestyles for a population of this size. This clearly shows that sustainable production is the only way forward for a very direct reason: Future generations cannot maintain current quality of life, diversity, or ecosystems unless appropriate action is taken. Hence, to address sustainable production issues, policymakers have imposed various policies such as non-tariff measures (NTMs). Unlike conventional tariffs, NTMs are qualitative measures that emphasize how goods are produced and traded.
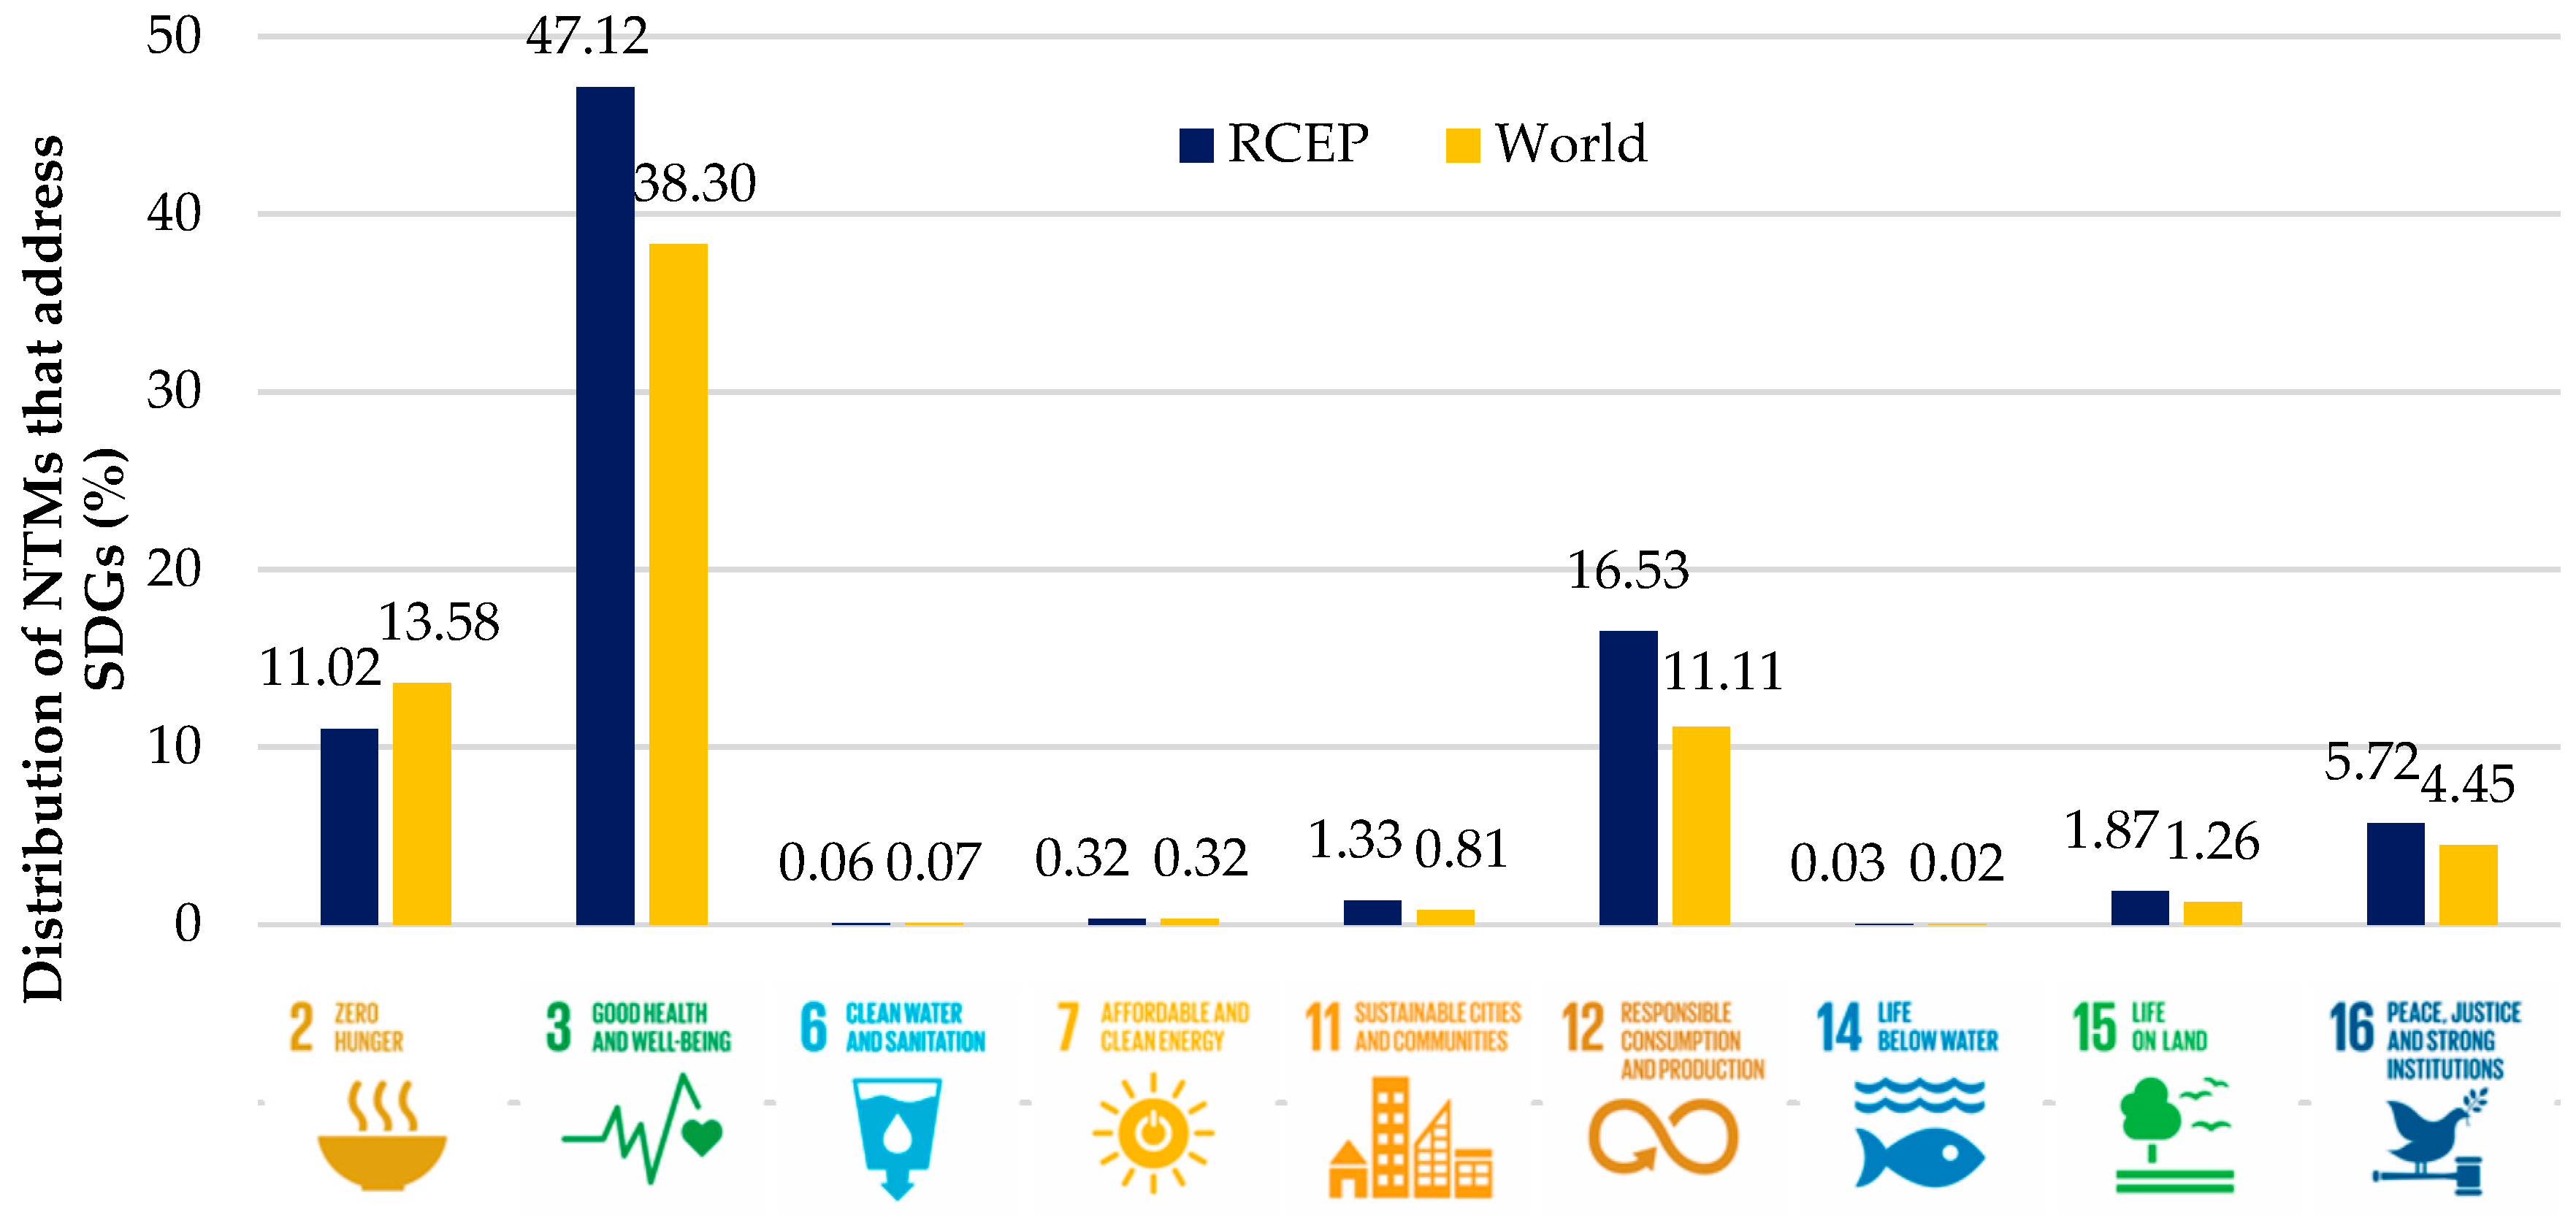
The implementation of NTMs often serves important purposes, such as protecting human health, ecosystems, and the environment. In addition, the 2030 Agenda for Sustainable Development recognizes international trade as an engine for inclusive economic growth and poverty reduction, and thus, several NTMs have been imposed to help achieve the sustainable development goals (SDGs) [3]. Figure 1 depicts the shares of NTMs that address several SDGs for countries in the Regional Comprehensive Economic Partnership (RCEP) (the RCEP is a proposed regional free trade agreement among the ten member states of the Association of Southeast Asian Nations (ASEAN) and five Asia-Pacific countries, namely, Australia, China, Japan, New Zealand, and South Korea [4]) and at the global level. The figure shows that most NTMs address SDG 3 (good health and well-being), 12 (responsible consumption and production), 2 (zero hunger), and 16 (peace, justice, and strong institutions). SDG 12 has been classified as one of the three most comprehensive measures to enhance sustainable development [5]. The distribution of NTMs shows that policymakers have acknowledged that fundamental changes in the way societies produce and consume are crucial for achieving global sustainable development [6].
NTMs can affect sustainable development through more than one channel. They can do so directly as policy instruments or indirectly through their impact on trade or via their extended externalities [8]. To achieve the specified SDGs, NTMs can leverage their positive impacts on trade, as certain NTMs help to overcome negative externalities. However, the rising number of NTMs imposed as alternative trade policies makes it more likely that NTMs harm trade, as they may be overprotective or imposed with defensive intentions [9,10,11]. This possibility has motivated policymakers and researchers to seek to understand how NTMs affect trade performance [12,13]. A sizeable literature has been published on the impacts of NTMs on trade [4,14,15,16,17,18,19,20]. Most research has tended to focus on the implications of NTMs in general, and hence, several current studies have shifted attention to NTMs with specific purposes: improving supply chains [21,22], enhancing quality [23,24], and increasing export competitiveness [25,26].
Liu et al. [8] show that NTMs help promote sustainable development. However, empirical studies that emphasize the trade implications of NTMs in relation to achieving sustainable development are still limited. This might be due to the difficulty of identifying a one-to-one relation between types of NTMs and the SDGs. A detailed understanding of the impacts on trade performance of NTMs based on specific SDGs is important for policymakers. Knowledge of these impacts can help policymakers ensure that no one is left behind and consider whether NTMs that do more harm than good should be liberalized. In addition, revealing the impact of these NTMs can provide policymakers with adequate information about the market acceptance of certain SDGs and thus help them formulate better action plans in the future. Kravchenko et al. [7] recently developed an NTM-SDG concordance matrix to explain which NTMs address specific SDGs. This creates an opportunity to understand the impacts of SDG-related NTMs on international trade flows. Hence, the current study aims to fill a gap in the literature by answering the core research question: What are the implications for trade performance of NTMs that are related to specific SDGs?
The objectives of this research are to determine the impacts of SDG-related NTMs on bilateral exports among RCEP countries. To this end, the NTM coverage ratios for the selected SDGs are calculated at the sectoral level (Harmonized Commodity Description and Coding Systems (HS) two-digit level) by using disaggregated data (HS six-digit level). Next, the impact of these specific NTMs on RCEP countries’ bilateral sectoral exports is estimated using a Poisson pseudo maximum likelihood (PPML) regression in a gravity model. This research contributes to the existing literature in two areas. First, by calculating the SDG-related NTM coverage ratio, this study provides researchers and policymakers with information on the percentages by sector of import values that are subject to these NTMs. This can help clarify the weighting of the respective NTMs. Second, the current study avoids the issue of aggregation bias in the analysis by covering four major sectors, namely, agrifood, health, logistics, and other manufacturing. Hence, the results obtained are sector specific rather than aggregated. In addition, this study focusses on RCEP countries due to their enormous market potential and the fact that some NTMs in these countries are currently in the negotiation phase. Although NTM liberalization is one of the key focusses of RCEP accession, the positive impacts of NTMs on sustainability are undeniable [7]. Thus, understanding the consequences of NTMS can help policymakers formulate strategies to minimize losses and maximize gains from RCEP accession.
This study is structured as follows. The first section of this paper explains the issues and the importance of the current study. Section 2 describes past studies of the same topics and identifies the gaps to be filled by this paper. Section 3 presents the methodology and data used in the study. Section 4 explains the study’s findings and interpretation. Section 5 discusses the conclusion and policy implications.
2. Literature Review
The dilemmas presented by NTMs have led to a proliferation of research on the impacts of NTMs on trade performance. For example, while NTMs may lead to a reduction in trade volume, such measures seem to promote sustainability in development [27]. Thus, scholars have been investigating the impacts of NTMs on trade performance and sustainable development to propose effective development strategies that can benefit both areas. In their evaluation of a European Union (EU) import ban on Sri Lanka’s seafood exports, Sandurawan and Weerasooriya [28] concluded that this NTM had a mixed effect on sustainability: It had a positive impact on production and life below water but a negative impact on poverty and economic growth. For the case of Kazakhstan and Kyrgyzstan, Zalina [29] argued that NTMs imposed within the Eurasian Economic Union could protect agricultural commodities in both countries from dangerous disease. Considering the mixed impacts of NTMs on sustainability, it is noteworthy that the ability of NTMs to improve sustainable development depends on the quality of regional trade agreements and on the enforced policies [30].
The increasing significance of NTMs as trade policy measures has attracted policymaker and researcher attention to NTM implementation and the impact on international trade flows [4,12,13,14,15,16,17,18,19,20]. Most authors have focused on the impact of NTM liberalization through free trade agreements (FTAs), as NTMs are commonly assumed to distort trade [12,15,31,32,33]. Kinzius et al. [34] found that the impacts of NTMs on trade depend on the types of NTMs implemented. For example, Ferro et al. [35] and Karemera et al. [36], who used the maximum residual level of pesticides as a proxy for NTMs, found a negative impact on exports. Wood et al. [20] proved that technical-barrier-to-trade (TBT) measures implemented by China reduce manufacturing and overall exports for Japan and South Korea, while sanitary and phytosanitary (SPS) measures encourage agricultural sector exports to South Korea.
Luo and Bano [26] found that TBTs contribute to risk rate reduction, while pre-shipment inspections (INSPs) and contingent trade protective measures (CTPMs) distort exports of dairy products to New Zealand. However, these results contradict those of Santeramo et al. [37], who found that INSP and TBT encouraged wine imports for China. In addition to Santeramo et al. [37], several other researchers have proved that NTMs do not necessarily harm trade; they can also have positive impacts on trade [20,23,38]. Ghodsi and Stehrer [23] found that SPS measures imposed by the EU significantly increased dairy trade values and quantities. Timini and Conesa [38] explored the impact of technical and non-technical NTMs in China and found that technical NTMs have a positive impact on trade by increasing consumer confidence in and the technical capabilities of Chinese exporters. Non-technical NTMs were found to be very stringent for final goods.
In addition, inconsistencies in the impacts of NTMs on trade have led to several recent studies focussing on the specific purposes of NTMs implemented to clarify their impacts on trade. Soon and Thompson [21] and Webb et al. [22] explored how NTMs affect trade flows in a supply chain. Their studies show that NTMs have negative impacts on supply chains. Similarly, Ghodsi and Stehrer [23] and Huang et al. [24] investigated the role played by NTMs in enhancing product quality and affecting trade, and they found that NTMs help increase the quality of imported goods. Deepika [25] and Luo and Bano [26] studied the impacts of NTMs on export competitiveness, and they show that the implementation of these measures increase firms’ production costs in certain sectors and reduce domestic firms’ competitiveness. Many NTMs have been imposed with the aim of enhancing sustainable development; indeed, Liu et al. [8] showed that NTMs help promote sustainable development. Several studies have shown that higher sustainability increases consumer willingness-to-pay for food products [39,40,41]. Hence, it would be intriguing to analyse whether the same impact can be seen for international trade flows. However, empirical studies that emphasize the trade implications of NTMs focused on sustainable development are lacking. Difficulties in identifying NTMs based on specific SDG targets contribute to the limitations of previous studies. However, Kravchenko et al. [7] recently developed a detailed NTM–SDG concordance matrix, creating an opportunity to clarify the impacts on international trade flows of NTMs related to specific SDGs. Thus, this is the gap filled by the current study.
3. Methodology
This study employs econometric estimations to estimate the impacts of SDG-related NTMs on trade performance. This research starts by measuring NTMs. Unlike conventional tariffs, which are measurable, the qualitative nature of NTMs is the main barrier to estimating their impacts. Hence, several studies have used coverage ratios to measure the incidence of NTMs [1,20,42,43]. Coverage ratios are one of the simplest inventory measures and can be interpreted as the percentage of the value of trade that is subject to NTMs. In other words, coverage ratios represent the reach of NTMs and show their importance for imported goods [44]. Given that most NTM notifications are provided at the HS 6-digit level [45], the NTM coverage ratios calculated in this study also use HS 6-digit level data by country (4709 products) and are summed at the sectoral (HS 2-digit) level. The formula to calculate the coverage ratio is as follows:
where the dummy variable, denoted D, reflects the existence of at least one SDG k-related NTM in country j for product p; V denotes the import value of product p in country j; p represents the HS 6-digit product; and n represents the HS 2-digit sector. k represents an SDG, with this study focusing on the 2 most common SDGs: 3 (good health and well-being) and 12 (responsible consumption and production). It is important to note that SDGs are not independent, as some goals are closely linked [46]. This study focus on two different SDGs, as SDG 3 addresses the issue of efficient allocation, while SDG 12 addresses the issue of fair distribution [47]. Thus, this study avoids interdependency issues. By using Equation (1), this study calculates the coverage ratios for NTMs that are related to specific SDG coverage ratios at HS 2-digit level, which can be interpreted as descriptive statistics for NTM incidence in relation to coverage (NTM exposure in the total import share) with respect to each SDG.
Next, to examine the implications for RCEP countries of SDG-related NTMs imposed by importing nations on various sub-sector exports, this study employs a gravity model. Based on the standard gravity model of trade, which includes both economic size and the distance between countries, Tinbergen [48] proposed the following gravity Equation (2):
where ln denotes variables in natural log form; is bilateral exports from country i to country j; and are the incomes of country i and country j, respectively; is the distance from country i to country j; and is the error term. Various studies have expanded the basic gravity equation to analyse the implications of trade policies [20,49,50,51,52,53]. Hence, this study also expands on the basic model by including tariffs, NTM coverage ratios and dummy variables for FTAs. Unlike previous research, the NTMs coverage ratios included in this study, which are obtained from Equation (1), are specifically related to SDG 3 and SDG 12. The inclusion of these variables is important for answering the main question considered in this study, i.e., whether SDG-related NTMs affect RCEP countries’ bilateral exports. In addition, dummy variables for common borders are included to control for the impact of higher bilateral trade between countries that share a border, as reported in most studies [53,54,55]. The following model is obtained:
where is bilateral exports from country i to country j of product n; and are the populations of country i and country j, respectively; is the average tariff imposed by country j on product n; and are the coverage ratios of the NTMs imposed by country j on product n in relation to SDGs 3 and 12, respectively; , , , , and are dummy variables equal to one if country i and country j are in the ASEAN Free Trade Area (AFTA), ASEAN–Australia–New Zealand Free Trade Area (AANZFTA), ASEAN–China Free Trade Area (ACFTA), ASEAN–Japan Comprehensive Economic Partnership (AJCEP), or ASEAN–Korea Free Trade Agreement (AKFTA), respectively; is a dummy variable equal to one if country i and country j share a border; and is the error term.
Since not all countries in the world trade with each other at the HS 2-digit level, some trade flows are zero in the trade data sets. According to Silva and Tenreyro [56], ordinary least squares estimations of the existence of zero trade values might lead to biased results. Thus, to address the issue of bias in estimation, this study follows the PPML specification developed by Silva and Tenreyro [57,58]. As PPML regression utilizes an exponential function, Equation (3) is transformed into an exponential form as follows:
where the notation in Equation (4) is the same as that in Equation (3). This study estimates Equation (4) at the sectoral (HS 2-digit) level for the overall economy and four major sectors, namely, agrifood, health, logistics, and other manufacturing. Hence, the dependent variables are bilateral exports from country i to country j for sector n; meanwhile, the independent variables are country-level indicators (GDP, population, distance, common border, and FTA membership) and product-level indicators (tariffs and SDG-related NTMs). The regression results answer the current study’s research question regarding the impacts of SDG-related NTMs on bilateral exports for RCEP countries. Mixed impacts on the coefficients of SDG-related NTMs are expected, as such measures can either enhance or distort trade. The tariff rate is expected to have a negative impact on bilateral exports. Meanwhile, the coefficient of the FTA dummy is expected to enhance bilateral exports because a trade agreement should lead to higher trade volumes between countries.
This research uses average import data from 2016 to 2018 at the HS 6-digit level (4709 products) and produces coverage ratios for SDG-related NTMs at the HS 2-digit level. To estimate the impacts of NTMs on exports, bilateral average export data from 2016 to 2018 are utilized for all RCEP countries at the HS 2-digit level. Export and import value data are in $1000s and were obtained from the Comtrade [59] database. Due to data availability, this research uses the latest ad valorem tariff data from the International Trade Centre’s MAcMap [60]. Data for NTMs were obtained from TRAINS [45], which was co-developed by UNCTAD and ERIA. Following Kravchenko et al. [7], this study disaggregated the NTM data by specific SDG. Outward measures are excluded from the estimation; only inward policies, which include measures implemented by importing countries, are considered. A dummy variable is used to capture NTMs: The value is 1 if any NTMs are imposed for a specific tariff line and zero otherwise. Data for GDP and population were obtained from the World Bank [61], while data for the gravity variables, such as bilateral distance and a common border, were obtained from the CEPII database [62,63,64].
4. Results and Discussion
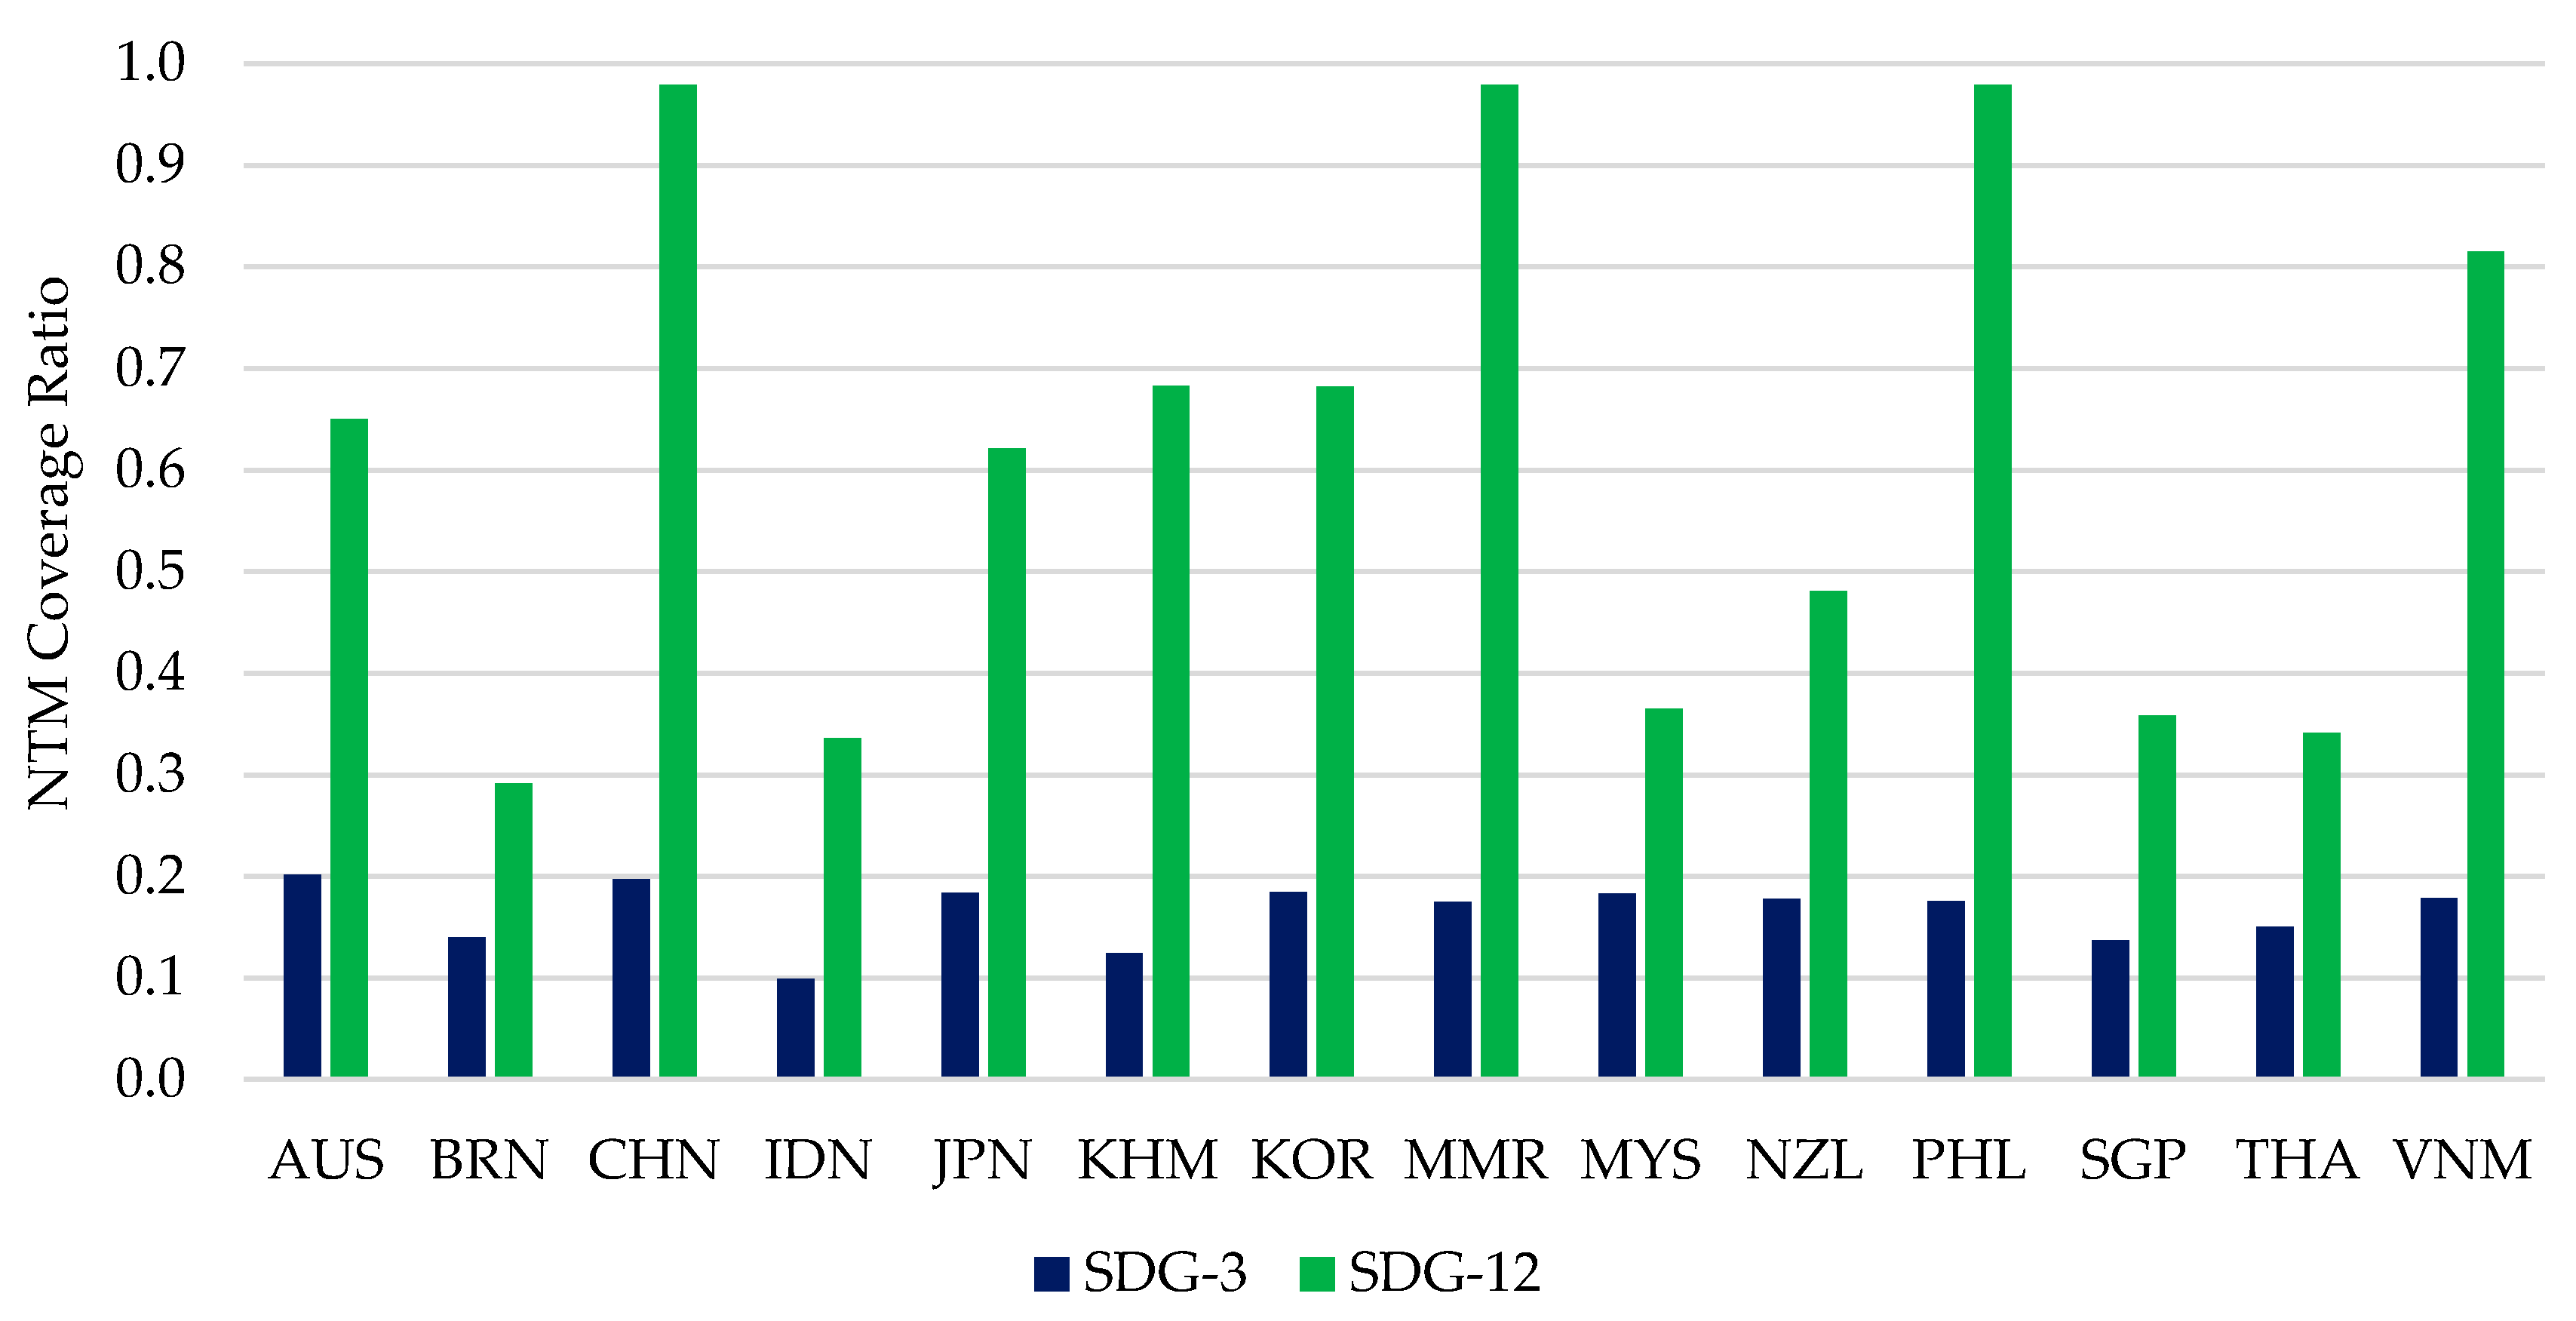
The outcome of this research comprises two parts. The first part concerns the SDG-related NTM coverage ratios, and the second part concerns the impact of these SDG-related NTMs on RCEP countries’ bilateral exports. Figure 2 depicts the average coverage ratios of NTMs related to both focal SDGs, where SDG 12 has the highest NTM coverage ratio in all countries. In addition, almost all imported goods in Myanmar, the Philippines, and China are subject to NTMs related to SDG 12, as these countries have coverage ratios of almost 100%. This result shows that NTMs that address sustainable consumption and production affect most imported goods; thus, understanding the impacts of these measures on trade can provide clear insights into the market acceptance of sustainable production and consumption.
The second part involves estimating the impacts on RCEP countries’ bilateral exports of SDG-related NTMs imposed by importing countries; thus, five different regressions were estimated in order to compare the impacts on the overall economy and on specific sectors. Table 1 presents the descriptive results for the variables included in the model. Overall, there are 17,472 observations for each variable, covering multiple countries and sectors. For the focal NTM variables, the mean coverage ratio of NTMs related to SDG 12 is greater than that of NTMs related to SDG 3. This indicates that, on average, most countries in our sample imposed more NTMs related to SDG 12 than to SDG 3, which is in accordance with the findings illustrated in Figure 2.
Furthermore, Table 1 shows that the variables included in the current study have high standard deviations, especially for the dependent variable. The high standard deviations are common in trade analysis because the data are widely spread across sectors and countries, as is supported by the similar findings of past empirical studies that used PPML estimation [20,50,51,54,65,66,67]. This indicates that the export values are spread over a large range of values, with a minimum of zero and a maximum of 56,400,000. The high maximum value is due to the nature of the data, which are at level. In addition, the large number of zero observations in bilateral sectoral exports also contributes to the high standard deviation and justifies the use of the PPML methodology in the empirical analysis.
The estimation results of the PPML regression can be seen in Table 2. Overall, the regression results are in line with the gravity model, with most of the coefficients displaying the expected signs. For example, importer and exporter income have positive and significant relationships with bilateral exports. The exporter population has a positive and significant coefficient in most models, while the importer population is positive and significant only for the overall economy. Distance has a negative relationship with bilateral exports. This shows that greater distances increase transportation costs and thus lead to lower trade. A common border contributes to higher bilateral exports, as shown by positive and significant coefficients. The high R2 values of most models indicate that the current estimation results are reliable. Low R2 values are reported for the agricultural sector, and further investigation revealed that these are due to the large dispersion of export values. Hence, to complement the low R2 values for the agricultural sector, Ramsey RESET tests were conducted for all regression models, which indicate that the functional form is correct, and the regression models do not suffer from omitted variables.
The most interesting variables in the current study are related to the SDGs. This research considers two coverage ratio variables for NTMs related to SDGs 3 (good health and well-being) and 12 (responsible consumption and production). The estimation results show that the coverage of NTMs related to SDG 3 has a mixed impact on RCEP countries’ bilateral exports, a negative impact on the exports of the health sector, and a positive impact on the exports of the logistics sector. This means that, when more health products are subjected to NTMs related to SDG 3, exports for the health sector decrease. However, the opposite is true for logistics products, where higher coverage of NTMs related to SDG 3 leads to an increase in exports in the logistics sector. The same is true for NTMs related to SDG 12: They also have mixed impacts. This study finds that coverage of NTMs that address SDG 12 has a negative impact on the exports of the logistics sector and a positive impact on the exports of other manufacturing sectors. Thus, when more logistics products are subject to NTMs related to SDG 12, exports for the logistics sector decrease. However, an increase in the coverage ratio of NTMs related to SDG 12 leads to higher exports for other manufacturing sectors.
Tariffs had a negative impact on the agrifood sector. When tariffs increase by 1%, bilateral exports in RCEP countries decrease by 0.8% for the agrifood sector. This shows that the latter sector is more affected than the overall economy by the tariffs imposed. Several trade agreement dummies are included to measure the impacts of past FTAs among RCEP members. The empirical findings show that most of these trade agreements have positive and significant relationships with RCEP countries’ bilateral exports. This finding supports the idea that FTAs enhance trade between countries.
5. Conclusions
The purpose of this study was to determine the impacts of SDG-related NTMs on RCEP countries’ bilateral exports. Although various attempts have been made to analyze the impacts of NTMs on trade performance, little attention has been given to NTMs that are related to specific SDGs. Hence, the core research question explored in this study must be solved to give policymakers clear guidance on the impacts of the measures imposed as countries move to increase sustainability. In this study, the coverage ratios of NTMs related to SDGs 3 and 12 were first calculated. Next, the impacts on RCEP countries’ bilateral exports of these NTMs imposed by importing countries were estimated by using a PPML regression for the overall economy and four major sectors, using the gravity model framework. Several other trade policy and gravity variables were included, to clarify their respective roles.
This study has shown that the empirical results are consistent with the gravity model. These conclusions are based on the coefficients for the GDP, population, distance, FTA, and common border variables. The most interesting finding to emerge from this study is that there are mixed impacts of SDG-related NTMs on RCEP countries’ bilateral exports. For SDG 3, which addresses good health and well-being, NTM coverage has a negative impact on the exports of the health sector and a positive impact on the exports of the logistics sector. This means that, when more products are subject to measures that address good health and well-being, exports for the health sector deteriorate, but exports for the logistics sector increase.
For SDG 12, which addresses responsible consumption and production, NTM coverage has a negative impact on the exports of the logistics sector and a positive impact on the exports of other manufacturing sectors. This means that, when more products are subject to NTMs that address responsible consumption and production, exports for the logistics sector decrease, but exports for the manufacturing sector increase. In addition, of the sectors considered, other manufacturing represents the highest export share, and the positive impacts observed support policymakers’ efforts to move towards more sustainable production.
Jaffee and Henson [62] clarified that NTMs can restrict or enhance trade, depending on their purpose. The negative effects of NTMs related to certain SDGs may be explained by the difficulties some exporters face in meeting certain NTM specifications; thus, a higher share of exports subject to those NTMs leads to lower bilateral exports. However, the positive effects of SDG-related NTMs may have different drivers. Positive impacts may be explained by the increasing ability of firms to adapt to and satisfy NTM specifications, leading to higher exports. This effect might be due to the varying nature of NTMs: Although some lead to higher prices, NTMs can still help boost trade if restrictive policies are necessary. Beghin et al. [68] reach the same conclusion: Some NTMs help overcome negative externality issues.
The empirical findings of this study provide a new understanding of the impacts of SDG-related NTMs on bilateral exports. The findings have a number of policy implications. First, positive impacts can serve as indicators for policymakers that their actions to promote the SDGs are well received and help boost trade in certain sectors. However, negative impacts convey the opposite message; they show that some steps towards achieving the focal SDGs increase costs and thus have negative impacts on bilateral exports. Hence, intervention by policymakers is necessary to ensure that domestic firms are not left behind in the process of moving towards sustainable production. One such intervention is for policymakers to harmonize standards with those of trading partners to ensure that all countries move towards sustainable production at the same pace and that NTMs are not imposed from a protectionist stance.
Author Contributions
Conceptualization, M.R.K.V.Z. and T.S.; methodology, M.R.K.V.Z.; software, M.R.K.V.Z.; validation, M.R.K.V.Z., T.S., and N.K.; formal analysis, M.R.K.V.Z.; investigation, T.S. and M.R.K.V.Z.; resources, N.K. and M.R.K.V.Z.; data curation, M.R.K.V.Z.; writing—original draft preparation, M.R.K.V.Z.; writing—review and editing, T.S. and N.K.; visualization, M.R.K.V.Z.; supervision, N.K. and T.S.; project administration, N.K., T.S., and M.R.K.V.Z.; funding acquisition, N.K. All authors have read and agreed to the published version of the manuscript.
Funding
This research was funded by UNIVERSITI KEBANGSAAN MALAYSIA, grant number DCP-2017-019/2, and ERIA, grant number EP-2020-001.
Acknowledgments
The authors appreciate the support provided by Universiti Kebangsaan Malaysia.
Conflicts of Interest
The authors declare no conflict of interest.
References
- United Nations. The Sustainable Development Goals Report 2019; United Nations: New York, NY, USA, 2019. [Google Scholar]
- United Nations. World Population Prospects 2019; United Nations: New York, NY, USA, 2019. [Google Scholar]
- ESCAP. Channelling Trade and Investment into Sustainable Development. In Asia-Pacific Trade and Investment Report 2017; ESCAP: Bangkok, Thailand, 2017. [Google Scholar]
- Zainuddin, M.R.K.; Khalid, N.; Sarmidi, T. Estimating Augmented Trade Restrictiveness Indices to Evaluate Impacts of Non-Tariff Barrier for ASEAN Countries and Their Major Trading Partners. Int. J. Econ. Manag. 2019, 13, 393–406. [Google Scholar]
- United Nations. Plan of Implementation of the World Summit on Sustainable Development; United Nations: New York, NY, USA, 2002. [Google Scholar]
- United Nations. The Future We Want; United Nations: New York, NY, USA, 2012. [Google Scholar]
- Kravchenko, A.; Semenova, M.; Lee, S.; Duval, Y. Exploring Linkages between Non-Tariff Measures and the Sustainable Development Goals: A Global Concordance Matrix and Application to Asia and the Pacific; ESCAP Trade, Investment and Innovation Working Paper Series No. 2; ESCAP: Bangkok, Thailand, 2019. [Google Scholar]
- Liu, C.; Lin, D.; Liu, J.; Li, Y. Quantifying the effects of non-tariff measures on African agri-food exporters. Agrekon 2019, 58, 451–471. [Google Scholar] [CrossRef]
- ESCAP. Navigating Non-tariff Measures towards Sustainable Development. In Asia-Pacific Trade and Investment Report; ESCAP: Bangkok, Thailand, 2019. [Google Scholar]
- Santeramo, F.G.; Lamonaca, E. On the impact of non-tariff measures on trade performances of the African agri-food sector. Agrekon 2019, 58, 389–406. [Google Scholar] [CrossRef]
- Yeung, M.T.; McConnell, A. Retreat from Harmonization: Trade Uncertainties Arising from Divergent Maximum Residue Limits for Pesticides. J. World Trade 2017, 51, 883–906. [Google Scholar]
- Cororaton, C.B.; Orden, D. Potential Economic Effects of the Reduction in Trade Barriers in the Transatlantic Trade and Investment Partnership; GII Working Paper No. 2016–1; Global Issues Initiative, Institute for Society, Culture and Environment, Virginia Polytechnic Institute and State University: Blacksburg, VA, USA, 2016. [Google Scholar]
- Horn, H.; Mavroidis, P.C.; Sapir, A. Beyond the WTO? An anatomy of EU and US preferential trade agreements. World Econ. 2010, 33, 1565–1588. [Google Scholar] [CrossRef]
- Jafari, Y.; Othman, J. Potential Economic Impacts of the Malaysia-US Free Trade Agreement. J. Int. Glob. Econ. Stud. 2013, 6, 33–47. [Google Scholar]
- Jusoh, S. Standards and their Impacts on the Horticulture Trade. In Rethinking Structural Reform in Turkish Agriculture: Beyond the World Bank’s Strategy; Karapinar, B., Adaman, F., Ozertan, G., Eds.; Nova Science Publishers: New York, NY, USA, 2010; pp. 355–369. [Google Scholar]
- Juust, M.; Vahter, P.; Varblane, U. Trade Effects of the EU–South Korea Free Trade Agreement in the Automotive Industry. J. East-West Bus. 2020, 1–29. [Google Scholar] [CrossRef] [Green Version]
- Kumar, C.; Bharti, N. Why NTM is a Challenge in Trade Relations? Evidence from India–Africa Agricultural Trade. Insight Afr. 2020, 12, 79–103. [Google Scholar] [CrossRef]
- Ortiz Valverde, G.; Latorre, M.C. A computable general equilibrium analysis of Brexit: Barriers to trade and immigration restrictions. World Econ. 2020, 43, 705–728. [Google Scholar] [CrossRef]
- Walmsley, T.L.; Minor, P. Demand shifts and willingness to pay in applied trade models. World Econ. 2019, 43, 1499–1520. [Google Scholar] [CrossRef]
- Wood, J.; Wu, J.; Li, Y.; Kim, J. The Impact of TBT and SPS Measures on Japanese and Korean Exports to China. Sustainability 2019, 11, 6141. [Google Scholar] [CrossRef] [Green Version]
- Soon, B.M.; Thompson, W. Non-tariff barrier on chicken imports into Russia: Impact on production, trade and prices. J. Policy Model. 2020, 42, 583–596. [Google Scholar] [CrossRef]
- Webb, M.; Strutt, A.; Gibson, J.; Walmsley, T.L. Modelling the impact of non--tariff measures on supply chains in ASEAN. World Econ. 2020, 43, 2172–2198. [Google Scholar] [CrossRef]
- Ghodsi, M.; Stehrer, R. EU Trade Regulations and Imports of Hygienic Poultry. Croat. Econ. Surv. 2019, 21, 117–149. [Google Scholar] [CrossRef] [Green Version]
- Huang, X.; Liu, K.; Chen, H. The puzzle of quality upgrading of Chinese exports from the trade liberalization perspective. Pac. Econ. Rev. 2020, 25, 161–184. [Google Scholar] [CrossRef]
- Deepika, M.G. Export Performance and Factors Affecting Competitiveness of Plantation Commodities in India. Indian J. Agric. Econ. 2017, 72, 555–575. [Google Scholar]
- Luo, Y.; Bano, S. Modelling New Zealand dairy products: Evidence on export survival and duration. Aust. J. Agric. Resour. Econ. 2020, 64, 605–631. [Google Scholar] [CrossRef]
- United Nations. The Unseen Impact of Non-Tariff Measures: Insights from A New Database. In Proceedings of the United Nations Conference on Trade and Development, New York, NY, USA, 16–17 February 2017. [Google Scholar]
- Sandaruwan, K.P.G.L.; Weerasooriya, S.A. Non-Tariff Measures and Sustainable Development: The Case of the European Union Import Ban on Seafood from Sri Lanka; ARTNeT Working Paper Series; ESCAP: Bangkok, Thailand, 2019; p. 185. [Google Scholar]
- Zalina, E. Non-Tariff Measures and Sustainable Development in Kazakhstan and Kyrgyzstan; ARTNeT Working Paper Series; ESCAP: Bangkok, Thailand, 2020; p. 194. [Google Scholar]
- Baker, P.R. Handbook on Negotiating Sustainable Development Provisions in Preferential Trade Agreements; The Economic and Social Commission for Asia and the Pacific (ESCAP): Bangkok, Thailand, 2018. [Google Scholar]
- Li, C.; Whalley, J. China and the Trans-Pacific Partnership: A Numerical Simulation Assessment of the Effects Involved. World Econ. 2013, 37, 169–192. [Google Scholar] [CrossRef]
- Li, Q.; Moon, H.C. The trade and income effects of RCEP: Implications for China and Korea. J. Korea Trade 2018, 22, 306–318. [Google Scholar] [CrossRef]
- Petri, P.A.; Plummer, M.G.; Zhai, F. ASEAN Economic Community: A General Equilibrium Analysis. Asian Econ. J. 2012, 26, 93–118. [Google Scholar] [CrossRef]
- Kinzius, L.; Sandkamp, A.; Yalcin, E. Trade protection and the role of non-tariff barriers. Rev. World Econ. 2019, 155, 603–643. [Google Scholar] [CrossRef] [Green Version]
- Ferro, E.; Otsuki, T.; Wilson, J.S. The effect of product standards on agricultural exports. Food Policy 2015, 50, 68–79. [Google Scholar] [CrossRef] [Green Version]
- Karemera, D.; Xiong, B.; Whitesides, L. A State-Level Analysis of the Impact of a U.S.-EU Harmonization of Food Safety Standards on U.S. Exports of Fruits and Vegetables. Appl. Econ. Perspect. Policy 2020, 42, 856–869. [Google Scholar] [CrossRef]
- Santeramo, F.G.; Lamonaca, E.; Nardone, G.; Seccia, A. The benefits of country-specific non-tariff measures in world wine trade. Wine Econ. Policy 2019, 8, 28–37. [Google Scholar] [CrossRef]
- Timini, J.; Conesa, M. Chinese Exports and Non-Tariff Measures: Testing for Heterogeneous Effects at the Product Level. J. Econ. Integr. 2019, 34, 327–345. [Google Scholar] [CrossRef]
- Bronnmann, J.; Asche, F. Sustainable Seafood From Aquaculture and Wild Fisheries: Insights From a Discrete Choice Experiment in Germany. Ecol. Econ. 2017, 142, 113–119. [Google Scholar] [CrossRef]
- Carlucci, D.; Nocella, G.; De Devitiis, B.; Viscecchia, R.; Bimbo, F.; Nardone, G. Consumer purchasing behaviour towards fish and seafood products. Patterns and insights from a sample of international studies. Appetite 2015, 84, 212–227. [Google Scholar] [CrossRef]
- Risius, A.; Janssen, M.; Hamm, U. Consumer preferences for sustainable aquaculture products: Evidence from in-depth interviews, think aloud protocols and choice experiments. Appetite 2017, 113, 246–254. [Google Scholar] [CrossRef]
- Devadason, E.S.; Chennayah, S. Proliferation of non-tariff measures in China—The relevance for ASEAN. Singap. Econ. Rev. 2014, 59, 1–28. [Google Scholar] [CrossRef]
- El-Enbaby, H.; Hendy, R.; Zaki, C. Do SPS measures matter for margins of trade? Evidence from firm-level data. Appl. Econ. 2015, 48, 1949–1964. [Google Scholar] [CrossRef]
- Nicita, A.; Gourdon, J. A Preliminary Analysis on Newly Collected Data on Non-Tariff Measures. Policy Issues in International Trade and Commodities Study Series No. 53 United Nations Conference on Trade and Development. 2013. Available online: https://unctad.org/en/PublicationsLibrary/itcdtab54_en.pdf (accessed on 15 June 2020).
- TRAINS. Trade Analysis Information System; UNCTAD: Geneva, Switzerland, 2019. [Google Scholar]
- Szennay, Á.; Szigeti, C.; Kovács, N.; Szabó, D.R. Through the Blurry Looking Glass—SDGs in the GRI Reports. Resources 2019, 8, 101. [Google Scholar] [CrossRef] [Green Version]
- Costanza, R.; Daly, L.; Fioramonti, L.; Giovannini, E.; Kubiszewski, I.; Mortensen, L.F.; Pickett, K.E.; Ragnarsdottir, K.V.; De Vogli, R.; Wilkinson, R. Modelling and measuring sustainable wellbeing in connection with the UN Sustainable Development Goals. Ecol. Econ. 2016, 130, 350–355. [Google Scholar] [CrossRef]
- Tinbergen, J. Shaping the World Economy: Suggestions for an International Economic Policy; The Twentieth Century Fund: New York, NY, USA, 1962. [Google Scholar]
- Jafari, Y.; Ismail, M.A.; Kouhestani, M.S. Determinants of Trade Flows among D8 Countries: Evidence from the Gravity Model. J. Econ. Coop. Dev. 2011, 32, 21–38. [Google Scholar]
- Jagdambe, S.; Kannan, E. Effects of ASEAN-India Free Trade Agreement on agricultural trade: The gravity model approach. World Dev. Perspect. 2020, 19, 100212. [Google Scholar] [CrossRef]
- Pfaffermayr, M. Trade creation and trade diversion of economic integration agreements revisited: A constrained panel pseudo-maximum likelihood approach. Rev. World Econ. 2020, 156, 985–1024. [Google Scholar] [CrossRef]
- Sarmidi, T.; Ahmad, S.; Yusuff, K.; Azmie, H.M.K. Perjanjian Perdagangan Bebas (FTA) antara Malaysia dan Negara Kerjasama Teluk (GCC): Satu Kajian Empirik. Int. J. West Asian Stud. 2010, 2, 1–16. [Google Scholar]
- Sun, L.; Reed, M.R. Impacts of Free Trade Agreements on Agricultural Trade Creation and Trade Diversion. Am. J. Agric. Econ. 2010, 92, 1351–1363. [Google Scholar] [CrossRef]
- Martínez-Zarzoso, I.; Márquez-Ramos, L. The Effect of Trade Facilitation on Sectoral Trade. BE J. Econ. Anal. Policy 2008, 8, 8. [Google Scholar] [CrossRef] [Green Version]
- Pinto, V.H.L.; Silva, F.A. South-South Migration: With Whom You Trade Matters. Int. Trade J. 2020, 34, 470–494. [Google Scholar] [CrossRef]
- Silva, J.M.C.S.; Tenreyro, S. The log of gravity. Rev. Econ. Stat. 2006, 88, 641–658. [Google Scholar] [CrossRef] [Green Version]
- Silva, J.M.C.S.; Tenreyro, S. Further simulation evidence on the performance of the Poisson pseudo-maximum likelihood estimator. Econ. Lett. 2011, 112, 220–222. [Google Scholar] [CrossRef] [Green Version]
- Silva, J.M.C.S.; Tenreyro, S. On the existence of the maximum likelihood estimates in Poisson regression. Econ. Lett. 2010, 107, 310–312. [Google Scholar] [CrossRef] [Green Version]
- Comtrade UN. UN Comtrade Database. 2019. Available online: http://comtrade.un.org/data/ (accessed on 31 October 2019).
- MAcMap. Market Access Map, International Trade Centre. 2020. Available online: www.macmap.org (accessed on 27 November 2020).
- World Bank. World Development Indicator Database; World Bank: Washington, DC, USA, 2019. [Google Scholar]
- Head, K.; Mayer, T.; Ries, J. The erosion of colonial trade linkages after independence. J. Int. Econ. 2010, 81, 1–14. [Google Scholar] [CrossRef] [Green Version]
- Head, K.; Mayer, T. Gravity Equations: Toolkit, Cookbook, Workhorse. In Handbook of International Economics; Gopinath, G., Helpman, E., Rogoff, K., Eds.; Elsevier: Amsterdam, The Netherlands, 2014; Volume 4. [Google Scholar]
- Mayer, T.; Zignago, S. Notes on CEPII’s Distances Measures: The GeoDist Database. SSRN Electron. J. 2011. [Google Scholar] [CrossRef] [Green Version]
- Yu, X.; Luo, H.; Wang, H.; Feil, J.-H. Climate change and agricultural trade in central Asia: Evidence from Kazakhstan. Ecosyst. Health Sustain. 2020, 6, 1766380. [Google Scholar] [CrossRef]
- Bianco, A.D.; Boatto, V.L.; Caracciolo, F.; Santeramo, F.G. Tariffs and non-tariff frictions in the world wine trade. Eur. Rev. Agric. Econ. 2015, 43, 31–57. [Google Scholar] [CrossRef] [Green Version]
- Nordås, H.K. What drives trade in services? Lessons from the Nordics. Appl. Econ. 2018, 50, 3532–3545. [Google Scholar] [CrossRef] [Green Version]
- Beghin, J.C.; Disdier, A.; Marette, S. Trade restrictiveness indices in the presence of externalities: An application to non-tariff measures. Can. J. Econ. 2015, 48, 1513–1536. [Google Scholar] [CrossRef]
Figure 1.
Distribution of non-tariff measures (NTMs) that directly address sustainable development goals (SDGs) by goal. Source: Kravchenko et al. [7].
Figure 1.
Distribution of non-tariff measures (NTMs) that directly address sustainable development goals (SDGs) by goal. Source: Kravchenko et al. [7].

Figure 2.
NTM coverage ratios by SDG.


Table 1.
Descriptive Statistics.
| Variables | Mean | SD | Min | Max |
|---|---|---|---|---|
| 111,402 | 950,455 | 0.0000 | 56,400,000 | |
| 26.6782 | 1.8253 | 23.2382 | 30.1403 | |
| 26.6782 | 1.8253 | 23.2382 | 30.1403 | |
| 17.4487 | 1.8843 | 12.9585 | 21.0496 | |
| 17.4487 | 1.8843 | 12.9585 | 21.0496 | |
| 0.0695 | 0.1053 | 0.0000 | 1.5159 | |
| 0.1186 | 0.2432 | 0.0000 | 0.6931 | |
| 0.4338 | 0.3041 | 0.0000 | 0.6931 | |
| 8.0449 | 0.7896 | 5.7543 | 9.3094 | |
| 0.0989 | 0.2985 | 0.0000 | 1.0000 | |
| 0.3956 | 0.4890 | 0.0000 | 1.0000 | |
| 0.2088 | 0.4065 | 0.0000 | 1.0000 | |
| 0.0989 | 0.2985 | 0.0000 | 1.0000 | |
| 0.0989 | 0.2985 | 0.0000 | 1.0000 | |
| 0.0989 | 0.2985 | 0.0000 | 1.0000 |
Note: Total number of observations is 17,472. ASEAN, Association of Southeast Asian Nations; AFTA, ASEAN Free Trade Area; AANZFTA, ASEAN–Australia–New Zealand Free Trade Area; ACFTA, ASEAN–China Free Trade Area; AJCEP, ASEAN–Japan Comprehensive Economic Partnership; AKFTA, ASEAN–Korea Free Trade Agreement.
Table 2.
Estimation results based on the Poisson pseudo maximum likelihood (PPML) model.
| Variables | Overall Economy | Agrifood | Health | Logistics | Manufacturing |
|---|---|---|---|---|---|
| 1.320 *** | 0.343 | 2.414 *** | 1.974 *** | 1.322 *** | |
| 0.721 *** | 0.630 *** | 1.017 *** | 1.423 *** | 0.729 *** | |
| −0.432 *** | 0.876 *** | −0.772 *** | −0.140 | −0.458 *** | |
| 0.150 * | 0.169 | 0.231 | −0.160 | 0.144 | |
| −0.519 | −0.763 * | 0.690 | 4.507 * | −0.751 | |
| −0.097 | −0.046 | −5.965 *** | 2.322 *** | −0.281 | |
| −0.005 | −0.616 | 0.099 | −2.510 *** | 0.249 ** | |
| −0.686 *** | −0.549 *** | −0.760 *** | 0.568 * | −0.797 *** | |
| 0.128 | 0.485 ** | 0.166 | 0.813 *** | 0.002 | |
| AFTA | 0.677 | 1.147 | 5.107 *** | 10.561 *** | 0.444 |
| AANZFTA | −0.264 | 0.465 | 2.877 *** | 5.707 *** | −0.559 |
| ACFTA | 0.410 | 0.646 | 2.759 *** | 4.380 *** | 0.367 |
| AJCEP | 0.861 ** | 0.733 | 3.254 *** | 4.060 *** | 0.903 ** |
| AKFTA | 0.964 *** | 0.584 | 3.315 *** | 3.871 *** | 1.070 *** |
| Constant | −42.911 *** | −42.536 *** | −76.299 *** | −93.263 *** | −41.196 *** |
| Observations | 17472 | 4004 | 364 | 728 | 12376 |
| R2 | 0.652 | 0.247 | 0.931 | 0.821 | 0.669 |
Note: *, **, and *** denote significance at the 10%, 5%, and 1% levels, respectively. The export value is the dependent variable for all models. Country and product fixed effects are included in all models.
Publisher’s Note: MDPI stays neutral with regard to jurisdictional claims in published maps and institutional affiliations. |
© 2020 by the authors. Licensee MDPI, Basel, Switzerland. This article is an open access article distributed under the terms and conditions of the Creative Commons Attribution (CC BY) license (http://creativecommons.org/licenses/by/4.0/).
Share and Cite
MDPI and ACS Style
Zainuddin, M.R.K.V.; Sarmidi, T.; Khalid, N. Sustainable Production, Non-Tariff Measures, and Trade Performance in RCEP Countries. Sustainability 2020, 12, 9969. https://0-doi-org.brum.beds.ac.uk/10.3390/su12239969
AMA Style
Zainuddin MRKV, Sarmidi T, Khalid N. Sustainable Production, Non-Tariff Measures, and Trade Performance in RCEP Countries. Sustainability. 2020; 12(23):9969. https://0-doi-org.brum.beds.ac.uk/10.3390/su12239969
Chicago/Turabian StyleZainuddin, Muhamad Rias K. V., Tamat Sarmidi, and Norlin Khalid. 2020. "Sustainable Production, Non-Tariff Measures, and Trade Performance in RCEP Countries" Sustainability 12, no. 23: 9969. https://0-doi-org.brum.beds.ac.uk/10.3390/su12239969
Note that from the first issue of 2016, this journal uses article numbers instead of page numbers. See further details here.