Can the Adoption of Protected Cultivation Facilities Affect Farm Sustainability?


1
Department of Economics, Shih Hsin University, Taipei 11645, Taiwan
2
Department of Applied Economics, University of Minnesota, Minneapolis, MN 55455, USA
3
Department of Urban Industrial Management and Marketing, University of Taipei, Taipei 11153, Taiwan
4
Department of Agricultural Economics, National Taiwan University, Taipei 10617, Taiwan
*
Authors to whom correspondence should be addressed.
Sustainability 2020, 12(23), 9970; https://0-doi-org.brum.beds.ac.uk/10.3390/su12239970
Submission received: 27 October 2020
/
Revised: 20 November 2020
/
Accepted: 26 November 2020
/
Published: 28 November 2020
(This article belongs to the Special Issue Farming 4.0: Towards Sustainable Agriculture)
Abstract
:Given the increasing threat of climate change to agriculture, determining how to achieve farm sustainability is important for researchers and policy makers. Among others, protected cultivation has been proposed as a possible adaptive solution at the farm level. This study contributes to this research topic by quantifying the effects of the use of protected cultivation facilities on farm sustainability. In contrast to previous studies that relied on small-scale random surveys, a population-based sample of fruit, flower and vegetable farms was drawn from the Agricultural Census Survey in Taiwan. Propensity score matching, inverse probability weighting and inverse probability weighting regression adjustment methods were applied. Empirical results show that the use of protected cultivation facilities increases farm profit by 68–73%, other things being equal. This finding is persistent when farms suffer from disaster shocks. Moreover, the changes in farm labor use can be seen as a mechanism behind the positive effect of the protected cultivation facility use on farm profit. Our findings suggest that agricultural authority can consider subsidizing farms to increase the adoption of protected cultivation facilities to mitigate the risks resulting from natural disaster shocks.
1. Introduction
“Sustainable agriculture” is a multi-dimensional concept, which can be considered and measured on various aspects of sustainability. Most of the definitions of sustainable agriculture seek to integrate the three pillars of sustainability-environmental health, economic profitability and social equity [1,2]. The relationships between three pillars are interdependent and can be mutually supportive. For example, strengthening the rural economy is the foundation upon which to perform the environmental and social functions of rural areas. Meanwhile, protecting and enhancing environmental quality is one precondition for increasing agriculture’s long-term productivity and profitability. However, the objectives of the three pillars can sometimes be in conflict. Therefore, the goal of sustainable agriculture is to incorporate and balance the economic, social and environmental dimensions [3].
Under the threat of the impacts of global warming and climate change, determining how to achieve sustainability in agriculture has become an issue of high concern [4,5,6]. To develop sustainable agriculture under the adverse effects of climate change, protected cultivation has been proposed as a possible adaptive solution to climate change at the farm level. Protected cultivation can create a friendly environment wherein the micro-climate surrounding a plant is partially or fully controlled during the period of growth [7]. Different types of protected cultivation facilities, such as greenhouses, net houses, tunnels, and so forth, are designed according to the climatic condition requirements and plant species. The advantages of protected cultivation include: a decrease in yield loss resulting from extreme weather, protection against pests, weeds and diseases, the more efficient use of productive resources, improvement in crop quantity and quality, and increasing farmers’ incomes [8].
Previous studies have examined the association between the adoption of protected cultivation and various outcomes related to agricultural production, such as farm production, output market prices, farm income, production efficiency in input use, and pest and disease management. For example, by calculating the net present worth, the internal rate of return, benefit cost ratio and payback period, Sengar and Kothari [9] found that the Indian rose farmers can obtain higher incomes by greenhouse nursery. Kuswardhani et al. [10] used financial analysis and concluded that the average net returns on vegetable production under greenhouse conditions is USD 7043 per hectare, compared to USD 563 from open field farm practice in Indonesia. Interviewing poly house and open field tomato growers, respectively, Duhan [11] found that the yield of tomatoes under poly house cultivation achieved a level three times that of open field farm production in India. In the United States, Salamé-Donoso et al. [12] employed a general linear model and found that in comparison with open field farm practice, using high tunnels for strawberry production increases early yields and fruit weight by up to 54 and 63%, respectively. Although interesting findings were revealed in previous literature, the evidence drawn from these studies exclusively relied on a small-scale random survey of farms. Moreover, none of them empirically investigated the potential mechanism behind the effect of protected cultivation facility use on farm outcomes.
Agriculture is one of the main industries in Taiwan. In 2017, the agriculture and agri-food system accounted for 7.5% of Taiwan’s total gross domestic product [13]. Taiwan is affected frequently by typhoons, the largest weather-related disasters on the island. Typhoons produce heavy rainfalls and strong winds, resulting in severe damage, including flooding, mudslides, and a destruction of agricultural products and facilities. Moreover, global climate change has been negatively affecting Taiwan’s climate. Heavier but more erratic typhoons and rainfalls have seriously affected Taiwan. To cope with changes in climate and extreme weather, the Taiwanese government has promoted protected cultivation as one of the adaptation strategies for agriculture, which makes Taiwan an ideal case study to understand which factors are associated with farmers’ adoption on protected cultivation facilities, and how the adoption decision affects the economic aspects of sustainable agriculture, particularly when farmers experience a bad season due to a natural disaster.
The objectives of this study are multiple. First, we investigate the determinants associated with farmers’ decisions to adopt protected cultivation facilities. Second, we empirically quantify the effects of the adoption of protected cultivation facilities on one of the three pillars of agricultural sustainability–economic profitability. That is, H0: the mean economic profitability is the same for protected cultivation adopters and non-adopters versus Ha: the mean economic profitability is higher for protected cultivation adopters than that for non-adopters. Following previous studies [14,15,16,17], we use several indicators, including farm revenue, farm productivity and farm profit to measure economic profitability of sustainable agriculture. Third, we compare farm revenue, farm productivity and farm profit among farm households who have, and have not, adopted protected cultivation facilities when agricultural disasters occur. This part of the analysis can bring deeper policy insights regarding the effectiveness of adopting protected cultivation practices on the mitigation of natural disaster shocks and achieving sustainable agriculture. Lastly, we analyze how adopting protected cultivation facilities affects farmers’ decisions on labor input usage, including the number of hired workers, farm operators’ days of on-farm and off-farm employment. We hypothesized and empirically tested whether the changes in labor use on farm production can be seen as the mechanism behind the evident effect of protected cultivation adoption on the economic profitability of farm households.
This study has three unique features that set it apart from most previous work with a similar topic. First, in contrast to the majority of existing studies that have focused on a specific state/region and/or a particular crop plant, this study constructs a unique population-based sample of 255,925 vegetable, fruit and flower farm households, drawn from the Agricultural Census Survey in Taiwan in 2015. Using this population-based dataset yields more generalized results by broadening the scope of analysis. Second, previous studies have mainly relied on a field experiment to compare the outcomes of interest between protected cultivation adopters and non-adopters. Our study, on the other hand, employs a sophisticated econometric analysis to improve statistical efficiency regarding the effects of the adoption of protected cultivation facilities on economic aspects of sustainable agriculture. Lastly, this study fills the knowledge gap from previous studies on protected cultivation facilities by showing how the adoption of protected cultivation affects a farmer’s labor allocation.
2. Protected Cultivation in Taiwan
In Taiwan, the total areas occupied by protected cultivation facilities increased over time, from 1873 hectares in 1990 to 33,972 hectares in 2015. The proportion of the area occupied by protected cultivation facilities in an arable area increased from 0.3 to 7%. The average agricultural area with protected cultivation facilities per farm household was 0.66 hectare in 2015 [18]. The protected cultivation facilities used by farmers in Taiwan can be divided into the following four types:
(a) Simple tunnel-type sheds: generally, steel bars are used as the building materials for tunnel skeletons, and plastic cloths or green nets are laid over tunnels for thermal insulation, shade and rainwash reduction. Simple tunnel-type sheds are low in building costs; (b) horizontal trellises: horizontal trellises are erected to enable crops’ tendrils to climb along the trellises, so that crops can bear fruits in the air, to prevent the fruit rot resulting from waterlogged soil due to rains, and to even provide the fruits with sunlight; (c) net houses: according the covering area, net houses can be re-divided into shade-net houses and general net houses. Regarding shade-net houses, after building the horizontal frames with iron pipes or concrete columns, only the roofs are equipped with shading nets and the side walls are equipped with nothing. For general net houses, iron pipes are mostly used as the main supports, after building tunnel-type or horizontal frames on the roofs, the external walls are covered with shading nets, insect proof nets or plastic clothes to reduce the amount of light reaching the surfaces of crops and avoid direct impacts of rains; (d) greenhouses: greenhouses refer to the buildings covered by glass, plastic clothes or other transparent materials on the exteriors, which can effectively prevent ground temperature and soil humidity from reducing and enabling ground temperature not to drop too fast. According to the covered materials, they can be re-divided into glass greenhouses and plastic-covered greenhouses. Greenhouses are precisely structured and normally equipped with heating, cooling and other environment control devices, and their control abilities for the microclimate are stronger than net houses and the rain-proofing, wind-proofing and heat insulation functions are better. Greenhouses are high enough for agricultural workers to go in and out for operations with usual postures. This kind of facility is usually imported into agricultural machines and other equipment for automated operations.
Among 33,972 hectares is under protected cultivation in 2015, and the area of the places where horizontal trellises were used accounted for the largest proportion 44%, followed by net houses for 35%. Protected cultivation in Taiwan mainly focuses on simple facilities, with greenhouses only accounting for 10% [18].
As the climatic changes become intense, extreme climate events appear more frequently. For example, in 2009, Typhoon Morakot hit southern Taiwan with record high rainfall, exceeding 2600 mm (100 inches), causing severe floods, mudslides, about 700 deaths and more than TWD 16 billion (USD 0.5 billion) in losses for the agricultural sector [19]. In 2016, 13 consecutive days of cold wave caused agricultural losses of over TWD 4 billion (USD 120 million), also record high. The average annual economic losses from natural disasters have reached a staggering amount of TWD 11 billion (USD 0.34 billion) in a recent decade, in which the vast majority of the losses was caused by typhoons and torrential rainfall and the damage to vegetables and fruits is most severe [20]. Since protected cultivation is one possible adaptation strategy to agricultural production in areas face adversities due to climate change, from a policy perspective, it is important to understand the determinants of farmers’ adoption of protected cultivation, and the differences in economic outcomes and labor input use between protected cultivation adopters and their non-adopter counterparts.
3. Materials and Methods
3.1. Data
The data used in this study were drawn from the 2015 Agricultural Census Survey, an important national census in Taiwan. The data set collected basic information related to agriculture, forestry, fishery and animal husbandry production and recreational activities with a view to formulate strategies, plans and policies. The Directorate-General of Budget, Accounting and Statistics (DGBAS) of Executive Yuan, Taiwan, has conducted the census survey data every five years since 1955; and the 2015 census was the latest. The 2015 census dataset covered all registered farm households in Taiwan, and was conducted using face-to-face personal interviews.
Protected cultivation is often used for growing vegetables, fruits and flowers, since those farms are more vulnerable to climate variability and environmental extremes [21,22,23]. Therefore, we limited our sample to 255,925 farm households that produced vegetables, fruits or flowers as their primary farm products. The census survey collected information on farm production practices, land use status, on- and off-farm work, hired labor, farm revenues and costs, household and farm characteristics, etc. Each farm in the survey was asked the following questions: (a) whether or not you adopted protected cultivation for farm production in 2015, and if yes, which type of protected cultivation facility (simple tunnel-type sheds, horizontal trellises, net houses or greenhouses) you used; (b) the annual farm revenue and total production costs incurred in 2015; (c) size of cultivated area; (d) the total number of hired workers in 2015; (e) the number of days the farm operator worked on the farm in 2015, (f) whether or not the farm operator participated in off-farm employment in 2015; (g) if the farm household was exposed to any natural disaster in 2015. The responses to these sample questions are particularly valuable in seeking to achieve our research objectives.
In accordance with the information in the census survey, some explanatory variables were also specified. These include (a) socio-demographic characteristics of farm operators, including gender, age, education level and years of farming experience; (b) household characteristics, including the total number of family members and the ratio of family members under 15 years old to the total number of family members; and (c) farm characteristics, including types of farms and geographic locations.
To compare the differences in economic outcomes and the use of farm labor between protected cultivation adopters and their non-adopter counterparts, we defined the treatment group as farm households that used simple tunnel-type sheds, horizontal trellises, net houses or greenhouses as one of the protected cultivation facilities in 2015; the comparison group, on the other hand, was defined for those who did not use any protected cultivation facility in 2015. As shown in Table 1, 84% of the respondents did not adopt protected cultivation in Taiwan in 2015. There are also observable differences in the annual farm revenue, farm productivity, farm profit, the number of hired workers, the farm operator’s on-farm days and off-farm employment between the comparison and treatment groups. The farm households adopting protected cultivation tended to receive a higher annual farm revenue, farm productivity and farm profit, and hire more farm workers. Compared to the non adopters, farm operators adopting protected cultivation tended to spend more time (days) on on-farm work and were less likely to participate in off-farm employment. The farm type seemed to influence the adoption of protected cultivation. For example, only a small percentage of flower farmers did not adopt protected cultivation. Geographic location also matters for protected cultivation adoption. Farms located in the central part of Taiwan were more likely to use protected cultivation. In contrast, farms located in the southern part of Taiwan, where he has a tropical climate with stable temperatures throughout the year, were less likely to use protected cultivation.
3.2. Method
One methodological issue has to be discussed to identify the effect of the protected cultivation facilities adoption on farm outcomes. Because the adoption decision to use the facility is voluntary and it is made by each farmer, the endogeneity bias may occur. Endogeneity bias occurs if there are some common unobserved factors are associated with a farmer’s decision to use a protected cultivation facility and farm outcomes. For example, a more risk averse farmer is more likely to adopt a protected cultivation facility, and receives higher farm profit. In this case, the unobserved farmer’s risk attitude will cause the endogeneity issue. The empirical analysis consists of two parts. First, we used a probit model to examine the determinants associated with farmers’ adoption to cultivation facilities. Second, we employed several treatment effect models to carefully control for the potential endogeneity bias. We also use several economic indicators of sustainable agriculture (including annual farm revenue, farm productivity and farm profit) and labor use decisions (including the number of hired workers, farm operators’ days of on-farm work and off-farm employment participation).
3.2.1. The Determinants of the Adoption of Protected Cultivation
We estimated a binary probit model to identify the determinants associated with the decision to adopt protected cultivation among farms. The probability of the adoption of protected cultivation is specified as
where Treatment is a dummy variable whose value is equal to one if the farm household i used one of the protected cultivation facilities in 2015 (treatment group), and 0 otherwise (comparison group). The vector of X included gender, several dummy variables indicating the farm operators’ age, education level and years of farming experience, the total number of family members, the ratio of family members under 15 years old to the total number of family members, types of farms and geographic locations to reflect the socio-demographic characteristics of farmers, and household and farm characteristics, respectively. is the cumulative distribution function of the standard normal distribution; is a random error term assumed to be normally distributed. Since the probit model involves a non-linear transformation, the coefficients cannot be directly interpretable. The marginal effects are reported [24].
3.2.2. Effects of Adopting Protected Cultivation of Farm Outcomes and Labor Use
We are interested in the effect of adopting protected cultivation on several economic indicators of sustainable agriculture and labor use decisions. To measure the economic aspect of sustainable agriculture, following previous studies [14,15,16,17], we used annual farm revenue, farm productivity (defined as farm revenue per hectare of cultivated land), and farm profit (farm revenue minus costs). To respond to skewness and measure percent change, we used logarithmic scales in the annual farm revenue, farm productivity and farm profit. Regarding labor input usage, we used the total number of hired workers, the farm operator’s on-farm days, and whether or not the farm operator participated in off-farm employment as three indicators. In total, six dependent variables were used in this stage of analysis. For each dependent variable, we estimate the following outcome equation:
where represents the farm household/farm operator i’s value of outcome j including farm revenue (logarithmic scale), farm productivity (logarithmic scale), farm profit (logarithmic scale), the total number of hired workers, on-farm days and off-farm work. The dummy variable Treatment and the vector of regressors X are specified in Equation (1). The coefficient measures how adopting protected cultivation affects the outcome j. To cope with the self-selection bias and show the robustness of our results, we apply three different methods: propensity score matching (PSM), inverse probability weighting (IPW) and inverse probability weighting regression adjustment (IPWRA) in Equation (2) [25]. Technical details of the PSM, IPW and IPWRA methods are discussed in the Appendix A.
4. Results
4.1. Determinants of the Decision to Adopt Protected Cultivation
The estimated results of the probit model on the determinants associated with the decision to adopt the protected cultivation of farms are reported in Table 2. The results indicate that farm operators’ gender, age, education level, farming experience, family size, farm type, farm size and geographic location are significantly associated with the decision to adopt protected cultivation. In addition to the estimated coefficients, the marginal effects that measure the partial effects of each explanatory variable on the probability that the observed dependent variable (Treatment) is equal to one are also presented in Column (3) of Table 2.
Regarding the socio-demographic characteristics of farm operators, compared to their female counterparts, male farm operators are more likely to adopt protected cultivation by 0.9 percentage points. To the best of our knowledge, not much evidence in previous studies has been provided to address how gender affects the adoption of protected cultivation. However, there is evidence indicating that male farmers have a higher probability of adopting climate-smart agricultural practices in Kenya [26]. Climate-smart agriculture comprises three pillars: (a) sustainably increasing agricultural productivity and incomes; (b) adapting and building resilience to climate change; and (c) reducing and/or removing greenhouse gases emissions where possible [26]. Age is found to be negatively associated with the adoption of protected cultivation, meaning that younger farmers are more likely to adopt protected cultivation than older ones. For example, compared to those aged over 70, farm operators aged 40 or younger, 41 to 50, 51 to 60, and 61 to 70 are more likely to adopt protected cultivation by 7.4, 4.9, 2.9, 2.3 percentage points, respectively. This result is similar to that of Ghanghas et al. [27] who concluded that poly house technology is more likely to be adopted by energetic young farmers. Farm operators with more farming experience show a higher probability of adopting protected cultivation. Compared to the reference group (farm operators with fewer than 5 years of farming experience), farm operators with 5 to 9, 10 to 19, and 20+ years of farming experience are more likely to adopt protected cultivation by 3.2, 4.9, and 7.4 percentage points, respectively.
The results also show that an additional household member is associated with a 0.7 percentage point increase in the probability of the adoption of protected cultivation. Our findings on farming experience and family size are in accordance with the finding in Al-Shadiadeh et al. [28]. The authors found that longer years of experience in agriculture and a larger family size increase the adoption of protected tomato practices. Our results also indicate that the farm type has divergent effects on the probability of adopting protected cultivation. For example, there is no significant difference in the probability of adopting protected cultivation between fruit farmers (the reference group) and vegetable farmers. However, flower farmers have a higher likelihood of adopting protected cultivation by 29.9 percentage points compared to fruit farmers. One possible explanation of this finding could be that the Taiwanese government promoted protected cultivation for floriculture prior to 2000. The technology of growing flowers using protected cultivation facilities in Taiwan is close to maturity. Therefore, farmers who grow flowers have a greater probability of using protected cultivation facilities compared to those who grow fruits and vegetables.
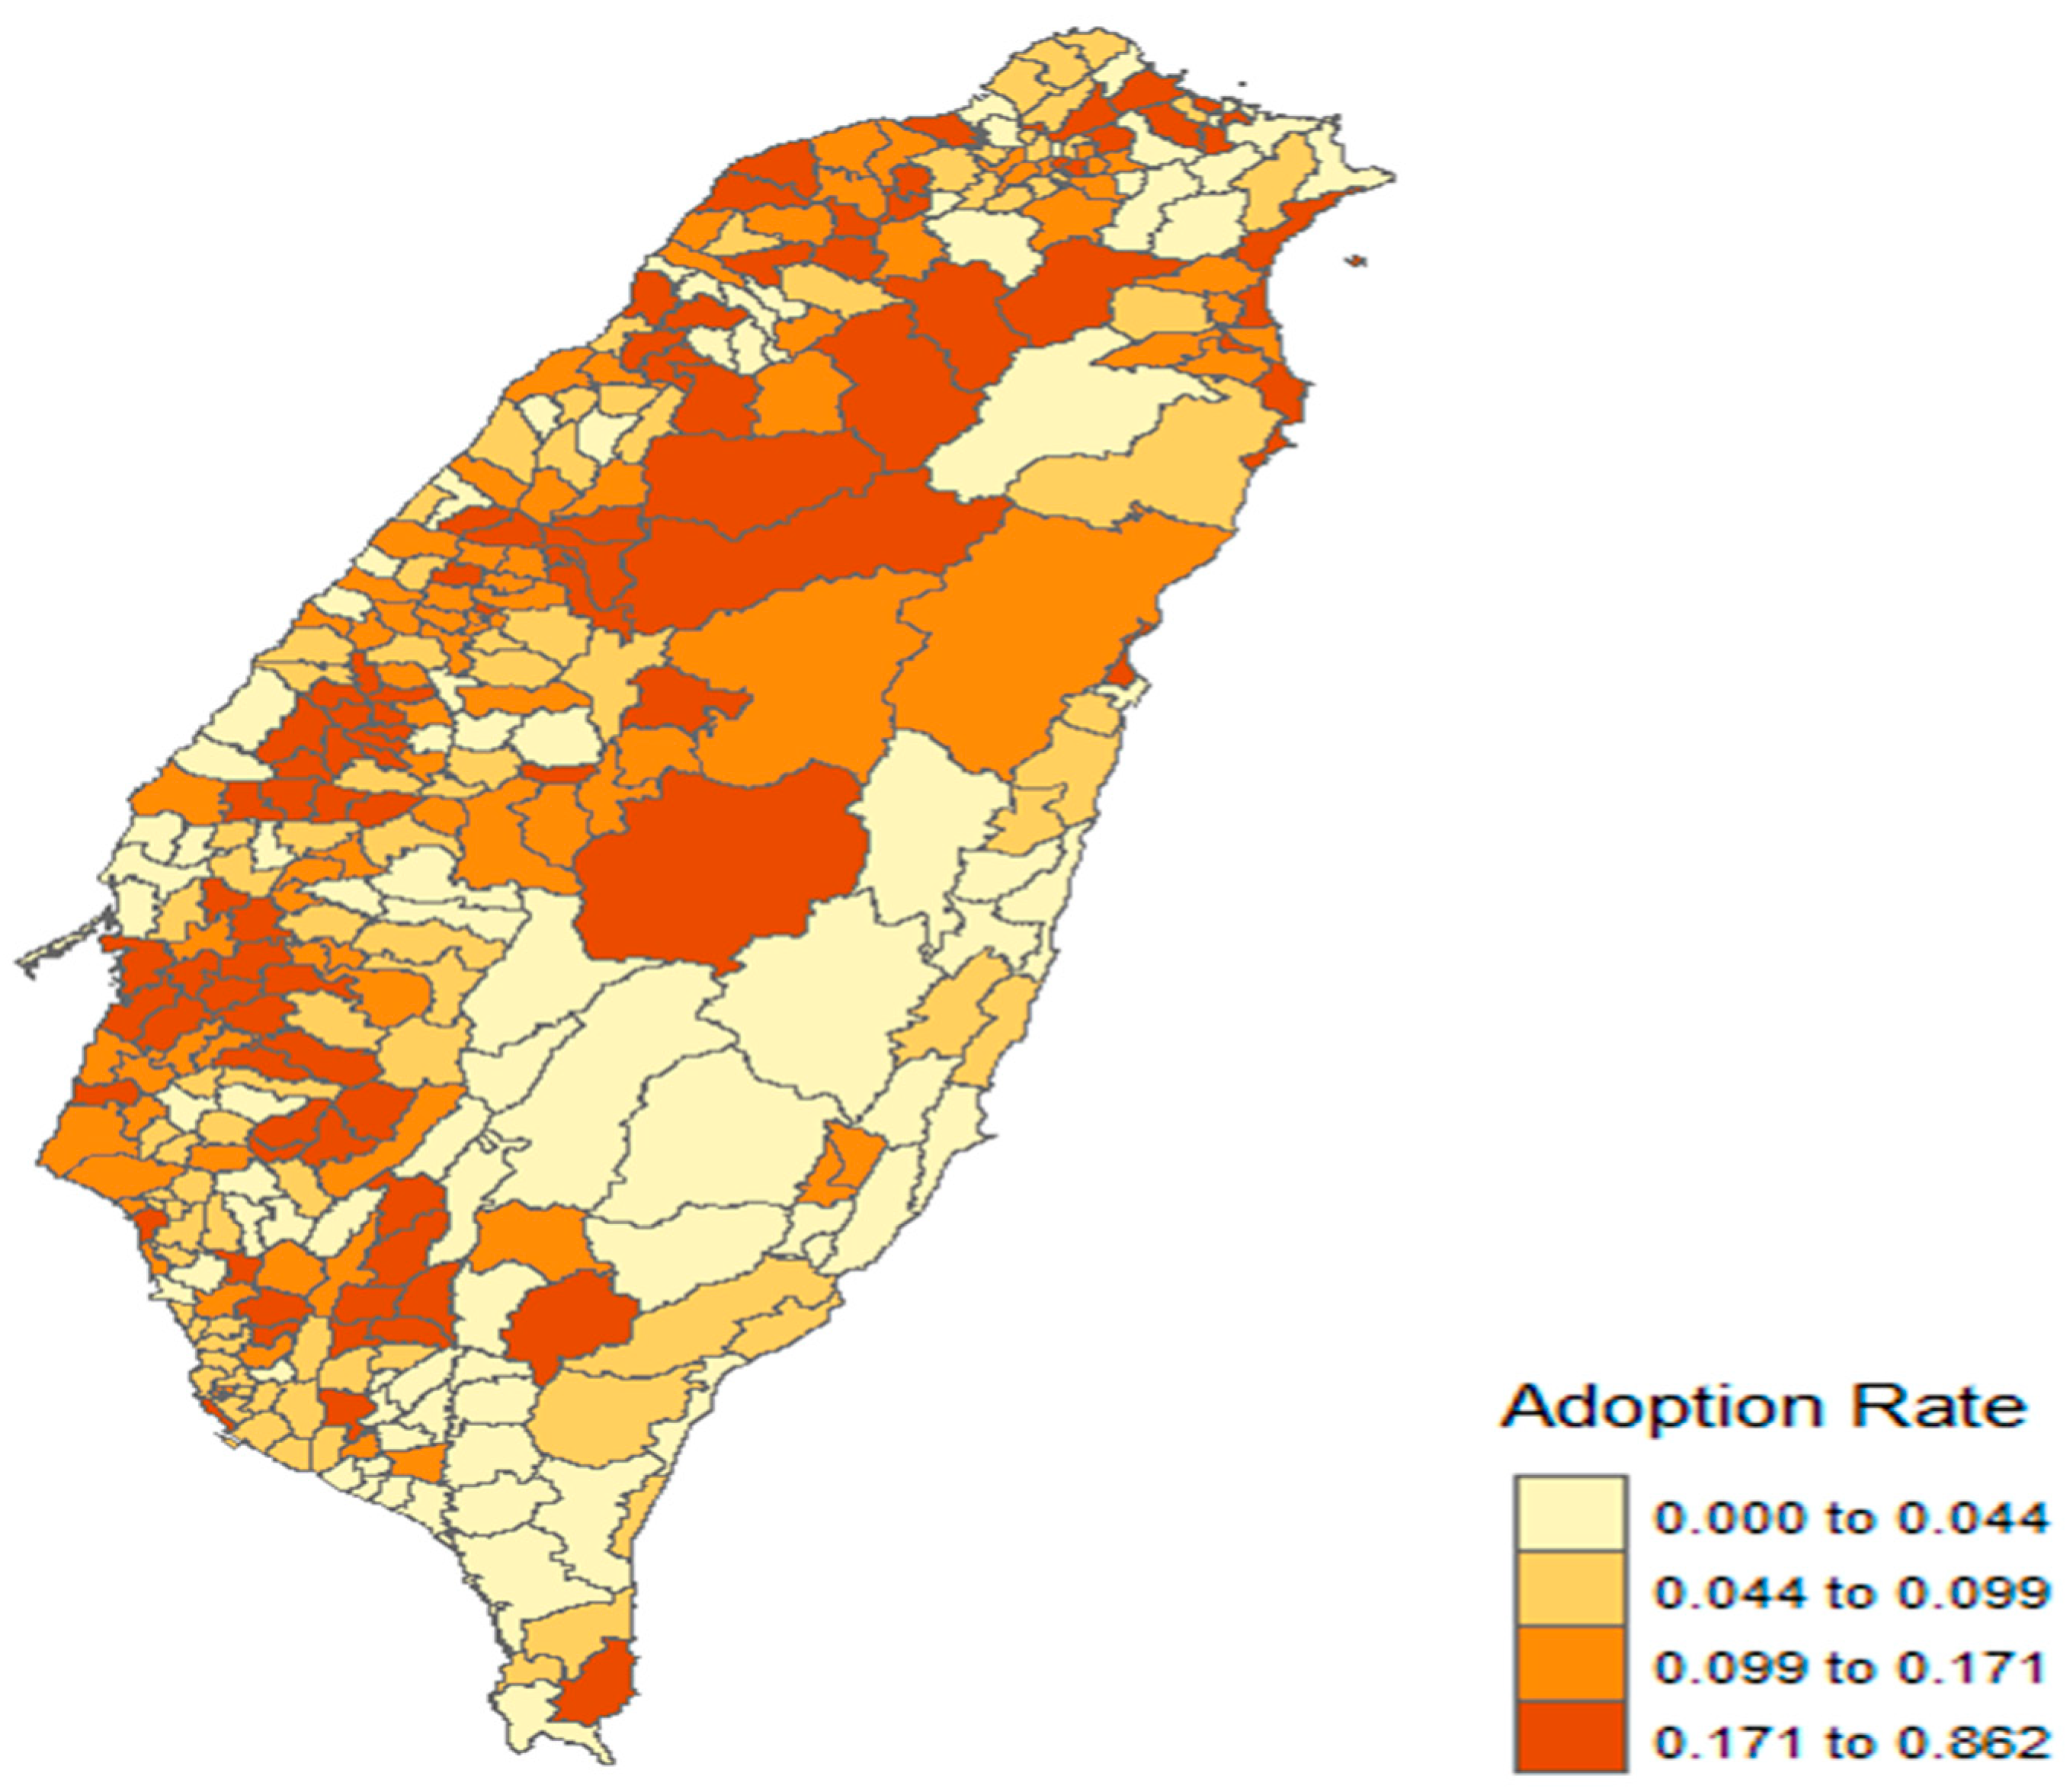
Farm size is also associated with the adoption of protected cultivation. The results show that an additional hectare in the farm size leads to a larger probability of adopting protected cultivation by 0.3 percentage points. Many scholars believe that farm size plays an important role in technology adoption [29,30,31]. Protected cultivation facilities are likely to be scale-dependent, since economies of scale are required to ensure profitability. Compared to the farms in northern part of Taiwan (the reference group), those located in central (eastern) part of Taiwan are more (less) likely to adopt protected cultivation facilities by 8.5 (13.0) percentage points, respectively. Location may matter because of weather patterns and the geographic distribution of agriculture across Taiwan. The detailed distribution of the adoption rate of protected cultivation stratified by township in Taiwan is presented in Figure 1, with a darker color indicating a higher adoption rate.
4.2. The Effects of Protected Cultivation Adoption on Farm Revenue, Farm Productivity and Farm Profit
We estimated the average treatment effects of the adoption of protected cultivation on farm revenue, farm productivity and farm profit among fruit, vegetable and flower farmers using the PSM, IPW and IPWRA methods, respectively. The estimation results are reported in Table 3. Farm revenue, farm productivity and farm profit under protected cultivation are significantly higher than those under open field cultivation. More specifically, compared to the non-adopters, the adoption of protected cultivation is associated with a range from a 71.2 to 80.4% increase in farm revenue, a range from 63.2 to 69.8% increase in farm productivity, and a range from 68.0 to 78.3% increase in farm profit. These estimation results are consistent with the findings of previous studies examining the economic impact of the adoption of protected cultivation among farmers [9,10,11,32].
To further explore how the effects of the adoption of protected cultivation vary with farm households whether or not they are exposed to any natural disaster in 2015, we stratified farm households into two sub-groups: the disaster-affected group and non-disaster-affected group. Table 4 documents the differences in the estimated treatment effects between the two groups. As shown in Table 4, even when farm households were affected by natural disasters, their adoption of protected cultivation is still associated with a range from a 65.0 to 69.5% increase in farm revenue, compared to their counterpart of non-adopters. The treatment effects obtained from the PSM, IPW and IPWRA methods in the disaster-affected group, however, are of smaller magnitude than those in the non-disaster-affected group. This result is not unexpected, since natural disasters in Taiwan, especially typhoons, may partially/fully destroy protected cultivation facilities and cause losses in production, resulting in smaller farm revenues. Similar patterns were observed in farm productivity and farm profit. With respect to farm productivity and farm profit, the adoption of protected cultivation is associated with a range from 53.7 to 54.8% and 62.6 to 67.8% increase in the disaster-affected group and a range from 65.2 to 66.2% and 70.6 to 73.1% increase in the non-disaster-affected group.
4.3. The Effects of Protected Cultivation Adoption on Labor Use Decisions
Given the positive results of protected cultivation adoption on farm revenue, farm productivity and farm profitability, one interesting question is what causes these results. In this study, we argue that the pathway behind these effects may be due to the changes in labor use on the farm. This hypothesis is built on the farm production theory. Given that farm income or revenue is determined by the inputs’ use, and the farm facility and labor are the two major inputs for farm production, the use of protected cultivation facility can change the labor allocation and farm income. To test this hypothesis, we estimated the equations for the number of hired workers, on-farm days of the farm operator, and whether or not the farm operator worked off the farm. As reported in Table 5, it is evident that protected cultivation adoption significantly influences the number of hired workers and the farm operator’s on-farm working days and off-farm employment participation. Compared to the non-adopter counterparts, the protected cultivation adopter tends to hire more farm workers, by a range from 1.947 to 2.064 persons, suggesting a corresponding increase ranging from 48 to 51%. In addition, the farm operators who adopt protected cultivation work more days (ranging from 38.21 to 38.98 days per year) on the farm and decrease the probability of off-farm employment participation, by a range from 11.3 to 11.5 percentage points. The corresponding increase in the number of days working on the farm and the decrease in the probability of off-farm employment participation is about 34% and ranges from 54 to 55%, respectively.
Our findings on the changes in labor allocation, as a mechanism resulting in the positive effect of protected cultivation on farms’ economic outcomes, is similar to the findings in previous studies, which documented that protected cultivation is more likely to occur in labor-intensive industries [33,34]. For example, growing vegetables under protected cultivation takes 2–3 times more labor than that under open field cultivation [35]. Most operations under protected cultivation in Taiwan are still being carried out by hand. The farm operator needs not only to hire farm workers for more physical duties, such as potting, watering, weeding and maintaining, but also handle day-to-day management responsibilities. The labor intensity of protected cultivation may explain why we observe that the adoption of protected cultivation causes an increase in the number of hired farm workers and farm operators’ on-farm working days, which may imply a decrease in off-farm employment participation subject to the time constraint.
5. Discussion
Our findings show that farm profit under protected cultivation is significantly higher than that under open field cultivation. This finding is still held even when farmers were affected by natural disaster shocks. These results provide supportive evidence that protected cultivation is a self-insurance strategy used by farmers to protect against climate change-induced risks. From the perspective of farmers, there are trade-offs between protection and economic costs with respect to the use of protected cultivation facilities. Therefore, providing financial support or subsidies from the government to help farmers cover the expense of constructing protected cultivation facilities, especially the high initial cost, seems to be a legitimate policy direction to increase the adoption rates of protected cultivation facilities. In addition to economic incentives, other factors, such as awareness in the adoption process, must also be taken into consideration, according to Vecchio et al. [36]. A higher level of awareness of the benefits of protected cultivation (e.g., increasing farm profit and decreasing the loss of natural disaster shocks) can encourage farmers to adopt protected cultivation. Better awareness and understanding of protected cultivation requirements through education workshops could reduce farmers’ information search cost and improve dissemination, and thus get more farmers involved.
Our results also reveal that the adoption of protected cultivation increases the number of hired workers and the farm operator’s on-farm working days. The increase in the demand for hired labor and the supply of own on-farm labor may imply that protected cultivation adopters enhance production efficiency by reallocating hired and own labor inputs and concentrating more on farming activities, resulting in higher farm profits. However, a shortage of farm workers has been a challenge in the agricultural sector in Taiwan. Hence, the government should put more effort to help solve the labor shortage problem in the agricultural sector. For example, how to attract the young generation to engage in agriculture should be a policy priority.
It should be emphasized that this study empirically investigates the effects of protected cultivation techniques on the economic sustainability of farms; however, the other two pillars—the environmental and social consequences—are not analyzed. For example, greenhouse production has high energy consumption for heating and lighting, causing increased CO2 emissions. Pollution by pesticides and nutrients has been criticized as well. Other environmental problems such as impacts on the landscape and light emissions from supplementary lighting have also been mentioned [37,38,39].
6. Conclusions
Given the fact that climate change is an unavoidable natural phenomenon and agriculture cannot be delinked from nature, protected cultivation can serve as a coping strategy to reduce climate change-induced risks in farming and ensure sustainability in agriculture. This study used a unique population-based agricultural census dataset in Taiwan and employed several treatment effect methods to investigate the effects of adopting protected cultivation on the economic indicators of sustainable agriculture and the labor use decisions of farm households. In contrast to previous studies on the topic of protected cultivation adoption, we used a large-scale census dataset on farms. We also carefully addressed the potential endogeneity bias and carefully identified the effects of protected cultivation facilities use on farms’ economic outcomes.
Our results add to the current literature on the adoption of protected cultivation by showing that farm revenue, farm productivity and farm profit under protected cultivation are statistically significantly higher than those under open field cultivation. This finding is validated even when farmers were affected by natural disaster shocks. In addition, we go one-step further from the existing studies by showing that the use of protected cultivation facilities significantly increases the number of hired workers and the farm operator’s on-farm working days, and decreases the farm operator’s off-farm employment participation. The changes in labor allocation decisions may be identified as pathways from the adoption of protected cultivation to the increase in the economic outcomes.
Although this study reveals some interesting findings, some caveats remain. For example, our method lies in the selection-on-observable approach. Due to the lack of exogenous changes in policy implementation or validated instruments, we cannot apply the selection-on-unobservable method. Although there may exist unobserved factors that can threaten our findings, our robustness checks and relevant tests have shown confidence of our specification. Second, due to data limitation in the survey, we do not have detailed information on the construction of protected cultivation facilities. Whether or not a net house and greenhouse have a fixed foundation and building and cover materials used cannot be identified in this study. Therefore, we cannot further categorize protected cultivation facilities into simple and reinforced groups. The robustness of our findings could be further validated if this kind of information becomes available in the future.
Author Contributions
Conceptualization, L.-C.S. and H.-H.C.; methodology, J.-Y.L. and H.-H.C.; software, J.-Y.L.; formal analysis, J.-Y.L.; resources, L.-C.S.; writing—original draft preparation, P.-A.L.; writing—review and editing, P.-A.L. and L.-C.S.; supervision, H.-H.C. All authors have read and agreed to the published version of the manuscript.
Funding
Hung-Hao Chang acknowledges funding support from the Ministry of Science and Technology under the grant number 109-2410-H-002-128, and the Council of Agriculture under the grant number. 109 Council of Agriculture- 2.1.3-1.3- 015.
Conflicts of Interest
The authors declare no conflict of interest.
Appendix A
Appendix A.1. Propensity Score Matching Method
Since the participation in the adoption of protected cultivation is not random but depends stochastically on a vector of observable variables X, applying the propensity score matching (PSM) method can reduce the treatment selection bias. The propensity score, proposed by Rosenbaum and Rubin [40], is a conditional probability measure of treatment participation, given as a set of observed covariates X and is denoted p(X), where:
The propensity score is usually measured using any of the parametric or semiparametric methods [41]. The propensity score is estimated using a probit model (Equation (1)), conditioning on a set of observable variables that may be associated with the decision of the adoption of protected cultivation.
An assumption that plays an important role in the PSM is the conditional independence assumption (CIA). The CIA states that:
which implies that the decision to adopt protected cultivation (i.e., Treatment) does not depend on outcomes Y0 (the outcome for the comparable group) and Y1 (the outcome for the treatment group), after controlling for the propensity score, p(X). That is, the selection bias can be overcome after controlling for p(X).
Based on the similarity of p(X), the matched sample can be constructed. We then use the match sample to estimate the effect of the adoption of protected cultivation on farm households’ economic outcomes and labor use decisions by averaging the differences in the outcomes of interest between the comparison and treatment groups.
Appendix A.2. Inverse Probability Weighting Method
Another statistical technique used to correct for sample selection and missing data bias under the CIA is the inverse probability weighting (IPW) method. IPW refers to weighting the outcome of interest by the inverse of each individual’s probability of being assigned to a specific treatment, given a set of observed covariates (X). This probability is known as the propensity score, as denoted in Equation (A1). For the individuals in the treatment group, the weight is , whereas the weight is for those in the comparison group. The effect of the adoption of protected cultivation can be estimated by the following IPW estimator:
Appendix A.3. Inverse Probability Weighting Regression Adjustment Method
In the IPW method, we employ the probit model to estimate the propensity score and let the outcome of interest be re-weighted by the propensity score. However, the IPW estimator is highly sensitive to the propensity score. If the propensity score is incorrectly specified, then the estimation of the treatment effect is bias. Therefore, we further apply the inverse probability weighting regression adjustment (IPWRA) method to check if the similar results are obtained.
The IPWRA method combines the strength of the OLS and IPW. An advantage of IPWRA is that when the OLS regression mode is correctly specified but the propensity score model is not, the IPWRA method still provides an unbiased estimate of treatment effect. IPWRA allows for potential misspecifications in either one of the OLS and IPW models which try to measure two potential outcomes [42]. IPWRA can be implemented by running a weighted least square regression model using the inverse probability as the sampling weight.

Table A1.
Covariates balance.
| Variable | Match | Mean | t-Test | |||
|---|---|---|---|---|---|---|
| Treatment | Comparison | % bias | t | p > |t| | ||
| Male | Unmatched | 0.834 | 0.800 | 8.8 | 15.69 | 0.000 |
| Matched | 0.834 | 0.843 | −2.4 | −3.55 | 0.000 | |
| Age_40 | Unmatched | 0.039 | 0.031 | 4.4 | 8.50 | 0.000 |
| Matched | 0.039 | 0.035 | 2.6 | 3.62 | 0.000 | |
| Age_4150 | Unmatched | 0.142 | 0.118 | 7.0 | 13.18 | 0.000 |
| Matched | 0.142 | 0.135 | 2.0 | 2.72 | 0.006 | |
| Age_5160 | Unmatched | 0.296 | 0.280 | 3.6 | 6.57 | 0.000 |
| Matched | 0.296 | 0.294 | 0.4 | 0.61 | 0.545 | |
| Age_6170 | Unmatched | 0.287 | 0.287 | 0.0 | −0.01 | 0.992 |
| Matched | 0.287 | 0.291 | −0.8 | −1.07 | 0.285 | |
| Junior | Unmatched | 0.255 | 0.232 | 5.3 | 9.84 | 0.000 |
| Matched | 0.255 | 0.255 | 0.1 | 0.16 | 0.871 | |
| Senior | Unmatched | 0.280 | 0.253 | 6.2 | 11.54 | 0.000 |
| Matched | 0.280 | 0.272 | 2.0 | 2.73 | 0.006 | |
| College | Unmatched | 0.078 | 0.081 | −1.4 | −2.47 | 0.013 |
| Matched | 0.078 | 0.072 | 2.2 | 3.20 | 0.001 | |
| Experience_0509 | Unmatched | 0.111 | 0.121 | −3.1 | −5.71 | 0.000 |
| Matched | 0.111 | 0.099 | 3.5 | 5.22 | 0.000 | |
| Experience_1019 | Unmatched | 0.209 | 0.207 | 0.4 | 0.81 | 0.420 |
| Matched | 0.209 | 0.204 | 1.4 | 1.92 | 0.054 | |
| Experience_20 | Unmatched | 0.619 | 0.593 | 5.2 | 9.54 | 0.000 |
| Matched | 0.619 | 0.639 | −4.1 | −5.93 | 0.000 | |
| HHSIZE | Unmatched | 3.873 | 3.527 | 17.3 | 32.14 | 0.000 |
| Matched | 3.873 | 3.827 | 2.3 | 3.18 | 0.001 | |
| HHSIZE_child | Unmatched | 0.070 | 0.056 | 10.0 | 18.94 | 0.000 |
| Matched | 0.070 | 0.064 | 3.9 | 5.37 | 0.000 | |
| Vegetable | Unmatched | 0.385 | 0.387 | −0.4 | −0.71 | 0.476 |
| Matched | 0.385 | 0.397 | −2.6 | −3.68 | 0.000 | |
| Flower | Unmatched | 0.070 | 0.007 | 32.9 | 90.42 | 0.000 |
| Matched | 0.070 | 0.068 | 0.6 | 0.59 | 0.558 | |
| Land | Unmatched | 0.905 | 0.842 | 4.4 | 7.80 | 0.000 |
| Matched | 0.905 | 0.927 | −1.6 | −1.60 | 0.111 | |
| Center | Unmatched | 0.559 | 0.338 | 45.5 | 84.85 | 0.000 |
| Matched | 0.559 | 0.563 | −0.9 | −1.28 | 0.202 | |
| South | Unmatched | 0.336 | 0.511 | −35.8 | −64.52 | 0.000 |
| Matched | 0.336 | 0.328 | 1.8 | 2.60 | 0.009 | |
| East | Unmatched | 0.010 | 0.039 | −18.7 | −29.08 | 0.000 |
| Matched | 0.010 | 0.011 | −0.4 | −0.91 | 0.360 | |
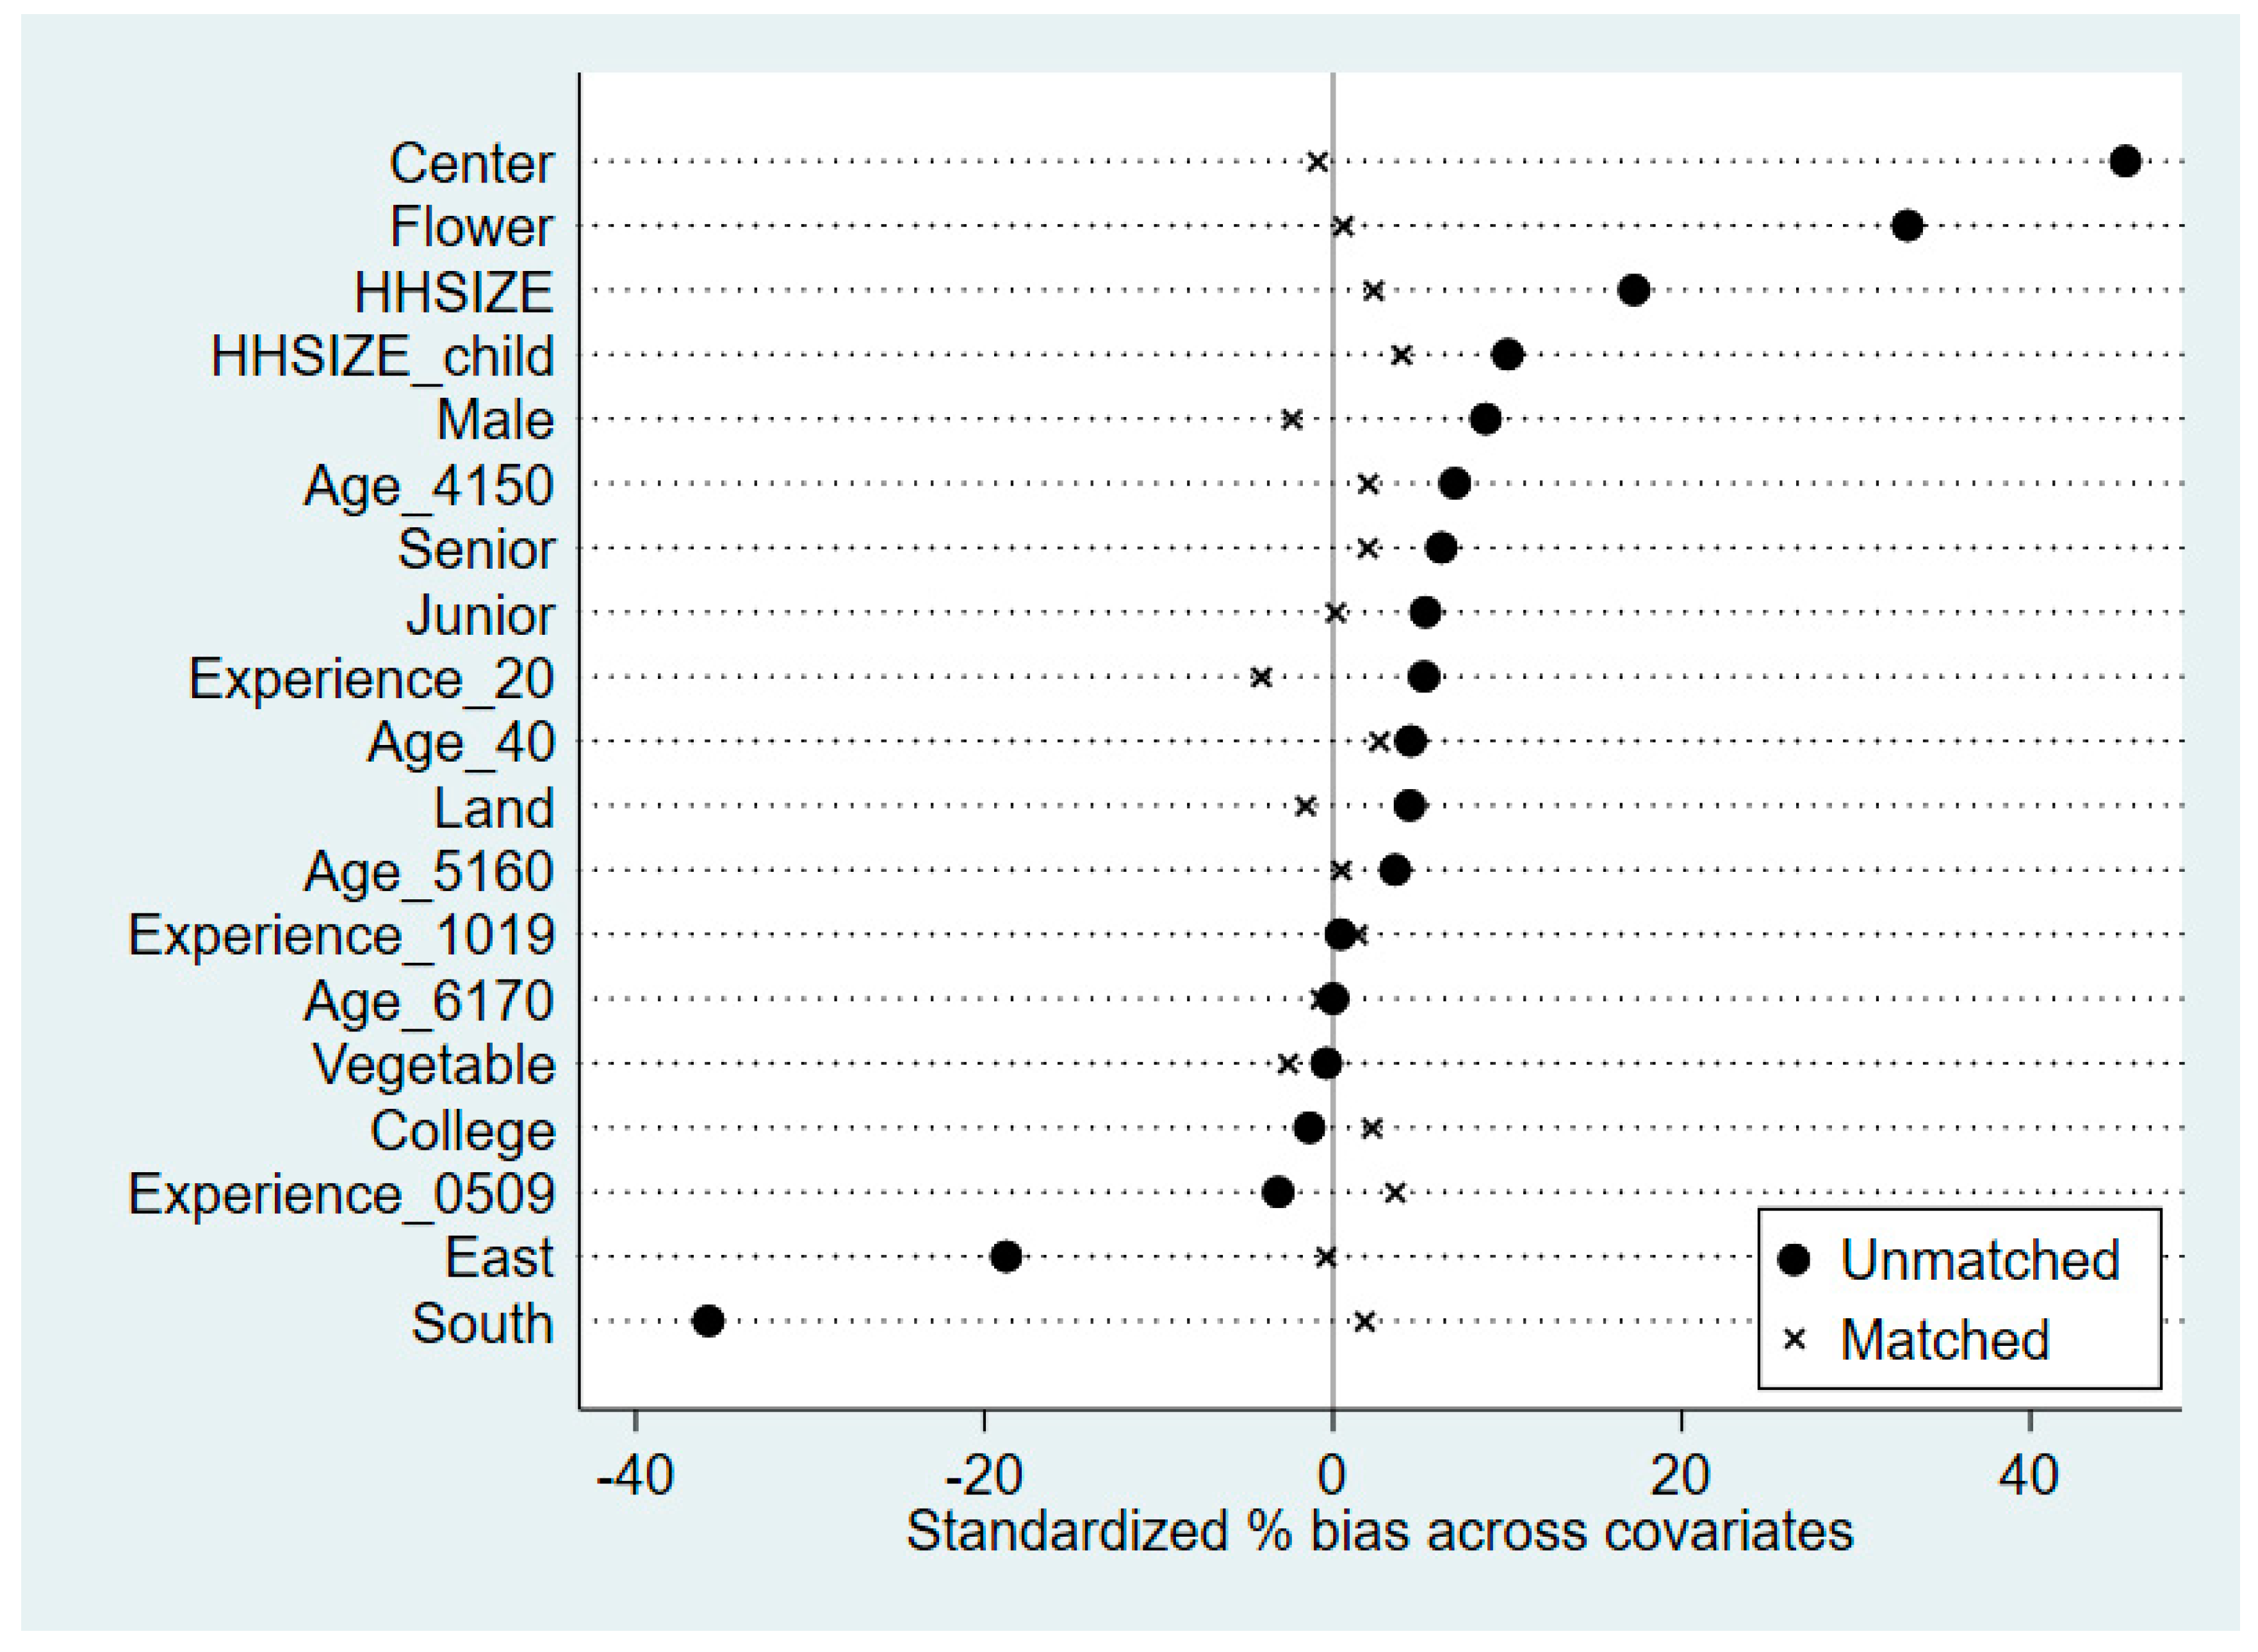
Figure A1.
Differences in the sample means of each explanatory variable between the two groups.

References
- Hayati, D. A Literature Review on Frameworks and Methods for Measuring and Monitoring Sustainable Agriculture; No. 22. Technical Report; Food and Agriculture Organization: Roma, Italy, 2017. [Google Scholar]
- Hardaker, J.B. Guidelines for the Integration of Sustainable Agriculture and Rural Development into Agricultural Policies; Food & Agriculture Organization: Roma, Italy, 1997. [Google Scholar]
- EU Commission. A Framework for Indicators for the Economic and Social Dimensions of Sustainable Agriculture and Rural Development; Food and Agriculture Organization: Roma, Italy, 2001.
- Aryal, J.P.; Sapkota, T.B.; Khurana, R.; Khatri-Chhetri, A.; Jat, M.L. Climate change and agriculture in South Asia: Adaptation options in smallholder production systems. Environ. Dev. Sustain. 2019, 1–31. [Google Scholar] [CrossRef] [Green Version]
- Fleming, A.; Vanclay, F. Farmer responses to climate change and sustainable agriculture. A review. Agron. Sustain. Dev. 2010, 30, 11–19. [Google Scholar] [CrossRef] [Green Version]
- Yohannes, H. A review on relationship between climate change and agriculture. J. Earth Sci. Clim. Chang. 2016, 7, 335. [Google Scholar]
- Mishra, G.P.; Singh, N.; Kumar, H.; Singh, S.B. Protected cultivation for food and nutritional security at Ladakh. Def. Sci. J. 2010, 60, 219–225. [Google Scholar] [CrossRef] [Green Version]
- Ummyiah, H.M.; Wani, K.P.; Khan, S.H.; Magray, M.M. Protected cultivation of vegetable crops under temperate conditions. J. Pharmacogn. Phytochem. 2017, 6, 1629–1634. [Google Scholar]
- Sengar, S.H.; Kothari, S. Economic evaluation of greenhouse for cultivation of rose nursery. Afr. J. Agric. Res. 2008, 3, 435–439. [Google Scholar]
- Kuswardhani, N.; Soni, P.; Shivakoti, G.P. Development protected cultivation in horticulture product: Feasibility analysis in West Java Province. Int. J. Adv. Sci. Eng. Inf. Technol. 2014, 4, 368–372. [Google Scholar] [CrossRef]
- Duhan, P.K. Cost benefit analysis of tomato production in protected and open farm. Int. J. Adv. Res. Manag. Soc. Sci. 2016, 5, 140–148. [Google Scholar]
- Salamé-Donoso, T.P.; Santos, B.M.; Chandler, C.K.; Sargent, S.A. Effect of high tunnels on the growth, yields, and soluble solids of strawberry cultivars in Florida. Int. J. Fruit Sci. 2010, 10, 249–263. [Google Scholar] [CrossRef]
- Council of Agriculture, Executive Yuan, Taiwan. Agriculture and Agri-Food Chain Statistics. Available online: https://echart.coa.gov.tw/index.php?cid=3 (accessed on 25 October 2020).
- Castellini, C.; Boggia, A.; Cortina, C.; Dal Bosco, A.; Paolotti, L.; Novelli, E.; Mugnai, C. A multicriteria approach for measuring the sustainability of different poultry production systems. J. Clean. Prod. 2012, 37, 192–201. [Google Scholar] [CrossRef]
- Gafsi, M.; Legagneux, B.; Nguyen, G.; Robin, P. Towards sustainable farming systems: Effectiveness and deficiency of the French procedure of sustainable agriculture. Agric. Syst. 2006, 90, 226–242. [Google Scholar] [CrossRef]
- Herzog, F.; Gotsch, N. Assessing the sustainability of smallholder tree crop production in the tropics: A methodological outline. J. Sustain. Agric. 1998, 11, 13–37. [Google Scholar] [CrossRef]
- Pannell, D.J.; Glenn, N.A. A framework for the economic evaluation and selection of sustainability indicators in agriculture. Ecol. Econ. 2000, 33, 135–149. [Google Scholar] [CrossRef]
- Harvest. Facility Agriculture Overview and Policy in Taiwan. Available online: https://reading.udn.com/v2/magDesc.do?id=116708 (accessed on 18 July 2020).
- Environmental Protection Administration. Extreme Events and Disasters Are the Biggest Threat to Taiwan: Typhoon Morakot; Environmental Protection Administration: Taipei, Taiwan, 2010.
- Council of Agriculture, Executive Yuan, Taiwan. Available online: https://agrstat.coa.gov.tw/sdweb/public/official/OfficialInformation.aspx (accessed on 15 September 2020).
- Choudhary, M.L.; Patel, V.B.; Siddiqui, M.W.; Mahdl, S.S. Climate Dynamics in Horticultural Science, Volume One: The Principles and Applications; CRC Press: Florida, FL, USA, 2015. [Google Scholar] [CrossRef]
- Knox, J.; Morris, J.; Hess, T. Identifying future risks to UK agricultural crop production: Putting climate change in context. Outlook Agric. 2010, 39, 249–256. [Google Scholar] [CrossRef] [Green Version]
- Rajasekar, M.; Arumugam, T.; Kumar, S.R. Influence of weather and growing environment on vegetable growth and yield. J. Hortic. For. 2013, 5, 160–167. [Google Scholar]
- Wooldridge, J. Econometric Analysis of Cross Section and Panel Data, 2nd ed.; MIT Press: Cambridge, MA, USA, 2010. [Google Scholar]
- Guo, S.; Fraser, M.W. Propensity Score Analysis: Statistical Methods and Applications; Sage Publications Inc.: California, CA, USA, 2010. [Google Scholar]
- Mutoko, M.C. Adoption of Climate-Smart Agricultural Practices: Barriers, Incentives, Benefits and Lessons Learnt from the MICCA Pilot Site in Kenya; MCC Program; FAO: Rome, Italy, 2014; pp. 1–62. [Google Scholar]
- Ghanghas, B.S.; Malik, J.S.; Yadav, V.P.S. Sustainable vegetables and flowers production technology (poly house): Problems & prospects in Haryana. Indian Res. J. Ext. Educ. 2018, 18, 12–16. [Google Scholar]
- Al-Shadiadeh, A.N.; Al-mohammady, F.M.; Abu-Zahrah, T.R. Factors influencing adoption of protected tomato farming practices among farmers in Jordan Valley. World Appl. Sci. J. 2012, 17, 572–578. [Google Scholar]
- Ahmed, S.; Bagchi, K.K. Factors and constraints for adopting new agricultural technology in Assam with special reference to Nalbari district: An empirical study. Contemp. Indian Policy 2004, 3, 205–216. [Google Scholar]
- Gabre-Madhin, E.Z.; Haggblade, S. Successes in African agriculture: Results of an expert survey. World Dev. 2004, 32, 745–766. [Google Scholar] [CrossRef] [Green Version]
- Mignouna, D.B.; Manyong, V.M.; Rusike, J.; Mutabazi, K.D.S.; Senkondo, E.M. Determinants of adopting imazapyr-resistant maize technologies and its impact on household income in Western Kenya. Agbioforum 2011, 14, 158–163. [Google Scholar]
- Punera, B.; Pal, S.; Jha, G.K.; Kumar, P. Economics and institutional aspects of protected cultivation of carnation in Himachal Pradesh. Agric. Econ. Res. Rev. 2017, 29, 73–80. [Google Scholar] [CrossRef]
- Hanan, J.J.; Holley, W.D.; Goldsberry, K.L. Greenhouse Management; Springer Science & Business Media: Berlin, Germany, 2012; Volume 5. [Google Scholar] [CrossRef]
- Maheshwari, B.; Purohit, R.; Malano, H.; Singh, V.P.; Amerasinghe, P. The security of water, food, energy and liveability of cities. Water Sci. Technol. 2014, 71. [Google Scholar] [CrossRef]
- Food and Fertilizer Technology Center. Protective Structures for Improved Crop Production. Available online: https://www.fftc.org.tw/zh/publications/main/1082 (accessed on 5 August 2020).
- Vecchio, Y.; Agnusdei, G.P.; Miglietta, P.P.; Capitanio, F. Adoption of precision farming tools: The case of Italian farmers. Int. J. Environ. Res. Public Health 2020, 17, 869. [Google Scholar] [CrossRef] [PubMed] [Green Version]
- Bergstrand, K.-J. Approaches for Mitigating the Environmental Impact of Greenhouse Horticulture. Ph.D. Thesis, Swedish University of Agricultural Sciences, Uppsala, Sweden, January 2010. [Google Scholar]
- Bres, W. Estimation of nutrient losses from open fertigation systems to soil during horticultral plant cultivation. Pol. J. Environ. Stud. 2009, 18, 341–345. [Google Scholar]
- Carlsson-Kanyama, A. Food consumption patterns and their influence on climate change. Ambio 1998, 27, 528–534. [Google Scholar]
- Rosenbaum, P.R.; Rubin, D.B. The central role of the propensity score in observational studies for causal effects. Biometrika 1983, 70, 41–55. [Google Scholar] [CrossRef]
- Cameron, A.; Trivedi, P. Microeconometrics: Methods and Applications; Cambridge University Press: New York, NY, USA, 2005. [Google Scholar]
- Hirano, K.; Imbens, G.; Ridder, G. Efficient estimation of average treatment effects using the estimated propensity score. Econometrica 2003, 71, 1161–1189. [Google Scholar] [CrossRef] [Green Version]
Figure 1.
Mapping of the adoption rate of protected cultivation stratified across all townships in Taiwan.
Figure 1.
Mapping of the adoption rate of protected cultivation stratified across all townships in Taiwan.

Table 1.
Descriptive statistics and definitions of the selected variables.
| Full Sample | Treatment Group: Protected Cultivation Adopters | Control Group: Protected Cultivation Non-Adopters | |||||
|---|---|---|---|---|---|---|---|
| Number of Farms (%) | 255,925 (100%) | 39,917 (16%) | 216,008 (84%) | ||||
| Variable | Definition | Mean | S.D. | Mean | S.D. | Mean | S.D. |
| Adoption | If adopting protective cultivation (= 1). | 0.16 | 0.36 | 1.00 | 0.00 | 0.00 | 0.00 |
| Farm revenue | Annual farm revenue (TWD 1000). | 407.99 | 790.97 | 760.07 | 1150.37 | 342.92 | 685.25 |
| Farm productivity | Farm revenue per hectare of cultivated land (TWD 1000/hectare). | 529.45 | 992.38 | 973.49 | 2265.84 | 447.40 | 418.25 |
| Farm profit | Farm’s annual profit (TWD 1000). | 226.16 | 403.00 | 412.94 | 552.66 | 191.65 | 358.25 |
| Hired labor | Total number of hired workers (person). | 4.02 | 11.33 | 6.66 | 15.24 | 3.54 | 10.38 |
| On-farm days | Days of the farm operator worked on farm in 2015 (day). | 113.85 | 76.93 | 150.81 | 83.43 | 107.02 | 73.67 |
| Off-farm work | If the farm operator worked off the farm in 2015 (= 1). | 0.21 | 0.41 | 0.10 | 0.30 | 0.23 | 0.42 |
| Disaster | If the farm household exposed to any natural disaster in 2015 (= 1). | 0.10 | 0.31 | 0.11 | 0.32 | 0.10 | 0.30 |
| Socio-demographic characteristics of farm operators | |||||||
| Male | If a male farm operator (= 1). | 0.80 | 0.40 | 0.83 | 0.37 | 0.80 | 0.40 |
| Age_40 | If age is ≦40 (= 1). | 0.03 | 0.18 | 0.04 | 0.19 | 0.03 | 0.17 |
| Age_4150 | If age is 41–50 (= 1). | 0.12 | 0.33 | 0.14 | 0.35 | 0.12 | 0.32 |
| Age_5160 | If age is 51–60 (= 1). | 0.28 | 0.45 | 0.30 | 0.46 | 0.28 | 0.45 |
| Age_6170 | If age is 61–70 (= 1). | 0.29 | 0.45 | 0.29 | 0.45 | 0.29 | 0.45 |
| Age_71 | If age is ≧71 (= 1). | 0.28 | 0.45 | 0.24 | 0.42 | 0.28 | 0.45 |
| Primal | If finished elementary school or below (= 1). | 0.43 | 0.49 | 0.39 | 0.49 | 0.43 | 0.50 |
| Junior | If finished junior high school (= 1). | 0.24 | 0.42 | 0.26 | 0.44 | 0.23 | 0.42 |
| Senior | If finished senior high school (= 1). | 0.26 | 0.44 | 0.28 | 0.45 | 0.25 | 0.43 |
| College | If college education or higher (= 1). | 0.08 | 0.27 | 0.08 | 0.27 | 0.08 | 0.27 |
| Experience _04 | If less than 5 years farm experience (= 1). | 0.08 | 0.26 | 0.06 | 0.24 | 0.08 | 0.27 |
| Experience _0509 | If 5–9 years farm experience (= 1). | 0.12 | 0.32 | 0.11 | 0.31 | 0.12 | 0.33 |
| Experience _1019 | If 10–19 years farm experience (= 1). | 0.21 | 0.41 | 0.21 | 0.41 | 0.21 | 0.41 |
| Experience _20 | If more than 19 years farm experience (= 1). | 0.60 | 0.49 | 0.62 | 0.49 | 0.59 | 0.49 |
| Household characteristics | |||||||
| HHSIZE | Number of family members (person). | 3.58 | 1.98 | 3.87 | 2.04 | 3.53 | 1.96 |
| HHSIZE _child | Ratio of family members aged <15 to total number of members. | 0.06 | 0.13 | 0.07 | 0.14 | 0.06 | 0.13 |
| Farm characteristics | |||||||
| Vegetable | If a vegetable farm (= 1). | 0.39 | 0.49 | 0.38 | 0.49 | 0.39 | 0.49 |
| Fruit | If a fruit farm (= 1). | 0.60 | 0.49 | 0.55 | 0.50 | 0.61 | 0.49 |
| Flower | If a flower farm (= 1). | 0.02 | 0.13 | 0.07 | 0.25 | 0.01 | 0.08 |
| Land | Size of the farm land (hectare). | 0.85 | 1.47 | 0.90 | 1.34 | 0.84 | 1.49 |
| North | If in northern Taiwan (= 1). | 0.11 | 0.31 | 0.10 | 0.29 | 0.11 | 0.32 |
| Center | If in central Taiwan (= 1). | 0.37 | 0.48 | 0.56 | 0.50 | 0.34 | 0.47 |
| South | If in southern Taiwan (= 1). | 0.48 | 0.50 | 0.34 | 0.47 | 0.51 | 0.50 |
| East | If in eastern Taiwan (= 1). | 0.03 | 0.18 | 0.01 | 0.10 | 0.04 | 0.19 |
Table 2.
Estimation results of the probability of protected cultivation adoption.
| Variable | Coefficient (1) | S.E. (2) | Marginal Effect (3) | |
|---|---|---|---|---|
| Male | 0.040 | * | 0.023 | 0.009 |
| Age_40 a | 0.330 | *** | 0.063 | 0.074 |
| Age_4150 | 0.219 | *** | 0.045 | 0.049 |
| Age_5160 | 0.130 | 0.037 | 0.029 | |
| Age_6170 | 0.101 | 0.021 | 0.023 | |
| Junior b | 0.072 | 0.031 | 0.016 | |
| Senior | 0.086 | 0.054 | 0.019 | |
| College | 0.050 | 0.039 | 0.011 | |
| Experience_0509 c | 0.143 | 0.063 | 0.032 | |
| Experience_1019 | 0.221 | *** | 0.057 | 0.049 |
| Experience_20 | 0.330 | *** | 0.045 | 0.074 |
| HHSIZE | 0.031 | *** | 0.011 | 0.007 |
| HHSIZE_child | 0.059 | 0.039 | 0.013 | |
| Vegetable d | 0.024 | 0.216 | 0.005 | |
| Flower | 1.336 | *** | 0.198 | 0.299 |
| Land | 0.014 | ** | 0.007 | 0.003 |
| Center e | 0.380 | ** | 0.170 | 0.085 |
| South | −0.114 | 0.166 | −0.026 | |
| East | −0.583 | *** | 0.166 | −0.130 |
| Constant | −1.729 | *** | 0.221 | |
| Log Likelihood | −103,681 | |||
| N | 255,925 | |||
Note: ***, **, * indicate the significance at the 1, 5 and 10% level, respectively. a The reference group is Age_71. b The reference group is Primal. c The reference group is Experience_04. d The reference group is Fruit. e The reference group is North.
Table 3.
The effect of cultivation adoption on the economic indicators of sustainable agriculture.
| Method | Farm Revenue | Farm Productivity | Farm Profit | ||||||
|---|---|---|---|---|---|---|---|---|---|
| Coefficient | S.E. | Coefficient | S.E. | Coefficient | S.E. | ||||
| PSM | 0.712 | *** | 0.008 | 0.634 | *** | 0.006 | 0.680 | *** | 0.008 |
| IPW | 0.738 | *** | 0.061 | 0.632 | *** | 0.067 | 0.706 | *** | 0.062 |
| IPWRA | 0.744 | *** | 0.061 | 0.642 | *** | 0.067 | 0.714 | *** | 0.065 |
| N | 255,925 | 255,925 | 255,925 | ||||||
Note: all of the dependent variables are in logarithm. *** indicates the significance at the 1% level. PSM, IPW, IPWRA indicate the propensity score matching, inverse probability weighting, and inverse probability weighting regression adjustment method, respectively.
Table 4.
The effect of the protected cultivation adoption on the economic indicators of sustainable agriculture by exposure to natural disasters in 2015.
Table 4.
The effect of the protected cultivation adoption on the economic indicators of sustainable agriculture by exposure to natural disasters in 2015.
| Farm Revenue | ||||||
| Disaster-Affected Group | Non-Disaster-Affected Group | |||||
| Method | Coefficient | S.E. | Coefficient | S.E. | ||
| PSM | 0.695 | *** | 0.022 | 0.738 | *** | 0.008 |
| IPW | 0.660 | *** | 0.082 | 0.753 | *** | 0.064 |
| IPWRA | 0.650 | *** | 0.090 | 0.761 | *** | 0.063 |
| N | 26,766 | 229,159 | ||||
| Farm Productivity | ||||||
| Disaster-Affected Group | Non-Disaster-Affected Group | |||||
| Method | Coefficient | S.E. | Coefficient | S.E. | ||
| PSM | 0.541 | *** | 0.018 | 0.661 | *** | 0.007 |
| IPW | 0.537 | *** | 0.145 | 0.652 | *** | 0.063 |
| IPWRA | 0.548 | *** | 0.144 | 0.662 | *** | 0.063 |
| N | 26,766 | 229,159 | ||||
| Farm Profit | ||||||
| Disaster-Affected Group | Non-Disaster-Affected Group | |||||
| Method | Coefficient | S.E. | Coefficient | S.E. | ||
| PSM | 0.678 | *** | 0.023 | 0.706 | *** | 0.008 |
| IPW | 0.629 | *** | 0.084 | 0.720 | *** | 0.064 |
| IPWRA | 0.626 | *** | 0.091 | 0.731 | *** | 0.066 |
| N | 26,766 | 229,159 | ||||
Note: all of the dependent variables are in logarithm. *** indicates the significance at the 1% level.
Table 5.
The effect of protected cultivation adoption on farm household labor use.
| Hired Workers | On-Farm Days | Off-Farm Employment | ||||||||||
|---|---|---|---|---|---|---|---|---|---|---|---|---|
| Method | Coefficient | S.E. | Magnitude #1 | Coefficient | S.E. | Magnitude #1 | Coefficient | S.E. | Magnitude #1 | |||
| PSM | 1.947 | *** | 0.081 | 48% | 38.212 | *** | 0.596 | 34% | 0.115 | *** | 0.002 | −55% |
| IPW | 2.064 | *** | 0.531 | 51% | 38.930 | *** | 2.520 | 34% | −0.113 | *** | 0.008 | −54% |
| IPWRA | 1.948 | *** | 0.649 | 48% | 38.977 | *** | 2.527 | 34% | −0.114 | *** | 0.008 | −54% |
| N | 255,925 | 255,925 | 255,925 | |||||||||
Note: #1 evaluated at the sample mean of the dependent variable. *** indicates the significance at the 1% level.
Publisher’s Note: MDPI stays neutral with regard to jurisdictional claims in published maps and institutional affiliations. |
© 2020 by the authors. Licensee MDPI, Basel, Switzerland. This article is an open access article distributed under the terms and conditions of the Creative Commons Attribution (CC BY) license (http://creativecommons.org/licenses/by/4.0/).
Share and Cite
MDPI and ACS Style
Liao, P.-A.; Liu, J.-Y.; Sun, L.-C.; Chang, H.-H. Can the Adoption of Protected Cultivation Facilities Affect Farm Sustainability? Sustainability 2020, 12, 9970. https://0-doi-org.brum.beds.ac.uk/10.3390/su12239970
AMA Style
Liao P-A, Liu J-Y, Sun L-C, Chang H-H. Can the Adoption of Protected Cultivation Facilities Affect Farm Sustainability? Sustainability. 2020; 12(23):9970. https://0-doi-org.brum.beds.ac.uk/10.3390/su12239970
Chicago/Turabian StyleLiao, Pei-An, Jhih-Yun Liu, Lih-Chyun Sun, and Hung-Hao Chang. 2020. "Can the Adoption of Protected Cultivation Facilities Affect Farm Sustainability?" Sustainability 12, no. 23: 9970. https://0-doi-org.brum.beds.ac.uk/10.3390/su12239970
Note that from the first issue of 2016, this journal uses article numbers instead of page numbers. See further details here.