Article

PV Waste Thermal Treatment According to the Circular Economy Concept

1
Department of Technologies and Installations for Waste Management, Silesian University of Technology, Konarskiego 18, 44-100 Gliwice, Poland
2
Department of Metallurgy, Łukasiewicz Research Network, Institute of Non-Ferrous Metals, Sowińskiego 5, 44-100 Gliwice, Poland
3
Helioenergia Sp. z o.o., Rybnicka 68, 44-230 Czerwionka-Leszczyny, Poland
4
Institute for Chemical Processing of Coal, Zamkowa 1, 41-803 Zabrze, Poland
*
Author to whom correspondence should be addressed.
Sustainability 2020, 12(24), 10562; https://0-doi-org.brum.beds.ac.uk/10.3390/su122410562
Submission received: 3 November 2020 / Revised: 9 December 2020 / Accepted: 12 December 2020 / Published: 17 December 2020
(This article belongs to the Special Issue Environmental Science and Sustainable Waste Management)

Abstract

:
Photovoltaic panels (PV) are one of the most popular technological solutions used to produce green renewable energy. They are known as green technology, but by analyzing a life cycle of a common panel, we can find out that production of these panels is strictly associated with generation of a large waste stream. PV modules are constantly modified and, therefore, it is required to consider the impact of the applied materials on the environment during the whole lifecycle of the product. The most important aspect of the assessment of a life cycle of a photovoltaic module in the phase of decommissioning is material recycling. The process of material recycling is very difficult, due to the lamination used in the currently exploited technology. This paper presents the results of pyrolysis for a sample of a silicon module. The results of the presented research show a weight loss of 48.16 in case of the tested samples. This paper presents the outcome of a quantitative analysis of the content of polycyclic aromatic for liquid and concentrations of Br, Cl and F for a gaseous fraction of pyrolysis products. The goal of the research presented in the paper was to find the optimal parameters for thermal separation, as well as the influence of the energy consumption and materials separation efficiency on the final thermal efficiency of the process.

1. Introduction

Declining natural deposits of energy resources encourage the use of renewable energy sources, which include solar, hydro, geothermal, and wind energy. One of the most developing branches of the renewable energy industry is the market connected with photovoltaics (PV). The history of photovoltaics dates back to the 1930s. The production of solar panels on a commercial scale began already in the 1980s. The first products were based on crystalline silicon (mono- and polycrystalline cells) with a formed semiconductor connector. The next generations were based on thin-film technology using semiconductor materials based on amorphous silicon, cadmium telluride, or metal blends—gal, indium, copper, diselenide.
The most popular branch of photovoltaic technology is the silicon cell technology, especially mono- and polycrystalline silicon cells. For common citizens of Europe, the PV technology equals green technology. The cause for such reasoning is the fact that media show the PV technology only from the perspective of the second phase of its life. By the second phase of life for solar panels we understand exploitation, during which PVs do not produce any waste or pollution, while generating electricity via photoconversion. The question we should ask ourselves is: What is happening throughout the rest of the life cycle of a photovoltaic panel. In this paper, we attempt to show how to manage panels, which have been withdrawn from the exploitation and are stored on landfills as a photovoltaic waste. The next generation of PVs is intensively developed, and the European Union has recently included the PV waste in the new Waste of Electrical and Electric Equipment (WEEE) directive [1]. In detail, the EU imposes legal obligations on PV manufacturers, distributors, and sellers to ensure collection and recycling of their waste products [2]. Despite the regulations, WEEE is still not managed properly, and the recycling rate is extremely low around the world. Regarding the issues of the main technologies for recycling of PV waste, intertwined gaps, issues and complexities are often revealed [1,3].
The main problem is the multilayer material. There are many combined versions, such as: Dye-sensitized solar cell—Grätzel cells, multi-link (CPV), organic (OPV), polymeri, and other cells [4,5].
Over the years, many modifications have been introduced to the construction of the photovoltaic panels. Their aim was to reduce the amount of used natural materials (mainly silicon) in order to limit the production costs and, at the same time, improve the efficiency of solar energy conversion, reduce the panel weight, and adapt the cells to new applications [6,7,8,9,10,11,12].
The article presents a panel, in case of which the mass of monocrystalline silicon cells, and thus the mass of used metals, was reduced. In order to improve photovoltaic conversion, an polyethylene-vinyl acetate (EVA) copolymer layer with a peroxyene dye was used and an ethylene-tetrafluoroethylene (ETFE) polymer was used as the surface layer.
A panel composed of many layers of polymers form a compact structure, which is difficult to separate—this could be achieved through the use of adhesives and the vacuum-closing of the cells. Many PV cells are now reaching the final stage of their life cycle and are being replaced. The problem with their proper utilization is becoming serious. Many recycling methods are being tested in order to achieve the best environmental performance, including thermal recycling (energy recovery through combustion), chemical recycling (obtaining materials with other physical and chemical properties), and raw material recycling (degradation of polymer chains through physicochemical processes—e.g., pyrolysis) [13,14].
Currently, a lot of photovoltaic waste is deposited in landfills. The literature shows several studies of environmental consequences of landfilling of c-Si modules, but it is known that they can generate pollutants in a form of leaching metals in case of improper management [15,16]. In the traditional approach to the photovoltaic waste, the modules are separated from balance-of-system (BOS) [17]. It is also possible to reuse photovoltaic installation, but it mainly involves the replacement of junction boxes, diodes, plugs, sockets, and applying a new aluminium frame [18,19]. This method is correct from the perspective of waste management and allows to prolong a life cycle of a panel by approximately 15 years (the efficiency of installation is reduced by 1–2%). The only problem with this method is the fact that it cannot be used constantly, and thus it is necessary to find a method to manage the waste produced by photovoltaic modules. Europe is currently the global leader in PV waste management. The methods of material recycling available in Europe are based on the mechanical process and currently allow to recover up to 80% of the materials; there is also a European company that conducts recycling using mechanical and heat processes to increase the material recovery rate up to 96%. According to the literature, the solution that uses thermal (pyrolysis) and mechanical processes is the most beneficial from the perspective of LCA analysis [20,21]. The problem of PV wastes is currently one of the most prevailing issues around the world, which is proved by numerous researches conducted by many scientists [22,23,24,25,26,27,28]. The aim of this paper is to assess the influence of the pyrolysis of a PV module on the natural environment, as well as to find the optimal parameters for the thermal process used in PV modules waste management.

2. The Production Process for Poly- and Monocrystalline Silicon Panels

The production of mono- and polycrystalline solar panels mainly involves the use of blocks of pure silicon. The cell manufacturing process can be divided into several basic stages. The first stage is the extraction and processing of materials into raw materials, which are necessary during the production of cells. Obtaining pure metallic silicon can be achieved by using the following reaction:
SiO2 + 2C → Si + 2CO
The purity of the obtained product at this stage can reach values of over 98%. The next step is to remove the remaining impurities from the material to achieve the purity of the sample at the level close to 99.9%. This is possible by using several processes, which are conducted at 500 °C and pressure of 2.5 MPa with a copper catalyst. The whole stage is finished by the pyrolysis process. Maximizing the purity of the substrate used during the production process of silicon cells allows manufacturing of highly efficient cells, which is very important for consumers and is a quality factor for any company. It is possible to use silicon with a lower degree of purity, but it is associated with a decrease in the efficiency of the final product. It should be noted that by reducing the purity of the substrates we reduce the costs of the production processes, which means that we reduce the price of the final product (panels). Thanks to this, the customer can choose from the products of different quality.
The next step is to pour the molten silicon stream into a cooled tank covered with a layer of Si3N4, in which crystallization occurs. The speed of the crystallization process is regulated by heating elements located around the tank. This method of obtaining silicon is effective for polycrystalline silicon and is called the block casting.
The most commonly used method for obtaining monocrystalline silicon is the Czochralski method. In this process, as in the previous one, polycrystalline silicon is used as a substrate. The whole process consists of several basic stages. The first one consists of melting the polycrystalline silicon in a furnace (preheated to 1410 °C) in an argon atmosphere. Then, the material is cooled to the freezing point. The temperature in the entire volume of the processed material must be kept at a constant, steady level to prevent disturbances during formation of the crystallization front. The production of said front requires cooling of the solution or introduction of an artificial spore. Such an embryo initiates a crystallization process that will lead to formation of a monocrystalline cylindrical crystal. The next step is to remove the resulting embryo. It is important to maintain appropriate extraction speed and temperature during this process and ensure that the embryo rotates around its axis during extraction. The next stage consists of crystal extension.
The crystals obtained as a result of the previously described methods are then cut into plates of appropriate dimensions. Cutting tiles involves production of large amounts of waste. Material losses at this stage of production may reach up to 50%. The next steps leading to the production of a cell include:
  • Physical treatment consisting of edge grinding. This process removes all types of mechanical damage and also allows to adjust the thickness of the resulting panel,
  • Cleaning the surface of the plate and polishing it with NaOH, SiO2, or distilled water.
  • Chemical or laser surface treatment of the plate,
  • Surface texture, as a result of which the tile’s ability to reflect light is reduced. It can be carried out by using a KOH-NH3 solution. The goal of the whole procedure is to maximize the amount of light absorbed by the product,
  • Washing the plate in acid, e.g., HCl,
  • Creating n-p joints using Al or Ag,
  • Passivation and anti-reflective layer application. This can be carried out by exposing the plate to Si3N4 at elevated temperatures (400–450 °C) in an inert gas atmosphere (SiH4, NH3). The process of covering with an anti-reflective layer, which is done using Si, SiN4, Al2O3, SiO2, or TiO2, allows further reduction in the amount of reflected radiation (reduction of reflected light by 5.8%),
  • Optical cell evaluation and tests,
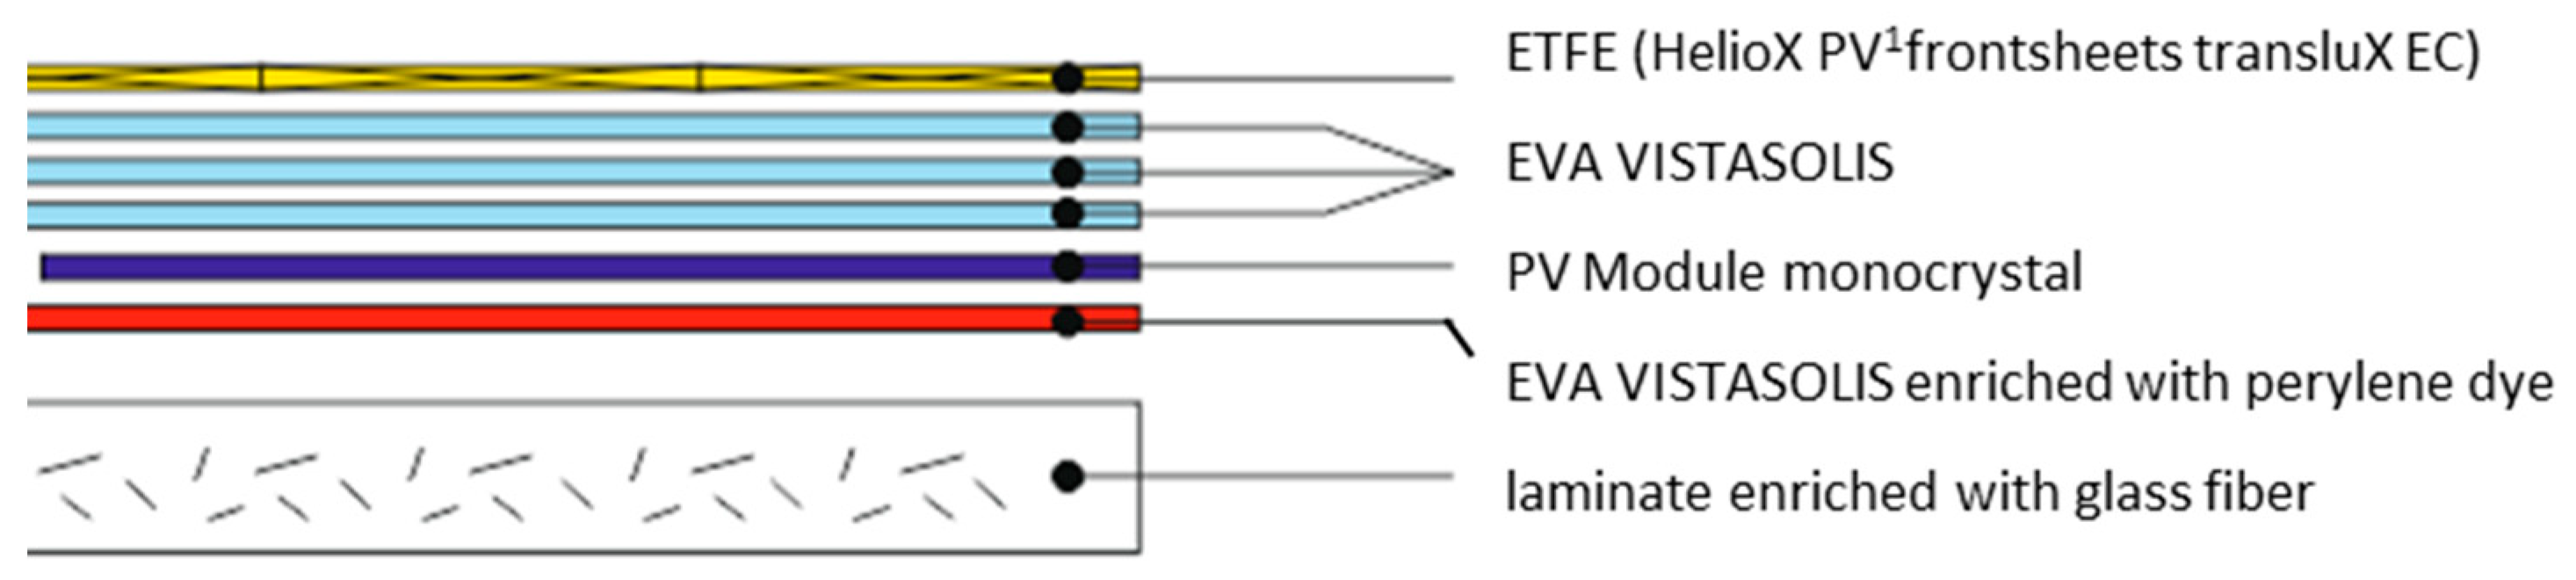
  • Combining the resulting cells into modules,
  • Covering the cell with a thin EVA layer,
  • Covering the front part of the cell with a protective layer of transparent glass,
  • Covering the back with Tedlar/Al/Tedlar layers.
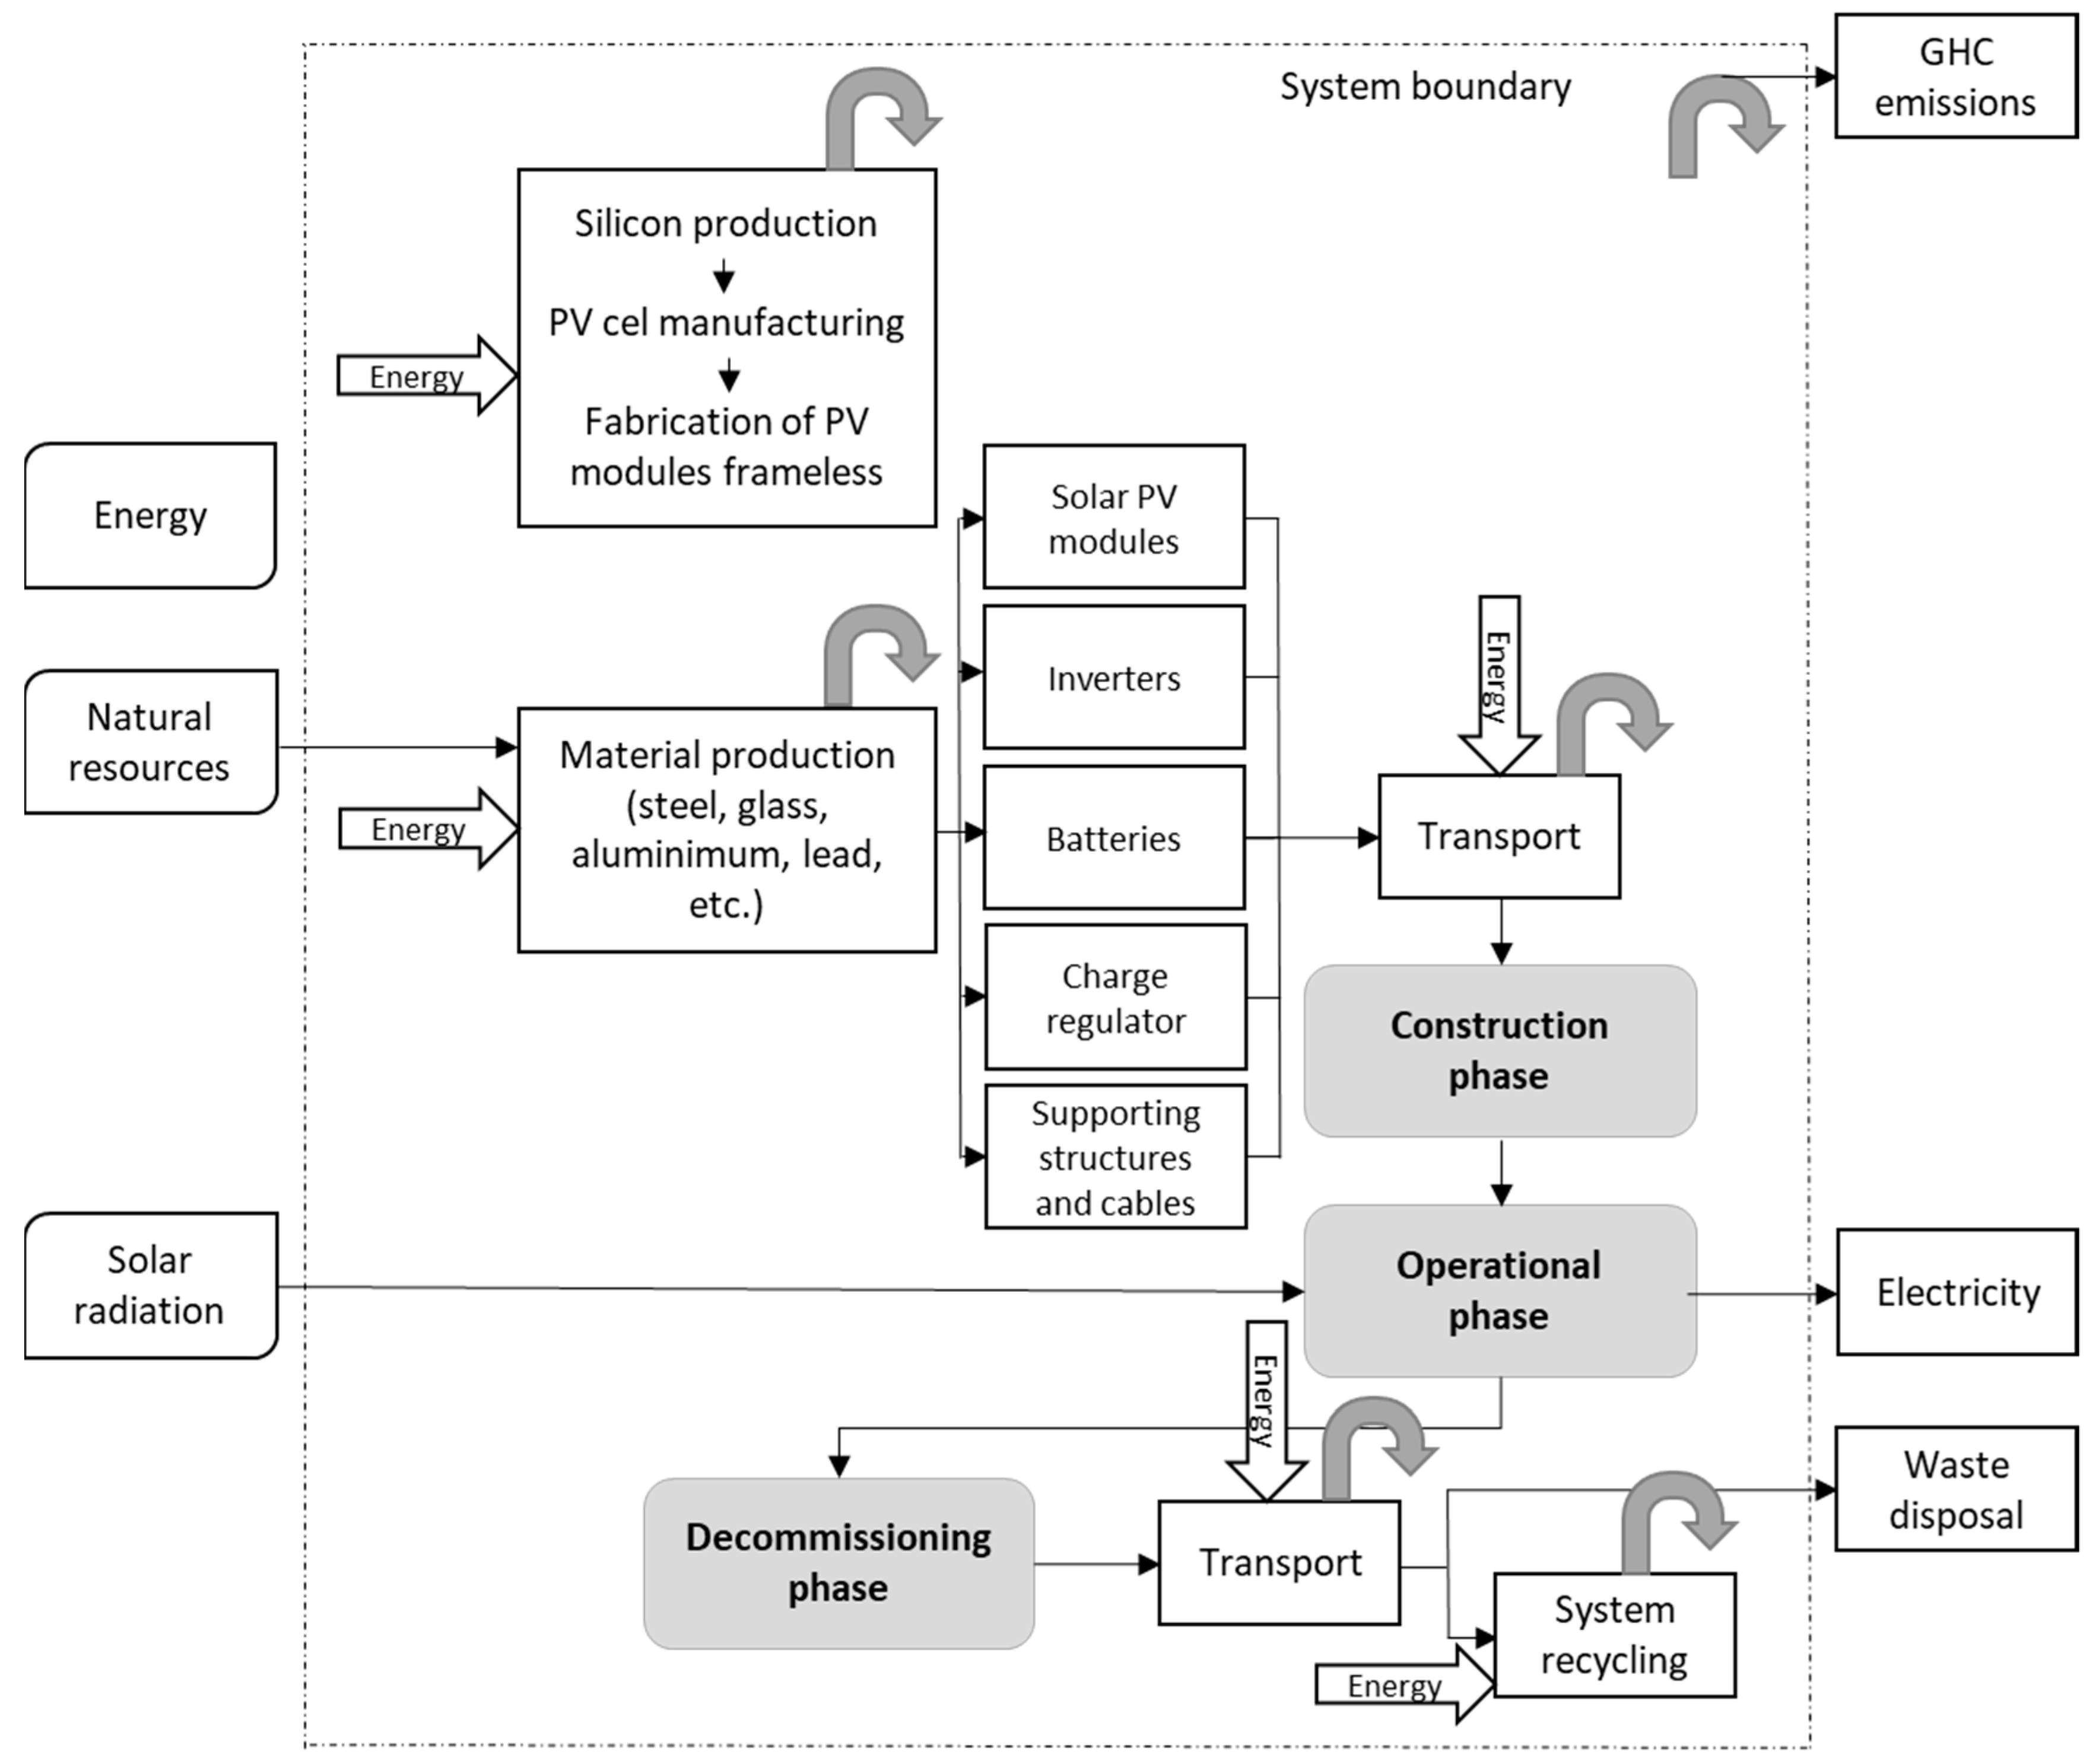
3. LCA

Life cycle assessment (LCA) is a mechanism that allows one to evaluate environmental impact of the product or process during its whole life cycle. The whole life cycle for the product includes:
  • Production phase,
  • Exploitation phase,
  • Decommissioning phase.
Usually, when we speak about photovoltaic technology, we think about exploitation phase, because it does not degrade environment and is eco-friendly. Life cycle assessment and comparison of factors allow us to analyze specific technology [29,30,31,32,33,34]. For silicon photovoltaic modules, such an analysis consists of comparison of energy used to produce them with the energy generated by them during their operation, and then conversion of the result to an equivalent expressed in CO2 emissions units [35]. The important factor for photovoltaic installation is the life cycle—the time in which they can be efficiently exploited, usually 20–25 years in case of silicon modules. To carry out proper analysis of PV technology, we use Energy Pay-Back Time (EPBT) and greenhouse gas (GHG) emissions factors. The former factor allows us to determine how long the installation will be able to work after covering its production costs, and the latter factor allow us to show this additional produced energy in an equivalent of CO2 emissions for an electric mix in a specific country. A PV system, which uses polycrystalline silicon with efficiency of 16%, has been examined for Belgium. This analysis considered the irradiance characteristic for these areas and their electric mix. For the installation, the EPBT is 6.241 years, and the reduction of the CO2 emissions is 0.1954 t CO2/kWp. In Spain, the LCA analysis was carried out for 200 kWp installation. The research included steps from the acquisition of raw material to generation of electricity. The EPBT for this installation was 3.5 to 5 years. This result is a consequence of a different level of irradiation in the analyzed area in Spain. Most of the energy consumption in this simulation was associated with the module production phase [36]. The typical LCA analysis is based on the life cycle diagram for the analyzed technology; an example of such LCA diagram is shown in Figure 1. The goal of the research presented in the paper was to find the optimal parameters for thermal separation, which would allow us to recycle and manage waste streams generated by PV technology in a way that would minimize the increase of EPBT and GHG factors.

4. Materials and Methods

As a part of this paper, an experimental pyrolysis and chemical analysis of the remaining fractions were conducted.
The material used for testing is a photovoltaic panel with a concentrator (perianol dye, perylene derivative). In this work, an attempt was made to carry out pyrolysis in an experimental pyrolysis chamber, followed by chemical analysis of the resulting fraction. The advantage of the pyrolysis chambers is the “transformation” of a heterogeneous mass of waste into volatile substances and a char. The use of the pyrolysis process allows to significantly reduce the volume of waste. The analysis involved a low-temperature pyrolysis process using a laboratory pyrolysis chamber [38,39,40].

4.1. Materials

The material—a PV panel with concentrator—consisted of an ETFE (ethylene-tetrafluoroethylene) layer, three layers of EVA (polyethylene-vinyl acetate), photovoltaic cell made of monocrystalline silicon, and EVA layer saturated with perylene dye (acting as a concentrator that improved quantum yield of fluorescence). The last layer was a plastic based on a polyester resin reinforced with glass fibers. The cross-section of a photovoltaic panel with the use of peripheral dye is shown in Figure 2; the picture is illustrative and the entire panel layer is less than 1 cm [41,42,43,44,45,46].

4.2. Methods

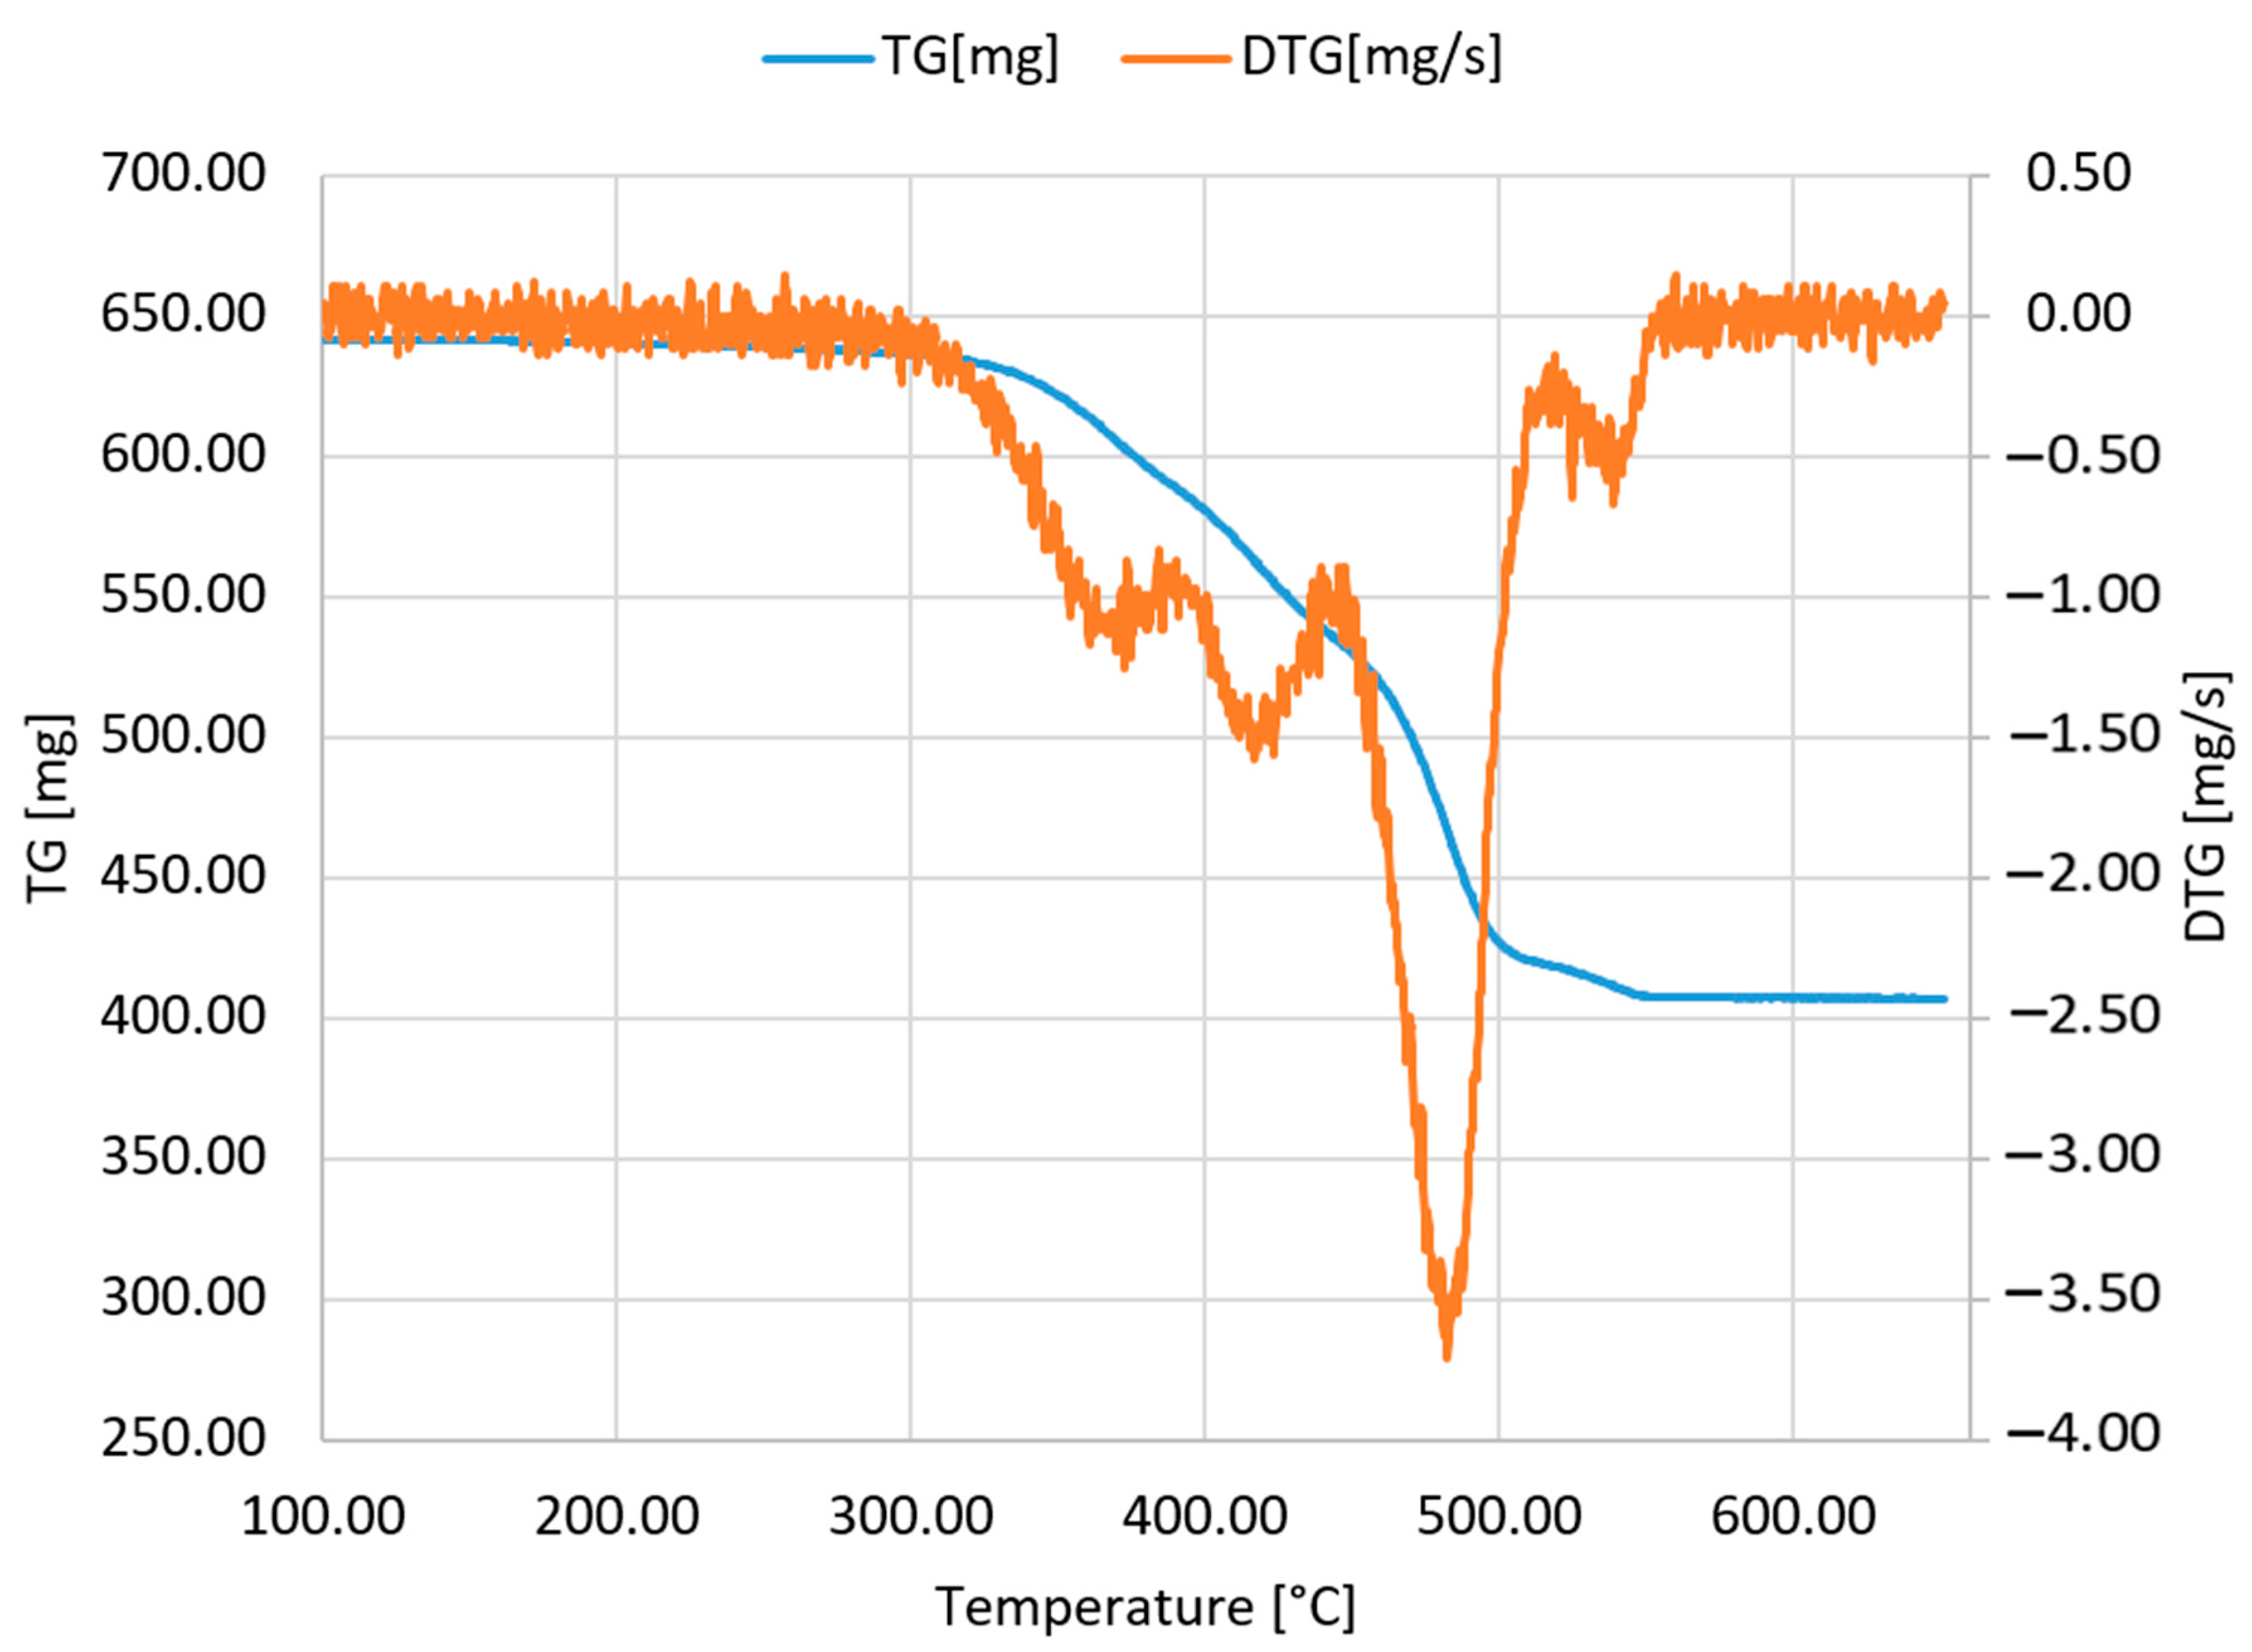
4.2.1. Thermogravimetric
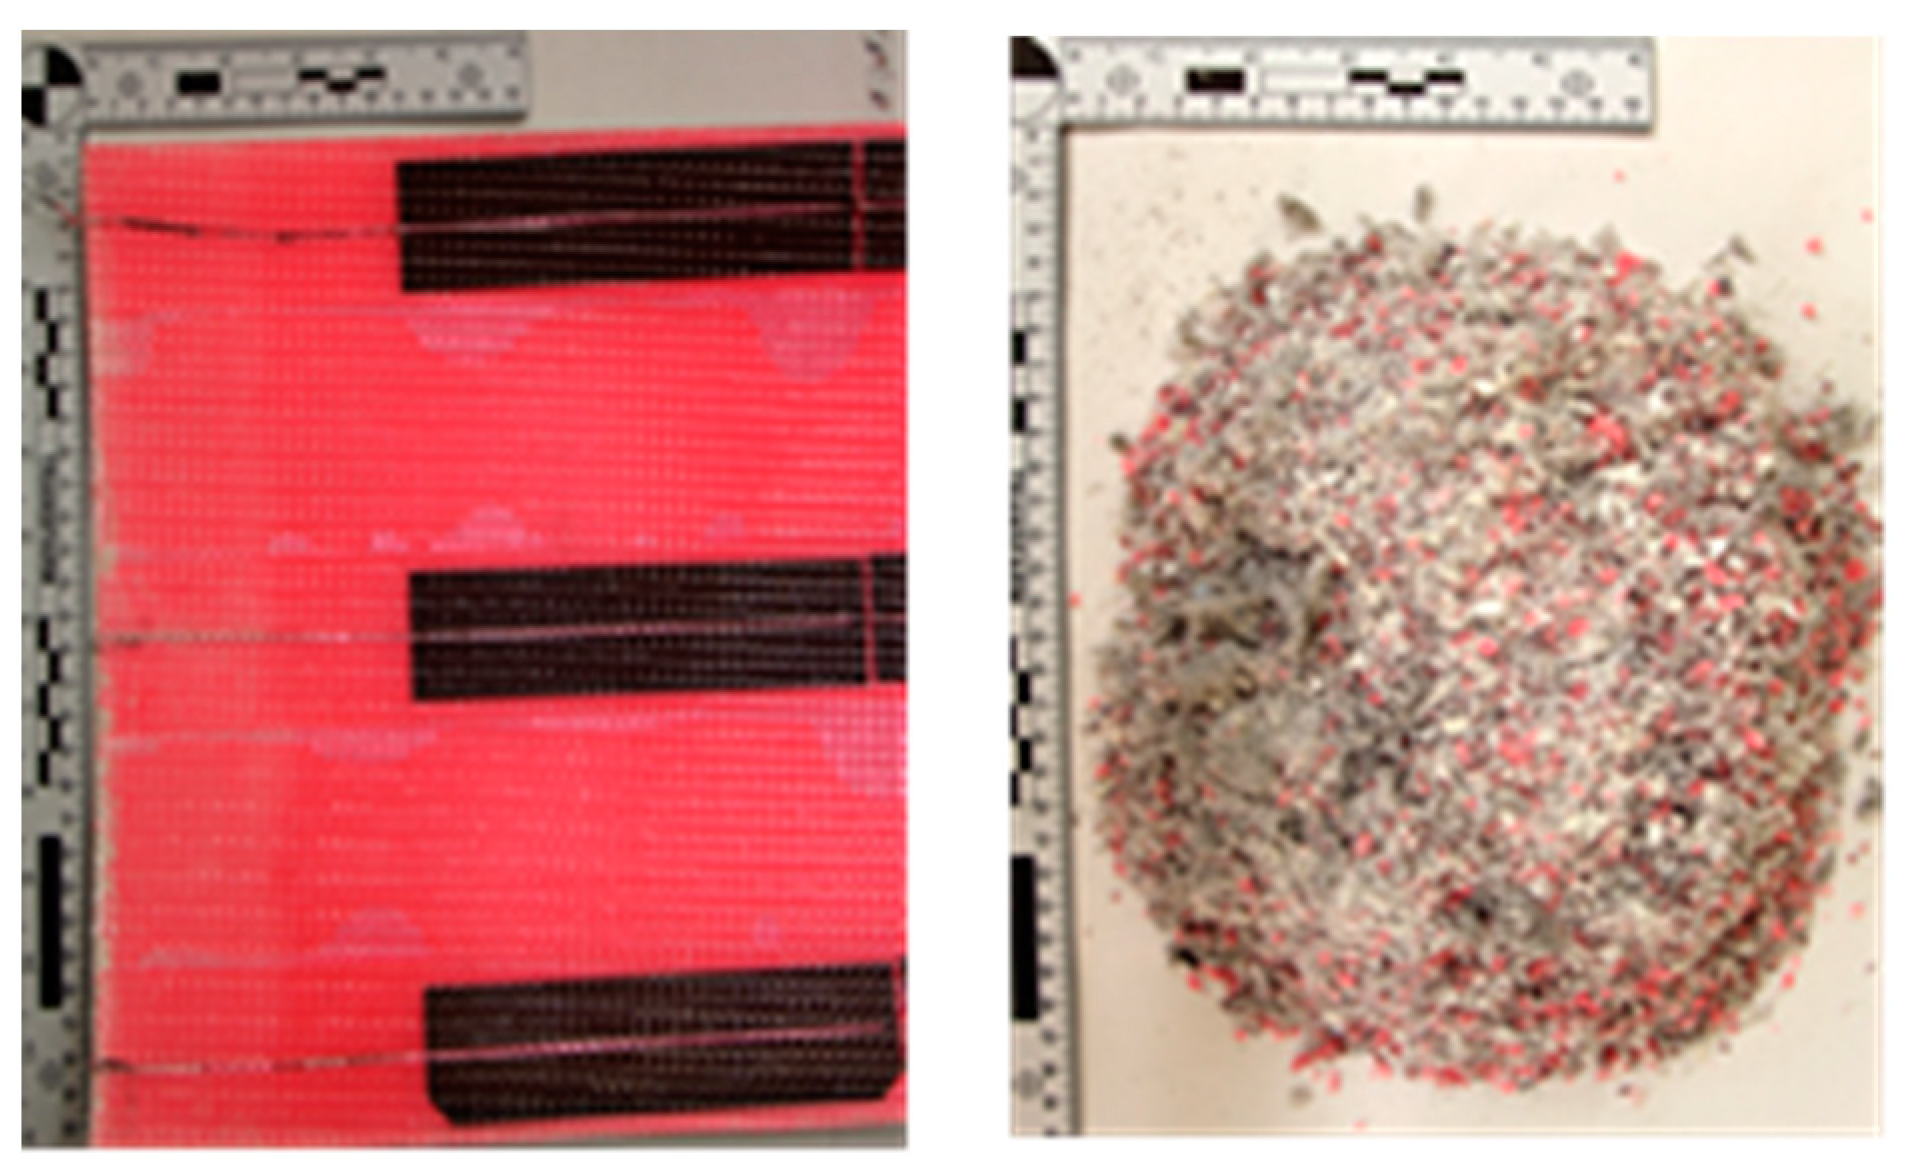
Thermogravimetric measurement was carried out using a Metaller TA1 thermobalance with a vacuum system and inert argon Ar gas (5N purity). A weighed sample (sample mass 284.670 mg) was placed in an Al2O3 crucible (2006.070 mg melting furnace). During double pumping of gas from the system—gas exchange in the system from air to argon—a loss of sample mass equal to approximately 1.5 mg was recorded. On the TG curve, the course of mass change due to heating of the sample can be observed. In order to improve the legibility of the TG curve, the first derivative of the thermogravimetric curve DTG is obtained in parallel with temperature (T). It indicates the rate of change and also allows estimation of the number of reactions. However, on the basis of thermal differential analysis (DTA curve difference: Heating curves), one can assess whether the reactions were endo- or exothermic. Thanks to the DTA method, melting or confusion can be demonstrated (endothermic reactions).

4.2.2. Pyrolysis

Pyrolysis is a widely used process in the chemical industry, e.g., in the production of charcoal, methanol, PVC, activated carbon, and gasoline, as well as for the thermal treatment of waste. Pyrolysis is an alternative to the combustion process or can be used as a supplement. The pyrolysis process is carried out under anaerobic conditions, which leads to production of liquid, gas, and solid products [41]. The use of a moderate temperature regime (300–500 °C) allows production of mainly pyrolysis oil, while at high temperatures (500–900 °C), gas generation occurs [42].
The pyrolysis of the tested material was carried out in a laboratory pyrolysis furnace, which consisted of an electrically heated reaction chamber. In addition, water cooling of the outgoing gases was used, as well as the collection of liquid samples (filter flask) and gas samples was carried out (filter scrubbers and absorbent tubes with activated carbon and an XAD-2 polymer filter).

5. Discussion

As a result of the thermal process, gas, liquid, and solid products were obtained. The content of gaseous and liquid products was subjected to chemical analysis. The analysis also considers the energy consumption of the process by determining the consumption of electricity. As part of the analysis, thermogravimetry was also carried out to determine the temperature, at which the mass of the analyzed panel is reduced.

5.1. Thermogravimetric Results

The recording of the TG and DTG measurement runs is shown in Figure 3. When analyzing the TG curve, it can be concluded that, during the heating of the sample, a weight loss of 82.46% was recorded—i.e., 234.750 mg. The residue after the combustion process was 50.9 mg.
The maximum weight shown in Figure 3 is 641.14 mg. This value includes sample weight and the mass of elements used for the measurement of e.g., the hanger, however it does not include the weight of the crucible. Based on the presented thermogravimetric analysis (TG and DTG), it can be noticed that the slow mass decrease started already at about 380 °C (loss of 1 mg). However, the process of the mass loss occurred faster in the temperature range from approximately 290 °C to 565 °C. Based on automatically delineated DTG derivative, the following temperatures were determined: 372.82 °C, 416.93 °C, 482.31 °C, and 538.87 °C. By analyzing TG and DTG line, we can see that the largest change in the mass of the tested sample occurred at approximately 450–480 °C. At this temperature, the change in the mass for the tested sample was equal to 3.6 mg/s. The heating and cooling process during the measurement was carried out with the temperature change equal to 6 K/min.
This is a basic study, however, to determine what compounds arise in the given phases of the processes, it would be necessary to perform additional extended thermal and chemical analyses (thermal analysis combined with mass spectroscopy).

5.2. Pyrolysis Results

The proper pyrolysis process was preceded by a grinding process in a knife grinder using a sieve with a mesh of diameter of φ 6.0 mm. The tested material, due to the presence of a large number of polymers (including ETFE, several layers of EVA film, polyester resin), required cooling before the grinding process. Liquid nitrogen LN2 was used to cool the sample. The material before and after grinding is presented in Figure 4.
The mass of the sample was 0.589 kg and was placed in a 11.5 × 35.0 × 7.5 cm cuvette of weight of 1.727 kg. After placing the sample in the furnace, it was flushed with argon. The O2 content was monitored using 5200 Servomax analyzer. The initial O2 content in the furnace chamber was 21.2%. After administration of argon, the oxygen content reached the level below the quantification, i.e., 0%. The reactor was heated to 500 °C. During the test, the temperatures of the furnace (Temp.1), charge (Temp.2), and outlet gases (Temp.3) were measured. The test was carried out for one hour after the appearance of a condensed gas phase, which arose when the temperature of the batch reached 300 °C. In addition, the process was maintained under overpressure in the furnace. In Table 1, the process parameters before and after the pyrolysis are compiled.
As a result of pyrolysis, 46.86% weight loss was observed (a difference equal to 0.276 kg). The material balance from the pyrolysis process of three fractions is 53.14% in the solid phase, 24.28% in the liquid phase, and 22.58% in the gaseous phase.
As a result of pyrolysis, more than half of the charge (53.14%) was still in solid form. The remainder was primarily glass fibers made of laminate. The liquid and gas fraction constituted 24.28% and 22.58% of the feed, respectively.
During the test, the initial energy consumption was measured from the moment the furnace was switched on to the end of the test (time t = 75 min). The total electricity consumption measured for 75 min was 4.900 kWh (0.065 kWh/min).
The liquid fraction (pyrolysis oil) was subjected to a qualitative analysis, and the absorption tube with activated carbon and XAD-2 polymer (absorbed organic compounds) and the content of muds (presence of chloride, bromine, and fluorine compounds) underwent a quantitative analysis. The results provided in the tables refer to the amount of gas obtained during the measurement, i.e., 0.045 m3.
Table 2 presents the results of the quantitative analysis of the absorption tube made of activated carbon conducted in order to determine the total hydrocarbon content using the gas chromatography (GC-FID) method for toluene (sample P1/1). The analysis was carried out using a gas chromatograph with a flame ionization detector with a DB-1 Elite capillary column. The total hydrocarbon content calculated as toluene in the sample tested was 136.76 mg ± 18.32 mg.
Table 2 presents the results of quantitative analysis to determine the content of polycyclic aromatic hydrocarbons (PAHs) absorbed on the XAD-2 polymer substrate (sample P1/1 and P1/2). Liquid chromatography with fluorescence detection and ultraviolet (HPLEC-FLD/UV) was used for determinations. The analysis was performed using a liquid chromatograph with a gradient pump, FLD fluorescence detectors, VWD spectrometric detectors, and ZPRBAX Eclipse PAH 4.6 × 150 mm, 5 μm column. In the P1/1 sample, the total hydrocarbon content per toluene was calculated, and the value was 136.76 mg/sample. In the P1/2 sample, the highest concentrations were obtained for acenaphthene (79.42 mg/sample) and acenaphthylene (18.96 mg/sample). The lowest concentrations were obtained for naphthalene (1.77 mg/sample) and fluorene (0.010 mg/sample). The content of other PAH hydrocarbons was below the limit of determination.
In the case of pyrolysis oil, a qualitative analysis was performed, both for the gas phase over the liquid and for the substance itself. For the analysis, methods based on FTIR (Fourier Transform Infrared Spectroscopy) and liquid chromatography (HPLEC-FLD/UV) spectrometric techniques were employed.
In the analyzed sample, after pyrolysis (sample P1/3), the presence of bands characteristic for ester compounds, carboxylic acids, and aldehydes was found. These products are formed as a result of oxidation processes during pyrolysis. In the gas phase, spectrogram, aromatic, and aliphatic hydrocarbons were found on the sample’s surface. Chromatographic analysis showed the presence of acetaldehyde, propionaldehyde, and traces of acrolein. In addition, GC/FPD analysis was carried out, which showed that the tested sample does not contain sulfur compounds.
Additionally, chemical analysis for halogen in the resulting gas was carried out: Bromine (Br), chlorine (Cl), and fluorine (F). The obtained concentrations are presented in Table 3.
The high concentration of fluorine comes mainly from the decomposition of the ETFE polymer. It can contribute to the negative environmental impact of the considered method of recycling of PV panels. However, an appropriate purification system can effectively remove this concentration, which will help to reduce the negative effect.
In order to make the analysis as complex as possible, the low heating value (LHV) was determined using a calorimeter. The results of the analysis are presented in Table 4.
In Figure 5, the PV cell carbonization process with the supply of argon gas is presented. The presented figure shows that the highest increase for gases, such as CO and CO2, started 25 min after the start of the measurements, when the temperature of the sample was around 390 °C and the temperature of the chamber was approx. 420 °C. The emission of CO2 ran in two stages. The first one started in the 22nd–23rd minute of the measurement at the temperature of the chamber of approximately 390 °C, and ended in the 35th minute at 490 °C; the second one started in the 42nd minute of the measurement and ended in the 44th minute at the temperature at the start and end of approx. 500 °C. The highest content of CO2 was around 28% and was achieved in the 35th minute of the measurement. The content of CO was 12.5% and it was achieved in the 36th minute. In case of H2, the highest content was equal to 2.5% and it was obtained in the 41st minute of the measurement. The highest temperature for the chamber was approximately 510 °C, and for the sample it was 500 °C. Both temperatures stabilized at 500 °C in the 58th minute of the measurement. We can find some periodical change in the temperature, but it can be justified by the measurement error or device inaccuracy. The figure also shows us that, after 47 min from the start of the measurement, no more H2 was produced by our sample, and after 45 min the content of the CO and CO2 produced by the sample was constantly dropping and achieved a value of 2 and 1.5% at the end of the measurement.

6. Conclusions

The problem of recycling of PV cells is very complex, especially due to the diversity of such cells. In case of cells with a concentrator, the processing can be even more complicated due to the content of harmful substances. The high-temperature processes like pyrolysis can help to solve this problem and assure high quality of end products.
The results of the conducted analysis could be used to determine the possibility of using thermal treatment to dispose of PV panels. They show that the pyrolysis process and the resulting products require further chemical analysis to optimize the process itself, as well as the places and forms of use of the pyrolysis products.
The research presented in the paper was conducted in argon atmosphere. The results of the research carried out using the pyrolysis process show a weight loss of 46.86% of the base mass of the tested sample (a difference of 0.276 kg). The phase balance from the pyrolysis is 53.14% in the solid phase, 24.28% in the liquid phase, and 22.58% in the gas phase. The thermogravimetric analysis shows that the fastest change in the mass of the sample was recorded in the temperature of 450–480 °C, and was equal to 3.6 mg/s. The research also provides the analysis for liquid and gaseous phases, which were produced during the thermal process. The result for gases shows that the sample contains 3039.11 mg/m3 of toluene, 3039.11 mg/m3 of acenaphthylene, 421.33 mg/m3 of naphthalene, 39.33 mg/m3 of acenaphthene, and 1764.89 mg/m3 of fluorene. The liquid analysis shows presence of chlorine, bromine, and fluorine in the tested sample. The concentration value for Br was equal to 2 mg/dm3, for F it was 33.5 mg/dm3, while for Cl it was less than 0.4 mg/dm3.
The combustion heat of the char from the pyrolysis process is over 10 MJ/kg, and this value exceeds 6 MJ/kg. Therefore, the waste in this form provides autothermic combustion, it cannot be stored in a landfill, so there is a necessity to find a way to manage it. In order to summarize the potential of pyrolysis in the PV, more field tests should be carried out. Many aspects of the process confirm its value and possible suitability for commercial use. It should also be noted that inclusion of the process of pyrolysis in waste management installations would require appropriate selection of an installation for the treatment of produced gases to eliminate carcinogenic pollutants, such as aromatic hydrocarbons.

Author Contributions

Conceptualization, M.B., K.P., D.L., K.K., and M.P.; methodology, D.L., K.K. and M.P.; software, M.P., M.B., and E.M.; validation, M.B., B.M., and M.P.; formal analysis, M.P. and D.L.; investigation, P.S.; resources, P.S.; data curation, M.P., M.B., and B.M.; writing—original draft preparation, M.B., M.P., and B.M.; writing—review and editing, M.B. and B.M.; visualization, M.P.; supervision, K.P.; project administration, E.M. All authors have read and agreed to the published version of the manuscript.

Funding

This research was funded by subsidies granted for the year 2020 to the Department of Technology and Installations for Waste Management, Silesian University of Technology.

Conflicts of Interest

The authors declare no conflict of interest.

References

  1. Fiandra, V.; Sannino, L.; Andreozzi, C.; Corcelli, F.; Graditi, G. Silicon photovoltaic modules at end-of-life: Removal of polymeric layers and separation of materials. Waste Manag. 2009, 87, 97–107. [Google Scholar] [CrossRef] [PubMed]
  2. Alwaeli, M. End-Of-Life Vehicles Recovery and Recycling and the Route to Comply with Eu Directive Targets. Environ. Prot. Eng. 2016, 42, 191–202. [Google Scholar]
  3. Bogacka, M.; Pikoń, K.; Landrat, M. Environmental impact of PV cell waste scenario. Waste Manag. 2017, 70, 198–203. [Google Scholar] [CrossRef] [PubMed]
  4. Klugmann-Radziemska, E. Technological progress in photovoltaics (Technologiczny postęp w fotowoltaice). Czysta Energ. 2014, 5, 40–42. [Google Scholar]
  5. Słoma, M. Printing Techniques in the Production of Photovoltaic Cells (Techniki Drukowania w Produkcji Ogniw Fotowoltaicznych), Acta Poligraphica; Centralny Ośrodek Badawczo-Rozwojowy Przemysłu Poligraficznego: Warsaw, Poland, 2013; Volume 2, pp. 9–21. [Google Scholar]
  6. Latunussa, C.E.; Ardente, F.; Blengini, G.A.; Mancini, L. Life Cycle Assessment of an innovative recycling process for crystalline silicon photovoltaic panels. Sol. Energy Mater. Sol. Cells 2016, 156, 101–111. [Google Scholar] [CrossRef]
  7. Shin, J.; Park, J.; Park, N. A method to recycle silicon wafer from end-of-life photovoltaic module and solar panels by using recycled silicon wafers. Sol. Energy Mater. Sol. Cells 2017, 162, 1–6. [Google Scholar] [CrossRef]
  8. Klugmann-Radziemska, E.; Ostrowski, P. Chemical treatment of crystalline silicon solar cells as a method of recovering pure silicon from photovoltaic modules. Renew. Energy 2010, 35, 1751–1759. [Google Scholar] [CrossRef]
  9. Ashfaq, H.; Giri, A. Comparative analysis of old, recycled and new PV modules. J. King Saud Univ. Eng. Sci. 2017, 29, 22–28. [Google Scholar] [CrossRef] [Green Version]
  10. Duflou, J.R.; Peeters, J.; Altamirano, D.; Bracquené, E.; Dewulf, W. Manufacturing Technology Demanufacturing photovoltaic panels: Comparison of end-of-life treatment strategies for improved resource recovery. CIRP Ann. 2018, 67, 29–32. [Google Scholar] [CrossRef]
  11. Klugmann-Radziemska, E.; Ostrowski, P.; Drabczyk, K.; Panek, P.; Szkodo, M. Experimental validation of crystalline silicon solar cells recycling by thermal and chemical methods. Sol. Energy Mater. Sol. Cells 2010, 94, 2275–2282. [Google Scholar] [CrossRef]
  12. Pikoń, K.; Bogacka, M. Environmental and socio-economic evaluation of complex process. In Proceedings of the International Multidisciplinary Scientific GeoConference Surveying Geology and Mining Ecology Management, SGEM, Albena, Bulgaria, 18–24 June 2015; Volume 3. [Google Scholar]
  13. Tammaro, M.; Rimauro, J.; Fiandra, V.; Salluzzo, A.; Rimauro, J. Thermal treatment of waste photovoltaic module for recovery and recycling: Experimental assessment of the presence of metals in the gas emissions and in the ashes. Renew. Energy 2015, 81, 103–112. [Google Scholar] [CrossRef]
  14. Hryb, W. Sorting Tests of Unsorted Municipal Solid Waste from Germany for a Selected Opto-Pneumatic Sorting Machine. Pol. J. Environ. Stud. 2015, 24, 99–105. [Google Scholar] [CrossRef]
  15. Berger, W.; Simon, F.-G.; Weimann, K.; Alsema, E.A. A novel approach for the recycling of thin film photovoltaic modules. Res. Conserv. Recycl. 2010, 54, 711–718. [Google Scholar] [CrossRef]
  16. Fthenakis, V.M. End-of-life management and recycling of PV modules. Energy Policy 2000, 28, 1051–1058. [Google Scholar] [CrossRef] [Green Version]
  17. Lunardi, M.M.; Alvarez-Gaitan, J.P.; Bilbao, J.I.; Corkish, R. Comparative Life cycle Assessment of End-of-Life Silicon Solar Photovoltaic Modules. Appl. Sci. 2018, 8, 1396. [Google Scholar] [CrossRef] [Green Version]
  18. Weckend, S.; Wade, A.; Heath, G.A. End-of-Life Management: Solar Photovoltaic Panels; USDOE Office of Energy Efficiency and Renewable Energy (EERE): Golden, CO, USA; Solar Energy Technologies Office (EE-4S): Washington, DC, USA, 2016.
  19. Potempa, M.; Kozłowski, J.; Lewandowski, D.; Gawliczek, M. Analysis of Applied Technologies of Recycling Used Solar Panels (Solar and Solar Collectors) and Liquid Crystal Screens in Poland and the World—Research on Methods of Recycling (Analiza Stosowanych Technologii Recyklingu Zużytych Paneli Słonecznych (Kolektorów Słonecznych i Fotowoltaicznych) i Ekranów Ciekłokrystalicznych w Polsce i na Świecie—Badania Nad Sposobami Recyklingu); Inside Report no. 7582/17; Instytut Metali Nieżelaznych: Gliwice, Poland, 2017. [Google Scholar]
  20. Herceg, S.; Pinto Bautista, S.; Weiß, K.A. Influence of Waste Management on the environmental Footprint of Electricity Produced by Photivoltaic Systems. Energies 2020, 13, 2146. [Google Scholar] [CrossRef]
  21. Kenning, T. PV Cycle Achieves Record 96% Recycle Rate for Silicon-Based PV Modules. Available online: https://www.pv-tech.org/news/pv-cycle-achieves-record-96–recycle-rate-for-silicon-based-pv-modules (accessed on 19 November 2020).
  22. Celik, I.; Lunardi, M.; Frederickson, A.; Corkish, R. Sustainable End Life Management of Crystalline Silicon and Thin Film Solar Photovoltaic Waste: The Impact of Transportation. Appl. Sci. 2020, 10, 5465. [Google Scholar] [CrossRef]
  23. Kim, H.; Park, H. PV Waste Managment at the Crossroad of circular Economy And Energy Transition: The case of South Korea. Sustainability 2018, 10, 3565. [Google Scholar] [CrossRef] [Green Version]
  24. Graditi, G.; Sannino, L.; Andreozzi, C. End-of-life of silicon PV panels: A sustainable materials recovery process. Waste Manag. 2019, 84, 91–101. [Google Scholar] [CrossRef]
  25. Granata, G.; Pagnanelli, F.; Moscardini, E.; Havlik, T.; Toro, L.A. Recycling of photovoltaic panels by physical operations. Sol. Energy Mater. Sol. Cells 2014, 123, 239–248. [Google Scholar] [CrossRef]
  26. Mahmoudi, S.; Huda, N.; Alavi, Z.; Islam, T.; Behnia, M. End-of-life photovoltaic modules: A systematic quantitative literature review. Resour. Conserv. Recycl. 2019, 146, 1–16. [Google Scholar] [CrossRef]
  27. Pagnanelli, F.; Moscardini, E.; Granata, G.; Atia, T.A.; Altimari, P.; Havlik, T.; Toro, L. Physical and chemical treatment of end of life panels: An integrated automatic approach viable for different photovoltaic technologies. Waste Manag. 2017, 59, 422–431. [Google Scholar] [CrossRef] [PubMed]
  28. Ratner, S.; Gomonov, K.; Revinova, S.; Lazanyuk, I. Eco-Design of Energy Production Systems: The Problem of Renewable Energy Capacity Recycling. Appl. Sci. 2020, 10, 4339. [Google Scholar] [CrossRef]
  29. Bogacka, M. Comparison of Lca Analysis Stages in Different Energy Sources Types—Review. In Proceedings of the 16th International Multidisciplinary Scientific GeoConference SGEM, Albena, Bulgaria, 30 June–6 July 2016; pp. 171–178. [Google Scholar]
  30. Dias, P.; Javimczik, S.; Benevit, M.; Veit, H.M. Recycling WEEE: Polymer characterization and pyrolysis study for waste of crystalline silicon photovoltaic modules. Waste Manag. 2017, 60, 716–722. [Google Scholar] [CrossRef] [PubMed]
  31. Domínguez, A.; Geyer, R. Photovoltaic waste assessment of major photovoltaic installations in the United States of America. Renew. Energy 2019, 133, 1188–1200. [Google Scholar] [CrossRef]
  32. Jastrzębska, M. Waste polyester-glass laminates from scrapped trawlers (Odpady laminatów poliestrowo-szklanych ze złomowanych trałowców). Recykling 2006, 10, 14–15. [Google Scholar]
  33. Kuczyńska-Łażewska, A.; Klugmann-Radziemska, E.; Sobczak, Z.; Klimczuk, T. Recovery of silver metallization from damaged silicon cells. Sol. Energy Mater. Sol. Cells 2018, 176, 190–195. [Google Scholar] [CrossRef]
  34. Sarnecki, J.; Gawlik, G.; Lipińska, L.; Jeremiasz, O. Polymer luminescent concentrators containing oxide nanocrystals doped with rare-earth elements matched to an edge-illuminated silicon solar cell. Electron. Mater. 2015, 43, 43. [Google Scholar]
  35. Krebs-Moberg, M.; Pitz, M.; Dorsette, T.L.; Gheewala, S.H. Third generation of photovoltaic panels: A Life cycle assessment. Renew. Energy 2020, 164, 556–565. [Google Scholar] [CrossRef]
  36. Gerbinet, S.; Belboom, S.; Léonard, A. Life Cycle Analysis (LCA) of photovoltaic panels: A review. Renew. Sustain. Energy Rev. 2014, 38, 747–753. [Google Scholar] [CrossRef]
  37. García-Valverde, R.; Miguel, C.; Martinez-Bejar, R.; Urbina, A. Life cycle assessment study of 4,2 kWp stand-alone photovoltaic system. Sol. Energy 2009, 83, 1434–1445. [Google Scholar] [CrossRef]
  38. Goe, M.; Gaustad, G. Strengthening the case for recycling photovoltaics: An energy payback analysis. Appl. Energy 2014, 120, 41–48. [Google Scholar] [CrossRef]
  39. Drabczyk, K.; Panek, P. A comparative study of EVA with and without thermal history for different lamination process parameters. Mater. Sci. Eng. B 2012, 177, 1378–1383. [Google Scholar] [CrossRef]
  40. Drabczyk, K.; Kulesza-Matlak, G.; Drygała, A.; Szindler, M.; Lipiński, M. Electroluminescence imaging for determining the influence of metallization parameters for solar cell metal contacts. Sol. Energy 2016, 126, 14–21. [Google Scholar] [CrossRef]
  41. Klein, M.; Kluska, J.; Misiuk, S.; Kardaś, D. The course and products of the pyrolysis process of selected plastics in a pressure reactor (Przebieg i produkty procesu pirolizy wybranych tworzyw sztucznych wreaktorze ciśnieniowym). Inżynieria Apar. Chem. 2011, 5, 54–55. [Google Scholar]
  42. Holtzer, M.; Kmita, A.; Roczniak, A. Pyrolysis processes and their impact on casting quality and working conditions (Procesy pirolizy i ich wpływ na jakość odlewów oraz na warunki pracy). Prace Inst. Odlew. 2016, 56, 175. [Google Scholar]
  43. Optiplan GmbH. Karta Produktu POLYDET, Sicherheitsdatenblatt Gemäß 1907/2006/EG, Artikel 31, Product Card of Polydet; Optiplan GmBH: Oelsnitz, Germany, 2006; Available online: http://www.optiplan.eu/en/Anwendugsbereiche/anwendungsbereiche_sandwich.html (accessed on 12 April 2018).
  44. Polyester Laminate, Product Description. Available online: https://www.eskade.pl/poliweglan,laminat_poliester.html (accessed on 10 April 2018).
  45. Saechtling, H. Plastics Guide (Tworzywa Sztuczne. Poradnik); Wyd. 5; Wydawnictwa Naukowo-Techniczne PWN-WNT: Warsaw, Poland, 2003. [Google Scholar]
  46. Tefzel. The Chemours Company. Product Card. 2016. Available online: https://www.teflon.cn/-/media/files/teflon/tefzel-etfe-film-properties.pdf (accessed on 10 April 2018).
Figure 1. Life cycle assessment (LCA) boundary for typical PV system [37].
Sustainability 12 10562 g001
Figure 2. Outline example for cross section of the panel (tested sample) with ethylene-tetrafluoroethylene (ETFE) and EVA layer.
Sustainability 12 10562 g002
Figure 3. Thermogravimetric of PV cell pyrolysis process.
Sustainability 12 10562 g003
Figure 4. Analyzed panel with a concentrator before fragmentation and after grinding up to a grain diameter of φ6.0 mm.
Sustainability 12 10562 g004
Figure 5. The course of PV cell carbonization process.
Sustainability 12 10562 g005
Table 1. Process parameters before and after pyrolysis.
ParametersUnitBefore PyrolysisAfter Pyrolysis
Condition of the gas meterm31.6451.690
Gas temperature°C2122
Furnace temperature°C27.4507
The temperature of the batch°C18.8480
Temperature of exhaust gases°C18.6231
Weight of flask on the drainkg1.2661.409
Weight of the cuvette with the samplekg2.3162.003
Weight of the batchkg0.5890.313
Oil weightkg-0.143
The volume of oilml-115
Volume of scrubbers/Cl, Br, Fml-220
The volume of gas producedm3-0.045
Table 2. Results of the quantitative analysis of the content of polycyclic aromatic polycyclic aromatic hydrocarbons (PAHs).
Sample NumberSubstance Determined in the SampleContent in the Sample [mg/0.045 m3]Markability [mg]Analytical Extended Uncertainty [±mg]Content of Substance [mg/m3]
P1/1Total hydrocarbon content calculated as toluene136.760.02n.d.3039.11
P1/2Acenaftylen18.960.022.8383039.11
Naftalen1.770.030.269421.33
Acenaften79.420.0315.7939.33
Fluoren0.0100.010.0011764.89
Table 3. The concentrations Br, Cl, and F.
Sample NumberElementConcentration [mg/L]
P1/4Cl<0.40
Br2.00
F33.50
Table 4. Low heating value (LHV) and moisture content of the carbonize.
Min.Max.
LHV [MJ/kg]10.6911.023
Moisture content [%]0.750.75
Publisher’s Note: MDPI stays neutral with regard to jurisdictional claims in published maps and institutional affiliations.

