Article

Environmental Habitat Mapping of Green Mussel: A GIS-Based Approach for Sustainable Aquaculture in the Inner Gulf of Thailand

1
Laboratory of Fisheries Oceanography, Fisheries College, Ocean University of China, Qingdao 266003, China
2
Estuarine and Coastal Dynamics Modeling Laboratory, Faculty of Fisheries, Kasetsart University, Bangkok 10900, Thailand
3
The Key Laboratory of Mariculture, Ministry of Education, Ocean University of China, Qingdao 266003, China
4
Frontiers Science Center for Deep Ocean Multispheres and Earth System (FDOMES), Ocean University of China, Qingdao 266100, China
5
Arctic Research Center, Hokkaido University, Sapporo 001-0021, Japan
*
Author to whom correspondence should be addressed.
Sustainability 2020, 12(24), 10643; https://0-doi-org.brum.beds.ac.uk/10.3390/su122410643
Submission received: 9 November 2020 / Revised: 1 December 2020 / Accepted: 14 December 2020 / Published: 19 December 2020
(This article belongs to the Special Issue Marine Ecosystems Responses and Sustainability in a Changing Climate)

Abstract

:
The green mussel (Perna viridis) is one of the most commercially-important cultured species along the coast of Thailand. In this study, a suitable aquaculture site-selection model (SASSM) was developed to identify the most suitable areas in the inner part of the Gulf of Thailand (InnerGoT) for green mussel culture. Satellite-derived chlorophyll-a (Chl-a) and hydrodynamic model outputs for sea surface temperature (SST), salinity, maximum water current (MWC), and bathymetry between 2018 and 2019 were used as input to the SASSM. The results show that suitability scores in mussel aquaculture areas were lowest (1–3) during the Southwest (SW) monsoon, rainy season (July–August), and highest (6–7) during the Northeast (NE) monsoon, cold season (November–December). Moderate suitability scores (4–5) were obtained during the monsoon transition from the NE monsoon to the SW monsoon, summer (April–May). The study area was further divided into three zones: the western, central, and eastern regions. The western and eastern parts showed high suitability scores (5–7) while the central zone exhibited low suitability scores (2–4). The model results show a similar pattern to the actual mussel production in the study area. Seasonal events (i.e., flood and dry seasons) were incorporated into the model to examine the seasonal effects on the suitable mussel aquaculture areas. The suitability scores during the SW monsoon in 2018 were more sensitive to changes in SST and salinity relative to 2019. The higher freshwater discharge and lower temperature in 2018 relative to 2019 resulted in the accrual of suitable aquaculture areas. This pattern is consistent with the productions of the green mussel, where higher production was recorded in 2018 (2002.5 t) than in 2019 (410.8 t). However, correlations among atmospheric (air temperature, rainfall, and wind) and oceanographic factors (SST and MWC) were significant in the western and central regions, suggesting that the suitability of green mussel aquaculture in these regions is vulnerable to environmental disturbances. Thus, the SASSM can be a powerful tool in providing useful information on spatial management for marine aquaculture in environmentally-dynamic coastal systems.

1. Introduction

The green mussel, Perna viridis (Linnaeus, 1758), is a large and rapidly growing marine bivalve [1], with a growth rate of up to 12.24 mm per month [2]. The typical length of the green mussel is around 80-100 mm but can occasionally reach 165 mm [3]. It is perceived as a beneficial seafood with high culture potential in many coastal areas in Thailand [4]. Aquaculture of the green mussel provides a cheap source of protein and has been successfully implemented using different methods worldwide [5]. The green mussel contributes around 44 percent of the total production of coastal aquaculture along the coast of Thailand [6].
The rapid growth of aquaculture could create environmental problems. For instance, dense mussel farming has been shown to negatively impact the marine environment through an increased sedimentation rate and decreased water flow [7]. Moreover, individuals in high mussel density release more excretion than in less dense conditions [8]. Higher mussel density also results in lesser surrounding seawater per individual and consequently reduce the filtration rate [9].
Seawater temperature changes also affect the mussel’s metabolism rate, such that increasing seawater temperature promotes active and fast filtration due to a higher metabolic rate [10]. Low salinities influence the behavioral and filtration activity, actual growth rate, maximal size, and early development and survival of mussels [11]. Freshwater discharge into the sea sometimes causes an abrupt change in nutrient concentration in seawater, where a rapid high nutrient loading causes mussel mortality [12]. Salinity and bathymetry are considered to be the most important factors affecting the green mussel growth [13].
Thailand has experienced drastic climatic variations [14]. In the offshore regions of the Inner Gulf of Thailand (InnerGoT), oceanographic processes such as the divergence and convergence of surface ocean currents occur. Under the influence of the southwest winds in May–July, circulation patterns exhibit complex flow reversal. This is characterized by a large clockwise circulation in the northwest, with eddies dispersing across the eastern part of the InnerGoT [15]. These oceanographic features drive the inter-seasonal and inter-annual changes in salinity distribution in the gulf.
At present, there are several studies using a geographical information system (GIS) to develop suitable aquaculture site-selection models (SASSMs) [16,17,18,19,20]. A system for capturing, storing, checking, integrating, manipulating, analyzing, and displaying data that are spatially referenced to the Earth. Remote sensing (RS) data could be used in GIS applications. This data can be sourced through satellite imagery, synthetic aperture radar imagery, LIDAR, or other imagery systems. In aquaculture applications, RS is commonly used to measure water quality parameters and land cover. For example, Ref. [20] used satellite remote sensing (SRS), Terra Aqua satellite, sensor moderate resolution imaging spectroradiometer (MODIS) with 1 km resolution, two-day revisit, and marine GIS to study the activity of fishing vessel and the effects of climate change to scallop aquaculture. This study showed the advantage of SRS in terms of fishery and aquaculture planning. Ref. [17] added the physical parameter, sea surface nutrient, to develop a more accurate SASSM for Japanese kelp in southern Hokkaido in GIS model construction. Ref. [21] presented a GIS-based multi-criteria evaluation (MCE) that used remotely sensed information and field verification data to analyze the best area for Japanese scallop aquaculture in Funka Bay. Based on the understanding of the interaction between cultured species and the environment, an informed site selection process is likely crucial for the sustained development of aquaculture. The evolving capabilities of GISs and remote sensing provide powerful tools for efficient and cost-effective management of sustainable aquaculture [16,18].
Overall, this study aimed to develop SASSMs by combining information from satellite remote sensing data, green mussel production, water quality observations, and 3D hydrodynamic model data and expected to contribute to the development of a tool for good planning and management practices of sustainable green mussel aquaculture. The sustainability of this industry is highly influenced by the suitability of the environment in which it is carried out. From the SASSMs spatial predictions, this study hoped to identify and assess the most suitable aquaculture areas for green mussel in the Inner Gulf of Thailand.

2. Materials and Methods
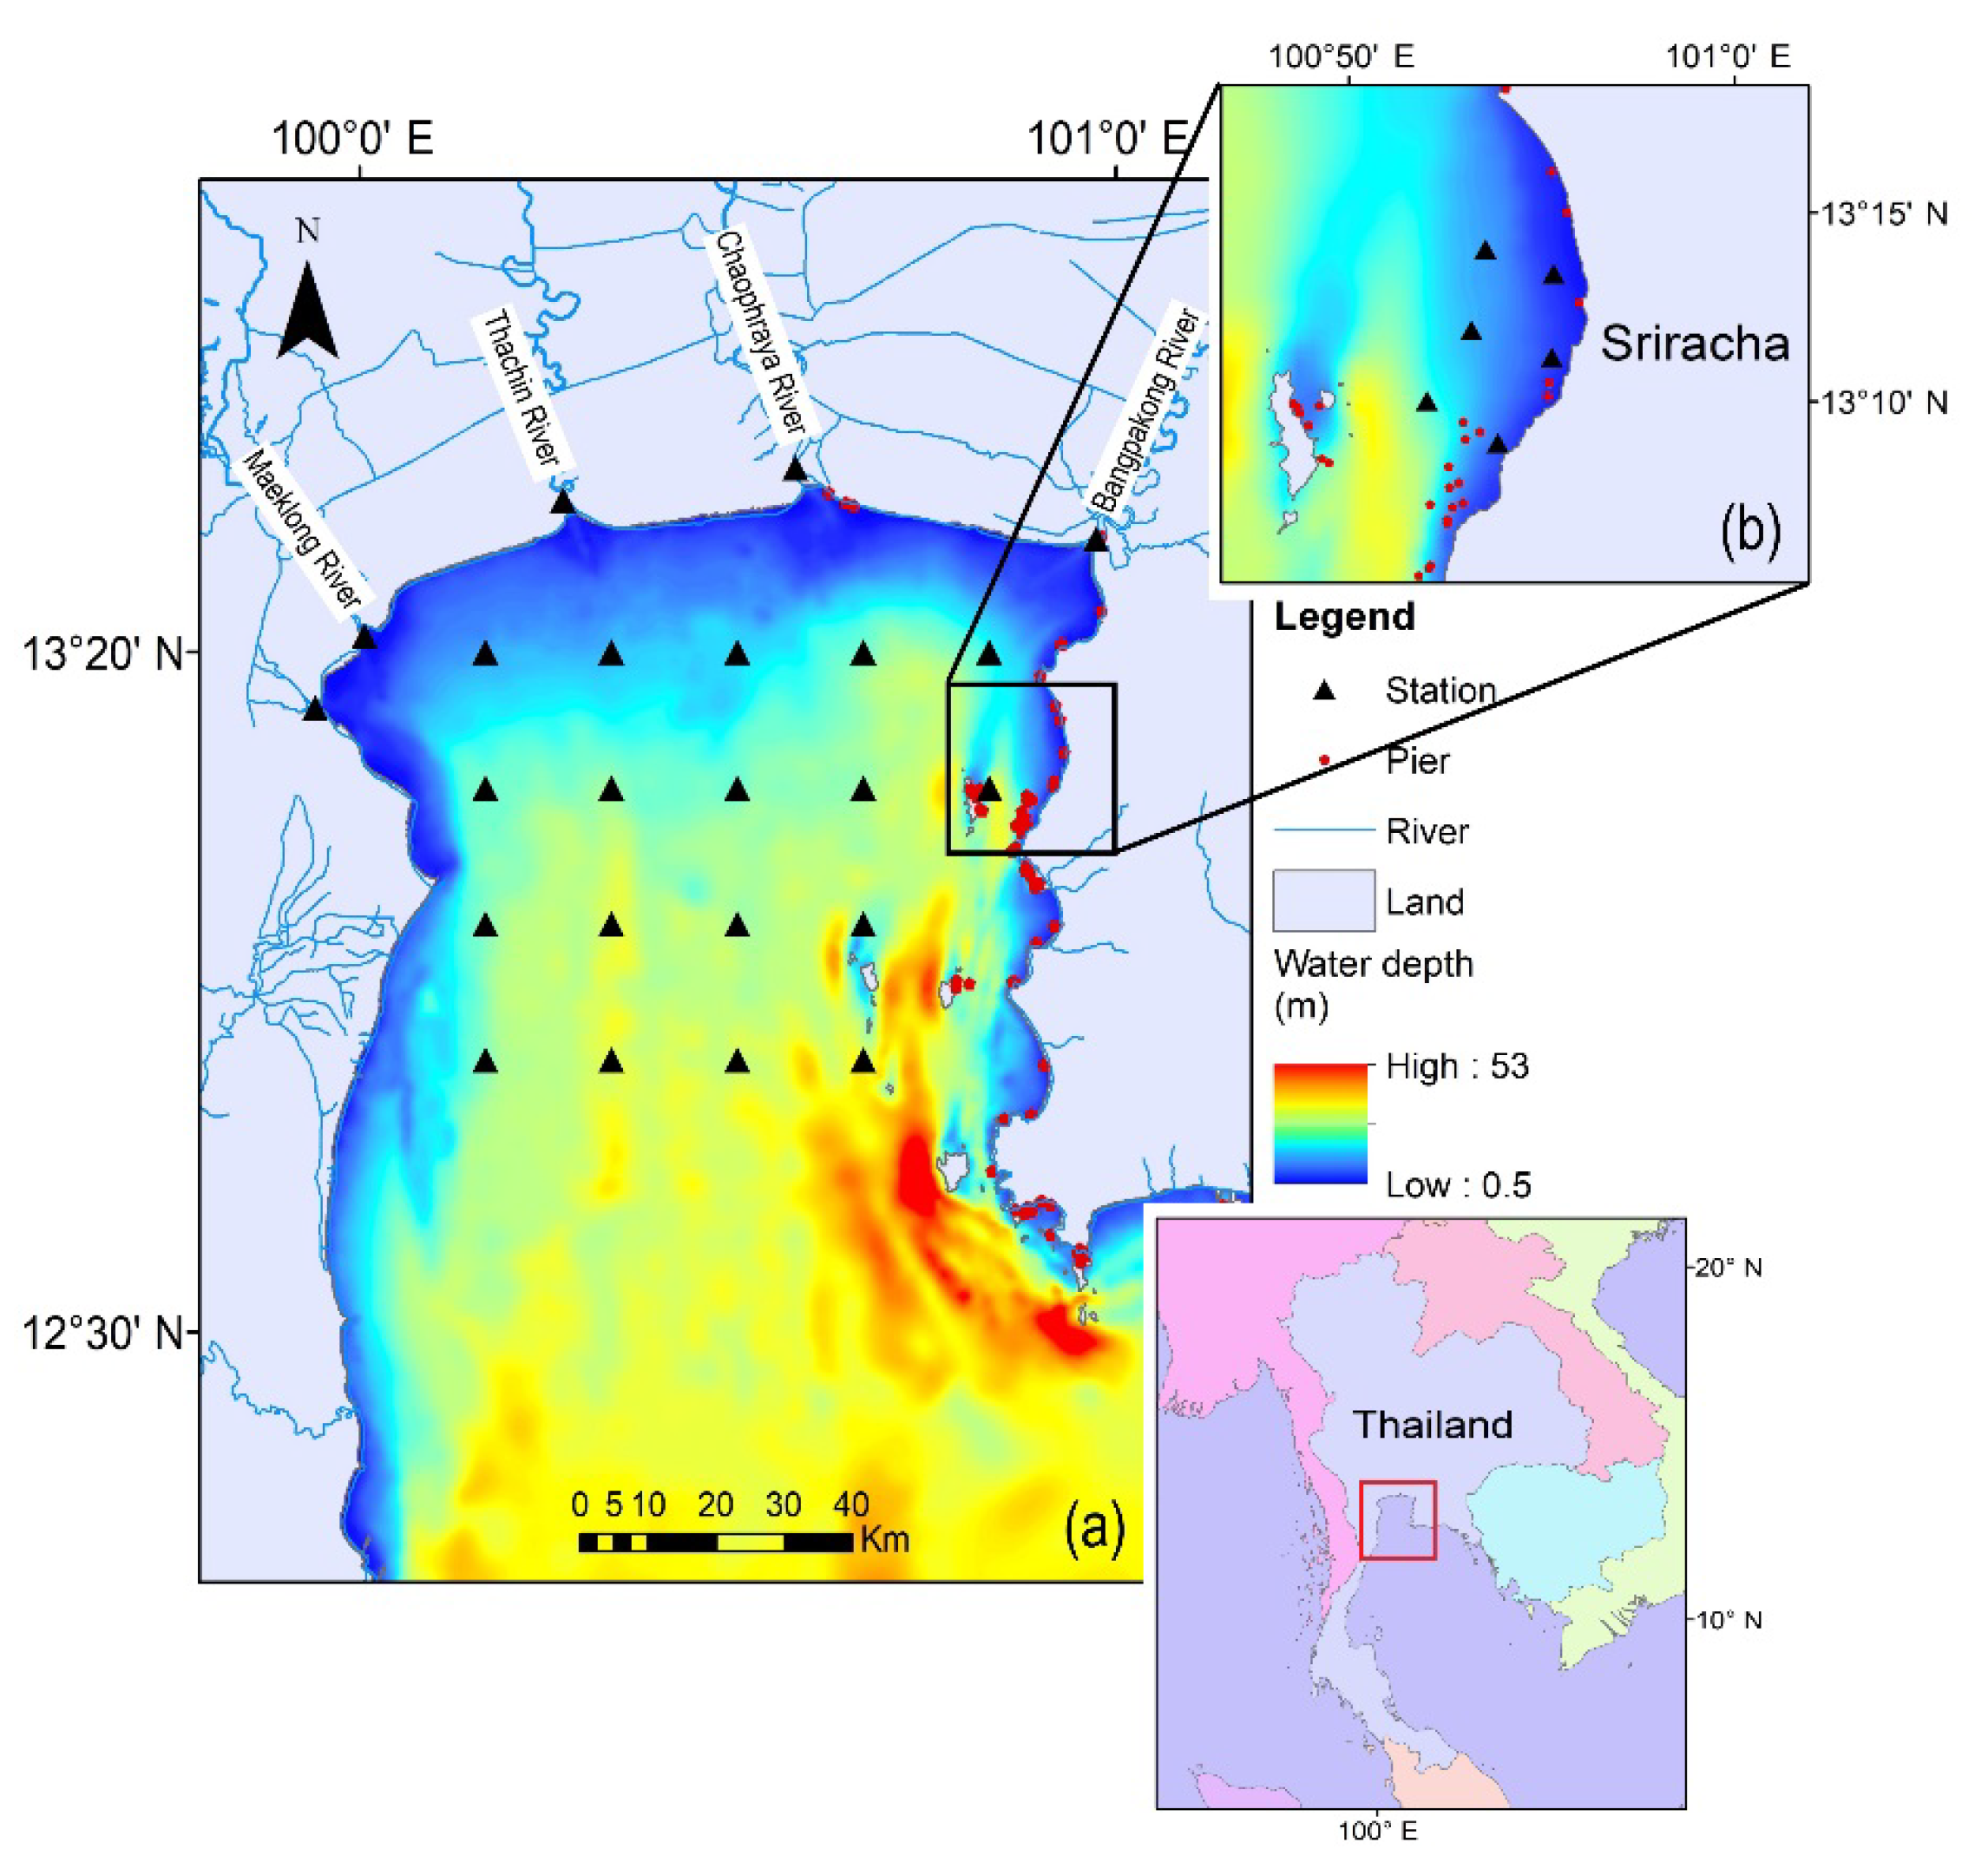
2.1. Study Area

The InnerGoT is a small semi-enclosed water body (Figure 1). The area lies between 12°30′ N and 13°30′ N, and 100°0′ E and 101°0′ E, with roughly 300 km length of shoreline and enclosed shallow bay with an average depth of 20 m. All spatial data used in the GIS model were aligned to WGS 1984 UTM zone 47 coordinate system. The InnerGoT is strongly affected by freshwater discharge from four major rivers, including Maeklong, Thachin, Chao Phraya, and Bangpakong rivers. The InnerGoT is also affected by monsoons with wet southwesterly winds during the Southwest monsoon (SW monsoon) from May to September and dry wind from the northeast during the Northeast monsoon (NE monsoon) from November to January. Seasonal variation in discharges of these rivers into the InnerGoT occurs, where small and large discharges are observed from December–May and June–November, respectively (Figure 2).
The water temperature in Ao Sriracha where the mussel is cultured is between 25 and 30 °C, with optimum salinity for mussel growth around 30 ppt [22]. The mass production of green mussels in Ao Sriracha was reported to reach a maximum of 20,668 t in 2014 but suddenly dropped to 410.8 t in 2019 (Figure 3) [23].

2.2. Environmental Data

2.2.1. Field Measurements

The environmental factors used for this study were sea surface temperature (SST), salinity, maximum water current (MWC). These data are the major environmental factors important for the aquaculture of the green mussel [22]. MWC, salinity, and SST were measure from the data logger from 2018–2019. All of the data were monthly surveys at the 24 observation stations in the InnerGoT (August–September 2014, November–December 2014, February 2015, April 2015, and June 2015) from [24] (Figure 1a) and 6 stations in Ao Sriracha, Chonburi province, in 2019 (Figure 1b). The meteorological data (wind, air temperature, rainfall) were supported by the Thai Meteorological Department from 2018 to 2019.

2.2.2. Hydrodynamic Data

To acquire continuous spatio-temporal data of water temperature, salinity, and current flow velocity of the InnerGoT, this study utilized data from a three-dimensional hydrodynamic simulation of the Gulf of Thailand. The simulations were carried out using the Delft3D-FLOW model [25] that took into account the changing hydrodynamics due to combined effects of shoreline and bottom irregularities, tide, four major rivers, spatial and temporal wind, air temperature, relative humidity, rainfall, and cloud cover conditions from the ECMWF-ERA5 dataset [26] and offshore conditions from the HYCOM model [27]. The model outputs were calibrated and validated, with a-year-long actual measurements obtained using data loggers in Sriracha. The field observations and modeled data for water level, salinity, and temperature showed good agreement (Figure 4). Therefore, the simulations can provide hydrodynamic conditions capturing realistic seasonal and inter-annual variations. Monthly averaged surface values of the water temperature and salinity, and the maximum current flow velocity were then exported for 2018 and 2019 to be used as environmental input for the suitability model.

2.2.3. Remote Sensing Data and Processing

The daily Level-2 data (at 1-km resolution) chlorophyll-a concentration (Chl-a) data were obtained for the period January 2018–December 2019 in the SNPP_VIIRS Reprocessing from the Ocean Color website (http://oceancolor.gsfc.nasa.gov). The SNPP dataset was processed by the SeaWiFS Data Analysis System (SeaDAS) 7.5.3 software.
Social economics and support facilities or social infrastructures are also important for green mussel aquaculture. These factors include the distance to town, the distance to piers, and the distance to land-based facilities [18]. Constraint data, such as harbors, town or industrial areas, river mouths, and agriculture areas, were also collated. Measuring distances for both data were made by the distance analysis using ArcGIS spatial analyst (function in ArcGIS software) to convert into raster data and measure a distance for each infrastructure and constraint data. The Google Earth Pro 7.3 software was used to extract the social infrastructure and constraint data as well as basemap features.

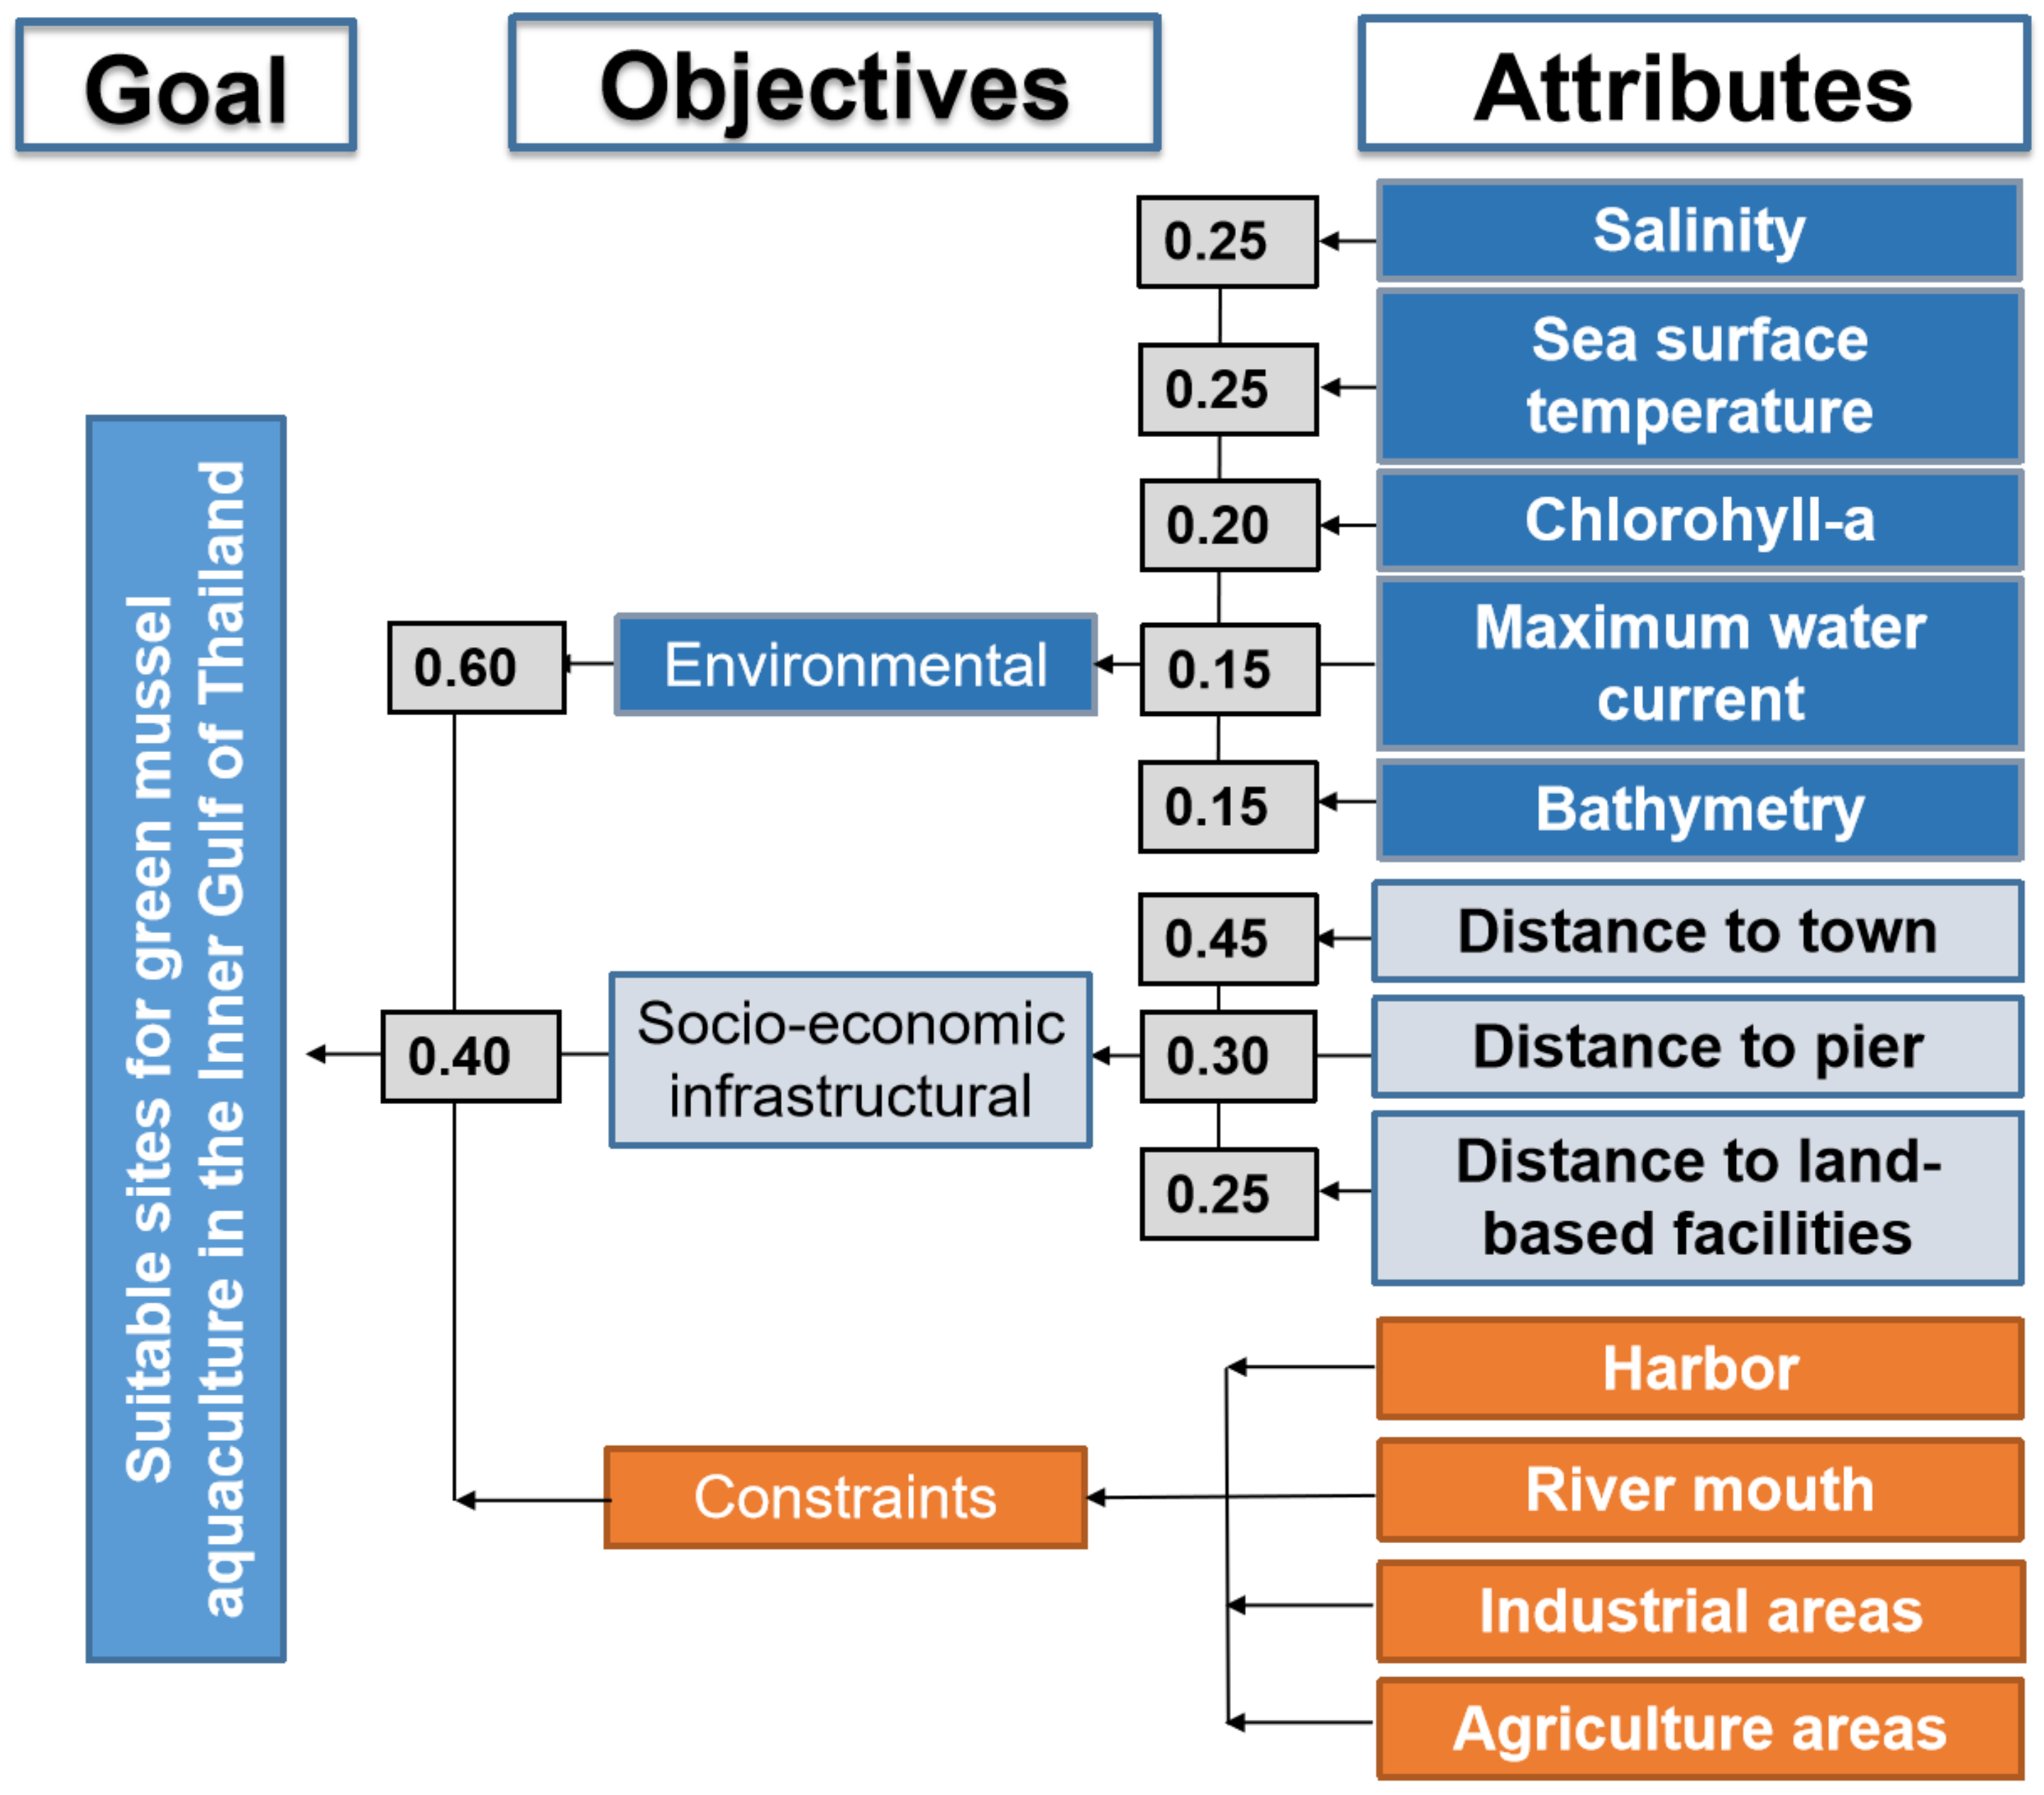
2.3. SASSM Development

The SASSM was implemented using the Model Builder in ArcGIS. This model combined three sub-models, including an environmental model (SST, salinity, Chl-a, MWC, and bathymetry), a social infrastructure model (distances to town, piers, and land-based facilities), and a constraints model (harbor, industrial areas, agriculture areas, and river mouth). The distance analysis function of ArcGIS was used to measure distances for social infrastructure and constraint data. The structure of the SASSM developed for the green mussel aquaculture is shown in Figure 5. In this study, parameter values were ranked on a scale from 1 (lowest suitability score) to 7 (highest suitability score) following [22] and [2]. The SST, salinity, Chl-a, MWC, and bathymetry were given a weighted value based on their effects on the growth or survival of the bivalves [28] (Table 1). To define the parameter weights, pairwise comparisons were used [22] available in SPSS under Analyze and constructed using the weighted linear combination (WLC) method of multi-criteria evaluation (MCE), following [29]. The percentage of weighting was set on the environment sub-model at 60% and social infrastructure sub-model at 40%. For environmental factors, SST and salinity are major factors, chlorophyll is secondary, and bathymetry and MWC are the minority factors, therefore we set salinity at 25%, SST at 25%, Chl-a at 20%, MWC at 15%, and bathymetry at 15% (Figure 5). This percentage was calculated by examining suitable factors for green mussel growth. The final suitability map was categorized as sites for bivalves farming and modified data and weighted value from [13] for green mussel aquaculture in the InnerGoT. The weighted category between 1 and 2 means that the area may support green mussel aquaculture but is not recommended, the weighted category between 3 and 4 denotes moderate potential for green mussel farming, and weighted category 5–7 denotes high suitability for green mussel farming and thus is highly recommended [28] (Table 1).

2.4. Correlation Analysis

Pearson’s correlation coefficients were computed between environmental factors and suitability index across all seasons, and their statistical significance (p < 0.01 and p < 0.05) was tested using the t-statistics. Suitability indices in 2018 (wet year; higher freshwater discharge than average and lower temperature) and 2019 (dry year; lower freshwater discharge than average and higher temperature) were also compared to examine the inter-annual patterns.

3. Results

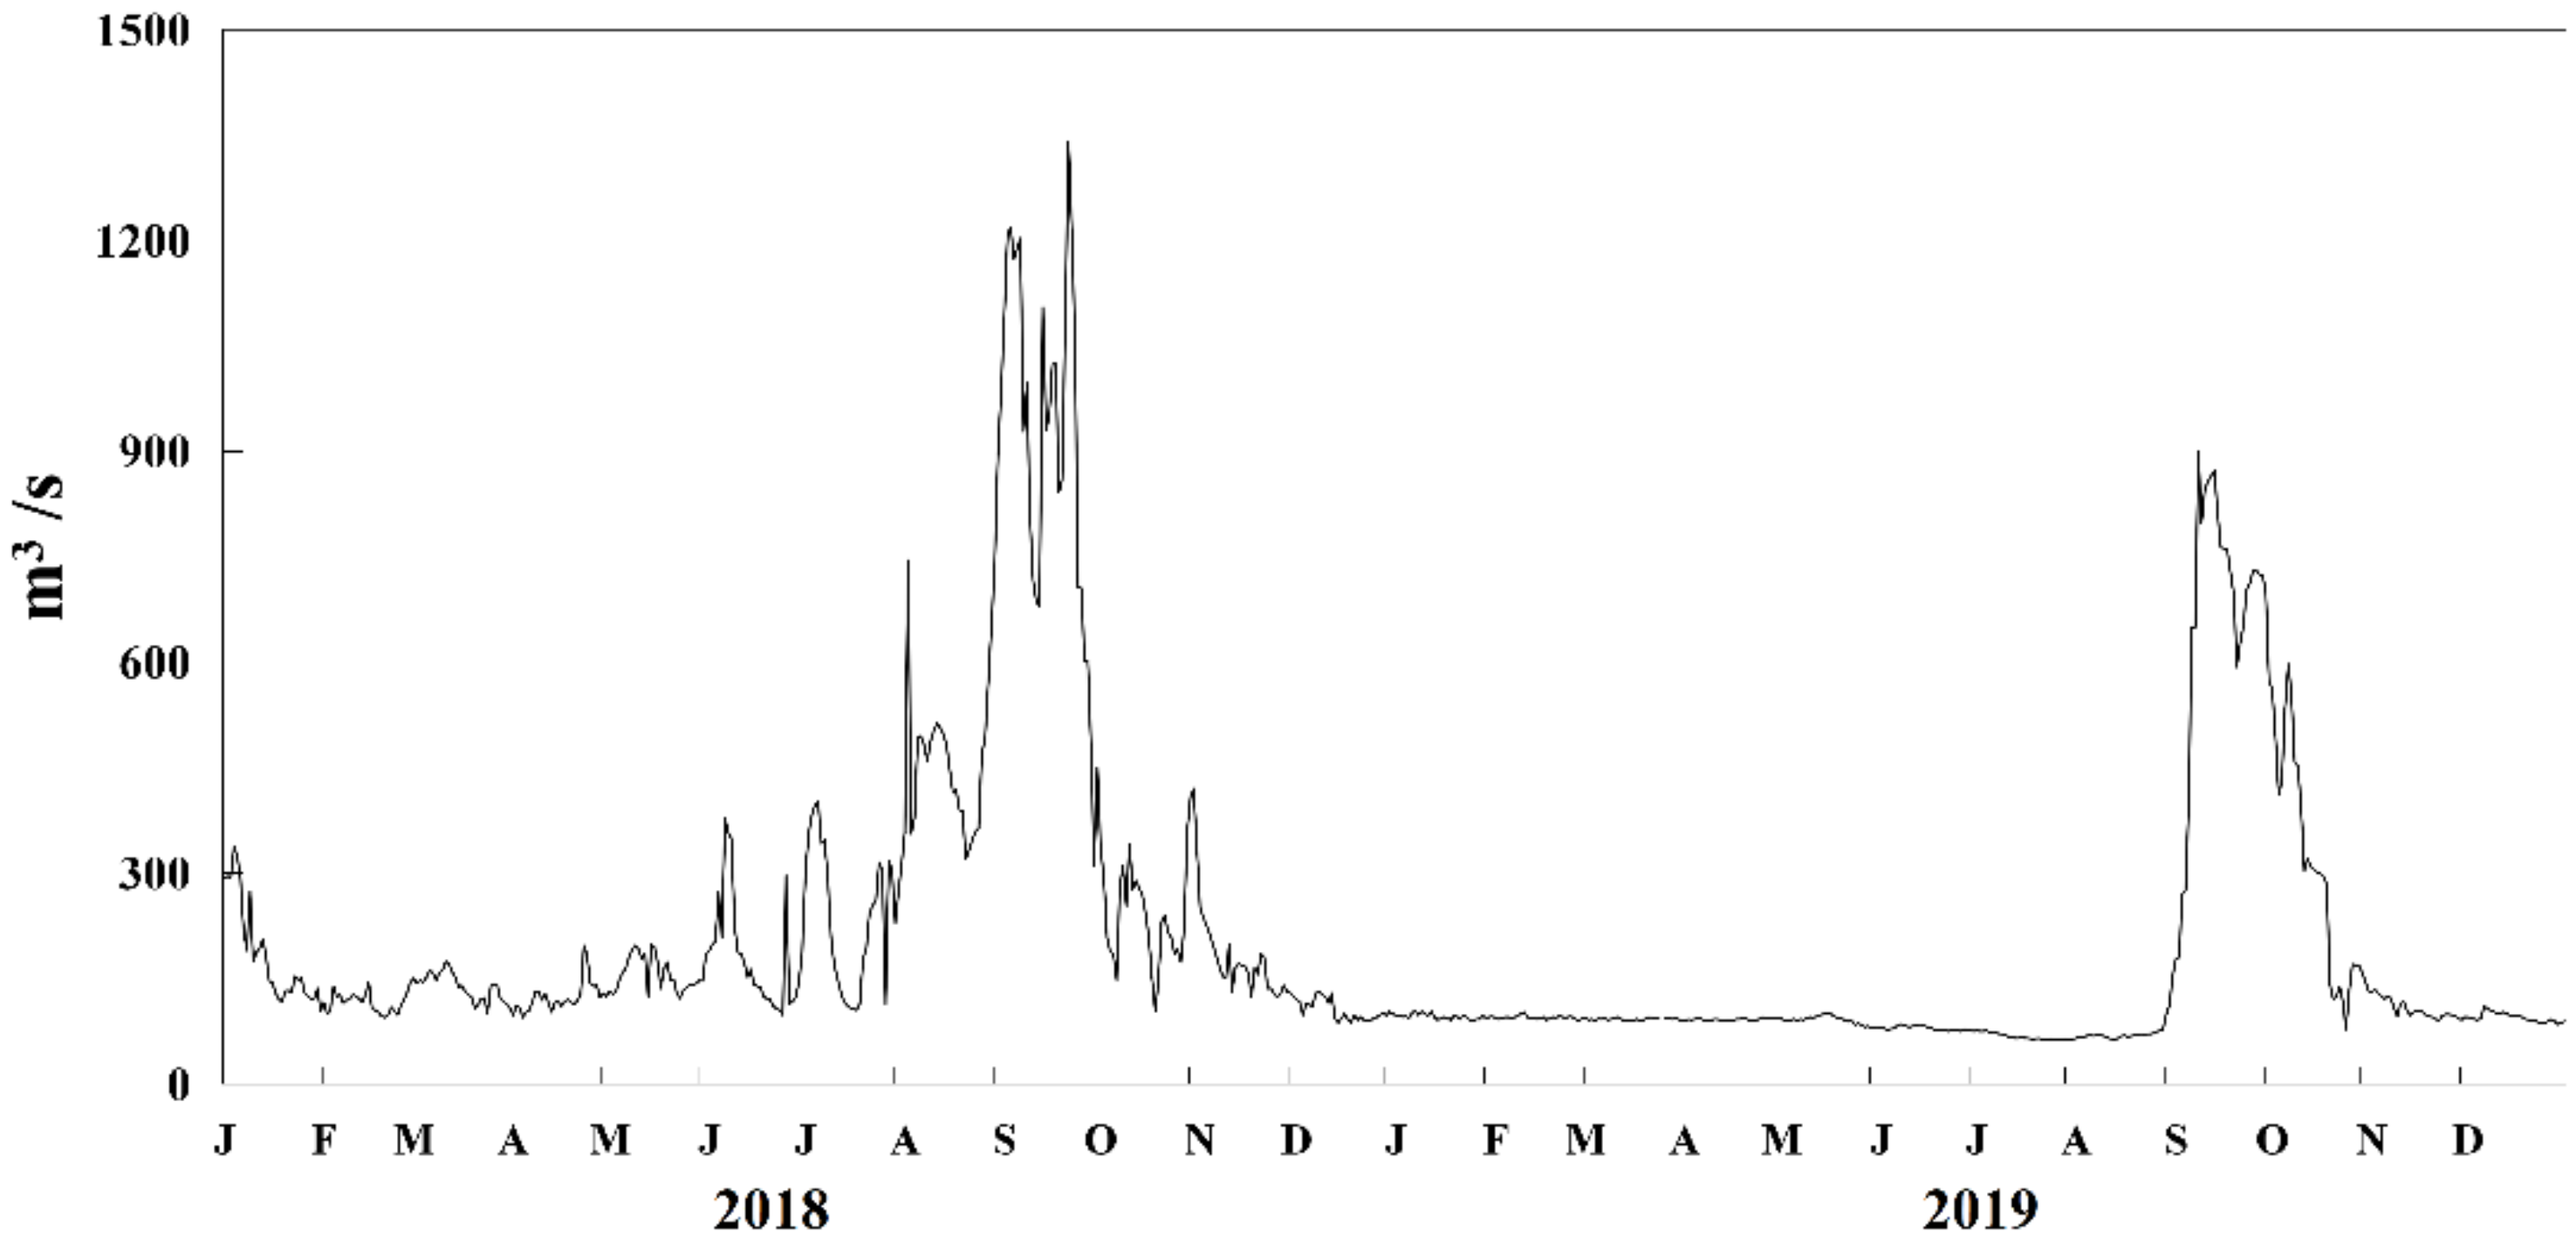
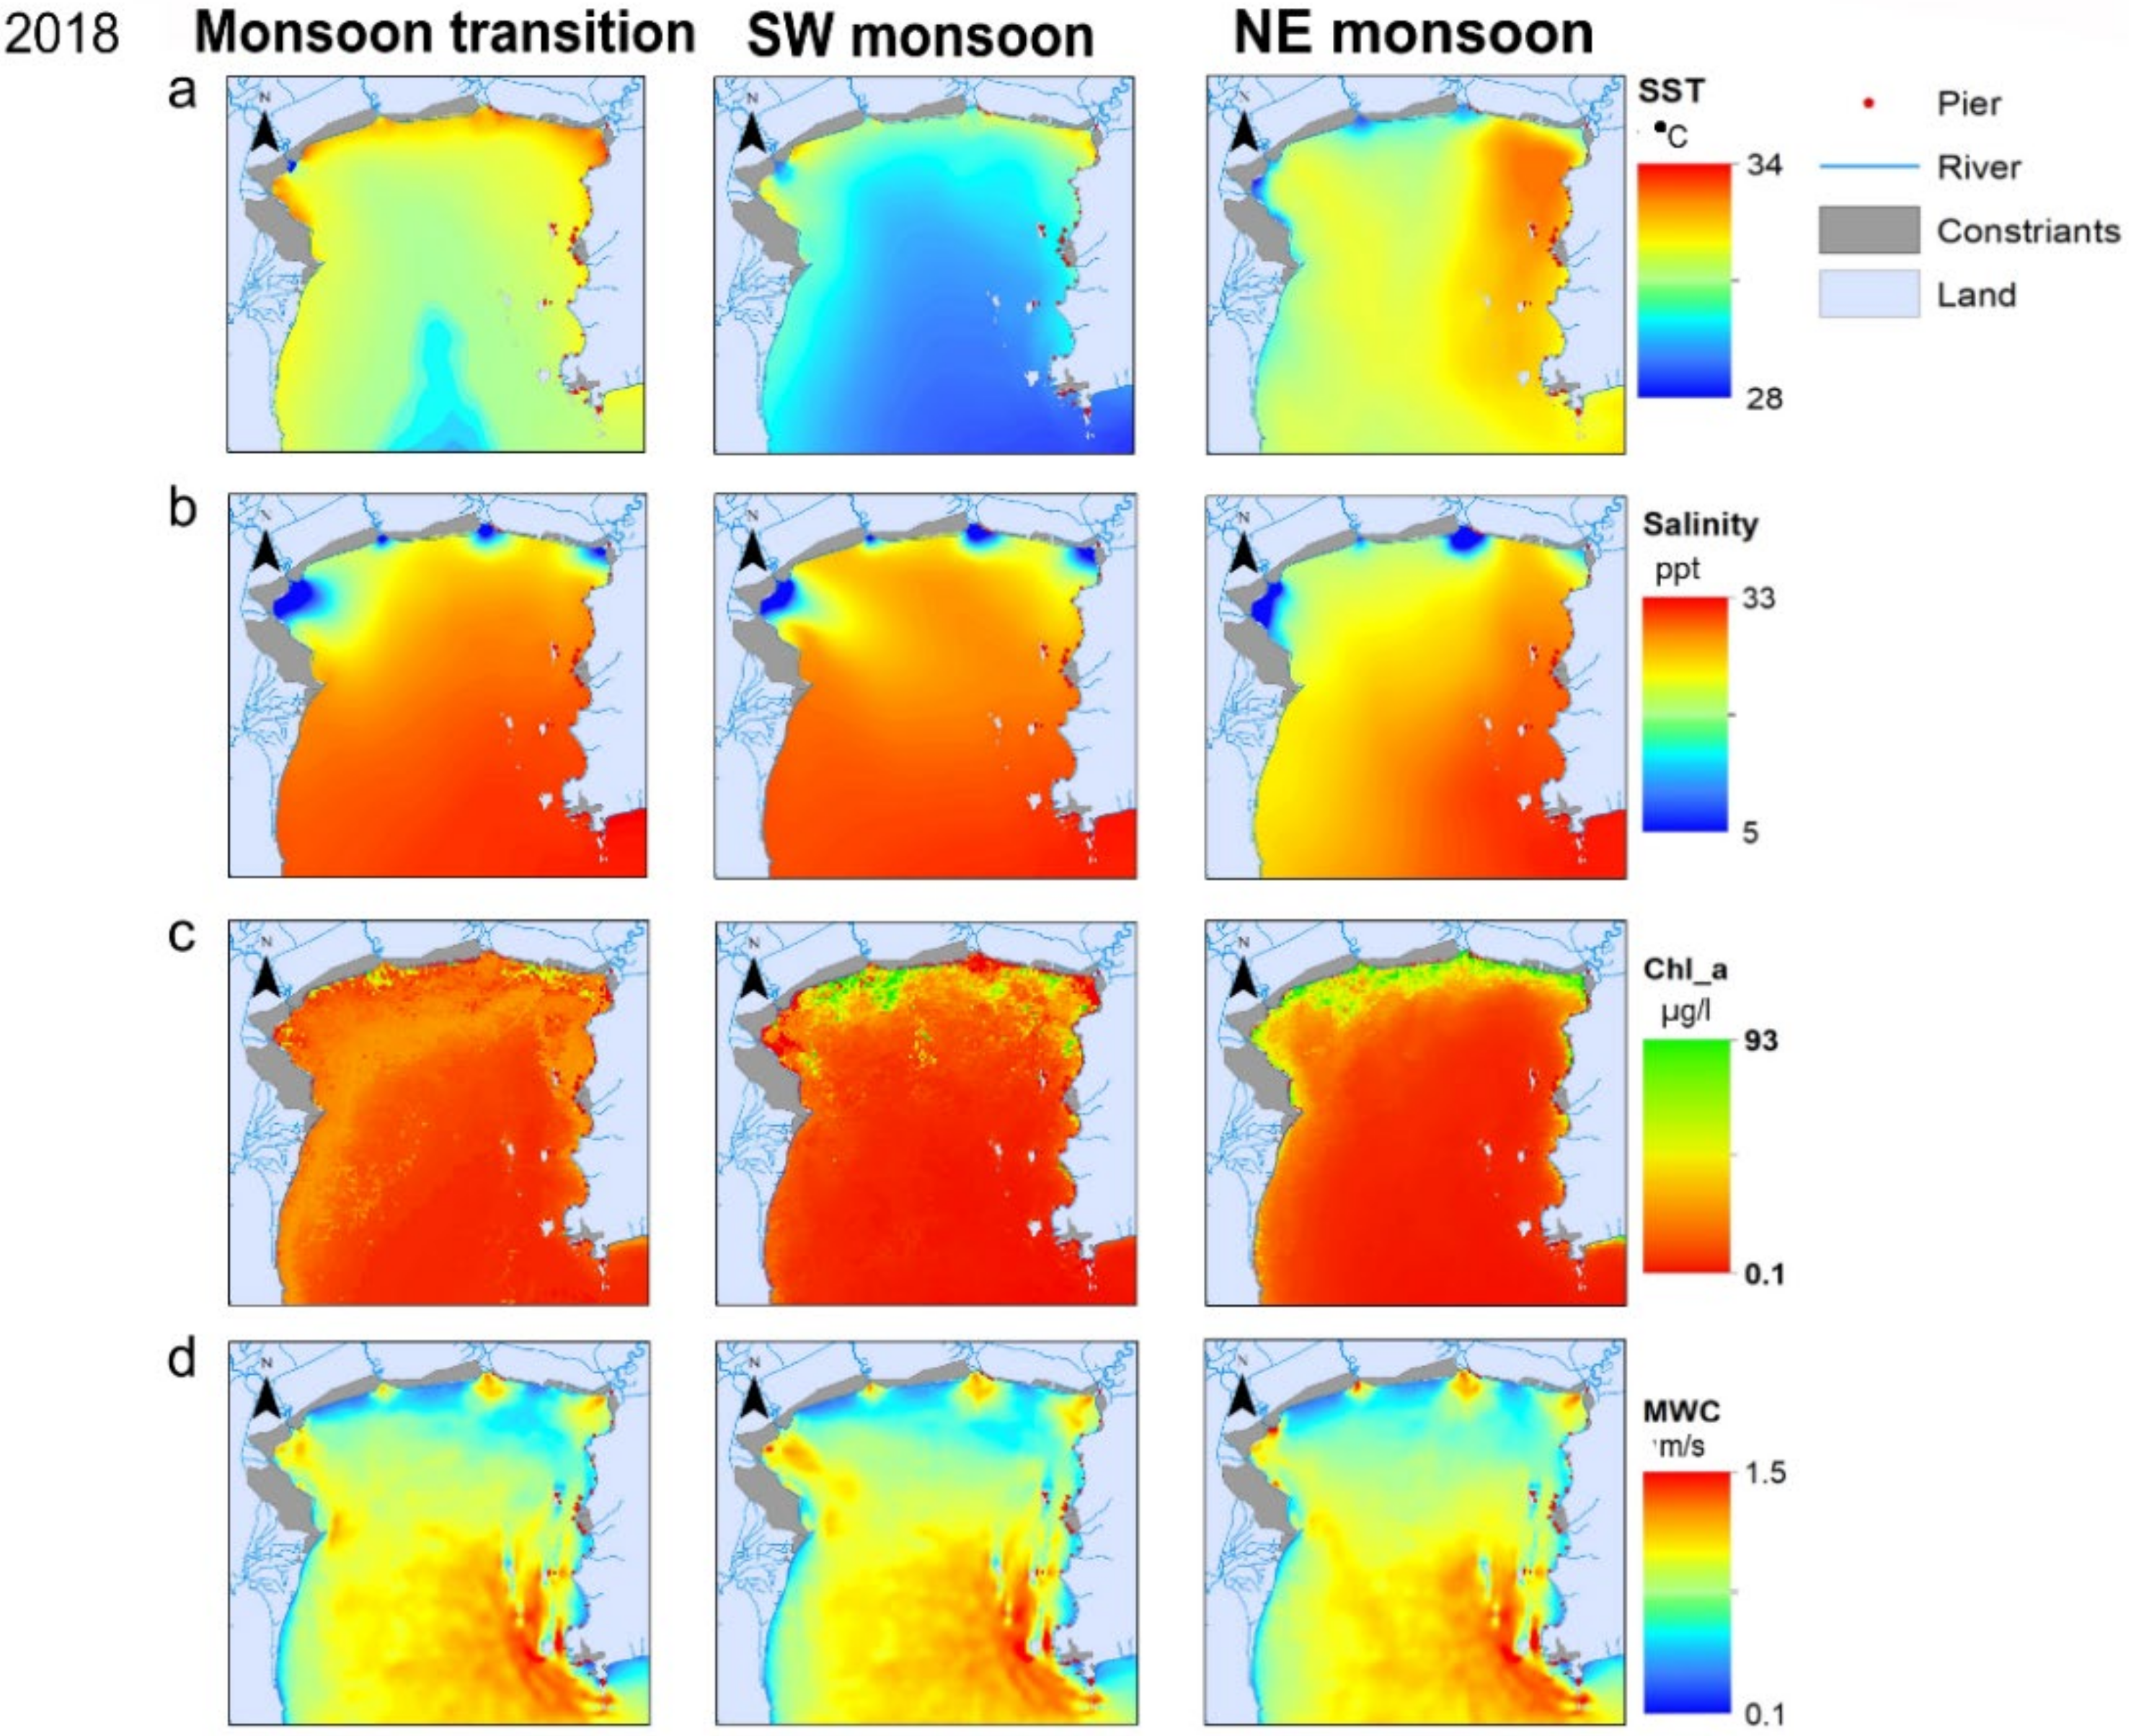
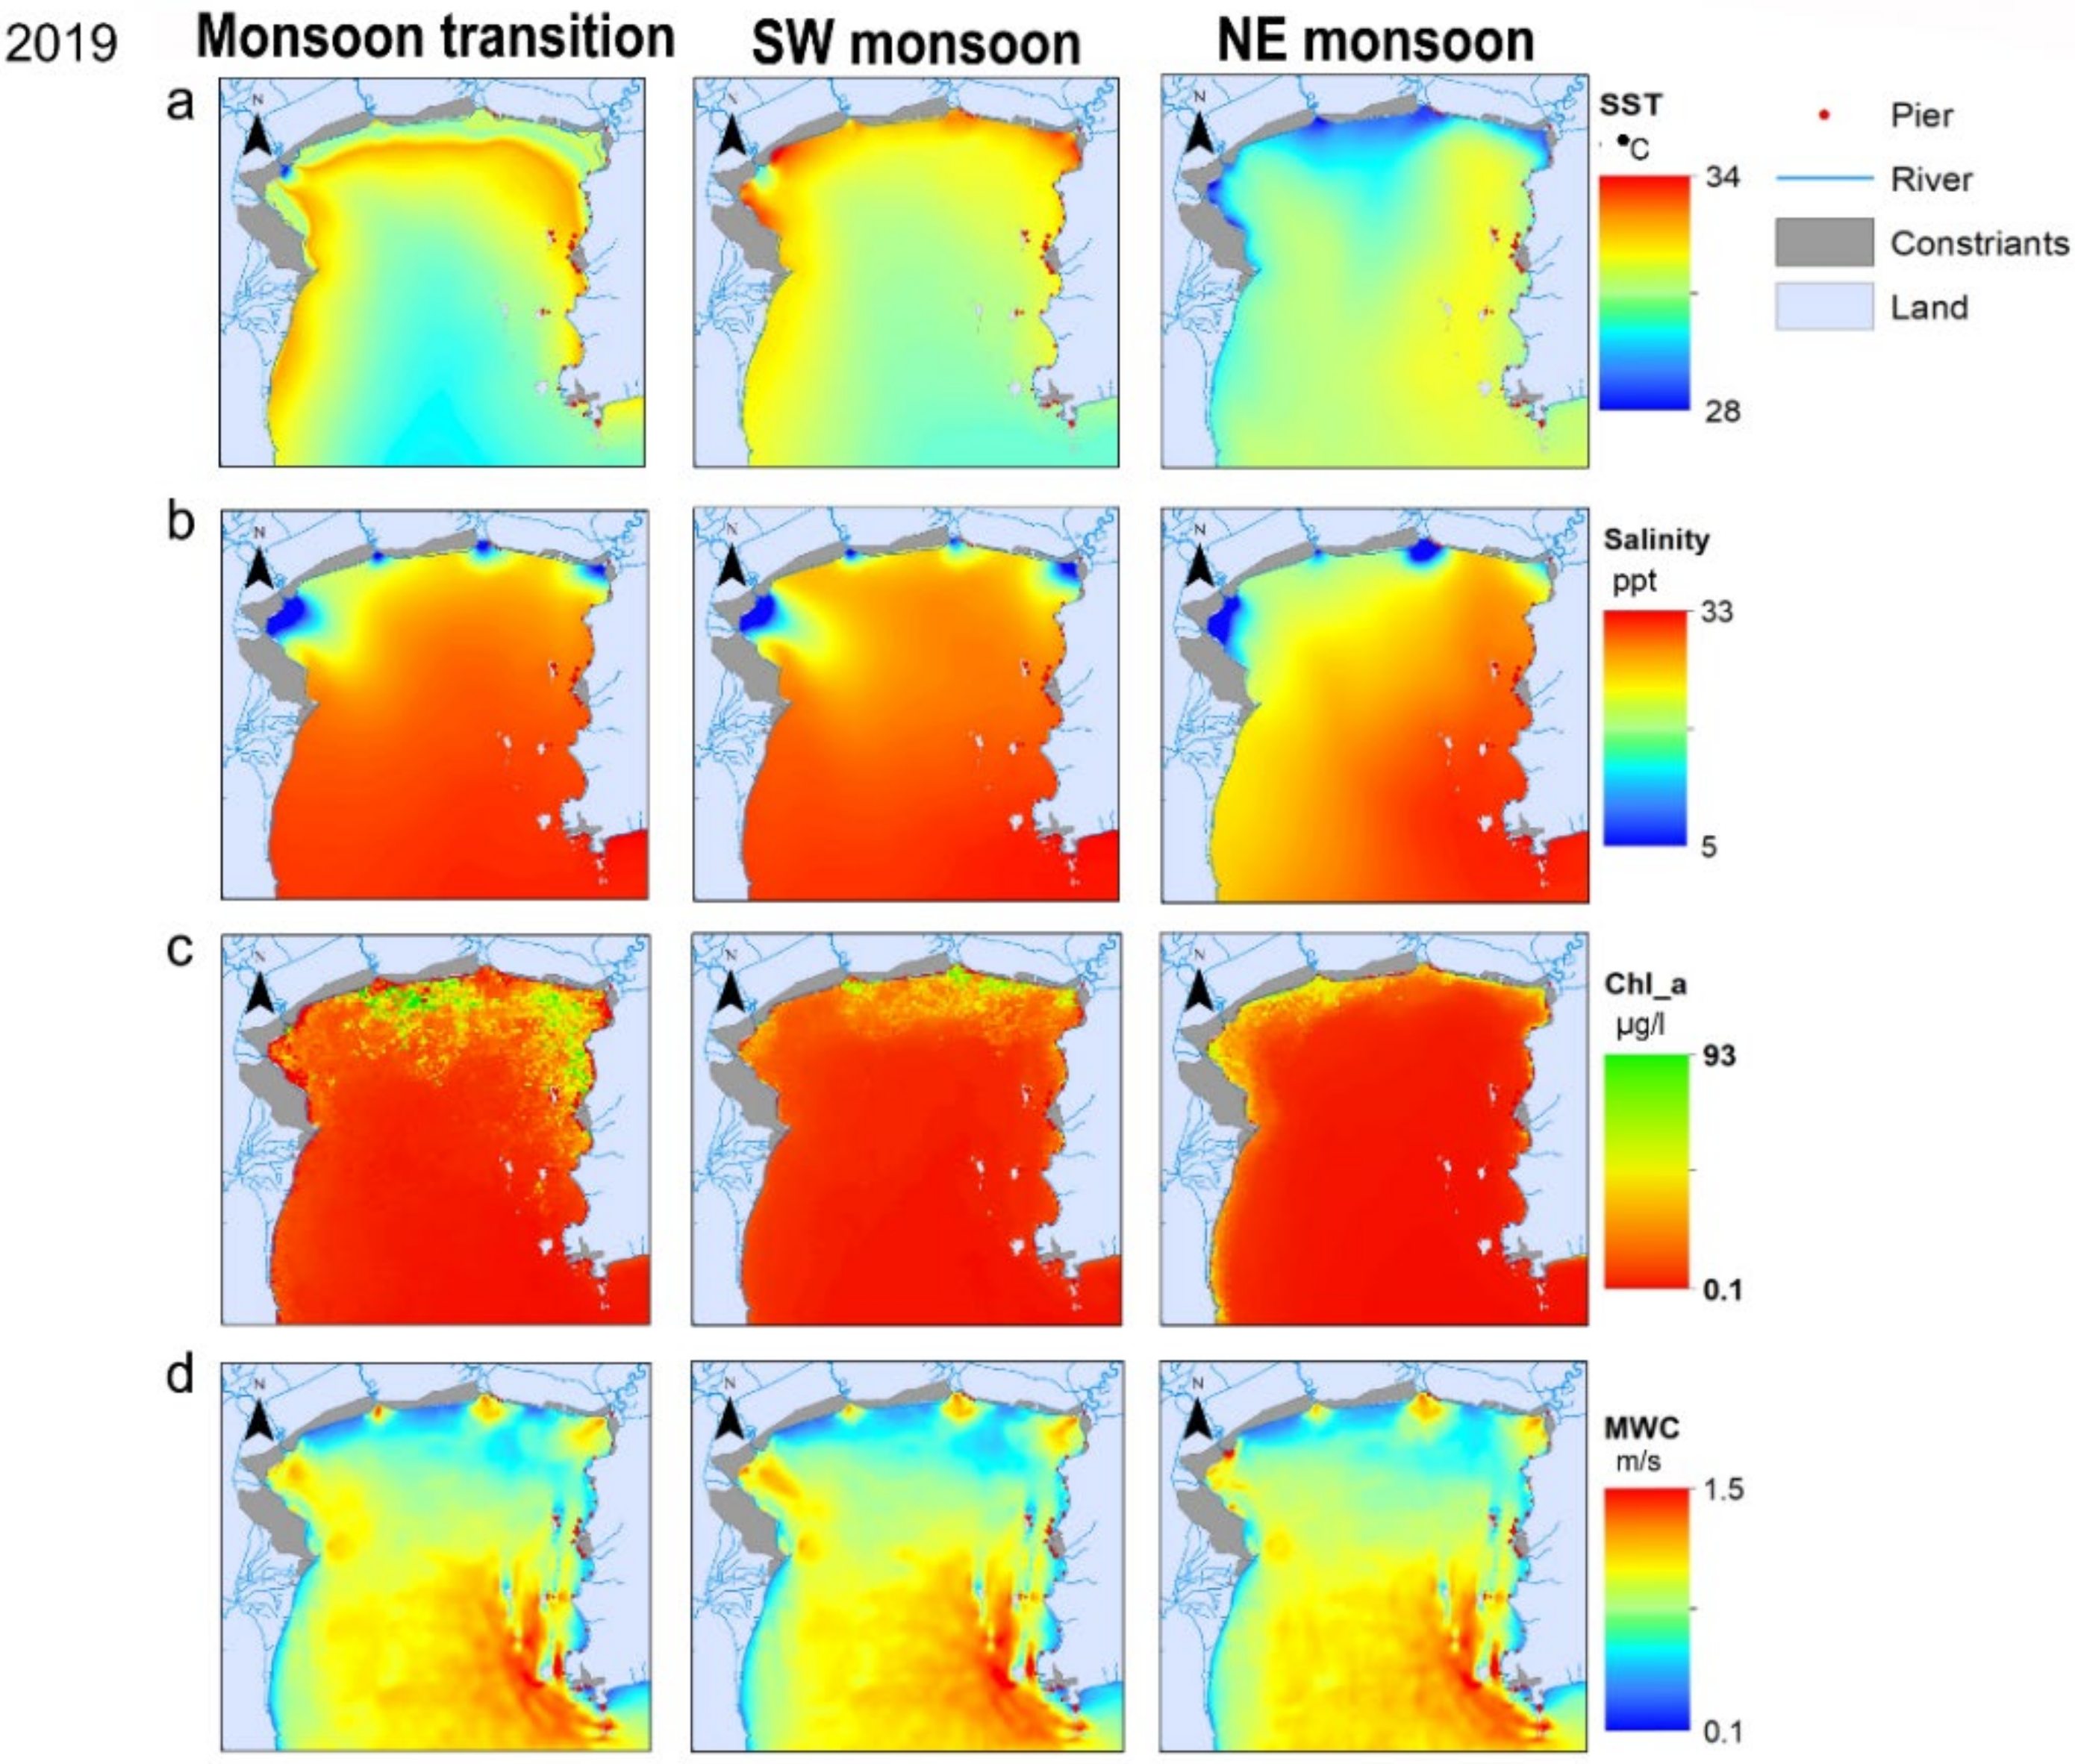
3.1. Seasonal Variations of Environmental Factors

Seasonal distributions of SST, salinity, Chl-a, and MWC in 2018 and 2019 averaged across three periods (monsoon transition, SW monsoon, and NE monsoon) showed different spatial patterns (Figure 6 and Figure 7). Average SSTs were high in the rainy season in both years (34 °C and 33 °C, respectively) but low in the monsoon transition and NE monsoon (32 °C and 30 °C, respectively; Figure 6a and Figure 7a). There is no difference in the monthly salinity values except during the SW monsoon (Figure 6b and Figure 7b) when enormous river discharges reduce salinity in the gulf. The mean values of Chl-a in the SW monsoon and NE monsoon were also much higher than in the monsoon transition (Figure 6c and Figure 7c). However, the monthly average currents were similar in each area (Figure 6d and Figure 7d).
In the NE monsoon 2018, the average SSTs (Figure 6a) were higher than in 2019 (Figure 7a). The average SSTs in some months in the area near the river mouth were also higher than in the offshore region. The average values of salinity in the two years were generally similar in spatial pattern, however, 2018 recorded the lowest salinity during the SW monsoon (Figure 6b). The average Chl-a near the river mouths were higher than the offshore waters (Figure 6c). However, Chl-a concentration along the river mouths in the NE monsoon of 2018 (Figure 6c) was less than that recorded for 2019 (Figure 7c). The average maximum water current speed was highest in the SW monsoon of 2018 and lowest in the NE monsoon 2019 (Figure 7d). In the western part of the InnerGoT, the average MWC values were high.

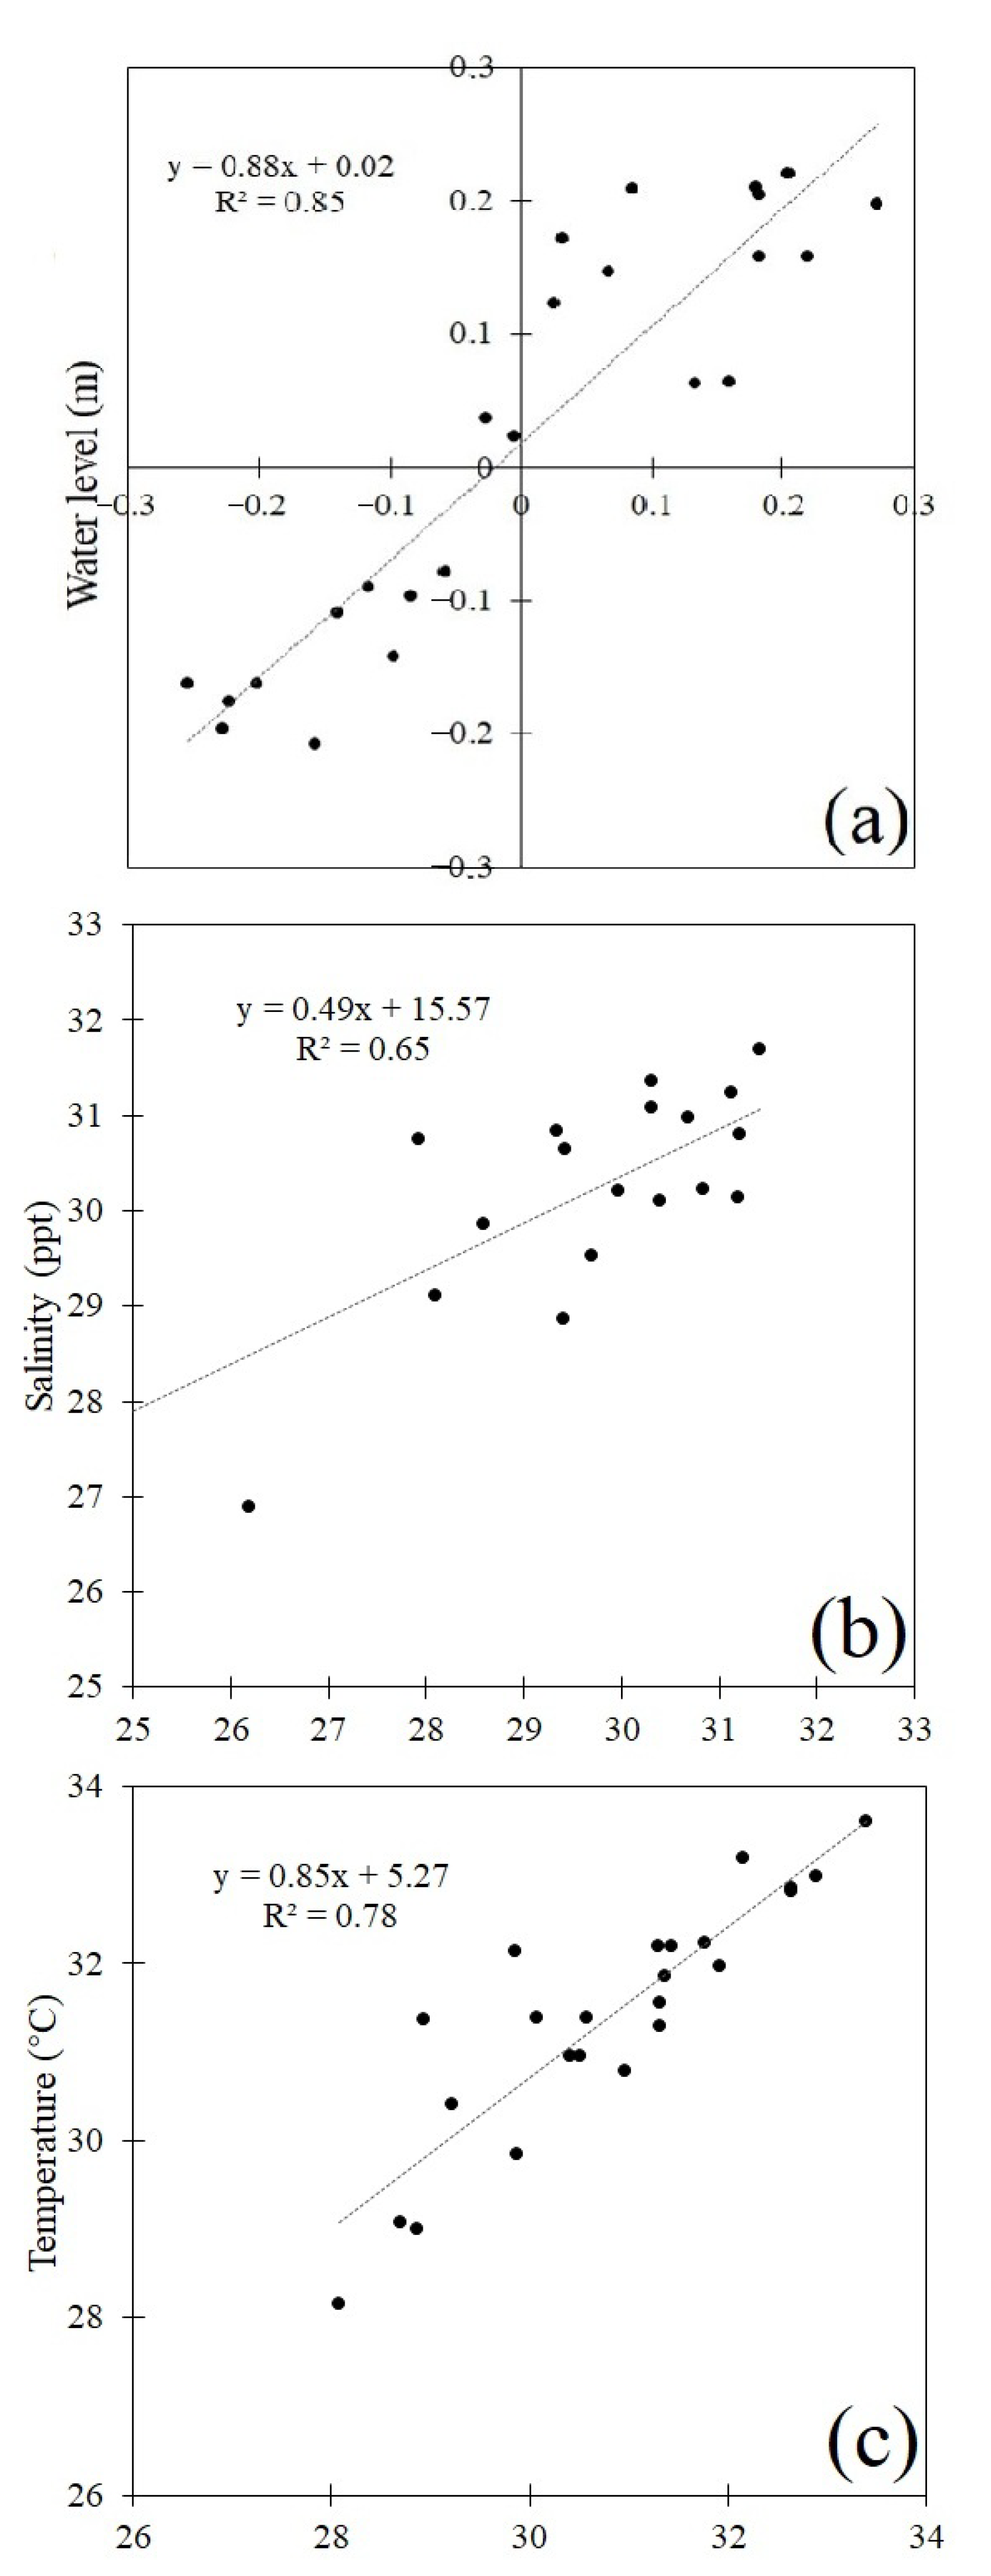
3.2. Constructed Models

The suitability maps of the sub-models for green mussel aquaculture in the InnerGoT are shown in Figure 8. In the SASSM model, Chl-a concentration, salinity, SST, and bathymetry from January 2018 to December 2019 were used to evaluate the environmental model; the output shows the worst suitable area at the river mouth but along the coast in the western part and offshore has a more suitable area for green mussel aquaculture (Figure 8a). The constraints model contained limited information (Figure 8b), including harbor areas, areas near the river mouth, industry, tourism zones, and artificial facilities along the coasts. The social infrastructure model, distance to towns, piers, agriculture, and land-based facilities were considered for the criteria setting; the output shows the best suitable area for green mussel aquaculture in the eastern part (Figure 8c). The final yearly mean SASSM maps in 2018 and 2019 (Figure 9a,b) were comparable and highly consistent with the present, in-situ green mussel culture operations shown in Figure 9c [30]; the results show suitability scores between 4–6 in the middle part and also coastal areas in the eastern part.

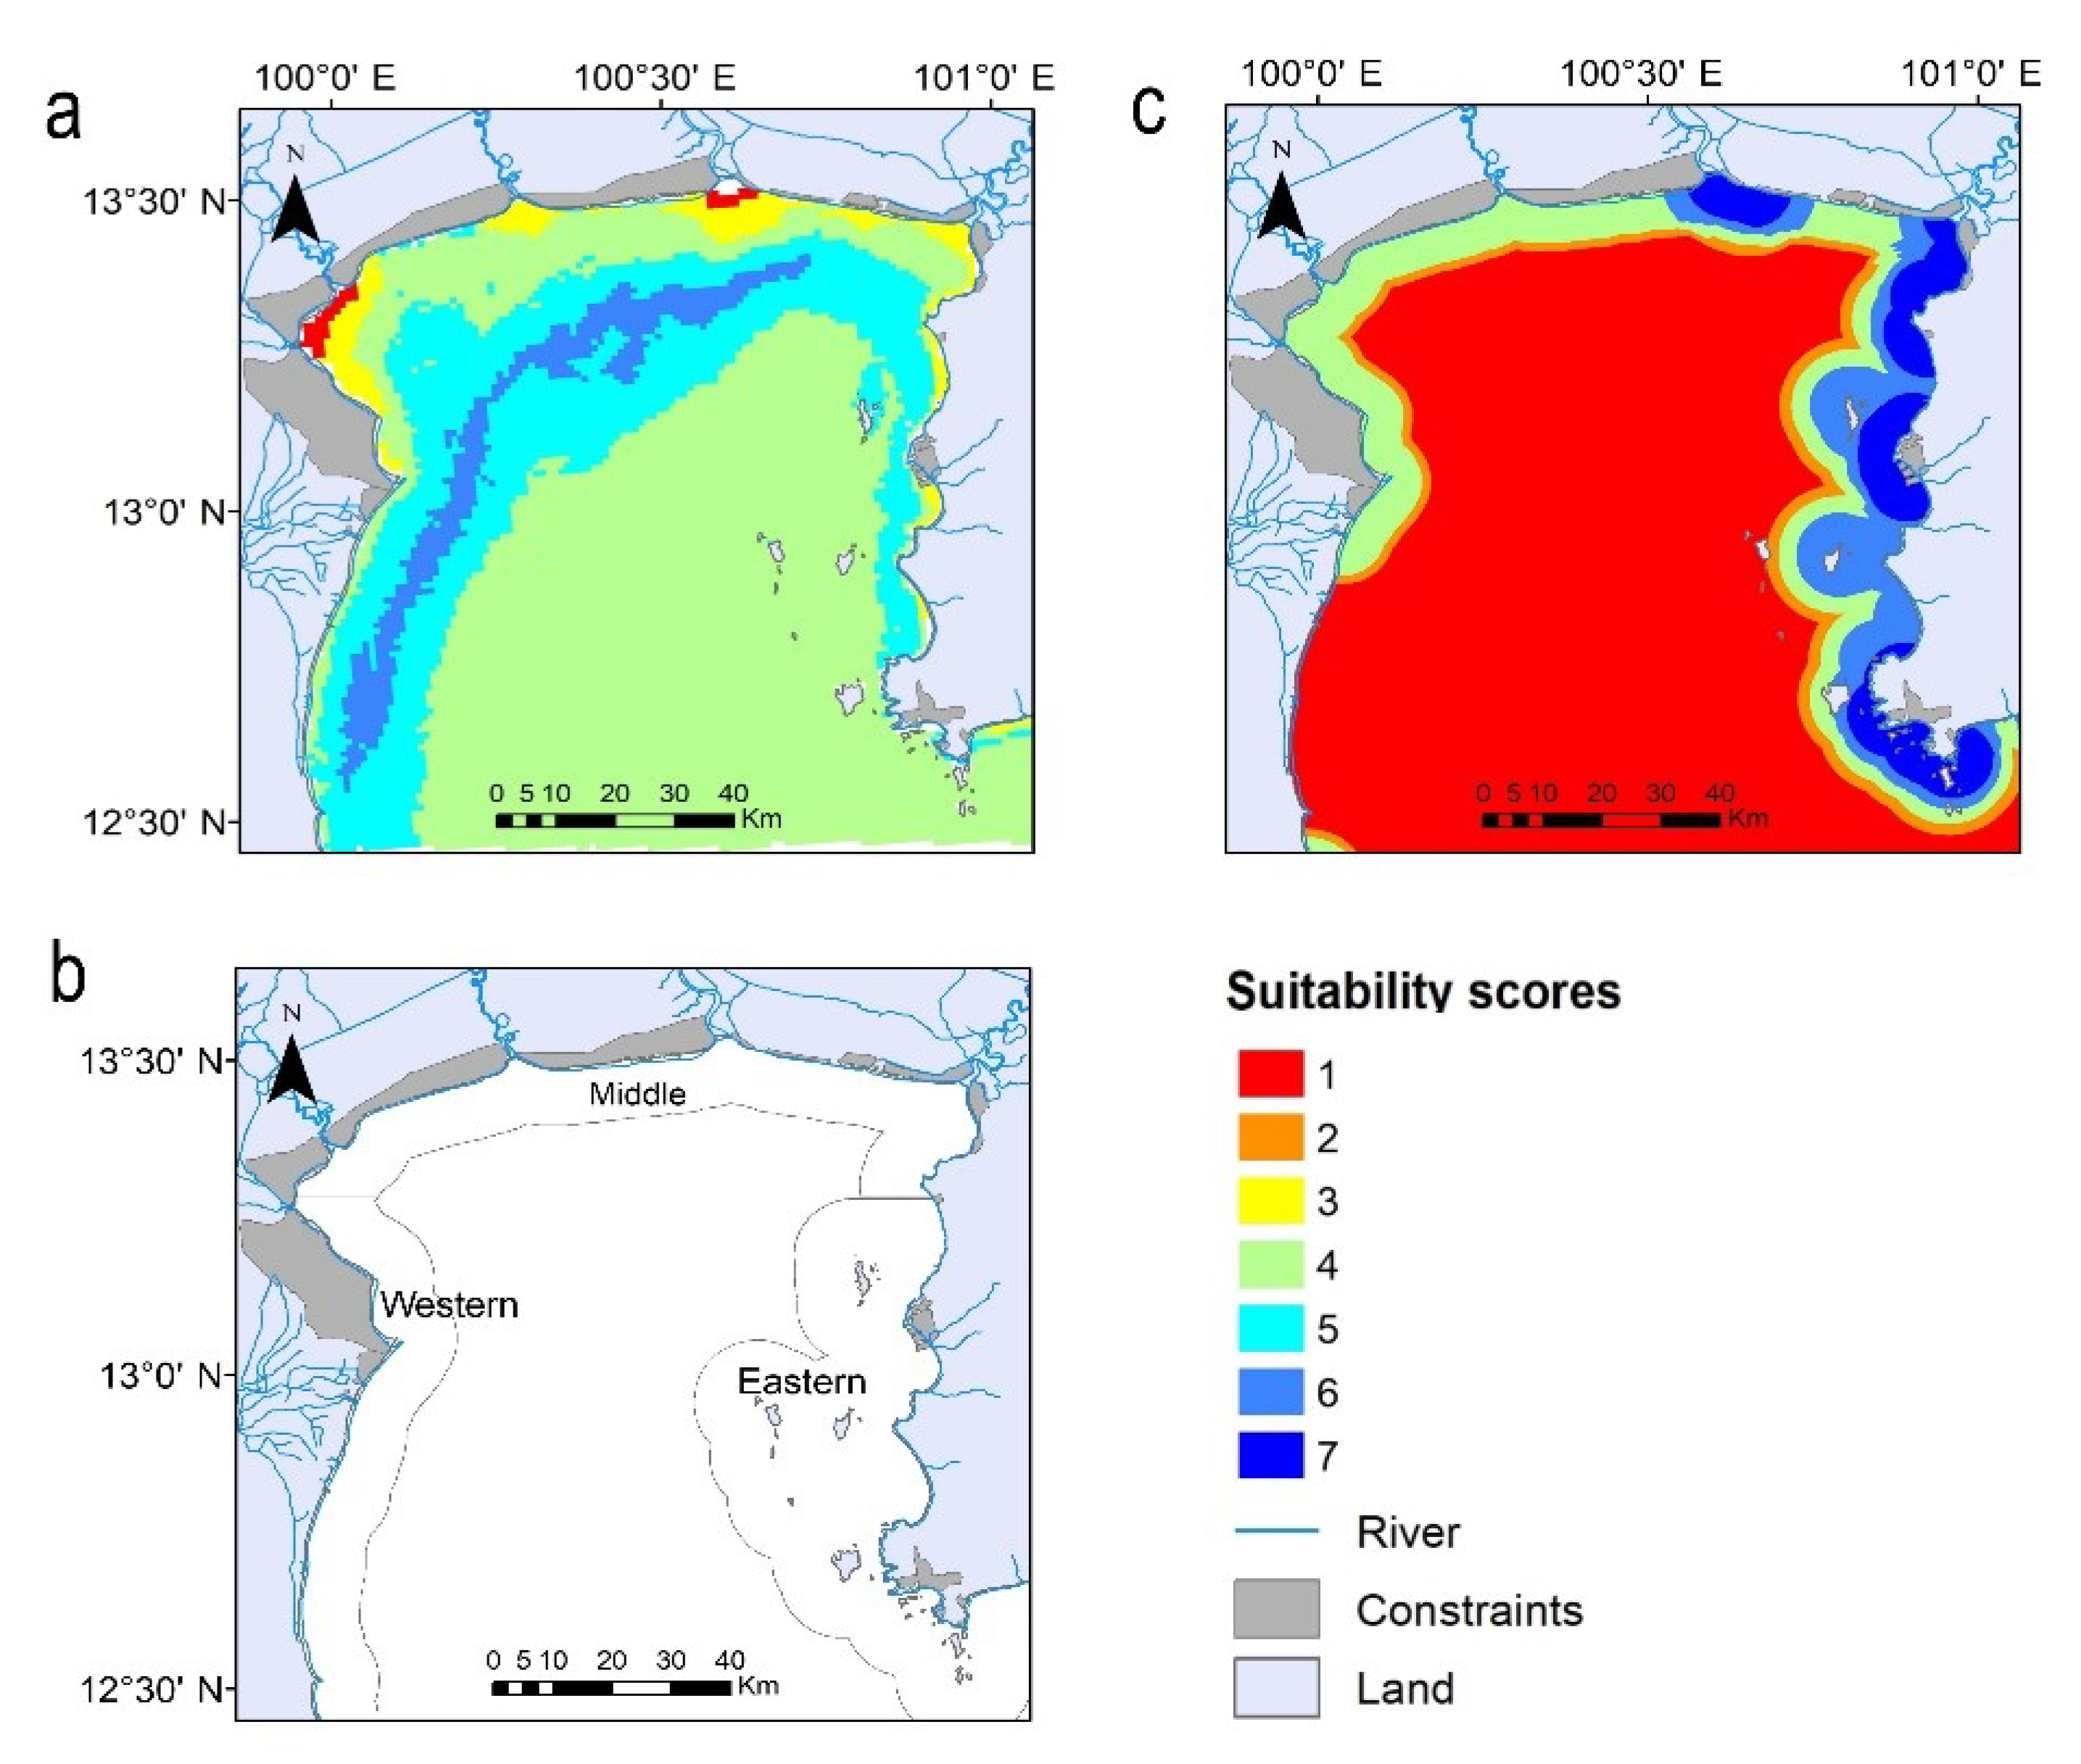
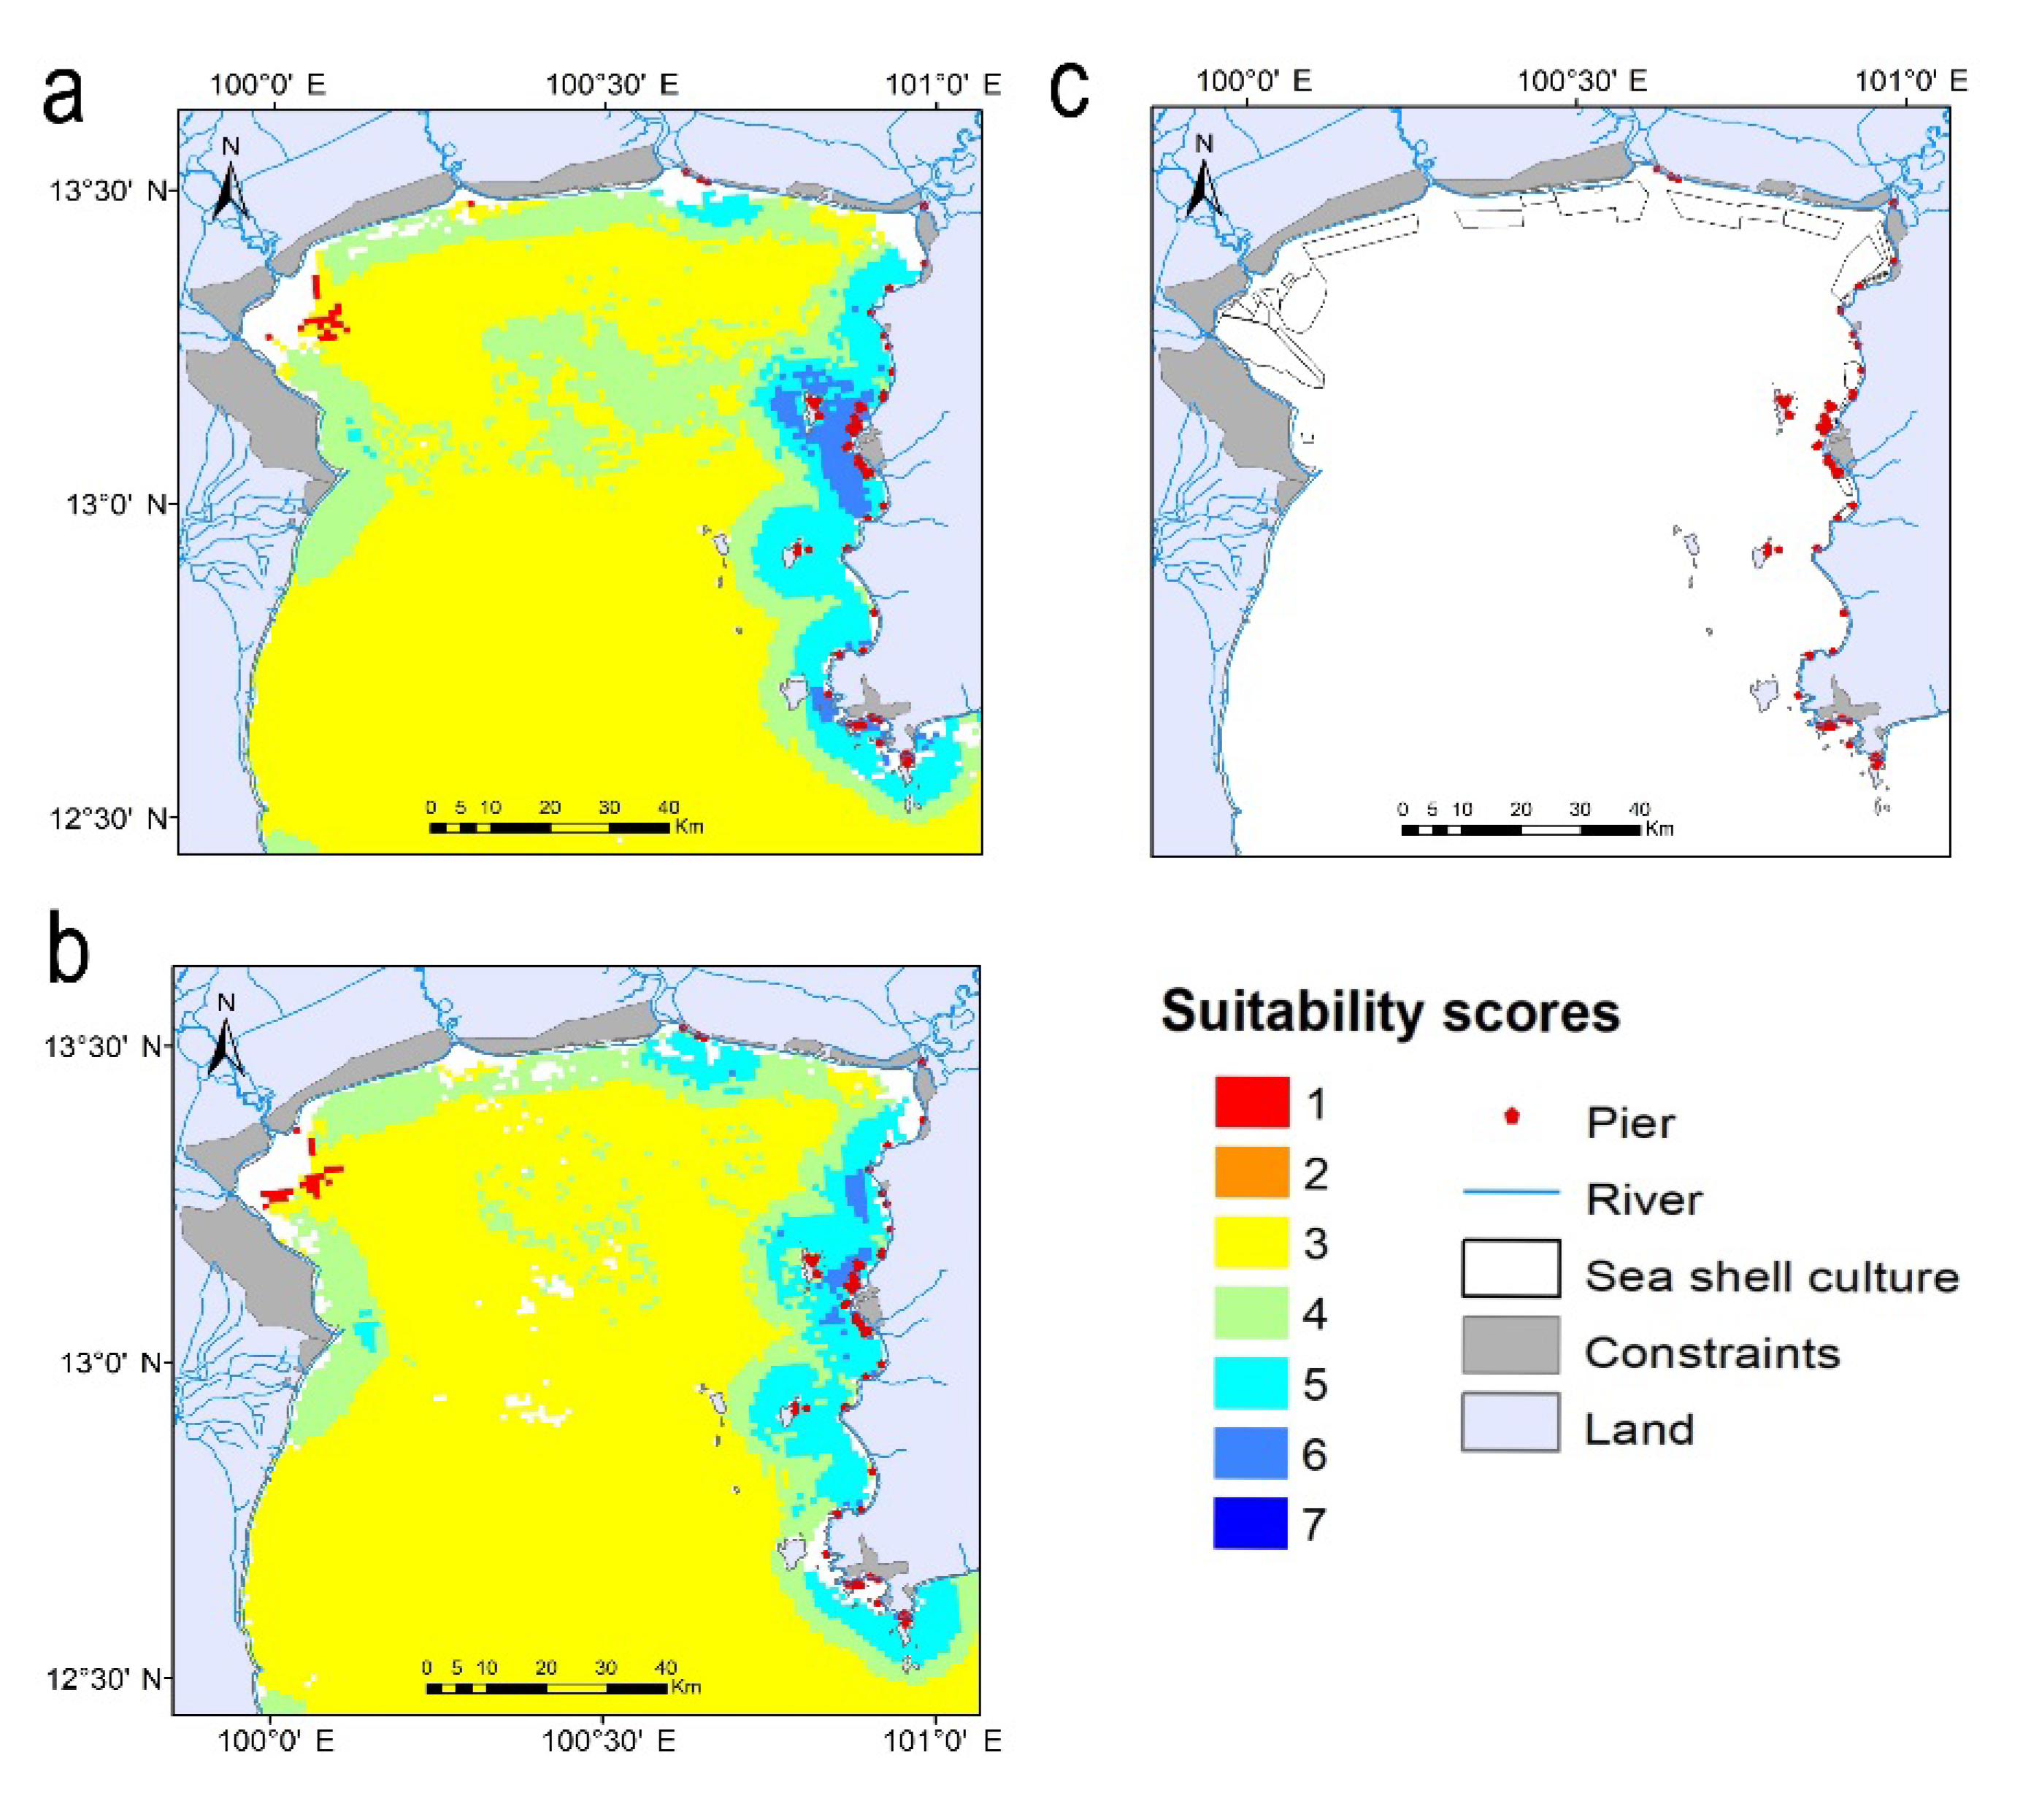
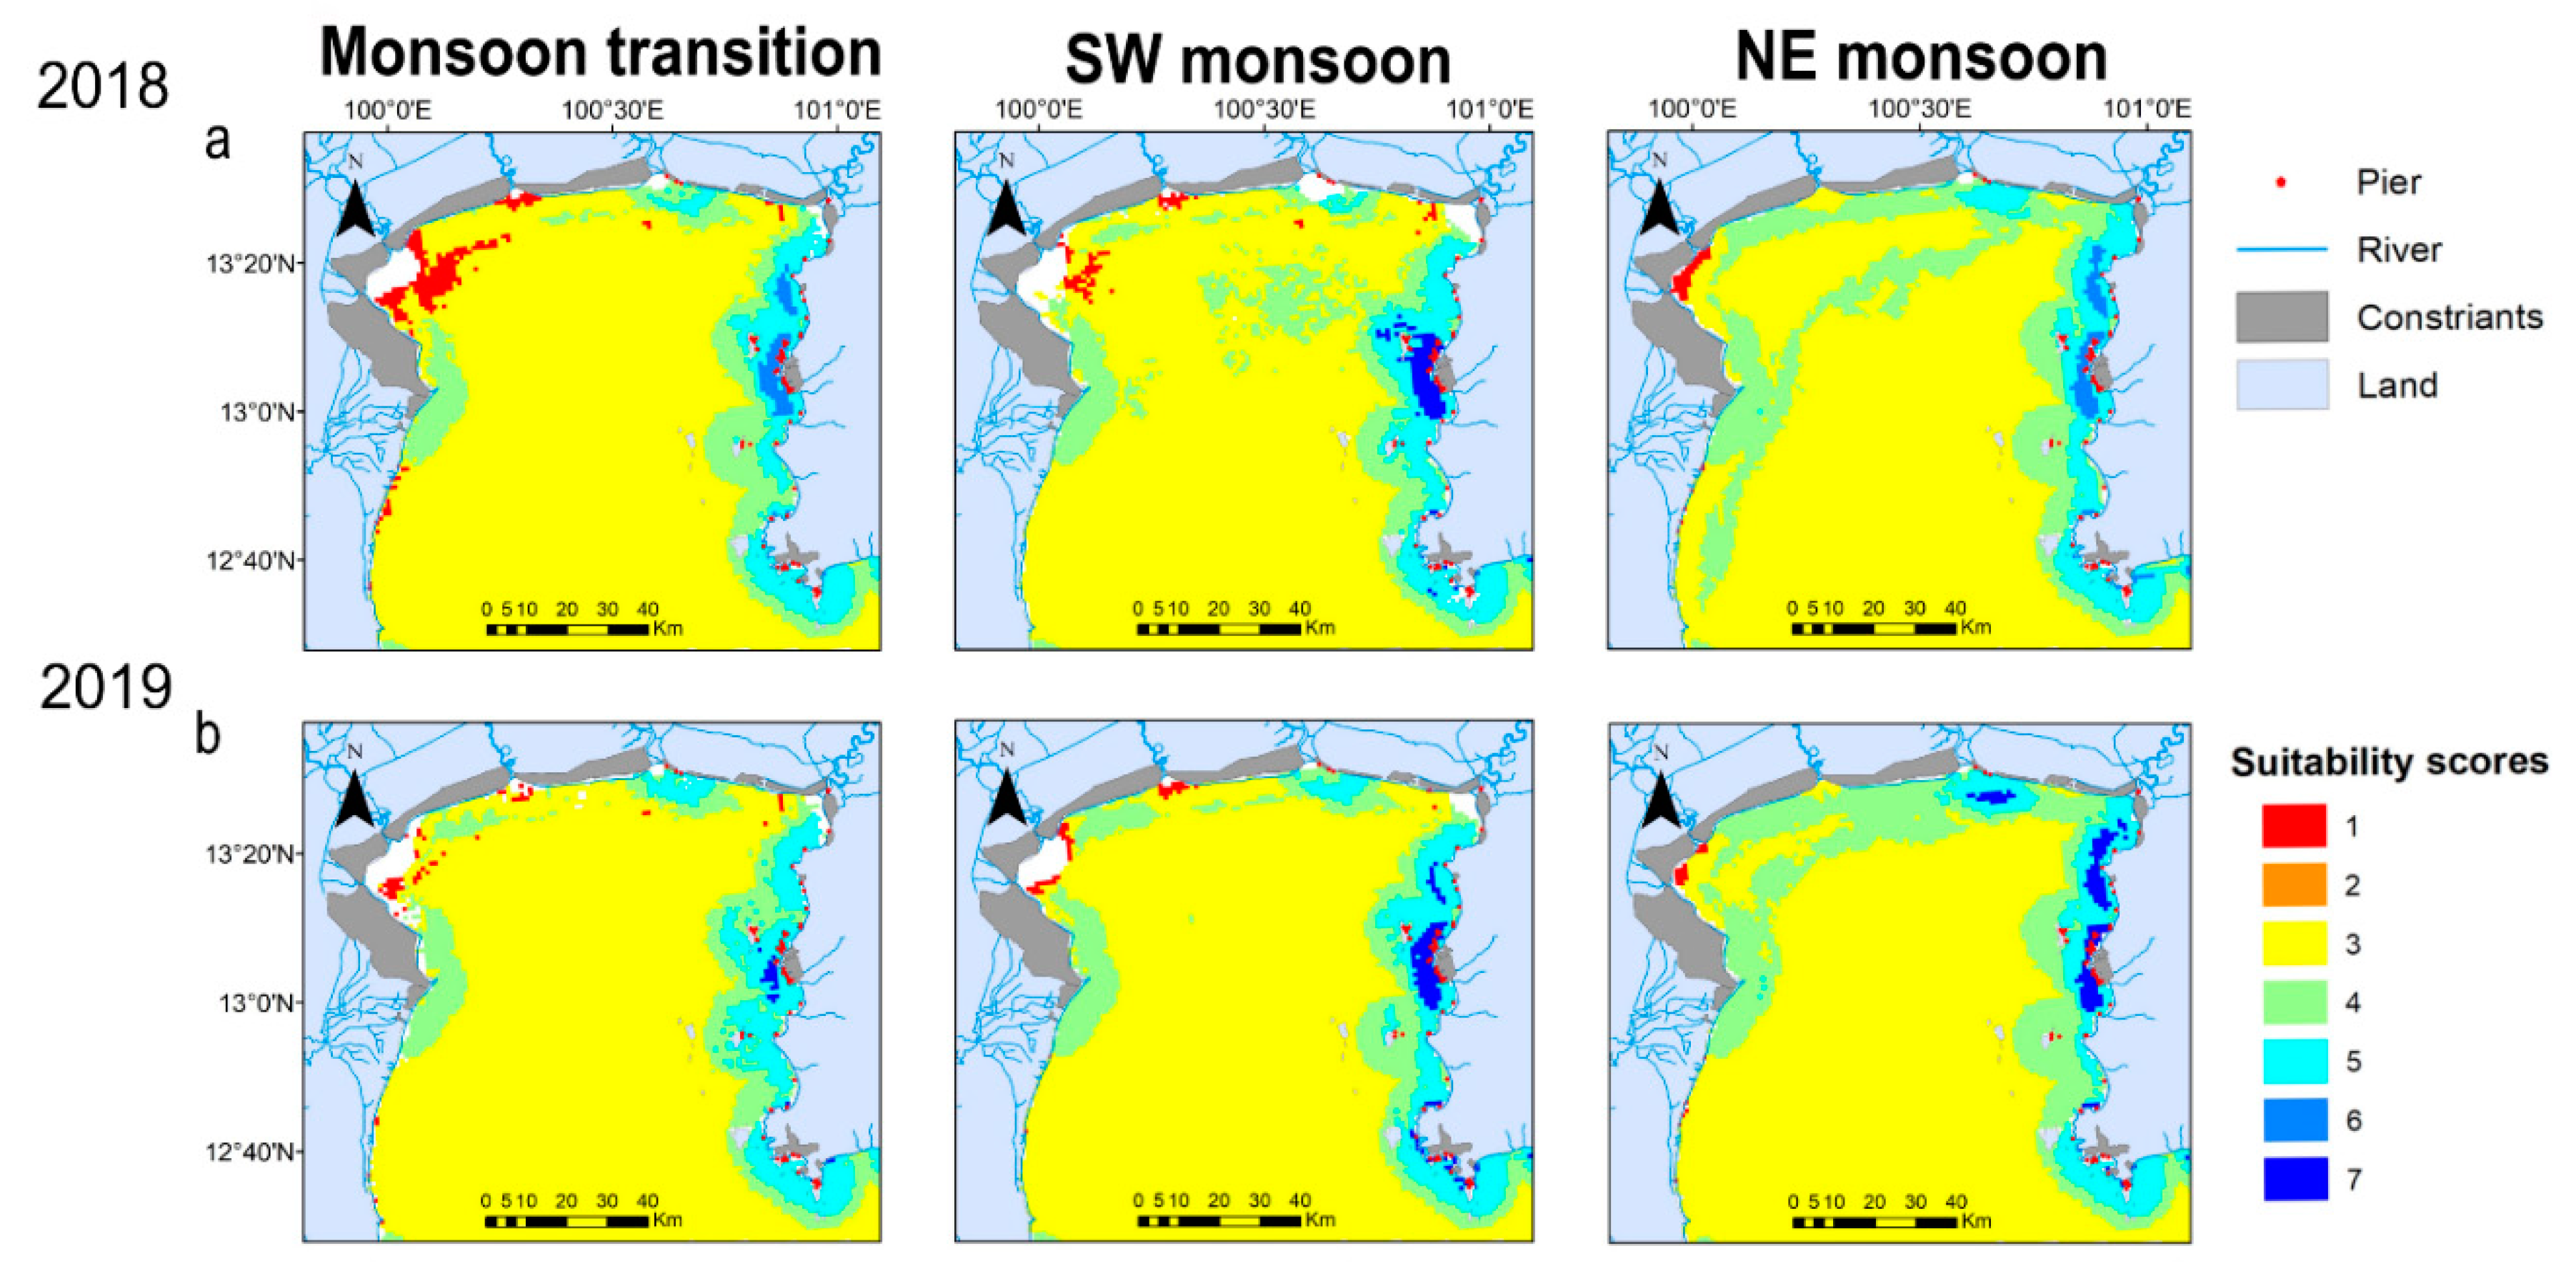
3.3. Final Seasonal SASSM Maps

The SASSM model results during 2018–2019 are shown in Figure 10. The map shows that suitable areas accrued during the SW monsoon, but these areas are not designated as aquaculture zones. The suitable areas increased in all seasons of 2018 (Figure 10a), coinciding with the two peak periods of mussel growth. More than half of the area (58%) have intermediate scores (4–5), followed by the lowest scores (1–3; 26%), and only 16% comprises the highly suitable zone for green mussel aquaculture. The suitable areas in all seasons of 2019 (Figure 10b) showed that 60% of the area have intermediate scores, 23% have the lowest scores, and only 16% is the most suitable area for green mussel farming. In this study, most of the suitable areas appeared along the eastern coasts of the InnerGoT. These results are also comparable with the present green mussel aquaculture areas in the gulf, especially Chonburi province (Eastern part) where the largest green mussel aquaculture zone in Thailand is situated. Furthermore, the Eastern part is also where a large amount of wild green mussel seeding often occurs.

3.4. Inter-Annual Variation of the Suitability Map

The rainy season is caused by the SW monsoon that starts in India, before sweeping a continual stream of high pressure, moist air from the Indian Ocean toward Thailand. The average suitability scores in cold season 2018 and 2019 were higher than those in other seasons (Figure 10). The average suitability scores in the cold season (NE monsoon) were higher than summer (Monsoon transition) scores in 2018 (Figure 10). In addition, in 2019, the average suitability scores in the cold season were higher than in summer. The mean suitability scores in cold season 2019 were the highest because the main river discharges of this region are distributed to the east which occur in all seasons. The mean suitability scores in cold season 2019 were the highest but exhibited the largest fluctuations. The seasonal changes in SST and salinity were more stable. Overall, the seasonal signals of SST and salinity showed lower values in September and increased significantly from May to June. Suitable areas for green mussel farming maintained high scores during the cold season of 2018. Because the spawning period of green mussels begins from November to February in the InnerGoT coastal area [2], the suitability level in the cold season strongly affects the growth of green mussels. Further, based on the observed seasonal changes, it can be suspected that in order to maintain stable mussel aquaculture throughout the entire year, the suitability scores in the cold season are also important.

3.5. Zoning Analysis

The comparison of suitability scores across the three zones showing the similarity of suitable areas in the middle and eastern parts with notable differences from the western part (Table 2). This is likely due to the influence of the main rivers in the region situated in the middle part. Thus, pollution levels and suspended matter concentrations are elevated in these riverine zones relative to other areas. However, the western was poorly suitable for this species, though many green mussel aquaculture fields were distributed along the coasts of the western and eastern parts. The apparent low suitability of this region might be one of the reasons explaining the low production in the western area.

4. Discussions

Combining the remote-sensing technology and GIS program in the SASSM model will improve the accuracy of the model results. Previous work has developed SASSMs for the identification of suitable locations for Japanese kelp and Japanese scallop aquaculture [18]. Now, this study designed SASSMs to identify the most suitable areas for green mussel aquaculture with a new scoring system, allowing to examine the potential impacts of environmental changes on the development of mussel aquaculture in the InnerGoT.

4.1. Effects of Changing Environment on Suitability

Air temperature and MWC and SST in the western part have significant negative correlations (r = 0.809 and 0.959, respectively, p < 0.01; Table 3), and the correlations between air temperature and rainfall and wind were also significant (r = 0.638 and 0.597, respectively, p < 0.05; Table 3). The statistics show that rainfall and wind have become influential factors in this region. In the middle part, correlations between rainfall and salinity were strong, which could explain the stability of suitability scores in the middle zone. In the Eastern part, the air temperature was related to SST. At the same time, rainfall was correlated with salinity (r = 0.901 and −0.819, respectively, p < 0.01) and suggests that seasonal patterns of environmental factors in the Eastern part influence its suitability for aquaculture. Chl-a, salinity, and temperature anomalies were also negatively correlated in the middle part of the InnerGoT (Table 3). The correlations between salinity and sustainability scores were significant, which means salinity has played a substantial role in this region. An increase in sea surface temperature is also likely to affect the growth of farmed shellfish. The effects of climate conditions on the health of shellfish are currently not quantifiable. As such, the impact of ocean acidification on calcifying marine species is expected to occur and will be detrimental to the marine shellfish aquaculture industries [31].
Moreover, some studies examined the potential effects of global climate change on shellfish growth by considering an increase in water temperature of 1 °C and 4 °C above the mean annual seawater temperature [32]. There are abundant examples of emerging or at least newly discovered, diseases in the marine or freshwater environment [33]. However, the evidence that climate change is a major driver behind the emergence of diseases is thin [32]. [34] demonstrated a link between increasing sea temperature and the spread of Perkinsus marinus in the eastern oyster (Crassostrea virginica), although it is difficult to conclusively demonstrate causality in such observational studies.

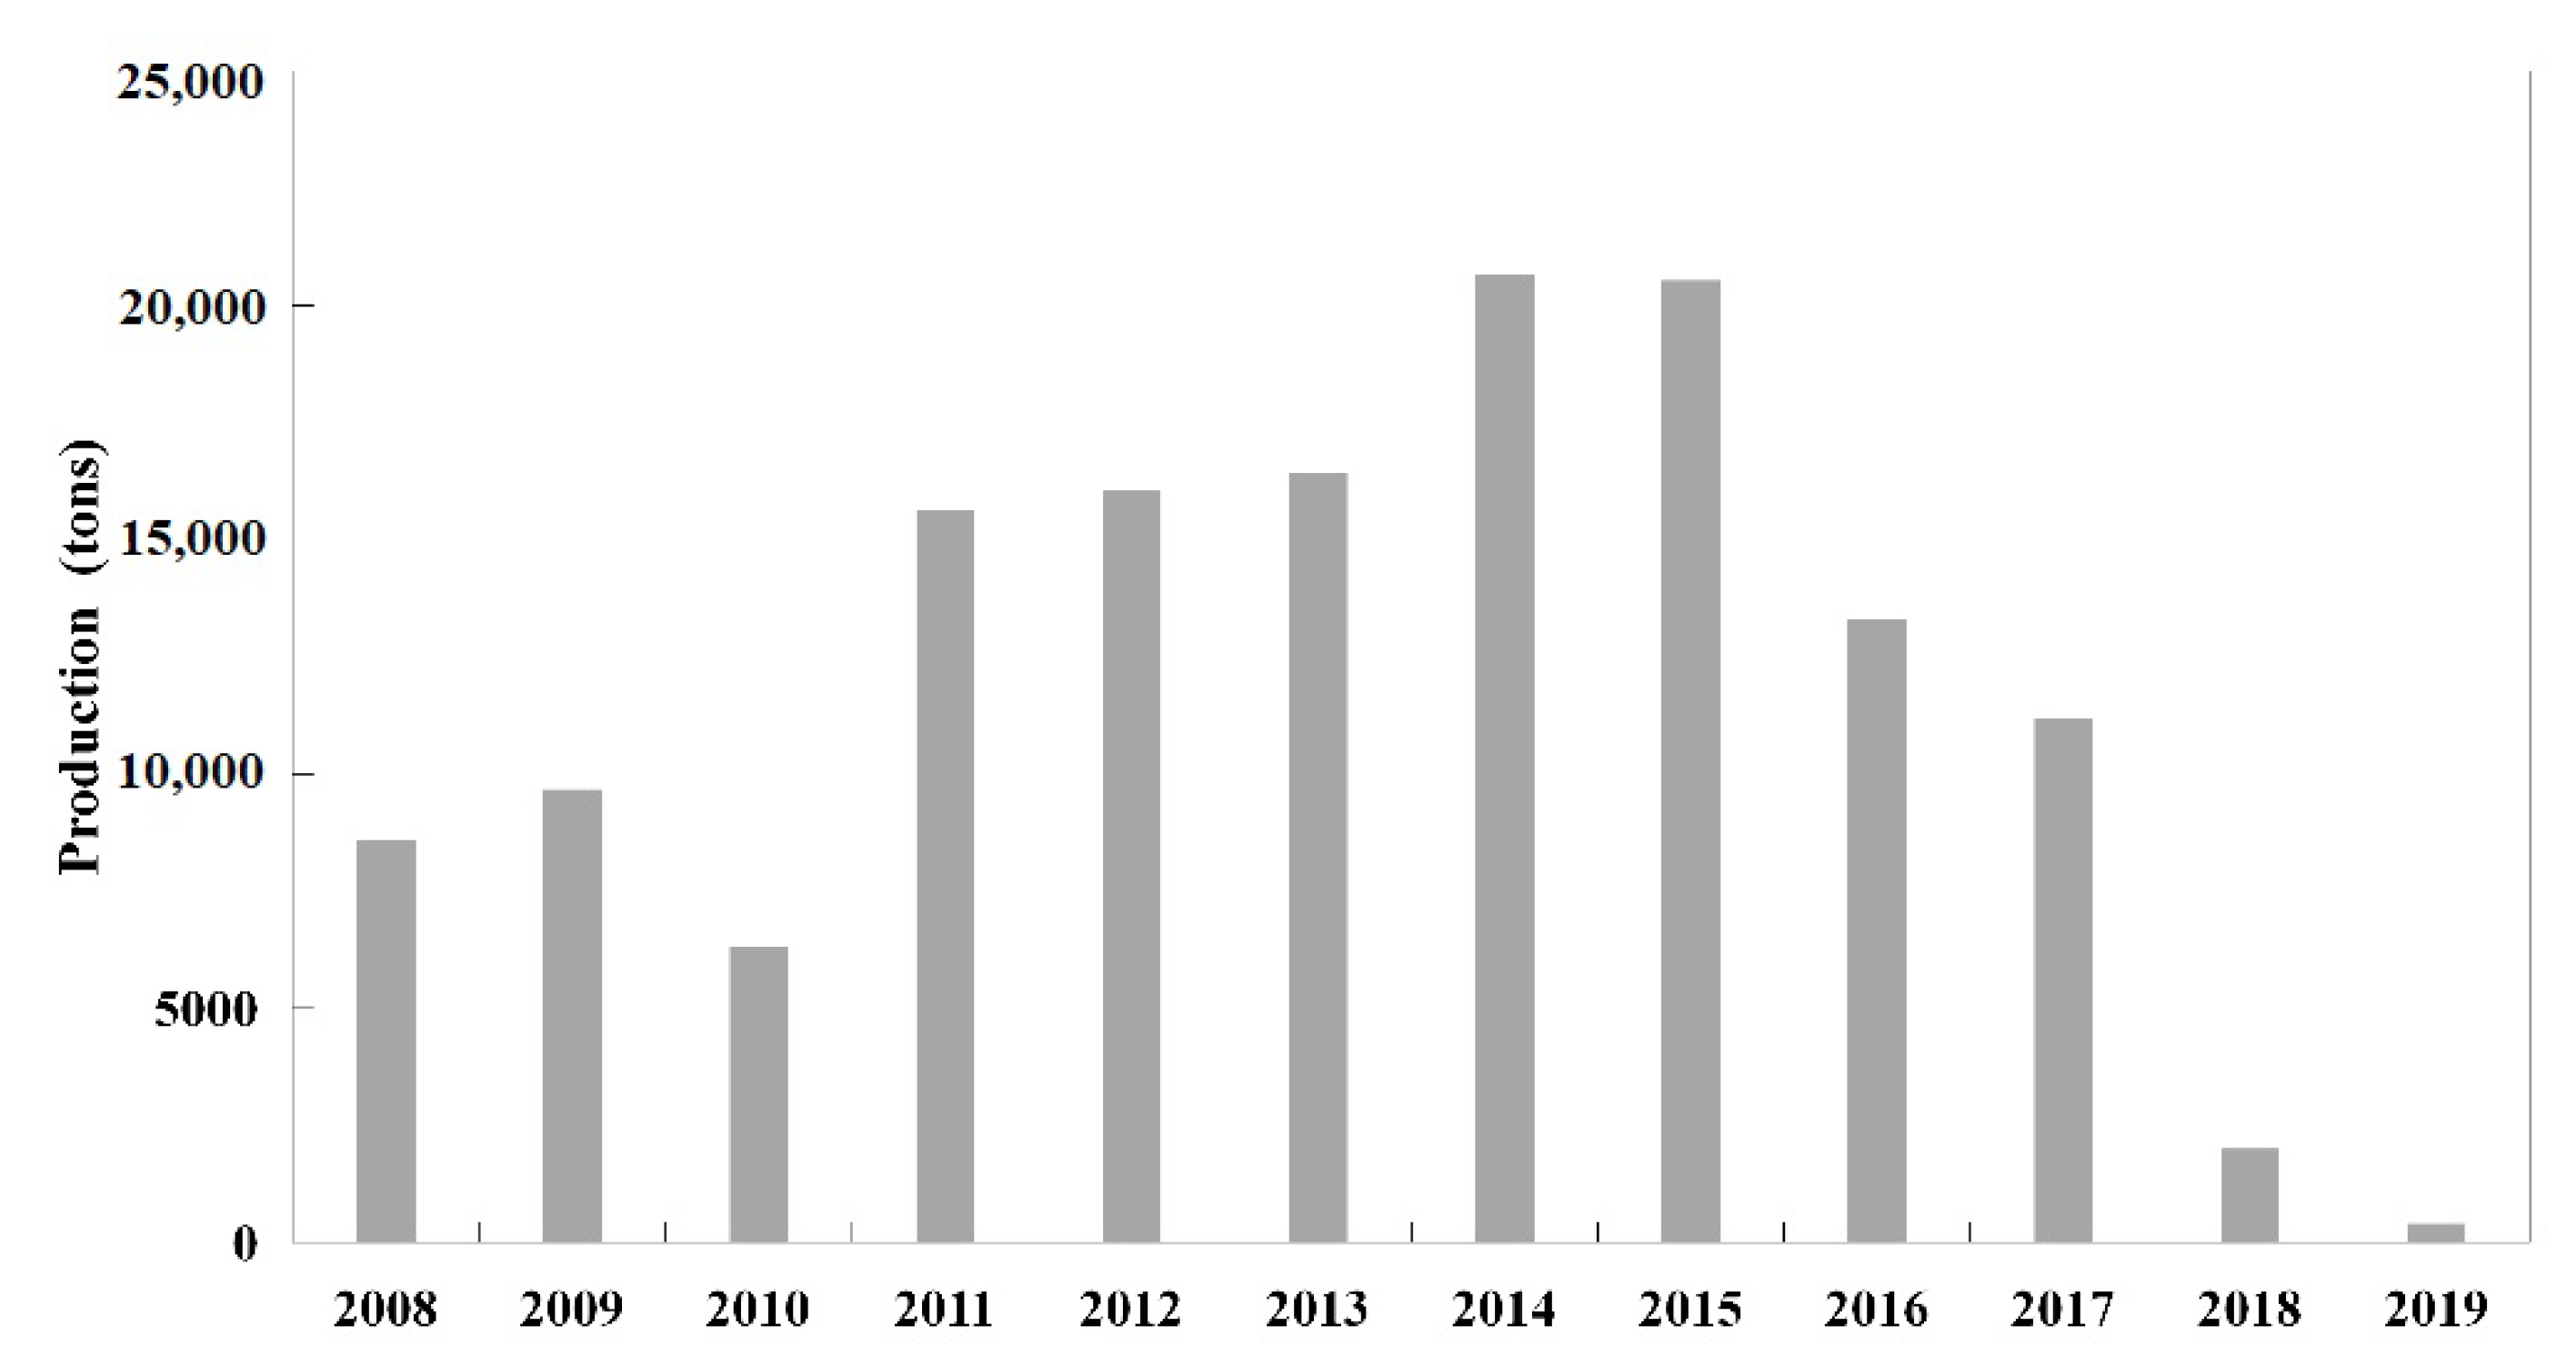
4.2. Suitable Area Comparison between 2018 and 2019

During 2018 and 2019, monthly averages of environmental factors and suitable scores were generated based on different seasonal conditions. In 2018, higher freshwater discharge than average was observed, thus causing more flooding and river discharge, which in turn resulted in high loading of nutrients and freshwater into the sea. However, in 2019, the conditions were characterized by lower freshwater discharge than average, thus with less flooding and nutrient loading into the sea. The average Chl-a in the monsoon transition and SW monsoon periods in 2019 was also less than that in 2018 (75 µg/L and 93 µg/L, respectively; Figure 6 and Figure 7c). High Chl-a concentration was shown to support the growth of the green mussel through elevated food intake [35].
Average SSTs were low during the SW monsoon 2018 of (28 °C) (Figure 6a), but high for the same season of 2019 (34 °C) (Figure 7a). The respective suitable temperature and salinity for green mussel growth are 25–32 °C and 10–32 ppt [22]. [22] further reported that the suitable salinity of P. viridis is around 30 ppt but should not fall below 20 ppt. There is no variation in monthly average MWCs, but the lowest value in all seasons occurred in 2019 (Figure 7d). [36] found that M. californianus has the highest growth and clearance rates under moderate current speeds (0.1–0.12 m/s). The average suitability scores in the NE monsoon of 2019 (score 6) were higher than in the NE monsoon of 2018. Most of the suitable aquaculture area is located on the eastern part of the InnerGoT. The western part, however, does not currently have aquaculture areas as stipulated by the law from the Department of Fisheries. Thus, the suitable site selection area for the green mussel was always situated on the eastern part (Figure 10). The final model showed that the 2018 rainy season was the most suitable in Sattahip or Ao Sriracha (Figure 10a). However, focusing on all the areas, the winters of 2018 and 2019 highlighted higher suitability scores (score 6) in the western part than the rest of the zones (Figure 10). This is due to the generally colder temperature and slower water currents in the NE monsoon (Figure 6d and Figure 7d). All seasons in the eastern part have the lowest scores, which means these are less suitable areas for green mussel aquaculture (Figure 10). Although the western part does not have shell aquaculture (Figure 10), the area has moderate suitability scores (4–5), suggesting its modest potential for aquaculture. The final map shows the worst scores in the 2018 monsoon transition and SW monsoon in the area near the Maeklong river mouth (Figure 10).

5. Conclusions

This study utilized input data from the simulation model and satellite platforms to develop the SASSM that provided insightful information for green mussel aquaculture in the InnerGoT. Our results suggest that a GIS-based model is an effective tool for identifying the most suitable areas for green mussel farming. The results disclose that the suitability scores of mussel aquaculture areas were high and low during the NE monsoon and during the monsoon transition, respectively. Based on the spatial distribution maps, the coastal waters in the middle and eastern parts of the gulf showed the highest potential for mussel aquaculture. However, the suitability scores in the middle part were more sensitive to environmental changes and disturbances, whereas the eastern part was more stable. In the NE monsoon of 2018, our findings suggest that flooding events impact the thermal and flow conditions in the coastal waters of the InnerGoT. In particular, when the river discharge was strong and the water temperature was low in the SW monsoon of 2018, the suitable areas in the monsoon transition were more abundant than in 2019. Taking into account the short-term environmental impacts on the green mussel, future regional planning for economic viability and the best environmental condition for green mussel aquaculture will benefit from the climate change forecasts but rather does not appear to be detrimental to the aquaculture of green mussels.

Author Contributions

H.K. analyzed the data and wrote the paper; Y.L. provided ideas, models, guidance, and revised the paper; T.P. provided field survey and hydrodynamic data and guidance and revised the paper; I.D.A. provided comments and revisions to the earlier version of the manuscript; Z.Y. provided GIS modeling; S.-I.S. and Y.T. provided advice. All authors have read and agreed to the published version of the manuscript.

Funding

This research received no external funding.

Acknowledgments

This study is supported by the National Natural Science Foundation of China (No. 41976210), Shandong Key R&D Program (No. 2019GHY112014), and the “Ocean University of China Scholarship” in the knowledge Cluster Program from 2018. Hydrodynamic model data were derived from an on-going research project between the Hydro-Informatics Institute and Faculty of Fisheries, Kasetsart University, Thailand.

Conflicts of Interest

The authors declare no conflict of interest.

References

  1. Rajagopal, S.; Venugopalan, V.P.; van der Velde, G.; Jenner, H.A. Greening of the coasts: A review of the perna viridis success story. Aquat. Ecol. 2006, 40, 273–297. [Google Scholar] [CrossRef]
  2. Wanrigo, V. Satisfaction of Farmers in Chonburi Province on Practice Adhering to Good Aquaculture Practice for Green Mussel Farm. Master’s Thesis, Sukhothai Thammathirat Open University, Nonthaburi, Thailand, 2012. (In Thai). [Google Scholar]
  3. National Introduced Marine Pest Information System (NIMPIS). Asian Green Mussel, Perna viridis (Linnaeus, 1785); Natural Heritage Trust: Melbourne, Australia, 2002. [Google Scholar]
  4. Chalermwat, K.; Szuster, B.W.; Flaherty, M. Shellfish aquaculture in Thailand. Aquac. Econ. Manag. 2003, 7, 249–261. [Google Scholar] [CrossRef]
  5. Noor, N.M.; Nursyam, H.; Widodo, M.S.; Risjani, Y. Biological aspects of green mussels Perna viridis cultivated on raft culture in pasaran coastal waters, indonesia. AACL Bioflux 2019, 12, 448–456. [Google Scholar]
  6. Food and Agriculture Organization. Topics Fact Sheets; (FAO) Fisheries and Aquaculture Department: Rome, Italy, 2020. [Google Scholar]
  7. Stadmark, J.; Conley, D.J. Mussel farming as a nutrient reduction measure in the baltic sea: Consideration of nutrient biogeochemical cycles. Mar. Pollut. Bull. 2011, 62, 1385–1388. [Google Scholar] [CrossRef]
  8. Srisunont, C.; Babel, S. Estimating the carrying capacity of green mussel cultivation by using net nutrient removal model. Mar. Pollut. Bull. 2016, 112, 235–243. [Google Scholar] [CrossRef]
  9. Tantanasarit, C.; Babel, S.; Englande, A.J.; Meksumpun, S. Influence of size and density on filtration rate modeling and nutrient uptake by green mussel (Perna viridis). Mar. Pollut. Bull. 2013, 68, 38–45. [Google Scholar] [CrossRef]
  10. Gao, Q.; Xu, W.; Xu, X.; Liu, S.G.; Cheung; Shin, P.K.S. Seasonal changes in C, N and P budgets of green-lipped mussels Perna viridis and removal of nutrients from fish farming in Hong Kong. Mar. Ecol. Prog. Ser. 2008, 353, 137–146. [Google Scholar] [CrossRef] [Green Version]
  11. Riisgård, H.U.L.; Bøttiger, L.; Pleissner, D. Effect of Salinity on Growth of Mussels, Mytilus edulis, with Special Reference to Great Belt (Denmark). Open J. Mar. Sci. 2012, 2, 167–176. [Google Scholar] [CrossRef] [Green Version]
  12. Fang, J.K.H.; Wu, R.S.S.; Chan, A.K.Y.; Yip, C.K.M.; Shin, P.K.S. Influences of ammonia-nitrogen and dissolved oxygen on lysosomal integrity in green-lipped mussel Perna viridis: Laboratory evaluation and field validation in Victoria Harbour, Hong Kong. Mar. Pollut. Bull. 2008, 56, 2052–2058. [Google Scholar] [CrossRef]
  13. Soon, T.K.; Ransangan, J. Feasibility of green mussel, Perna viridis farming in Marudu Bay, Malaysia. Aquac. Rep. 2016, 4, 130–135. [Google Scholar] [CrossRef] [Green Version]
  14. Marks, D. Climate change and thailand: Impact and response. Contemp. Southeast Asia J. Int. Strategic Aff. 2011, 33, 229–258. [Google Scholar] [CrossRef]
  15. Buranapratheprat, A.; Niemann Olaf, K.; Yanagi, T.; Matsumura, S.; Sojisuporn, P. Circulation in the Upper Gulf of Thailand Investigated Using a Three-Dimensional Hydrodynamic Model. Burapha Sci. J. 2009, 1, 99–113. [Google Scholar]
  16. Liu, Y.; Saitoh, S.-I.; Radiarta, I.N.; Igarashi, H.; Hirawake, A.T. Spatiotemporal variations in suitable areas for Japanese scallop aquaculture in the Dalian coastal area from 2003 to 2012. Aquaculture 2014, 422–423, 172–183. [Google Scholar] [CrossRef] [Green Version]
  17. Liu, Y.; Saitoh, S.-I.; Radiarta, I.N.; Isada, T.; Hirawake, T.; Mizuta., H.; Yasui, H. Improvement of an aquaculture site-selection model for Japanese kelp (Saccharina japonica) in southern Hokkaido, Japan: An application for the impacts of climate events. ICES J. Mar. Sci. 2013, 70, 1460–1470. [Google Scholar] [CrossRef] [Green Version]
  18. Liu, Y.; Saitoh, S.-I.; Igarashi, H.; Hirawake, T. The regional impacts of climate change on coastal environments and the aquaculture of Japanese scallops in northeast Asia: Case studies from Dalian, China, and Funka Bay, Japan. Int. J. Remote Sens. 2014, 35, 4422–4440. [Google Scholar] [CrossRef]
  19. Liu, Y.; Saitoh, S.-I.; Ihara, Y.; Nakada, S.; Kanamori, M.; Zhang, X.; Baba, K.; Ishikawa, Y.; Hirawake, T. Development of a three-dimensional growth prediction model for the Japanese scallop in Funka Bay, japan, using OGCM and MODIS. ICES J. Mar. Sci. 2015, 72, 2684–2699. [Google Scholar] [CrossRef] [Green Version]
  20. Saitoh, S.-I.; Mugo, R.; Radiarta, I.N.; Asaga, S.; Takahashi, F.; Hirawake, T.; Ishikawa, Y.; Awaji, T.; In, T.; Shima, A.S. Some operational uses of satellite remote sensing and marine GIS for sustainable fisheries and aquaculture. ICES J. Mar. Sci. 2011, 68, 687–695. [Google Scholar] [CrossRef] [Green Version]
  21. Radiarta, I.N.; Saitoh, S.-I.; Miyazono, A. GIS-based multi-criteria evaluation models for identifying suitable sites for Japanese scallop (Mizuhopecten yessoensis) aquaculture in Funka Bay, southwestern Hokkaido, Japan. Aquaculture 2008, 284, 127–135. [Google Scholar] [CrossRef]
  22. Teeramaethee, J. Culture of Green Mussel (Perna viridis Linnaeus) Hanging under Floating Cage Frame, Raft Foam and Long-Lines Methods. Master’s Thesis, Kasetsart University, Bangkok, Thailand, 1998. [Google Scholar]
  23. Department of Fisheries, M.o.A.a.C. Green Mussel Farming, Fishery Technology Transfer and Development. Technical Paper. 2007, 9. [Google Scholar]
  24. Phromkot, P.; Buranapratheprat, A.; Morimoto, A.; Gunbua, V.; Jintasaranee, P. The Application of a Box Model to Investigate the Behavior of Dissolved Inorganic Nutrients in the Inner Gulf of Thailand. Burapha Sci. J. 2019, 24, 1085–1097. [Google Scholar]
  25. Deltares. Simulation of Multi-Dimensional Hydrodynamic Flows and Transport Phenomena, including Sediments; Delft3D-FLOW-User Manual Release 3.14; Deltares: Delft, The Netherland, 2011. [Google Scholar]
  26. Hersbach, H.; Bell, B.; Berrisford, P. The ERA5 global reanalysis. Q. J. R. Meteorol. Soc. 2020, 146, 1999–2019. [Google Scholar] [CrossRef]
  27. Sudheer, J.; Ravichandran, M.; Praveen Kumar, B.; Raju Jampana, V.; Han, W. Ocean atmosphere thermal decoupling in the eastern equatorial Indian ocean. Clim. Dyn. 2016, 49, 575–594. [Google Scholar]
  28. Sallih, K. Mussel Farming in the State of Sarawak, Malaysia: A Feasibility Study; United Nations University: Reykjavik, Iceland, 2005; pp. 5–44. [Google Scholar]
  29. Malczewski, J. On the use of weighted linear combination method in GIS: Common and best practice approach. Trans. GIS 2000, 4, 5–22. [Google Scholar] [CrossRef]
  30. Department of Fisheries, Ministry of Agriculture and Cooperatives. Control Aquaculture Area Map, Types of Aquaculture Sea Shells. 2020. Available online: https://www.arcgis.com/apps/webappviewer/index.html?id=a7d3acc7f31c404bb33c1095790ae4f1 (accessed on 16 August 2020).
  31. Cooley, S.R.; Doney, S.C. Anticipating ocean acidification’s economic consequences for commercial fisheries. Environ. Res. Lett. 2009, 4, 1–8. [Google Scholar] [CrossRef]
  32. Lafferty, K.D. The ecology of climate change and infectious diseases. Ecology 2009, 90, 888–900. [Google Scholar] [CrossRef]
  33. Lafferty, K.D.; Porter, J.W.; Ford, S.E. Are diseases increasing in the ocean? Annu. Rev. Ecol. Evol. Syst. 2004, 35, 31–54. [Google Scholar] [CrossRef] [Green Version]
  34. Cook, T.; Folli, M.; Klinck, J.; Ford, S.; Miller, J. The relationship between increasing sea-surface temperature and the northward spread of Perkinsus marinus (Dermo) disease epizootics in oysters. Estuar. Coast. Shelf Sci. 1998, 46, 587–597. [Google Scholar] [CrossRef]
  35. Rajagopal, S.; Venugopalan, V.P.; Nair, K.V.K.; van der Velde, G.; Jenner, H.A.; Hartog, C. Reproduction, growth rate and culture potential of the green mussel, Perna viridis (L.) on Edaiyur backwaters, east coast of india. Aquaculture 1998, 162, 187–202. [Google Scholar] [CrossRef]
  36. Blanchette, C.A.; Helmuth, B.; Gaines, S.D. Spatial pattern of growth in the mussel, mytilus californianus, across a major oceanographic and biogeographic boundary at Point Conception, California, USA. J. Exp. Mar. Biol. Ecol. 2007, 340, 126–148. [Google Scholar] [CrossRef]
Figure 1. The study area showing bathymetric contour, the sampling locations, major rivers, locations of the pier (a), and Ao Sriracha in the Inner-Gulf of Thailand (b).
Sustainability 12 10643 g001
Figure 2. Chao Phraya measured river discharge from January 2018–December 2019.
Sustainability 12 10643 g002
Figure 3. Annual productions of the green mussel in Ao Sriracha between 2008 and 2019.
Sustainability 12 10643 g003
Figure 4. Correlation value between observed and modeled data. (a) Water level, (b) salinity, and (c) temperature.
Sustainability 12 10643 g004
Figure 5. Schematic diagram of the suitable aquaculture site-selection model (SASSM) designed for green mussel farming in the Gulf of Thailand.
Sustainability 12 10643 g005
Figure 6. Spatial distribution of the variability in the monthly average of (a) sea surface temperature, (b) salinity, (c) chlorophyll-a (µg/L), and (d) maximum water current (m/s) in 2018. SW: Southwest; NE: Northeast; SST: sea surface temperature; MWC: maximum water current.
Sustainability 12 10643 g006
Figure 7. Spatial distribution of the variability in the monthly average of (a) sea surface temperature, (b) salinity, (c) chlorophyll-a (µg/L), and (d) maximum water current (m/s) in 2019.
Sustainability 12 10643 g007
Figure 8. (a) Suitability maps for sub-models and the final model of green mussel aquaculture in InnerGoT using the environmental model for January 2018, (b) constraint model with three regions (western, middle, and eastern), and (c) social infrastructure model.
Sustainability 12 10643 g008
Figure 9. Final annual mean SASSM maps in (a) 2018, (b) 2019, and (c) map of controlled aquaculture area types of seashell culture (organized by the Department of Fisheries, Ministry of Agriculture and Cooperatives).
Sustainability 12 10643 g009
Figure 10. Final seasonal mean suitability maps for green mussel aquaculture in the InnerGoT from (a) 2018 and (b) 2019.
Sustainability 12 10643 g010
Table 1. Suitability categories of aquaculture area for green mussel farming based on ranges of environmental factors.
Rating Point Salinity
(ppt)
Temperature
(°C)
Chl-a
(ug/L)
Water Current
(m/s)
Depth
(m)
728–3025–272.0–3.00.1–0.12>8.0
626–28
30–32
23–25
27–29
1.8–2.0
3.0–3.5
0.12–0.137.0–8.0
524–26
32–34
21–23
29–31
1.6–1.8
3.5–4.0
0.13–0.146.0–7.0
422–24
34–36
19–21
31–33
1.4–1.6
4.0–4.5
0.14–0.155.0–6.0
320–22
36–38
17–19
33–35
1.2–1.4
4.5–5.0
0.15–0.164.0–5.0
218–20
38–40
15–17
35–37
1.0–1.2
5.0–5.5
0.16–0.172.0–4.0
116–18
40–42
13–15
37–39
0.0–1.0
5.5–100
0.17–1000–2.0
Weighted value0.250.250.20.150.15
Table 2. Different suitability levels (expressed as a percentage of the total potential area) for green mussels in 2018 (incorporating flooding events) and 2019 (dry events) in the InnerGoT.
YearSuitability Scores (%)
1234567
Western
Summer 20180165232000
Summer 20190225325000
Rainy season 20180533116000
Rainy season 20190115039000
Cold season 20180392833000
Cold season 201903135151900
Middle
Summer 20180271856000
Summer 20190225325000
Rainy season 2018021103621120
Rainy season 201901212551830
Cold season 201805471621110
Cold season 20190354615400
Eastern
Summer 20180073035280
Summer 20190053138260
Rainy season 20180053533280
Rainy season 20190052931360
Cold season 20180043829290
Cold season 201906362817140
Table 3. Pearson’s correlation coefficients among environmental factors for the different parts in the InnerGoT coastal area during 2018–2019.
Air TempRainfallWindMWCSSTSalinityChl-a
Western
Air temperature1
Rainfall0.638 *1
Wind0.597 *0.4581
MC0.809 **0.579 *0.666 *1
SST0.959 **0.625 *0.5480.666 *1
Salinity−0.43−0.616 *−0.213−0.623 *−0.3591
Chl-a0.1570.1730.0790.450.101−0.702 *1
Middle
Air temperature1
Rainfall0.0241
Wind−0.165−0.0441
MC0.4080.726 **0.0551
SST0.898 **0.291−0.280.5591
Salinity−0.492−0.726 **0.304−0.752 **−0.744 **1
Chl-a0.0560.2230.3110.2430.272−0.0821
Eastern
Air temperature1
Rainfall0.3911
Wind0.3940.4711
MC0.3560.4540.0071
SST0.901 **0.4230.4130.4561
Salinity−0.39−0.819 **−0.562−0.475−0.3111
Chl-a0.4390.3890.653 *0.3430.5−0.667 *1
* Correlation is significant at the 0.05 level; ** Correlation is significant at the 0.01 level.
Publisher’s Note: MDPI stays neutral with regard to jurisdictional claims in published maps and institutional affiliations.

