Decision-Making in the Transport Sector: A Sustainable Evaluation Method for Road Infrastructure

1
Department of Civil, Construction and Environmental Engineering, University of Naples “Federico II”, 80125 Napoli, Italy
2
Department of Engineering, University of Campania “Luigi Vanvitelli”, 81031 Aversa, Italy
3
Department of Agriculture, University of Naples, 80055 Naples, Italy
*
Author to whom correspondence should be addressed.
Sustainability 2020, 12(3), 764; https://0-doi-org.brum.beds.ac.uk/10.3390/su12030764
Submission received: 22 November 2019
/
Revised: 10 January 2020
/
Accepted: 17 January 2020
/
Published: 21 January 2020
(This article belongs to the Special Issue Sustainable Mobility: Social, Technological and Environmental Issues)
Abstract
:The transport sector is often the center of political and scientific debate on sustainability due to negative externalities produced by the daily movement of goods and people which impact both on the environment and on quality of life. Great interest has therefore focused on impact estimation of transport infrastructures/services with respect to social, economic, and environmental sustainability. Among the consolidated assessment methods, the cost–benefit analysis (CBA) is one of the quantitative tools representing the final stage (decision) in decision-making processes, which compares design alternatives and verifies the sustainability of a transport project. Recently the Italian Government proposed the national “Guidelines for Assessment of Investment Projects” based on CBA. The aim of this research is twofold: a) from a research point of view, to propose a sustainable evaluating method for impact assessment of the new transportation infrastructure aimed in performing both rational and shared decisions with the territories; b) for a practical point of view, to propose a first application of the CBA Italian guideline useful for the professional practice in the field of public investment evaluation. A quantitative impacts assessment of social, economic and environmental sustainability was performed for a revamping project of a new “greenway” in the south of Italy. Furthermore, also the social equity impacts produced by the new road infrastructure was also quantified, estimating the GINI indexes variation as a measure of effectiveness.
1. Introduction
Sustainable development is one of the main challenges of the last millennium. The transport sector has always not only played a strategic role in the economic development of a country but is also at the center of the political and scientific debate on sustainability. The main points of interest in this debate are the negative externalities produced by the daily movement of goods and people which impact both the environment and the quality of life [1,2]. Nevertheless, beyond environmental ideals (which is important), sustainable development must also be socially acceptable, fair, and economically viable (e.g., [3,4,5,6]).
In particular, environmental sustainability entails improvement in the quality of urban environment and reduction of emissions and energy consumption (greenhouse gasses emission variation; pollutant emission variation; impact variation in other sectors). By contrast, social sustainability entails improvement in the quality of life and social equity (e.g., easy access to transportation) and improved safety (e.g., reduction in the frequency of accidents). Finally, economic sustainability entails making mobility of people and goods more efficient and effective and ensuring that the economic benefits produced by the project (for the period under survey) are greater than the costs.
Many transport policies (choices) are widely accepted as sustainable (ecological) but they are not always “eco-rational” i.e. not acting in the best possible way as defined by Cartenì [7]. It is recognized for passenger transport that the policies for sustainable mobility [7,8,9,10], in which the use of cars are minimized, is the tool through which it is possible to reduce the externalities on the environmental level, but it is not always socially acceptable, fair, and economically viable (e.g., [3,4,5,6]). For example, the introduction of toll for the use of a road infrastructure seems one of the most common Transportation Demand Management policy aim to reduce car use and their emissions, but which is not popular among road users [11,12,13]. One of the major limits of these applied policies is that they do not take into account their impact on equity and on social sustainability [14]. In the meantime, designing a toll (pricing) scheme in which the acceptance and equity measure are as a design variable [14], so stakeholder engagement (SE) is developed (that is the process of involving stakeholder concerns), which could lead to an environmental, social, and economic sustainability policy. Therefore, the vision of sustainable development cannot do without a rational and consistent decision-making process.
Precisely, rational decision-making implies “acting in the best possible way considering the aims and the constraints” [15]. A decision in the transport sector that considers the objectives, constraints, impacts, benefits, costs, risks and greater possibilities must be (i) consistent, in compliance with the set objectives and existing constraints; the choices must not be in mutual opposition and must avoid wasting resources; (ii) comparative, which means comparing multiple design alternatives; (iii) aware, to be aware through quantitative methods of the characteristics of the alternatives, of the physical and decision-making context, other related choices (internal, horizontal and vertical consistency) and impact assessment; and (iv) flexible, as the choices may undergo changes due to the advantages of not choosing the constraints and the context [7,16].
Cascetta et al. [16] proposed a model for rational decision-making. The proposed model is based on three parallel and intertwined processes: a cognitive rational approach to organize the decision-making process, a five-level stakeholder engagement process and a revised role of quantitative analysis and methods drawing on engineering and economics tools.
Quantitative analysis and methods, evaluation analysis are therefore useful tools in a rational decision-making process and avoid a syndrome known in literature as the “planning fallacy” [17] in which planners overestimate the benefits that an intervention will produce and/or underestimate the costs for its realization and maintenance. The direct consequence of this syndrome is the realization of “not necessary” interventions or less useful actions. Flyvbjerg et al. [18] analyzed 260 railway and road infrastructures (e.g., roads, railways, bridges, tunnels) built in different countries and estimated an extra monetary cost for their realization, equal to 28% [18]. Furthermore, Flyvbjerg et al. 2005 and 2006 [19,20] point out that the errors in traffic forecasts of road projects are more than 20% for about half of the time and more than 40% for a quarter of the projects. As regards railway projects, they show that for nine out of 10 railway projects, passenger forecasts are on average overestimated by 106%. In addition, they sustain that, for 72% of railway projects, the forecasts are overestimated by more than two thirds.
There are numerous quantitative methods that, once the objectives and constraints are known, allow us to evaluate social utility and compare public projects; among these, the most used ones are [21] cost assessment analysis, standard cost model, cost-effectiveness analysis (ACE), cost–benefit analysis (CBA), risk assessment, risk-risk analysis, and multi-criterion analysis (MCA). Each technique has specific strengths and weaknesses and for this reason, there is no clearly dominant method over the others. In the transport sector, there are many examples of the application of cost–benefit analysis (CBA) [9,22,23,24,25,26,27,28,29]) and multi-criterion analysis (MCA) [30,31,32]) to make rational choices. CBA is an analytical tool, proposed and standardized by the European Community [33] “to appraise an investment decision in order to assess the welfare change attributable to it and, in so doing, the contribution to EU cohesion policy objectives. The purpose of CBA is to facilitate a more efficient allocation of resources, demonstrating the convenience for society of a particular intervention rather than possible alternatives. To choose the best quality projects which offer best value for money and which impact significantly on jobs and growth is a key ingredient of the overall strategy. CBA is based on a set of predetermined project objectives, giving a monetary value to all the positive (benefits) and negative (costs) welfare effects of the intervention. These values are discounted and then summed up in order to calculate a net total benefit.”
Recently, the Italian Government, after a long phase of sharing with institutional and non-institutional stakeholders, and taking into account the European guidelines, decreed the “Guidelines for Assessment of Investment Projects” [34]. These guidelines incentivize the quantitative analyses, aiming more standard and less discretionary results. Through the Cost Benefits Analysis, it is possible to identify investment priorities and evaluate the economic viability of the investment [26].
The CBA method, thanks to both national and EU guidelines [35,36], is more standard and less discretionary, enlarging the consensus, legitimizing the analysis, and reducing the risk of planning fallacy [37]. However, the CBA have some limits, tending to underestimate externalities (non-monetary impacts) such as the environmental, landscape, and social impacts [9,26,37,38]. On the contrary, the MCA, which with several multi criteria approach, aims at identifying the best “compromise” solution, is more suitable for the non-users (and non-monetary) impacts estimation. However, at present, there are no national and/or EU official guidelines which do not allow standardization of the procedure, thereby increasing the risks of discretional and/or not-rational results and so the planning fallacy.
As observed, a good decision-making process should also be eco-rational (acting in the best possible way). An eco-rational decision-making process is a rational transport policy for the transport system and sustainable (socially, economically, and environmentally) [7].
Several studies propose different quantitative and qualitative methods for assessing the sustainability of an intervention. For example, Tolón-Becerra et al. [39] proposed systems of transferable indicators, which help to find a harmonious solution to the conflict among the objectives of economic, environmental and social sustainability. Kumar et al. [40] developed the methodology based on the fuzzy logic, proposing an index of social sustainability of freight transport (FTSSI). Baric et al. [41] through an Analytic Hierarchy Process (AHP) model identified the best road section project. Inti et al. [42] presented a modified AHP model, the characteristics of the additive transitivity of fuzzy relationships. Stojčić et al. [43] identified 108 articles in the period 2008–2018 relating to the issue of sustainable engineering (23 specific articles in the transport and logistics sector). The results of this document show that sustainable engineering is an area that is quite suitable for the use of multi-criteria decision methods (MCDM). Few applications of the cost-benefit analysis (CBA) as the rational evaluation process to verify the sustainability (economic, social and environmental) and the impacts on social equity of transport project were found.
Regarding the impact of an intervention on social equity, the Lorenz Curve [44] and the corresponding Gini index [45] are the common measures of equity adopted in various and specific research. Both measures are emphasized in economics, and many other subject areas, such as the transportation planning e.g., [46,47,48,49,50,51,52,53,54,55,56,57]. They are a measure of the inequality (statistical dispersion) in the distribution of an attribute (e.g., income, wealth, transport accessibility).
Given these considerations, in this paper, an eco-rational decision-making process has been shown for a specific and real case study: the “greenway” revamping project (greenway planning) of a main extra-urban road in the Puglia region (south of Italy). Furthermore, within an eco-rational decision-making process, quantitative analysis to evaluate the environmental, social and economic sustainability of the “greenway” revamping project was carried out. For this research, for the specific case study, a CBA, as evaluation analysis, was developed.
In fact, considering that, the main elements of eco-rational decision-making process are (i) standardize the procedures followed by decision-makers (e.g., through specific guidelines or regulations); (ii) estimate the effects of an intervention through consolidated quantitative methods also by introducing prudential hypothesis (to avoid benefit overestimation ); (iii) estimate explicitly the impact of the intervention on environmental, economic and social sustainability; and (iv) enlarge stock consensus to reach shared choices with stakeholders. The CBA is the suitable tool for eco-rational decision-making process.
The aim of this research is twofold: a) from a research point of view, to propose a sustainable evaluating method for impact assessment of the new transportation infrastructure aimed in performing both rational and shared decisions with the territories; b) for a practical point of view, to propose a first application of the CBA Italian guideline useful for the professional practice in the field of public investment evaluation. A quantitative impacts assessment of social, economic and environmental sustainability was performed for a revamping project of a new “greenway” in the south of Italy. Furthermore, the social equity impacts produced by the new road infrastructure were also quantified, estimating the GINI indexes variation as measure of effectiveness.
The paper is divided into four sections. In the first one, the specific case study and eco-rational decision-making process is shown. In the second part, the methodology relative to quantitative analysis is described. Results and discussion are reported in the third section while the last section, the conclusion, highlights the GINI index, the result of the sustainability analysis.
2. Application Case Study
The case study looks at the revamping of a main extra-urban road (EUR) in Puglia region, according to the principles of greenway planning. The greenways are roads designed in line with the concept of sustainable land use. The greenways are designed and managed, taking into account multiple purposes that include ecological, recreational, cultural, and aesthetic [58].
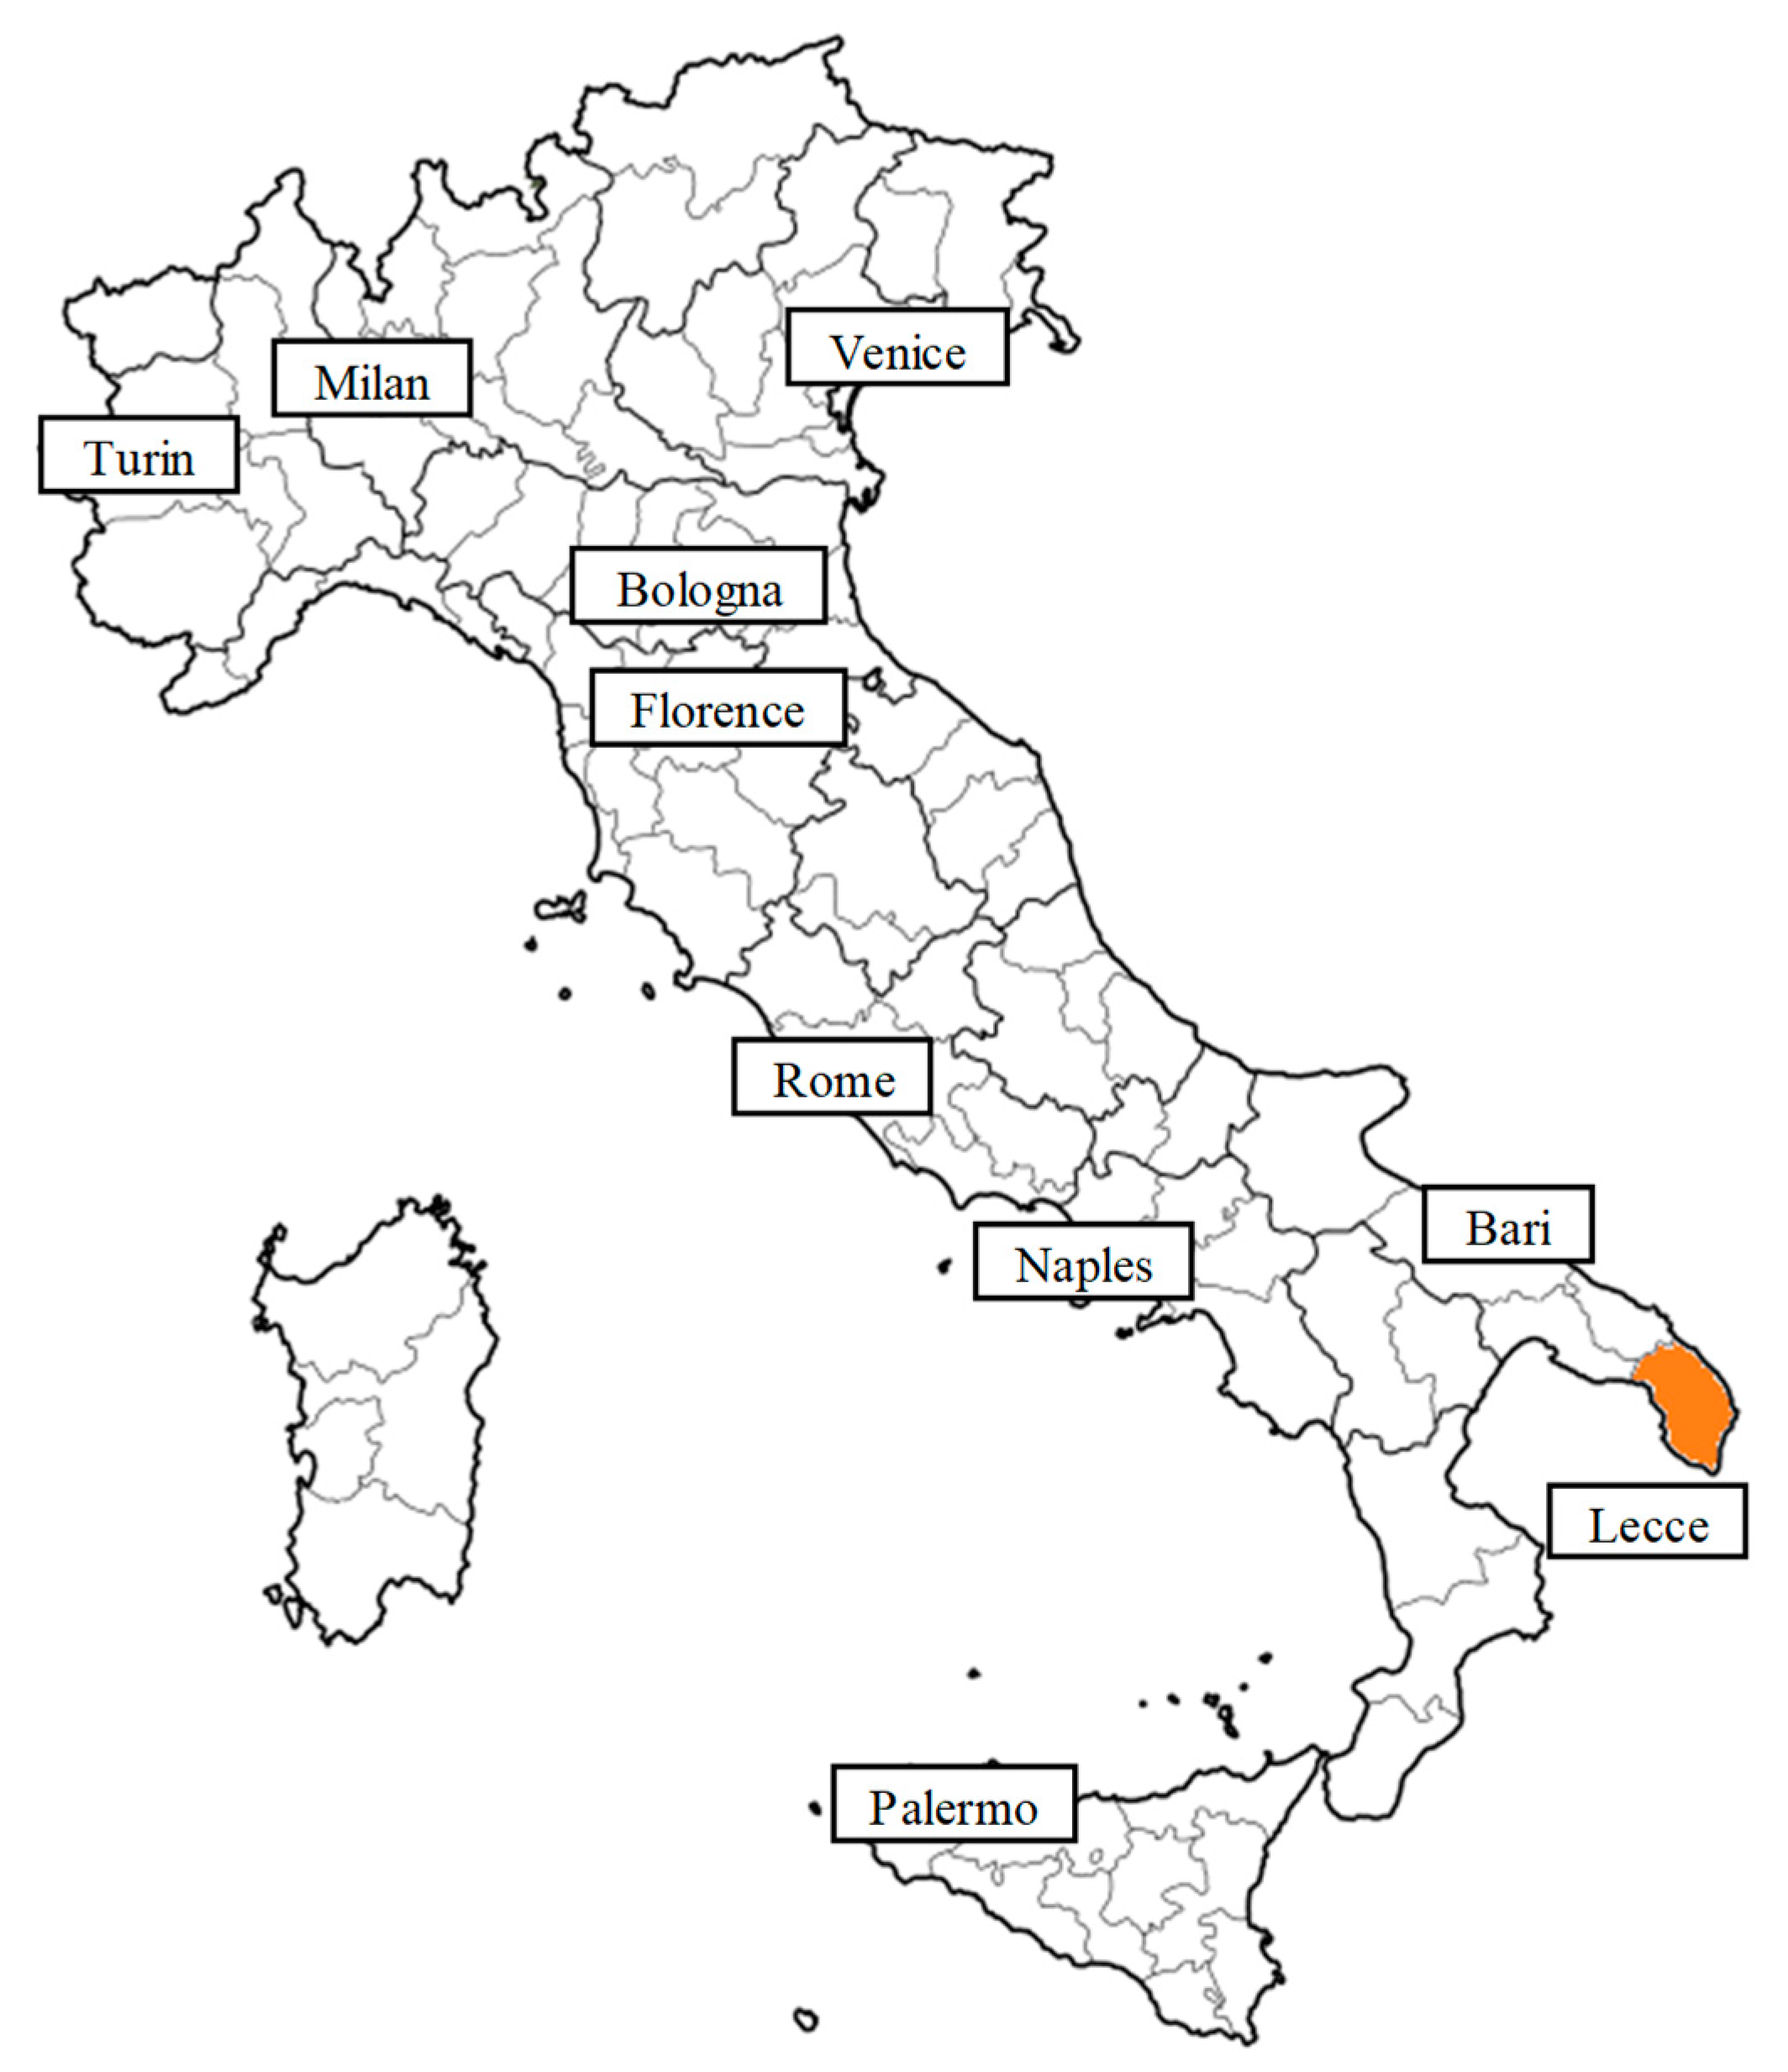
With over 4 million inhabitants, the region of the case study is the most eastern region of Italy (Figure 1), in the southern part of the peninsula. Its location in the design of the Italian infrastructural network still shows its peripheral nature compared to national and international traffic flows and, internally, the marginalization of some areas.
Rail transport is rather insufficient because Puglia is the fourth to the last region as far as the railway network use is concerned (link between trains-km in service) [59]. This region is not even connected with high speed trains to the rest of Italy; there is only one intra-regional line on which trains travel at a speed of about 200 km/h.
Consequently, regional mobility is mainly entrusted to road transport, characterized by highly problematic elements such as the overall inadequacy of the offer, the poor connectivity among different modes of transport and the concentration along few privileged road axes.
In this context, applying the model proposed by Cascetta et al. 2015 [16], the local government (Foggia Municipality) has launched an eco-sustainable decision-making process as shown in the Figure 2. In particular, the decision process started when a congestion problem was highlighted in the Lecce area. Stages in analyzing the present situation, as well as the identification of objectives, constraints and project designs, has be supported by stakeholders listening and by the technical analysis of industry experts (e.g., transportation planners, engineers, geologists). The citizens of the areas concerned, the mayors and the environmental associations were involved in the decision-making process. At the end of the consultation phase, it was decided that the only possible alternative solution was to revamp a main extra-urban road that connects the cities of Maglie and Santa Maria di Leuca in the Puglia region. The revamping of the road was the only possible solution because the construction of new road was not wanted by the environmental and citizens associations.
The classification of the work in the Italian transport and the infrastructural sector shows how, in this reference context, the revamping of a road is a worthwhile measure. The revamping project aims to improve the performance of the road (such that the road will take on performance similar to a highway) and to improve the safety of the road. Indeed, this enhancement of the existing heritage contributes to satisfying the demand for mobility, but above all, it aims at improving social sustainability by reducing accidents.
The final decision as to whether or not to intervene was postponed with the results of the quantitative analysis. CBA is one of the quantitative tools representing the final stage (decision) in decision-making processes. In the following section, all the technical activities implemented for the evaluation of revamping of the road, are reported.
3. The Evaluation Analysis Methodology Proposed
In this research an evaluation analysis to estimate the environmental, social and economic impact produced by the transport infrastructure has been proposed. The proposed evaluation analysis was applied to a specific case study: revamping of the extra-urban road (EUR) at the regional level in Puglia, Italy. The overall proposed methodology is reported in Figure 3.
The preliminary activities [26] include the definition of:
- (i)
- different project alternatives (scenarios); for this case study the positive impacts (benefits) produced by the revamping of the road, was estimated as the variation between the project scenario (redevelopment of the Extra Urban Road) and the Not Project (NP) scenario;
- (ii)
- the analysis time period is the number of years for which the costs and benefits were taken into account. The definition of the time period significantly influences the results of the Cost Benefit Analysis. In accordance with the national “Guidelines for Assessment of Investment Projects”; in this case study, a time period of 30 years was considered.
These preliminary activities are input for estimating demand and for cost benefit analysis. In the second activity, transportation system models (TSMs) were implemented to estimate the transport demand impacts. In order to estimate mobility demand, it is necessary to have an input analysis of the actual and design scenario transport supply. Mobility demand (present and future) can be calculated by: “direct estimates” and “model estimation” (for details [60]). In the case study proposed, using the historical traffic data and mobility surveys (“direct estimates”), the total annual traffic for private cars and freight vehicles was estimated. A multinomial LOGIT path choice model was specified and estimated with the results obtained in [61,62,63] in the Italian context. This model was able to evaluate changes in the paths of users downstream of the revamping of the Italian road. So, the Transportation Impact (Δvehicle × km and Δvehicle × h), for all analysis time period, was estimated. A macroeconomic trend model was also estimated to quantify the trend of the demand for all analysis time period (30 years) [27]. The model links the trend of the main socio-economic and macroeconomic variables characteristically sensitive to road demand (GDP, population, and tourists in the study area) to the trend of the traffic demand.
The Transportation Impact is the input for the sustainability evaluation and CBA.
For the CBA, following both the national and the European guidelines and methodology proposed by [27,28,36,64], it is necessary to estimate the following:
- Costs: investment; management and maintenance; the residual value of the investment;
- Benefits for the users: the consumers’ surplus (as a variation of travel time); operational costs (e.g., usage and maintenance of the vehicle);
- Benefits for non-users: greenhouse gasses emission variation; pollutant emission variation; noise variation; accidents variation; traffic congestions variation; impacts on other sectors’ variation (e.g., energy market).
To reduce the risk of planning fallacy, (overestimation of the expected benefits and underestimation of the costs, in order to justify the usefulness of a project solution) three different scenarios have been simulated: “optimistic,” “prudential,” and “median” due to more or less conservative modelling assumptions. This allowed to estimate a range of variation for performance indicators (Measure of Effectiveness; MoE).
In the “prudential” scenario, the same “conservative assumptions” were introduced. In particular, the prudential hypotheses considered are:
- (i)
- A mobility demand estimate:
- has neglected the induced demand by the revamping of the road. This means considering only the demand diverted from other paths;
- some parameters of direct demand estimation have been deliberately underestimated (even by 50%) compared to those quantified by mobility survey (e.g., the percentage of users who would change the route downstream of the revamping of the Italian road).
- (ii)
- An estimate of benefits:
- underestimation of the consumer surplus i.e. the benefits for the transport users residing outside the area directly affected by the improvement of the Italian local road have not been considered;
- travel time saved is an underestimation i.e. it has not been considered that, with changes in the choice of path, the intervention could lead to a reduction of road congestion and therefore a reduction of travel times (additional benefits attributable to the new infrastructure) also on other routes.
- underestimation of the reduction in accidents, i.e. reduction in the phenomena of accidents resulting from the estimated increase in the demand for the study area was not considered.
In the “optimistic” scenario, these prudential hypotheses were not considered. The “median” scenario is estimated as the average scenario between the “optimistic” and “prudential” scenario.
In consideration of the impacts and benefits produced by the project, a sustainable evaluation analysis was carried out. The environmental and social feasibility of the intervention was assessed by estimating the benefits for non-users e.g., reduction in pollutant emissions and the number of accidents. Moreover, the variation of the travel time (after-revamping) was used as an indirect measure for estimating the impacts on social equity. Social sustainability was also assessed through the variation of the equity from the point of view of private car accessibility. The variation of the equity was estimated through the GINI index.
Finally, by measuring the effectiveness (MoE) (the Internal Rate of Return—IRR, the Net Present Value, ENPV, and the Benefit/Cost ratio), the economic feasibility of the intervention was evaluated.
4. Result and Discussion of the Cost Benefit Analysis
4.1. The Traffic Demand Estimation
In a CBA, the traffic demand estimation covers a central role within the benefit estimation produced by a design scenario. In the case study proposed, taking into account the traffic counts, mobility survey was carried out in the area of the study to estimate the deviated demand from other paths. A multinomial LOGIT path choice model was estimated with the results obtained in references [60,61,62,63,65] for the Italian context.
The behavior of the choice of the path for the users of origin-destination relationship is simulated by models (stochastic) derived from the theory of random utility (for details see [60,66]).
The link flows were estimated with a stochastic equilibrium assignment, given by (1):
where
fSUE = fSUE(c; d) = ∑oddod × Δod × pod(c(fSUE)),
fSUE is the vector’s estimate of the link flows resulting from the ’equilibrium assignment’
c(fSUE) is an estimate of the vector of the generalized transport cost, a function of the equilibrium vehicular flows, calculated through a network model;
Δ is the link-path incidence matrix that represents the relationship between links and paths;
P is an estimate of the probability matrix of choice of the path estimated through the relative network model;
d is the estimated demand vector.
In particular, for each link of the transport network (supply model), it was possible to estimate, for each type of vehicle (car and freight vehicles), the average generalized transport cost of link equal to (2):
where
gen. cost.k = β1 × trk + β2 × fuel_costk,
trkis is the average travel time on the path k;
fuel_costk is the average fuel cost supported on the path k;
β1 and β2 are the estimated model parameters.
A Maximum Likelihood estimator was used for the parameter estimation using BIOGIME software [67]. The estimation results are reported in Table 1.
The trend of demand (number of vehicles, private cars and freight vehicles, on the EUR) for all analyzed time period (30 years) was estimated through the macroeconomic trend model. This model takes into account the trend of the tourist flow expected in the studied area, the trend in regional GDP and population for the studied area in line with national expectations, for all analyzed time period.
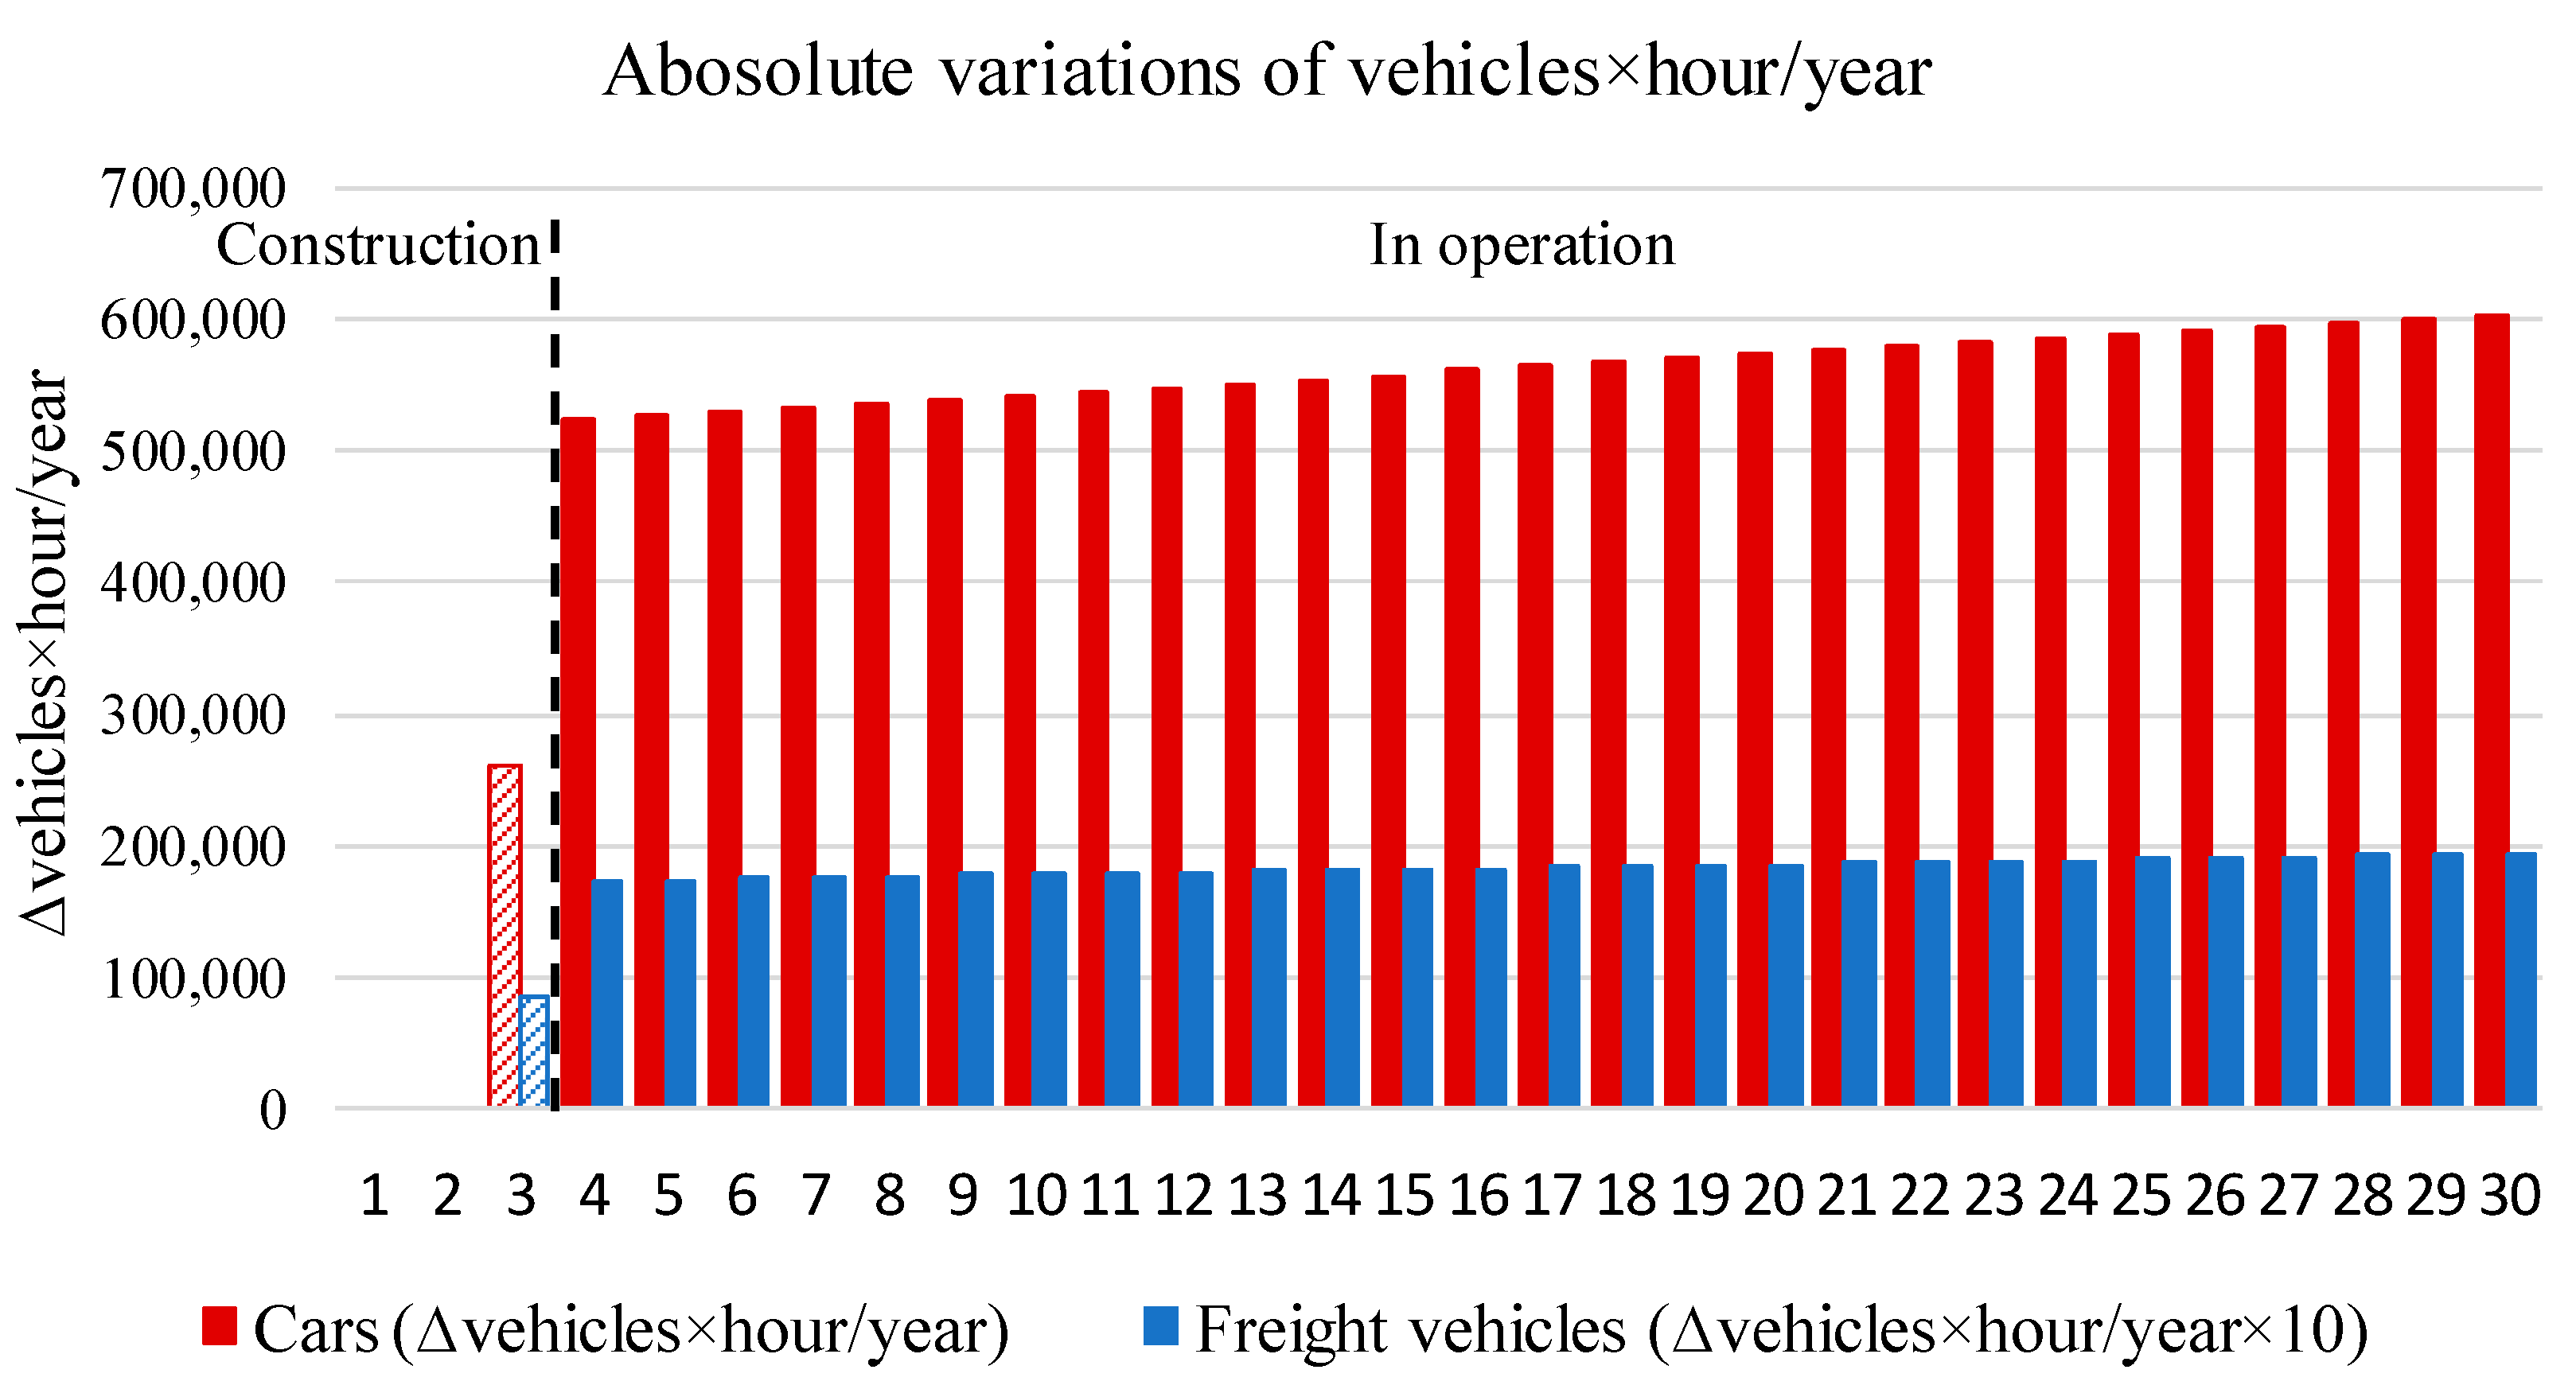
Estimation results showed that users who today prefer longer path, but more comfortable and safe routes, after the revamping they will benefit of a shorter route, for the main origin and destination pair, comfortable and safe. The (revamped) road is frequently the shortest path for most of the trips but today high congested and not comfortable. The construction of the new green road will make this route not only shorter (in terms of kilometers) but also faster, safer and more comfortable, reducing environmental impacts also for those trips that will lengthen their path in order to use this new and more attractive road. Overall, after the overhauling of the road, the users who will choose the redeveloped road will save about 600 thousand hours per year (Figure 4) and 1.6 million km per year (Figure 5).
4.2. The Cost Estimations
The economic sustainability of an infrastructure is also a function of the investment costs and of cost items incurred during the useful life of the work itself (e.g., management and maintenance costs). In this study, in agreement with national “Guidelines for Assessment of Investment Projects,” the costs, for different scenarios simulated, are reported in Table 2.
In assessing the costs, all the monetary amounts necessary to carry out the project must be considered, which generally depend on the type of infrastructure involved and its characteristics. In addition to the investment costs, the operating costs for ordinary and extraordinary maintenance must also be taken into consideration throughout the analyzed period. Finally, since the analyzed time period is often less than the “economic life” of the project, a residual value of the investment was also considered.
According to a “prudential estimation” of analysis, for this case study, the residual value of the investment was considered equal to 30% of the total cost of the investment.
Table 2 shows the costs for the three scenarios (“optimistic”, “prudential” and “median”). Specifically, for the “median” scenario, the investment costs (at 2017 prices with fiscal corrections) are about 185 million Euros; the maintenance and management costs are about 19 million Euros (considering the overall extension of the infrastructure, a maintenance cost of €1.2 million per year can be estimated).
Finally, a residual value of the investment of around 24 million Euros is estimated (at 2017 prices).
As suggested by the main reference texts, for the purpose of excluding taxes and subsidies, all the costs have been multiplied by specific correction coefficients [64].
4.3. The Users Benefits Estimation
The revamping of the EUR will bring both perceived and unperceived benefits to users. Travel time savings are part of the benefits perceived directly by users, while the savings associated with reducing car maintenance costs are part of the benefits not perceived by users.
The perceived benefits for the transport users were estimated as travel time savings, assessed as Δvehicles×hour per year (output of the traffic demand estimated) for the value of time (distinct for different reasons of the travel and vehicle types, Table 3) for all the life period.
The unperceived benefits, i.e., the operating costs, include the consumption of lubricants and tires, the maintenance and depreciation of the vehicle. Operational costs are a function of the kilometers traveled (Δvehicles×km per year) and the type of vehicles (distinguished by private cars and freight vehicles). For the estimation of these costs, unit economic value was considered for the cars and for freight vehicles available on [64].
About 208 million Euros (at 2017 prices) are the benefits to the potential users of the Regional Road revamping estimated in the Median scenario.
4.4. The Non-Users Benefits Estimation (External Cost Saved)
In a cost-benefit analysis, the estimate of benefits for non-users (external costs saved) is aimed at assessing the externalities (external impacts) that the project produces on the environment (e.g., costs of climate change) and on human health (e.g., air pollution and road safety). Benefits therefore, involve an increase in environmental and social sustainability. The reduction of kilometers covered by the new infrastructure project (revamping EUR) will have substantial benefits for non-users in terms of reducing climate change, air pollution, noise and traffic congestion. These benefits are generally non-monetary (variation in tonnes per year of climate change emissions) and it is possible to determine their monetary value as (3):
marginal cost × Δcar × km/year
The unit rates proposed by the European Commission [36], weighed according to the distribution of the vehicle fleet [26], were used to estimate these marginal costs.
The redevelopment of the EUR will also lead to an increase in social sustainability, including greater road safety.
A disaggregated approach (for details [26]) was used to estimate the economic benefits produced by the decrease in the number of accidents. The variation in the number of accidents, differentiated according to the severity level, was evaluated as the difference between the number of accidents currently observed on the road and those observed in other existing road with equal physical characteristics (maximum speed, number of lanes etc.). In detail, considering the average accident standards of an infrastructure of equal physical characteristics, the accident variations in the EUR after the revamping are over 5.1 minor injuries per year, 4.0 seriously injuries per year, and 0.4 deaths per year. For the reduction of accidents, the economic (monetary) value of this benefit was evaluated as (4):
Δnumber of accident × marginal cost
The variation in the number of accidents is different for different gravity of accident. For marginal costs, reference was made to the Guidelines for Assessment of Investment Projects.
Specifically, the estimated discounted benefits due to the reduction of road accidents (Figure 6) are about 29 million Euros (median scenario).
Table 4 shows, in the three different scenarios (“optimistic,” “prudential,” and “median”), the advantages discounted for non-users for the entire period of life considered (using 2017 prices).
Finally, the change in travel times among the main areas of the study can lead indirectly to changes in the social equity of the area. So, the variation (between before and after the revamping of the EUR) of the accessibility in the study area was estimated as a measure of social equity. In order to evaluate equity impacts (social impact) induced by the redevelopment of the EUR in Puglia.
The Gini index (G), brainchild of the Italian expert in statistics Corrado Gini, allows tuso measure inequality (statistical dispersion) concerning the distribution of an attribute (in this context, for transport accessibility). The values assumed by the Gini index are included in a range from 0 (perfect equality) to 1 (perfect inequality). The G index can be estimated in different ways, for a discrete population with values yi, i = 1,..., n, one of the simplest possible formulations is (5):
where
xi is the cumulated proportion of the population, for i = 0,...,n, with x0 = 0, xn = 1.
yi is the cumulated proportion of the variable (transport accessibility) indexed in non-decreasing order (yk > yk−1), for i = 0,..., n, with y0 = 0, yn = 1.
The Gini index was estimated with respect to transport accessibility in the current scenario (non-intervention scenario) and in design scenario (redevelopment of the Extra Urban Road) [68].
The idea of accessibility is an enduring discuss in the study of transportation planning as a yardstick for measuring intensity and quality of relationships between land development designs and commutation system Theoretically, there are two types of accessibility; active accessibility measures the ease with which users can reach different activities in the various points of the territory. While passive acceptability measures the ease with which activities in an area of the territory can be achieved by potential users [69].
For these reasons, transport accessibility can be considered as a measure of social equity; equally accessible territories are of social equity.
For the case study, accessibility is quantified in function of the level-of- service attributes and land use attributes; an active accessibility gravitational model specification was estimated (6):
where
is the active accessibility measure related to the origin traffic zone o and measuring the average weighed (on the opportunities) travel time by car from the zone o toward all the zones of the study area considered;
Nd is the number of traffic zones considered in the study area (6 municipalities of the study area)
Tod − minim k is the travel time on minimum path k by car between the od pair;
Od is the number of opportunities (i.e. the total number of employees in industry, trade and services) available in traffic zone d.
In assessing the impacts of the transport user, the percentage change in the Gini index (measure of transport accessibility) was determined to measure the equity of the population in the study area.
In this study, in order to quantify the equity impacts induced by the revamping of the Extra Urban Road, the absolute values of the estimated Gini indices were not as significant as their percentage changes. In fact, the aim was not to investigate whether the territory is more or less fair (respect the transport accessibility), but rather the impact of the revamping on equity.
The results show that in the design project, the GINI index reduced by 19%, which means that social equity has increased.
4.5. Measure of Effectiveness
Quantified impacts (benefits and costs) implies that the economic sustainability of the project was assessed by means of appropriate performance indicators (Measure of Effectiveness; MoE):
Net Present Value (NPV) reports the various effects relating to the project, calculated for the analyzed period (30 years), to the initial year (7):
where
- r is the rate of return equal to 3.0%;
- Tm is the analysis period (30 years);
- BJ is all the benefits (both for users and for non-users) that the Regional Road revamping will produce;
- CJ are all supporting costs (Table 2)
Internal Rate of Return (IRR)ro is the value of the rate of return that null the NPV calculated over a period of 30 years relating to the Regional Road revamping (8), (9):
IRR = ro;
NPV(ro) = 0.
B/C is defined as the ratio of the total benefits to costs discounted at the initial year (10):
PayBack Period (PBPi) discounted is the minimum number of years beyond which a positive NPV occurs (that is the return on the investment) (11), (12):
PBPi = Tmin;
NPVi(r) > 0
The cost-benefit analysis carried out highlighted the following results (for the median scenario) in (Table 5):
4.6. The Sensitivity Analysis
The sensitivity analysis was carried out to verify the robustness of the results. Positive or negative variations of the main critical variables (e.g., investment costs, the discount rate and the consumers’ surplus) are introduced to evaluate if the benefits are greater than the costs and if the intervention is sustainable. As can be seen from the following figures (Figure 7), also for these critical variables the results of the simulations show a “robust” design scenario. This achievement enables us to conclude that the design solution analyzed is economically viable.
5. Result and Discussion of the Sustainability Analysis
A good decision-making process should also be eco-rational (acting in the best possible way). An eco-rational decision-making process is a rational transport policy for the transport system and sustainable (socially, economically and environmentally). As part of the decision-making process, the cost-benefit analysis, as previously described, represents the quantitative tool (method) used to reach the best and most shared project solution with the stakeholders, verifying at the same time its social, environmental and economic sustainability. Although the CBA is standardized by national and EU guidelines, as mentioned above, it has some limitations.
The aim of this research is twofold: a) from a research point of view, to propose a sustainable evaluating method for impact assessment of the new transportation infrastructure aimed in performing both rational and shared decisions with the territories; b) for a practical point of view, to propose a first application of the CBA Italian guideline useful for the professional practice in the field of public investment evaluation. The revamping of the Extra-Urban Road in Puglia (Italy) with quantitative analysis has been evaluated with respect to economic, social, and environmental sustainability. The main indicators to assess the sustainability of the infrastructure estimated are reported in Table 6.
SOCIAL SUSTAINABILITY:
Accessibility to key services and facilities is defined as a primary measure of social sustainability [70]. Potentially, the urban infrastructure can improve social equity [71]. The revamping of the EUR will lead to reductions in users’ travel time; therefore, it will increase accessibility and thus, the social equity by about 19% in the study area.
The revamping of the road will enhance safety of travels. As demonstrated in “The Non -Users Benefit Estimation” section, it has been estimated that the variations in accidents will be over 0.4 dead per year, 4.0 seriously injured per year, and 5.1 minor injured per year. For the life period, the Economic Benefit to reduce the number of accidents is equal to 30 million.
ENVIRONMENTAL SUSTAINABILITY:
The estimated traffic demand shows that users who today prefer longer paths, but more comfortable and safe routes will, after the revamping of the EUR, save about 650 thousand km per year with significant positive benefits in terms of reduction in climate change, air pollution, noise, and traffic congestion. For the life period, the Economic Benefit to the environment is about 780.000 Euro.
ECONOMIC SUSTAINABILITY:
The Cost Benefit Analysis show that the revamping of the EUR is economically sustainable. In fact, using a discount rate of 3% and analysis time period of 30 years, the benefits will be greater than the costs in optimistic scenario by 1.8; 1.5 in median scenario; and 1.2 in prudential scenario. Moreover, considering the median scenario, the Net Present Value (NPV) that the infrastructure will produce (30 years of operation) is about 86 million Euro; the estimated IRR is greater in the discount rate (around 6% vs. 3%); and finally, the payback period is estimated to be 21 years.
Among the results from the research perspective is the development of a multi-criteria analysis, to be able to compare the results obtained. Finally, the proposed methodology and application can also be extended to other research fields such as environmental impact assessment, sustainable development, and project financing (or other forms of public–private partnership).
Author Contributions
Study conception and methodology formulation: A.C.; methodology formulation, quantitative estimations and draft manuscript preparation: I.H.; costs and benefits quantifications and draft manuscript preparation: C.M. and A.E. The text is a joint work of all authors. All authors read and approved the final manuscript.
Funding
This manuscript is the result of research work that did not receive any funds for the preparation of itis research. The study received no external funding.
Acknowledgments
The research was carried out as part of the activities of: (i) the Air Heritage – UIA EU project; (ii) the Transportation System Laboratory of the University of Campania “Luigi Vanvitelli”, Italy. The research was also carried out within the activities of funding program VALERE: VAnviteLli pEr la RicErca; SEND research project, University of Campania “Luigi Vanvitelli”, Italy.
Conflicts of Interest
The authors declare no conflict of interest.
References
- Commissione Europea. Un Futuro Sostenibile per i Trasporti: Verso un Sistema Integrato, Basato Sulla Tecnologia e di Agevole Uso; COM(2009), 279; Ufficio Delle Pubblicazioni Dell’Unione Europea: Lussemburgo, 2009.
- Pagliara, F.; Biggiero, L.; Henke, I. The Environmental Impacts Connected with Travelling to events: The Case Study of the City of Naples in Italy. In Proceedings of the 2019 IEEE International Conference on Environment and Electrical Engineering and 2019 IEEE Industrial and Commercial Power Systems Europe (EEEIC/I&CPS Europe), Genova, Italy, 11–14 June 2019. [Google Scholar]
- Bellasio, R.; Bianconi, R.; Corda, G.; Cucca, P. Emission inventory for the road transport sector in Sardinia (Italy). Atmos. Environ. 2007, 41, 677–691. [Google Scholar] [CrossRef]
- Basiago, A.D. Economic, social, and environmental sustainability in development theory and urban planning practice. Environmentalist 1998, 19, 145–161. [Google Scholar] [CrossRef]
- Dempsey, N.; Bramley, G.; Power, S.; Brown, C. The social dimension of sustainable development: Defining urban social sustainability. Sustain. Dev. 2011, 19, 289–300. [Google Scholar] [CrossRef]
- Shen, L.; Wu, Y.; Zhang, X. Key assessment indicators for the sustainability of infrastructure projects. J. Constr. Eng. Manag. 2010, 137, 441–451. [Google Scholar] [CrossRef] [Green Version]
- Cartenì, A. Urban sustainable mobility. Part 1: Rationality in transport planning. Transp. Probl. 2014, 9, 39–48. [Google Scholar]
- Cartenì, A. Urban sustainable mobility. Part 2: Simulation models and impacts estimation. Transp. Probl. 2015, 10, 5–16. [Google Scholar] [CrossRef] [Green Version]
- Cartenì, A. A cost-benefit analysis based on the carbon footprint derived from plug-in hybrid electric buses for urban public transport services. WSEAS Trans. Environ. Dev. 2018, 14, 125–135. [Google Scholar]
- Calise, F.; Cappiello, F.L.; Cartenì, A.; Dentice d’Accadia, M.; Vicidomini, M. A novel paradigm for a sustainable mobility based on electric vehicles, photovoltaic panels and electric energy storage systems: Case studies for Naples and Salerno (Italy). Renew. Sustain. Energy Rev. 2019, 111, 97–114. [Google Scholar] [CrossRef]
- Cools, M.; Brijs, K.; Tormans, H.; Moons, E.; Janssens, D.; Wets, G. The socio-cognitive links between road pricing acceptability and changes in travel behavior. Transp. Res. A 2011, 45, 779–788. [Google Scholar] [CrossRef] [Green Version]
- De Palma, A.; Kilanin, M.; Lindsey, R. Maintenance, service quality and congestion pricing with competing roads. Transp. Res. B 2007, 41, 573–591. [Google Scholar] [CrossRef]
- May, A.; Koh, A.; Blackledge, D.; Fioretto, M. Overcoming the barriers to implementing urban road user charging schemes. Eur. Transp. Res. Rev. 2010, 2, 53–68. [Google Scholar] [CrossRef] [Green Version]
- Cascetta, E.; Cartenì, A.; Henke, I. Acceptance and equity in advanced path-related road pricing schemes. In Proceedings of the 5th IEEE International Conference on Models and Technologies for Intelligent Transportation Systems, MT-ITS 2017, Naples, Italy, 26–28 June 2017; pp. 492–496. [Google Scholar] [CrossRef]
- Elster, J. Rational Choice; Oxford Press: Oxford, UK, 1986. [Google Scholar]
- Cascetta, E.; Carteni, A.; Pagliara, F.; Montanino, M. A new look at planning and designing transportation systems: A decision-making model based on cognitive rationality, stakeholder engagement and quantitative methods. Transp. Policy 2015, 38, 27–39. [Google Scholar] [CrossRef]
- Kahneman, D.; Tversky, A. Prospect Theory: An Analysis of Decision under Risk. Econometrica 1979, 47, 263–292. [Google Scholar] [CrossRef] [Green Version]
- Flyvbjerg, B.; Holm, M.S.; Buhl, S. Underestimating Costs in Public Works Projects. Error or Lie? J. Am. Plan. Assoc. 2002, 68, 279–295. [Google Scholar] [CrossRef] [Green Version]
- Flyvbjerg, B.; Skamris Holm, M.K.; Buhl, S.L. How (In)accurate Are Demand Forecasts in Public Works Projects: The Case of Transportation. J. Am. Plan. Assoc. 2005, 71, 131–146. [Google Scholar] [CrossRef] [Green Version]
- Flyvbjerg, B.; Skamris Holm, M.K.; Buhl, S.L. Inaccuracy in Traffic Forecasts. Transp. Rev. 2006, 26, 1–24. [Google Scholar] [CrossRef] [Green Version]
- Dei Ministri, P.D.C. Strumenti per il Ciclo Della Regolazione Allegato 2 Le Tecniche di Valutazione: Alternative Percorribili; Dipartimento per gli Affari Giuridici e Legislative, 2013. Available online: http://www.qualitanormazione.gov.it/uploads/download/file/270/Strumenti_per_il_ciclo_della_regolazione.pdf (accessed on 15 November 2019).
- Dyr, T.; Misiurski, P.; Ziółkowska, K. Costs and benefits of using buses fuelled by natural gas in public transport. J. Clean. Prod. 2019, 225, 1134–1146. [Google Scholar] [CrossRef]
- Harford, J.D. Congestion, pollution, and benefit-to-cost ratios of US public transit systems. Transp. Res. D Transp. Environ. 2006, 11, 45–58. [Google Scholar] [CrossRef]
- Danon, G.; Tica, S.; Vasić, B. Cost benefit analysis of Belgrade tram rolling stock. J. Appl. Eng. Sci. 2006, 4, 57–68. [Google Scholar]
- Chi, S.; Bunker, J.; Teo, M. Measuring impacts and risks to the public of a privately operated toll road project by considering perspectives in cost-benefit analysis. J. Transp. Eng. A Syst. 2017, 143, 04017060. [Google Scholar] [CrossRef] [Green Version]
- Cartenì, A.; Henke, I. External costs estimation in a cost-benefit analysis: The new Formia-Gaeta tourist railway line in Italy. Proceeding of the 17th IEEE International Conference on Environment and Electrical Engineering, Milan, Italy, 6–9 June 2017. [Google Scholar]
- Cartenì, A.; Henke, I.; Molitierno, C. A cost-benefit analysis of the metro Line 1 in Naples, Italy. WSEAS Trans. Bus. Econ. 2018, 15, 529–538. [Google Scholar]
- Cartenì, A.; Henke, I.; Di Bartolomeo, M.I.; Regna, M. A Cost-Benefit Analysis of a Fully-Automated Driverless Metro Line in a High-Density Metropolitan Area in Italy. In Proceedings of the 2019 IEEE International Conference on Environment and Electrical Engineering and 2019 IEEE Industrial and Commercial Power Systems Europe, EEEIC/I and CPS Europe, Genova, Italy, 11–14 June 2019. [Google Scholar]
- Cartenì, A.; Henke, I. The evaluation of public investments according to the cost-benefit analysis: An application to the formia-gaeta railway line [La valutazione degli investimentiin opere pubbliche attraverso l’analisi costi-benefici: Un’applicazione alla riqualificazione della linea ferroviaria formia-gaeta]. Ing. Ferrov. 2019, 74, 651–681. [Google Scholar]
- Hickman, R.; Saxena, S.; Banister, D.; Ashiru, O. Examining transport futures with scenario analysis and MCA. Transp. Res. A 2012, 46, 560–575. [Google Scholar] [CrossRef]
- Nogués, S.; González-González, E. Multi-criteria impact assessment for ranking highway projects in Northwest Spain. Transp. Res. A 2014, 65, 80–91. [Google Scholar] [CrossRef]
- Awasthi, A.; Omrani, H.; Gerber, P. Investigating ideal-solution based multicriteria decision making techniques for sustainability evaluation of urban mobility projects. Transp. Res. A 2018, 116, 247–259. [Google Scholar] [CrossRef]
- Policy, U. Guide to Cost-Benefit Analysis of Investment Projects; The EU: Brussels, Belgium, 2008. [Google Scholar]
- Henke, I.; Bazzichelli, T. The key role of cities in the urbanmobility policies: New laws and new investment (“Il ruolo chiave delle città metropolitane nella politica di sviluppo della mobilità pubblica: Nuove regole, Nuovi investimenti”). Ing. Ferrov. 2018, 12, 979. [Google Scholar]
- Decreto del Ministro Delle Infrastrutture e dei Trasporti n. 300. 2017. Available online: http://www.mit.gov.it/normativa/decreto-ministeriale-numero-300-del-16062017 (accessed on 15 November 2019).
- Korzhenevych, A.; Dehnen, N.; Brocker, J.; Holtkamp, M.; Meier, H.; Gibson, G.; Varma, A.; Cox, V. Update of the Handbook on External Costs of Transport; Final Report for the European Commission, DG MOVE; MOVE. DIW Econ, CAU; Ricardo-AEA: London, UK, 2014. [Google Scholar]
- Cartenì, A.; Henke, I.; Mallozzi, F.; Molitierno, C. A multi-criteria analysis as a rational evaluation process for building a new highway in Italy. WIT Trans. Ecol. Environ. 2018, 217, 713–723. [Google Scholar] [CrossRef] [Green Version]
- Cartenì, A.; De Guglielmo, M.L.; Pascale, N.; Calabrese, M. An adaptive rational decision-making process for developing sustainable urban mobility plans. Int. J. Civ. Eng. Technol. 2017, 8, 1147–1156. [Google Scholar]
- Tolón-Becerra, A.; Otero-Pastor, I.; Pérez, P.; Ezquerra-Canalejo, A.; Lastra-Bravo, X. Bases for Building a Sustainability Indicator System for Transport. In Highway and Urban Environment; Springer: Dordrecht, The Netherlands, 2009; pp. 49–57. [Google Scholar]
- Kumar, A.; Anbanandam, R. Development of social sustainability index for freight transportation system. J. Clean. Prod. 2019, 210, 77–92. [Google Scholar] [CrossRef]
- Baric, D.; Pilko, H.; Strujic, J. An analytic hierarchy process model to evaluate road section design. Transport 2016, 31, 312–321. [Google Scholar] [CrossRef] [Green Version]
- Inti, S.; Tandon, V. Application of Fuzzy Preference-Analytic Hierarchy Process Logic in Evaluating Sustainability of Transportation Infrastructure Requiring Multicriteria Decision Making. J. Infrastruct. Syst. 2017, 23. [Google Scholar] [CrossRef]
- Stojčić, M.; Zavadskas, E.K.; Pamučar, D.; Stević, Ž.; Mardani, A. Application of MCDM Methods in Sustainability Engineering: A Literature Review 2008–2018. Symmetry 2019, 11, 350. [Google Scholar] [CrossRef] [Green Version]
- Lorenz, M.O. Methods of measuring the concentration of wealth. Publ. Am. Stat. Assoc. 1905, 9, 209–219. [Google Scholar] [CrossRef]
- Gini, C. Variabilità e Mutabilità. In Memorie di Metodologia Statistica; Pizetti, E., Salvemini, T., Eds.; Libreria Erendi Virgilio Veschi: Rome, Italy, 1912; Volume 1955, p. 156. [Google Scholar]
- Fridstrom, L.; Minken, H.; Vold, A. The income distribution effect of road pricing: A modelling case study. In Proceedings of the Aet European Transport Conference, Homerton College, Cambridge, UK, 10–12 September 2001. [Google Scholar]
- Delbosc, A.; Currie, G. Using Lorenz curves to assess public transport equity. J. Transp. Geogr. 2011, 19, 1252–1259. [Google Scholar] [CrossRef]
- Welch, T.F.; Mishra, S. A measure of equity for public transit connectivity. J. Transp. Geogr. 2013, 33, 29–41. [Google Scholar] [CrossRef]
- Thomopoulos, N.; Grant-Muller, S. Incorporating equity as part of the wider impacts in transport infrastructure assessment: An application of the SUMINI approach. Transportation 2013, 40, 315–345. [Google Scholar] [CrossRef] [Green Version]
- Kaplan, S.; Popoks, D.; Prato, C.G.; Ceder, A.A. Using connectivity for measuring equity in transit provision. J. Transp. Geogr. 2014, 37, 82–92. [Google Scholar] [CrossRef]
- Ricciardi, A.M.; Xia, J.C.; Currie, G. Exploring public transport equity between separate disadvantaged cohorts: A case study in Perth, Australia. J. Transp. Geogr. 2015, 43, 111–122. [Google Scholar] [CrossRef]
- Xia, J.C.; Nesbitt, J.; Daley, R.; Najnin, A.; Litman, T.; Tiwari, S.P. Amulti-dimensional view of transport-related social exclusion: A comparative study of Greater Perth and Sydney. Transp. Res. A Policy Pract. 2016, 94, 205–221. [Google Scholar] [CrossRef] [Green Version]
- Jang, S.; An, Y.; Yi, C.; Lee, S. Assessing the spatial equity of Seoul’s public transportation using the Gini coefficient based on its accessibility. Int. J. Urban Sci. 2017, 21, 91–107. [Google Scholar] [CrossRef]
- Guzman, L.A.; Oviedo, D.; Rivera, C. Assessing equity in transport accessibility to work and study: The Bogotá region. J. Transp. Geogr. 2017, 58, 236–246. [Google Scholar] [CrossRef]
- Falcocchio, J.C.; Malik, A.; Kontokosta, C.E. A data-driven methodology for equitable value-capture financing of public transit operations and maintenance. Transp. Policy 2018, 66, 107–115. [Google Scholar] [CrossRef]
- Ben-Elia, E.; Benenson, I. A spatially-explicit method for analyzing the equity of transit commuters’ accessibility. Transp. Res. A Policy Pract. 2019, 120, 31–42. [Google Scholar] [CrossRef]
- Chen, Z.; Guo, Y.; Stuart, A.L.; Zhang, Y.; Li, X. Exploring the equity performance of bike-sharing systems with disaggregated data: A story of southern Tampa. Transp. Res. A Policy Pract. 2019, 130, 529–545. [Google Scholar] [CrossRef] [Green Version]
- Ahern, J. Greenways as a planning strategy. Landsc. Urban Plan 1995, 33, 131–155. [Google Scholar] [CrossRef]
- The European House-Ambrosetti. FS. Investire nel Trasporto Ferroviario Regionale—Un’opportunità per le Regioni Italiane e per il Paese; The European House-Ambrosetti, 2019; Available online: http://www.fsnews.it/_Investire_nel_trasporto_ferroviario_regionale.pdf (accessed on 15 November 2019).
- Cascetta, E. Transportation System Analysis: Models and Applications; Springer: New York, NY, USA, 2009. [Google Scholar]
- Cantarella, G.E.; De Luca, S.; Cartenì, A. Stochastic equilibrium assignment with variable demand: Theoretical and implementation issues. Eur. J. Oper. Res. 2015, 241, 330–347. [Google Scholar] [CrossRef]
- De Luca, S.; Cartenì, A. A multi-scale modelling architecture for estimating of transport mode choiceinduced by a new railway connection: The Salerno-University of Salerno-Mercato San Severino Route (Un’architettura modellistica multi-scala per la stima delle ripartizioni modali indotte da un nuovo collegamento ferroviario: Il caso studio della tratta Salerno-Università di Salerno-Mercato San Severino). Ing. Ferrov. 2013, 68, 447–473. [Google Scholar]
- Cartenì, A.; De Guglielmo, M.L.; Pascale, N. Congested urban areas with high interactions between vehicular and pedestrian flows: A cost-benefit analysis for a sustainable transport policy in Naples, Italy. Open Transp. J. 2018, 12, 273–288. [Google Scholar] [CrossRef]
- Gori, G.; Lattarulo, P.; Maiolo, S.; Petrina, F.; Rosignoli, S.; Rubino, P. Lo studio di fattibilità nei progetti locali realizzati in forma partenariale: Una guida e uno strumento. Materiali UVAL 2014, 30, 47–62. [Google Scholar]
- Cartenì, A. Accessibility indicators for freight transport terminals. Arab. J. Sci. Eng. 2014, 39, 7647–7660. [Google Scholar] [CrossRef] [Green Version]
- Cartenì, A.; Cascetta, E.; de Luca, S. A random utility model for park & carsharing services and the pure preference for electric vehicles. Transp. Policy 2016, 48, 49–59. [Google Scholar] [CrossRef]
- Bierlaire, M. BIOGEME: A free package for the estimation of discrete choice models. In Proceedings of the 3rd Swiss Transportation Research Conference, Ascona, The Switzerland, 19–21 March 2003. [Google Scholar]
- Cartenì, A.; Pariota, L.; Henke, I. Hedonic value of high-speed rail services: Quantitative analysis of the students’ domestic tourist attractiveness of the main Italian cities. Transp. Res. A Policy Pract. 2017, 100, 348–365. [Google Scholar] [CrossRef]
- Cascetta, E.; Cartenì, A.; Montanino, M. A behavioral model of accessibility based on the number of available opportunities. J. Transp. Geogr. 2016, 51, 45–58. [Google Scholar] [CrossRef]
- Lucas, K.; Marsden, G.; Brooks, M.; Kimble, M. Assessment of Capabilities for Examining Long-Term Social Sustainability of Transport and Land Use Strategies. Transp. Res. Rec. J. Transp. Res. Board 2007, 2013, 30–37. [Google Scholar] [CrossRef]
- Cuthill, N.; Cao, M.; Liu, Y.; Gao, X.; Zhang, Y. The association between Urban Public Transport infrastructure and social equity and spatial accessibility within the urban environment: An investigation of Tramlink in London. Sustainability 2019, 11, 1229. [Google Scholar] [CrossRef] [Green Version]
Figure 1.
The application case study (sources: elaborations from https://www.google.com/).
Figure 1.
The application case study (sources: elaborations from https://www.google.com/).

Figure 2.
The eco-sustainable decision-making process implemented (sources: elaborations starting from Cascetta et al. [16]).
Figure 2.
The eco-sustainable decision-making process implemented (sources: elaborations starting from Cascetta et al. [16]).

Figure 3.
The multistep methodology proposed.

Figure 4.
Trend of absolute variations of vehicles×hour per year.

Figure 5.
Trend of absolute variations of vehicles×km per year.

Figure 6.
Estimated impacts of non-users: reduction of road impact (€ per year saved discounted to 2017 - median scenario).
Figure 6.
Estimated impacts of non-users: reduction of road impact (€ per year saved discounted to 2017 - median scenario).

Figure 7.
Sensitivity analysis results. (a): % var discount rate; (b): % var. consumer’s surplus; (c): % var. investments costs
Figure 7.
Sensitivity analysis results. (a): % var discount rate; (b): % var. consumer’s surplus; (c): % var. investments costs


Table 1.
The value of time.
| Vehicle Types | Trip Purpose | Value Of Time (VOT) (€/hour) |
|---|---|---|
| (β1/β2) Passenger cars | commuters | 15 |
| other purposes (e.g., tourism and leisure) | 10 | |
| (β1/β2) Freight vehicles | all | 25 |
Table 2.
The costs estimation results.
| Costs (2017 Prices with Fiscal Corrections) | Optimistic Scenario (M€) | Prudential Scenario (M€) | Median Scenario (M€) |
|---|---|---|---|
| Investment costs | 157.86 | 211.72 | 184.79 |
| Operation and maintenance costs | 19.50 | 19.50 | 19.50 |
| Residual value of the investment | 20.32 | 27.25 | 23.78 |
| Total costs | 157.04 | 203.97 | 180.51 |
Table 3.
The estimated benefits for users.
| Users Benefits (2017 Prices) | Optimistic Scenario (M€) | Prudential Scenario (M€) | Median Scenario (M€) |
|---|---|---|---|
| The consumers’ surplus | 208.96 | 199.01 | 203.99 |
| Operational costs | 3.74 | 3.56 | 3.65 |
| Total Users benefits | 212.71 | 202.58 | 207.64 |
Table 4.
The discounted benefits estimation for the non-users for all the life period considered.
| Non-Users Benefits (2017 Prices) | Optimistic Scenario (M€) | Prudential Scenario (M€) | Median Scenario (M€) |
|---|---|---|---|
| Greenhouse gasses emission | 0.59 | 0.56 | 0.57 |
| Pollutant emission | 0.17 | 0.16 | 0.17 |
| Noise pollution | 0.05 | 0.04 | 0.04 |
| Accidents | 30.83 | 28.02 | 29.42 |
| Traffic congestions | 40.04 | 17.13 | 28.59 |
| Impacts in other sectors | 0.28 | 0.26 | 0.27 |
| Total Non-Users benefits | 71.95 | 46.18 | 59.07 |
Table 5.
The measure of effectiveness (MOE) indicators estimated.
| The MOE Indicators Estimated | Optimistic Scenario | Prudential Scenario | Median Scenario |
|---|---|---|---|
| Rate of return r | 3% | 3% | 3.% |
| NPV (M€) | 127.6 | 44.8 | 86.2 |
| IRR | 8% | 5% | 6% |
| B/C | 1.8 | 1.2 | 1.5 |
| PBP | 16 | 27 | 21 |
Table 6.
The results of the sustainability analysis.
| Sustainability | Indicators | Result |
|---|---|---|
| Social | Accidents variation reduction (M€) | 29.4 |
| Active accessibility variation increase (%) | 19% | |
| Environment | Greenhouse gasses emission reduction (M€) | 0.57 |
| Pollutant emission reduction (M€) | 0.17 | |
| Noise pollution reduction (M€) | 0.04 | |
| Economic | Rate of return r (%) | 3% |
| NPV (M€) | 86.2 | |
| IRR (%) | 6% | |
| B/C | 1.5 | |
| PBP (years) | 21 |
© 2020 by the authors. Licensee MDPI, Basel, Switzerland. This article is an open access article distributed under the terms and conditions of the Creative Commons Attribution (CC BY) license (http://creativecommons.org/licenses/by/4.0/).
Share and Cite
MDPI and ACS Style
Henke, I.; Cartenì, A.; Molitierno, C.; Errico, A. Decision-Making in the Transport Sector: A Sustainable Evaluation Method for Road Infrastructure. Sustainability 2020, 12, 764. https://0-doi-org.brum.beds.ac.uk/10.3390/su12030764
AMA Style
Henke I, Cartenì A, Molitierno C, Errico A. Decision-Making in the Transport Sector: A Sustainable Evaluation Method for Road Infrastructure. Sustainability. 2020; 12(3):764. https://0-doi-org.brum.beds.ac.uk/10.3390/su12030764
Chicago/Turabian StyleHenke, Ilaria, Armando Cartenì, Clorinda Molitierno, and Assunta Errico. 2020. "Decision-Making in the Transport Sector: A Sustainable Evaluation Method for Road Infrastructure" Sustainability 12, no. 3: 764. https://0-doi-org.brum.beds.ac.uk/10.3390/su12030764
Note that from the first issue of 2016, this journal uses article numbers instead of page numbers. See further details here.