The Effectiveness of Urban Cycle Lanes: From Dyscrasias to Potential Solutions


1
Department of Engineering, University of Sannio, 82100 Benevento, Italy
2
Department of Civil, Architectural and Environmental Engineering; University of Naples Federico II, 80125 Napoli, Italy
*
Author to whom correspondence should be addressed.
Sustainability 2020, 12(6), 2321; https://0-doi-org.brum.beds.ac.uk/10.3390/su12062321
Submission received: 14 February 2020
/
Revised: 13 March 2020
/
Accepted: 14 March 2020
/
Published: 16 March 2020
(This article belongs to the Special Issue Sustainable Mobility: Social, Technological and Environmental Issues)
Abstract
:This paper studies the effectiveness of urban cycle lanes, with cycling being one of the most common practices for promoting sustainable mobility in urban areas. Despite a growing interest, the use of cycling in Italian cities has not gained a large consensus yet. Nevertheless, the presence and the extension of cycle lanes are considered as quantitative indicators for measuring the livability of cities. Actually, the lack in assessing the global quality of cycle networks asks for a major attention in the definition of these indicators. Starting from these considerations, the present study tries to propose a different approach to assess the real effectiveness of an urban cycle network. By defining some typological clusters of anomalies (dyscrasias) that can impede a safe and comfortable use of bicycles, the study achieves the definition of a method to evaluate the real effectiveness of an urban cycle lane. The case study of Naples represents a first trial both to check the method and to assess the state of the existing urban lane in order to verify its effectiveness.
1. Introduction
Sustainable mobility is one of the main objectives of transport policy at all territorial levels: local, regional, national, and European. The fight against climate change, for example, is one of the headlights of European transport policy [1], and air pollution, with particular reference to the concentration of particulate matter, is growing in serious concern. Since 2015, with the Declaration on Cycling as a climate friendly Transport Mode [2], the attention of the European policies has been focused on the importance of cycling and on specific infrastructure planning able to improve this way of moving, especially at an urban level. One of the main reasons standing behind this study is that, soft mobility being (and particularly cycling) a “climate friendly transport mode”, it improves the health of citizens too. Therefore, this study explores the opportunities linked to the spread of sustainable mobility at the urban level, stating that an adequate planning vision is primarily needed, which is able to make cycling not only a sustainable but above all a safe and enjoyable way of moving within the city for all types of users (citizens, city users and tourists).
At the municipal level, sustainable mobility is an indispensable objective for policymakers, at least in the major cities of developed countries. Among the strategies promoting sustainable mobility, the use of soft mobility (walking and cycling) is now widespread. Different approaches can be put in place for promoting cycling, from the construction of cycle paths to the use of bike-sharing systems, to incentives for the promotion.
This paper focuses on cycle lanes, addressing an often neglected issue related to their level of quality and real effectiveness. The effort of this study consists in searching a method to measure the urban lanes dedicated to cycling, considering their actual effectiveness. In fact, cycle paths in a city are usually measured only in terms of length, regardless of quality and effectiveness of the overall network. Geometrical (width, slope, etc.), construction (type of pavement), functional (reserved for bicycles or cycle-pedestrian), safety (visibility, signage, etc.), and connection (continuous network vs isolated and separated cycle lanes) characteristics significantly influence the perception of the cycle network and the propensity to use the bicycles. In this paper, we propose a methodology to "weigh" and measure a cycle network considering its characteristics; indeed, two cycle networks that have the same mileage development, even in cities that are similar in size and mobility system, can have a completely different impact on the diffusion of cycle use, according to their characteristics.
Therefore, the main objective of this study is to propose a method for measuring an equivalent length of the cycle network able to express its usefulness in urban areas. It stems from the need to investigate why the growing number of cycle paths does not lead to a proportional increase in urban cycling in Italy. In fact, despite an increase in urban cycle paths, to date the use of the bicycle is still low in comparison with many European countries (see Section 2). The authors’ opinion is that such low interest could be due to some structural deficiencies that may negatively influence users’ perceptions. These can also be thought of as some conditions that affect both the physical structure of the lane and the perception of it as not comfortable or dangerous to use. Actually, to be considered as viable and perceived as reliable, the cycle path must have at least two main features [3,4]: an uninterrupted track (continuity factor) and connections among each section of the lane and between the lane and the urban places (connectivity factor).
These conditions are often thwarted by anomalies that can be analyzed to set up a taxonomy of “irregular cases” to be avoided and gain the real effectiveness of urban cycle routes.
In this regard, this study aims at defining a method to measure the real usability of an urban cycle network. By assessing the “dyscrasias” that can arise along a cycle path, this study tries to pinpoint adequate interventions to optimize the design and the maintenance of urban cycle lanes. It can be observed that, in the context of this study, dyscrasias refer to the negative conditions that affect the quality and safety of the lane.
This study is framed in a wider research project aimed at verifying the possibilities of integration between the planning of soft mobility and the land use referring to the urban system characteristics. The theoretical and methodological approach refers to the city as a complex system composed of different subsystems connected to each other. This theoretical reference takes into account not only the physical elements needed for the planning of a safe and efficient cycle lane, but also the functional areas; thus, it is possible to refer to the lane as a “physical connector” between urban activities within the city context.
This paper is organized as follows. Section 2 examines the background of the problem. Section 3 proposes a methodology for measuring the real effectiveness of a cycle network. Section 4 focuses on a real case study, introducing a GIS-based approach. Section 5 concludes and discusses results and main research directions.
2. Background
2.1. Literature Review
The issue of urban cycle lanes can be framed in the wider context of sustainable mobility, even though it would deserve more specific attention [5], especially considering its relations with the objectives of sustainable and resilient cities [6,7,8,9,10,11,12]. The effort to focus on this relation, in fact, can be considered as one of the targets of this study.
In the last few years, scholars in mobility planning as well as planners are arguing that governments and decision makers at different levels should take cities and their planning more seriously [13].
Banister [14] already underlined the importance of sustainable mobility as an alternative paradigm within which to investigate the complexity of cities and to strengthen the links between land use and transport; especially, he introduced the concept that a city is the best place in which sustainable mobility can be encouraged. As the world’s urban population increases, sustainable mobility can only be tested in cities. This is the reason why cities are the focus point of current policies and strategies. Gabrielli et al. [15] have also underlined the importance of the social component to stimulate sustainable practices, noting that the engagement of citizens helps improving their trip behaviors in a more sustainable way.
In this regard, while the use of a bicycle in urban contexts has gained strength across several political levels (from the local to the national level), the design of urban cycle lanes has not yet gained the right consideration neither as a practice in urban planning, nor in technical projects, at least in Italy. This is probably mostly due to the belief that cities do not have the right conditions for cycling (topography, infrastructure, distribution of facilities and centralities, etc.) and, thus, the role of planners has been underestimated.
Bicalho et al. [16] have mapped the aptitude of population to cycling, using the Potential for Cycling Assessment Method (PCAM) [17] applied to the city of Oporto (PT). Authors showed that propensity can be depicted through a three-dimensional approach, considering three indicators: Target-Population (TP), Target-Areas (TA) and Political Commitment to Cycling (PCC). The first dimension (TP) refers to the propensity of the population to cycling, considering five parameters: Age; Population density; Car ownership; Education level and Student presence. The second dimension (TA) identifies areas in which physical characteristics facilitate the use of bikes: Accessibility to education facilities; Accessibility to city centers; Accessibility to railway stations; Occupation diversity; and Coverage area of cycling infrastructure and 30 km/h zones. The third dimension (PCC) refers to the effectiveness of the cycling policies in place. The PCAM is expected to support the development of policies for areas with diversified cycling potential, enabling the prioritizing of investments [16] (p. 100).
While very interesting for the object of this study, Bilcalho et al. [16] denoted a lack of interest in the assessment of the quality of the cycle lane that, by contrast, is the main target of this study. Despite the fact that the bicycle is increasingly recognized as a vehicle to accomplish sustainable urban development, major attention to the real usability of the cycle lanes in urban context is still needed.
Liu et al. [18] have tested the users’ point of view considering the opinion of practitioners from five European countries (the Netherlands, Belgium, Germany, United Kingdom, and Denmark) about the cycle highways. Their results show that, while practitioners are guided by infrastructural standards for cycle highways (such as width, design speed and intersection treatments), what is less clear is how these infrastructure elements fit within the surrounding environment to create desirable cycling experiences [18] (p. 2). In this regard, designers should consider a wide variety of user groups and their specific needs in the planning and design of cycle highways. Experiential elements, such as enjoyability, convenience, safety and attractiveness, are often mentioned in relation to physical design, along with concrete ideas, such as design speed, traffic separation, curves, traffic volume, and other measurable variables. The opinion showed in [18] has been very useful for the individuation of dyscrasias as defined in the following paragraphs, and the consideration of the different users’ needs can be a very interesting focus in order to integrate good design to the goal of improving the experience for urban cyclists.
The issue of cycling in cities may be examined by different points of view as this brief review has shown. This study also examines the scientific production on the topic of urban cycle lanes, for investigating the aspects connected to the assessment of their real effectiveness.
In this respect, this research examined two important scientific databases, Science Direct and Web of Science the ISI Thompson Reuters, to analyze the state of the scientific debate concerning the topic of “urban cycling”.
Science Direct (SD) is the platform of Elsevier publishing group that collects scientific articles, books and essays related to 27 scientific categories. In this database, the products have different levels of accessibility to the full text.
The Web of Science (WoS) platform is the multidisciplinary bibliographical/citation database of the Thomson Reuters publisher, which acquired the Institute for Scientific Information (ISI), and is the academic publishing service that defines the Impact Factor and other citation indexes. The repository allows the simultaneous querying of the three databases: Science Citation Index (SCI), Social Sciences Citation Index (SSCI) and Arts and Humanities Citation Index (AHCI). Therefore, it is useful for examining also those research fields that could be considered closer to the scope of the present study.
These databases were chosen for their interdisciplinary nature covering several scientific disciplines that deal with mobility and quality of life in general. The databases were consulted in September 2019 in two successive query-rounds.
In the first round, selection criteria referred to: a) the individuation of keywords in order to obtain a first selection of the products connected with the object of the research; b) check on the results; and c) selection of those products that could really represent a valid reference for our research.
In the second round, selection criteria referred to: a) language = English (diffusion); b) peer reviewed products (scientific rigor); c) research articles, book chapters, case reports (product type); d) the last 5 years of production (newness of the argument); and e) full texts access (openness and sharing).
As showed in Table 1, queries identified numerous products referring to the debate on cycling, especially if this theme is included in the larger topic concerning sustainable mobility in urban contexts. It is interesting to remark that the soft mobility subject has gained significant attention of the scientific research in recent years.
After the elimination of duplicates present in both databases, a more accurate selection has been carried out to assure that the contents fit the research. Therefore, products were excluded if: a) not accessible and not readable; b) not related to the topic of urban context; c) referring only to a review or a commentary; d) are only abstract; or e) case studies did not refer to European or Italian urban contexts.
Applying these criteria and using Mendeley and EndNote software to check for duplicates, the selected literature has been reduced to 37 papers that have been critically analyzed and then clustered into four categories according to the main topic (see Table 2):
- assessment techniques;
- behaviors and aptitudes;
- planning and design;
- policies for sustainable mobility.
The analysis of 297 keywords was performed with the software Textstat, setting the frequency range from 5 to 20.
Apart from the papers that focused on mobility and cycling and that, obviously, had the highest number of frequency, the results highlight a strong interest in the themes of “cycling in urban context” and “safety of cycle lanes”. This analysis represents a first upshot very close to the aims of this research.
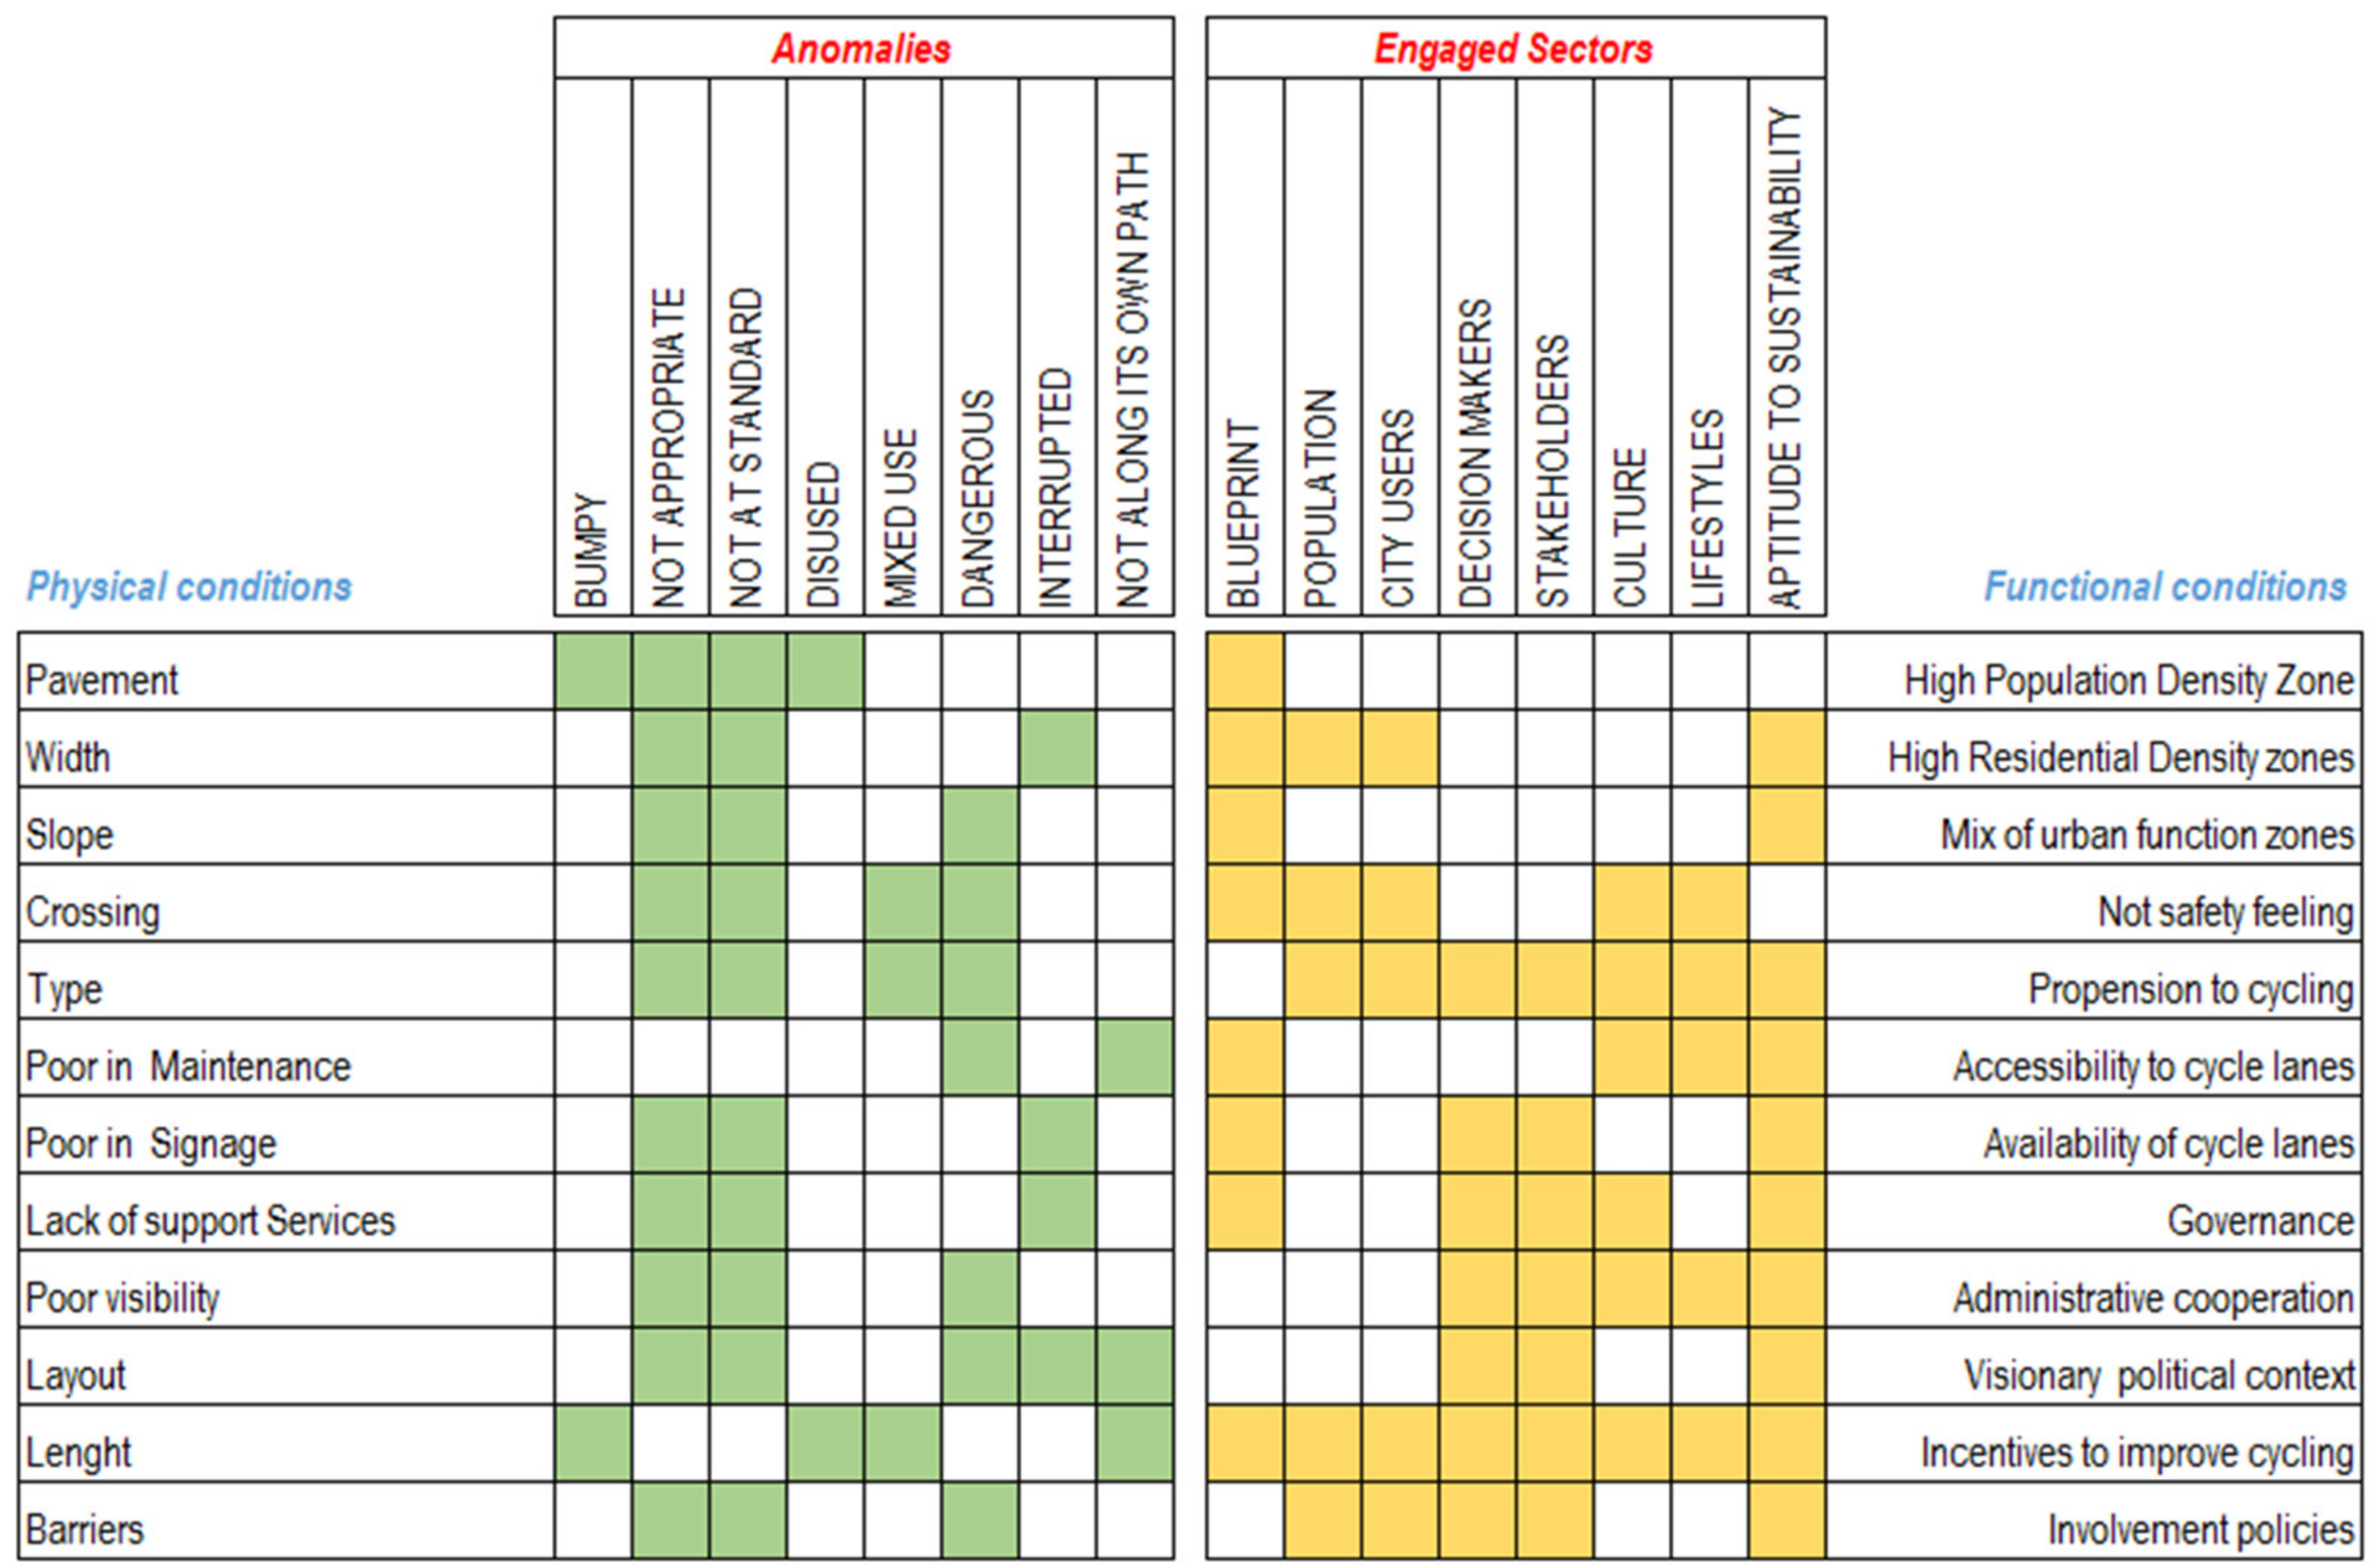
Figure 1 summarizes some results of this analysis. It identifies some recurrent physical and functional conditions along an urban cycle path that may influence the quality and effectiveness of the cycle network.
2.2. National Context
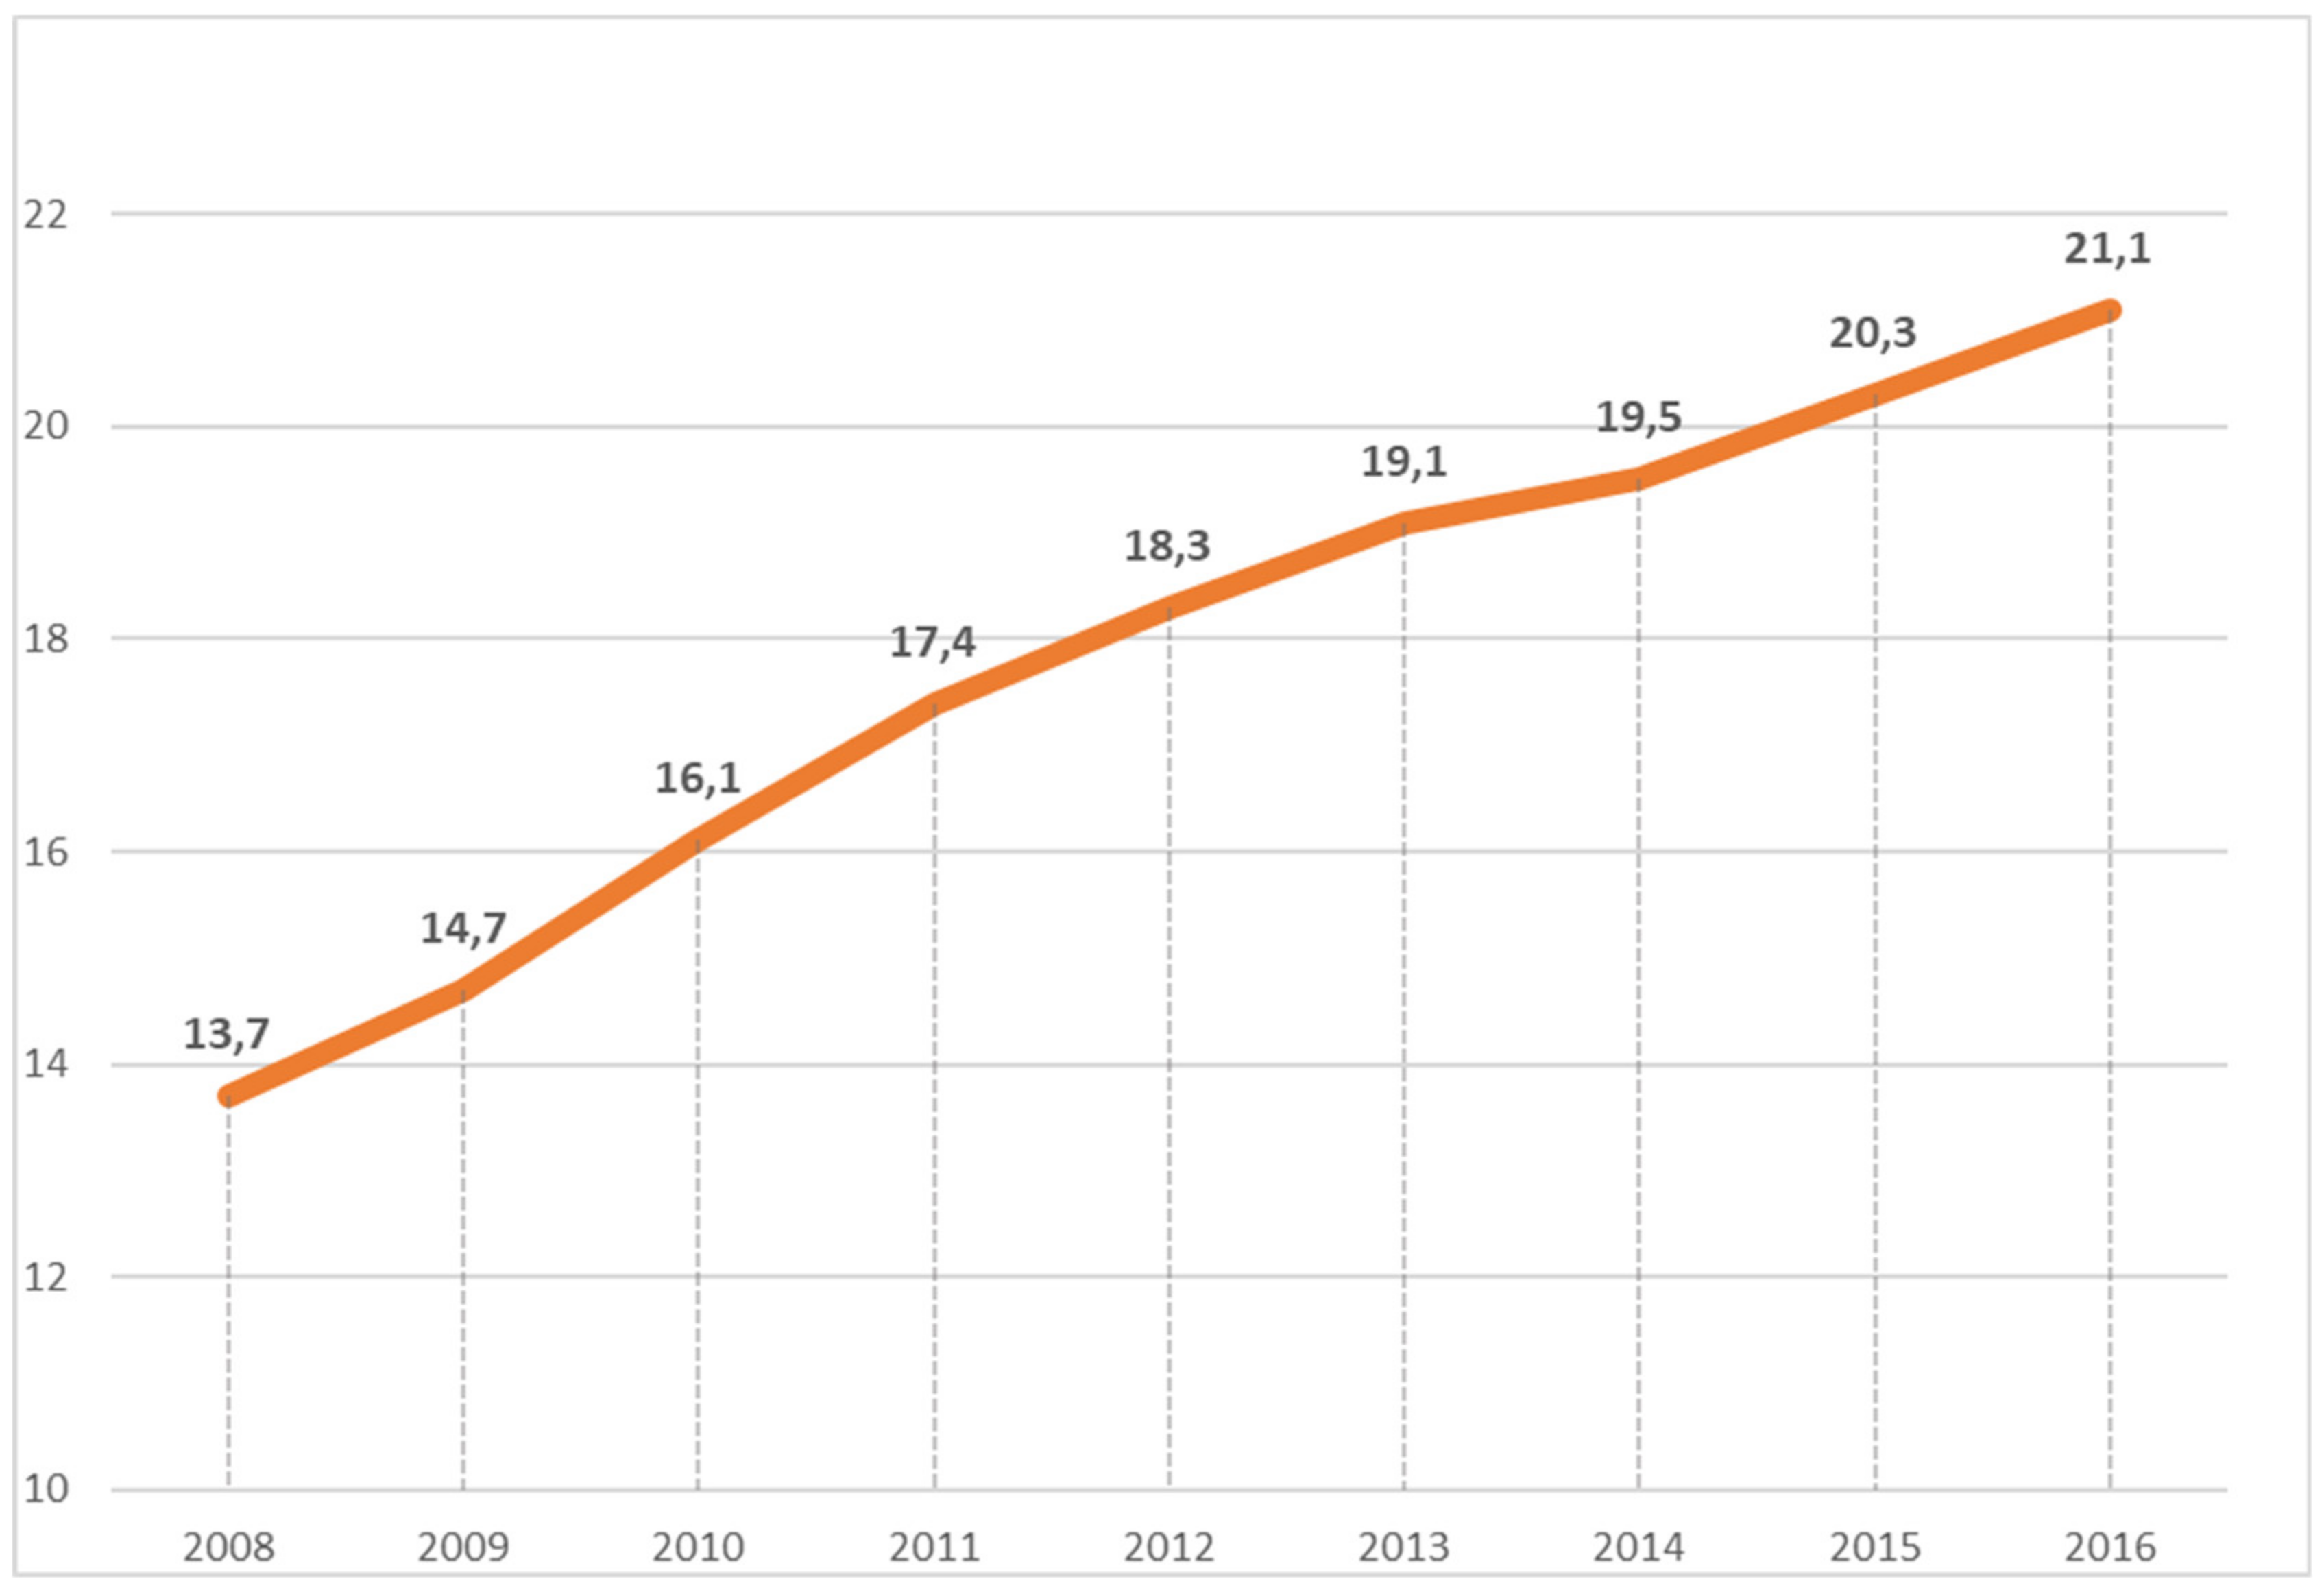
Italian cities still have a long way to run for achieving sustainable mobility in urban areas [52] and high levels of urban pollution and traffic congestion are still recorded. Figure 2 shows the motorization rate in Italy over the years; it can be noted that, despite the decreasing trend in 2004 and in 2013, the number of cars per 100 inhabitants in Italy is growing up over the years.
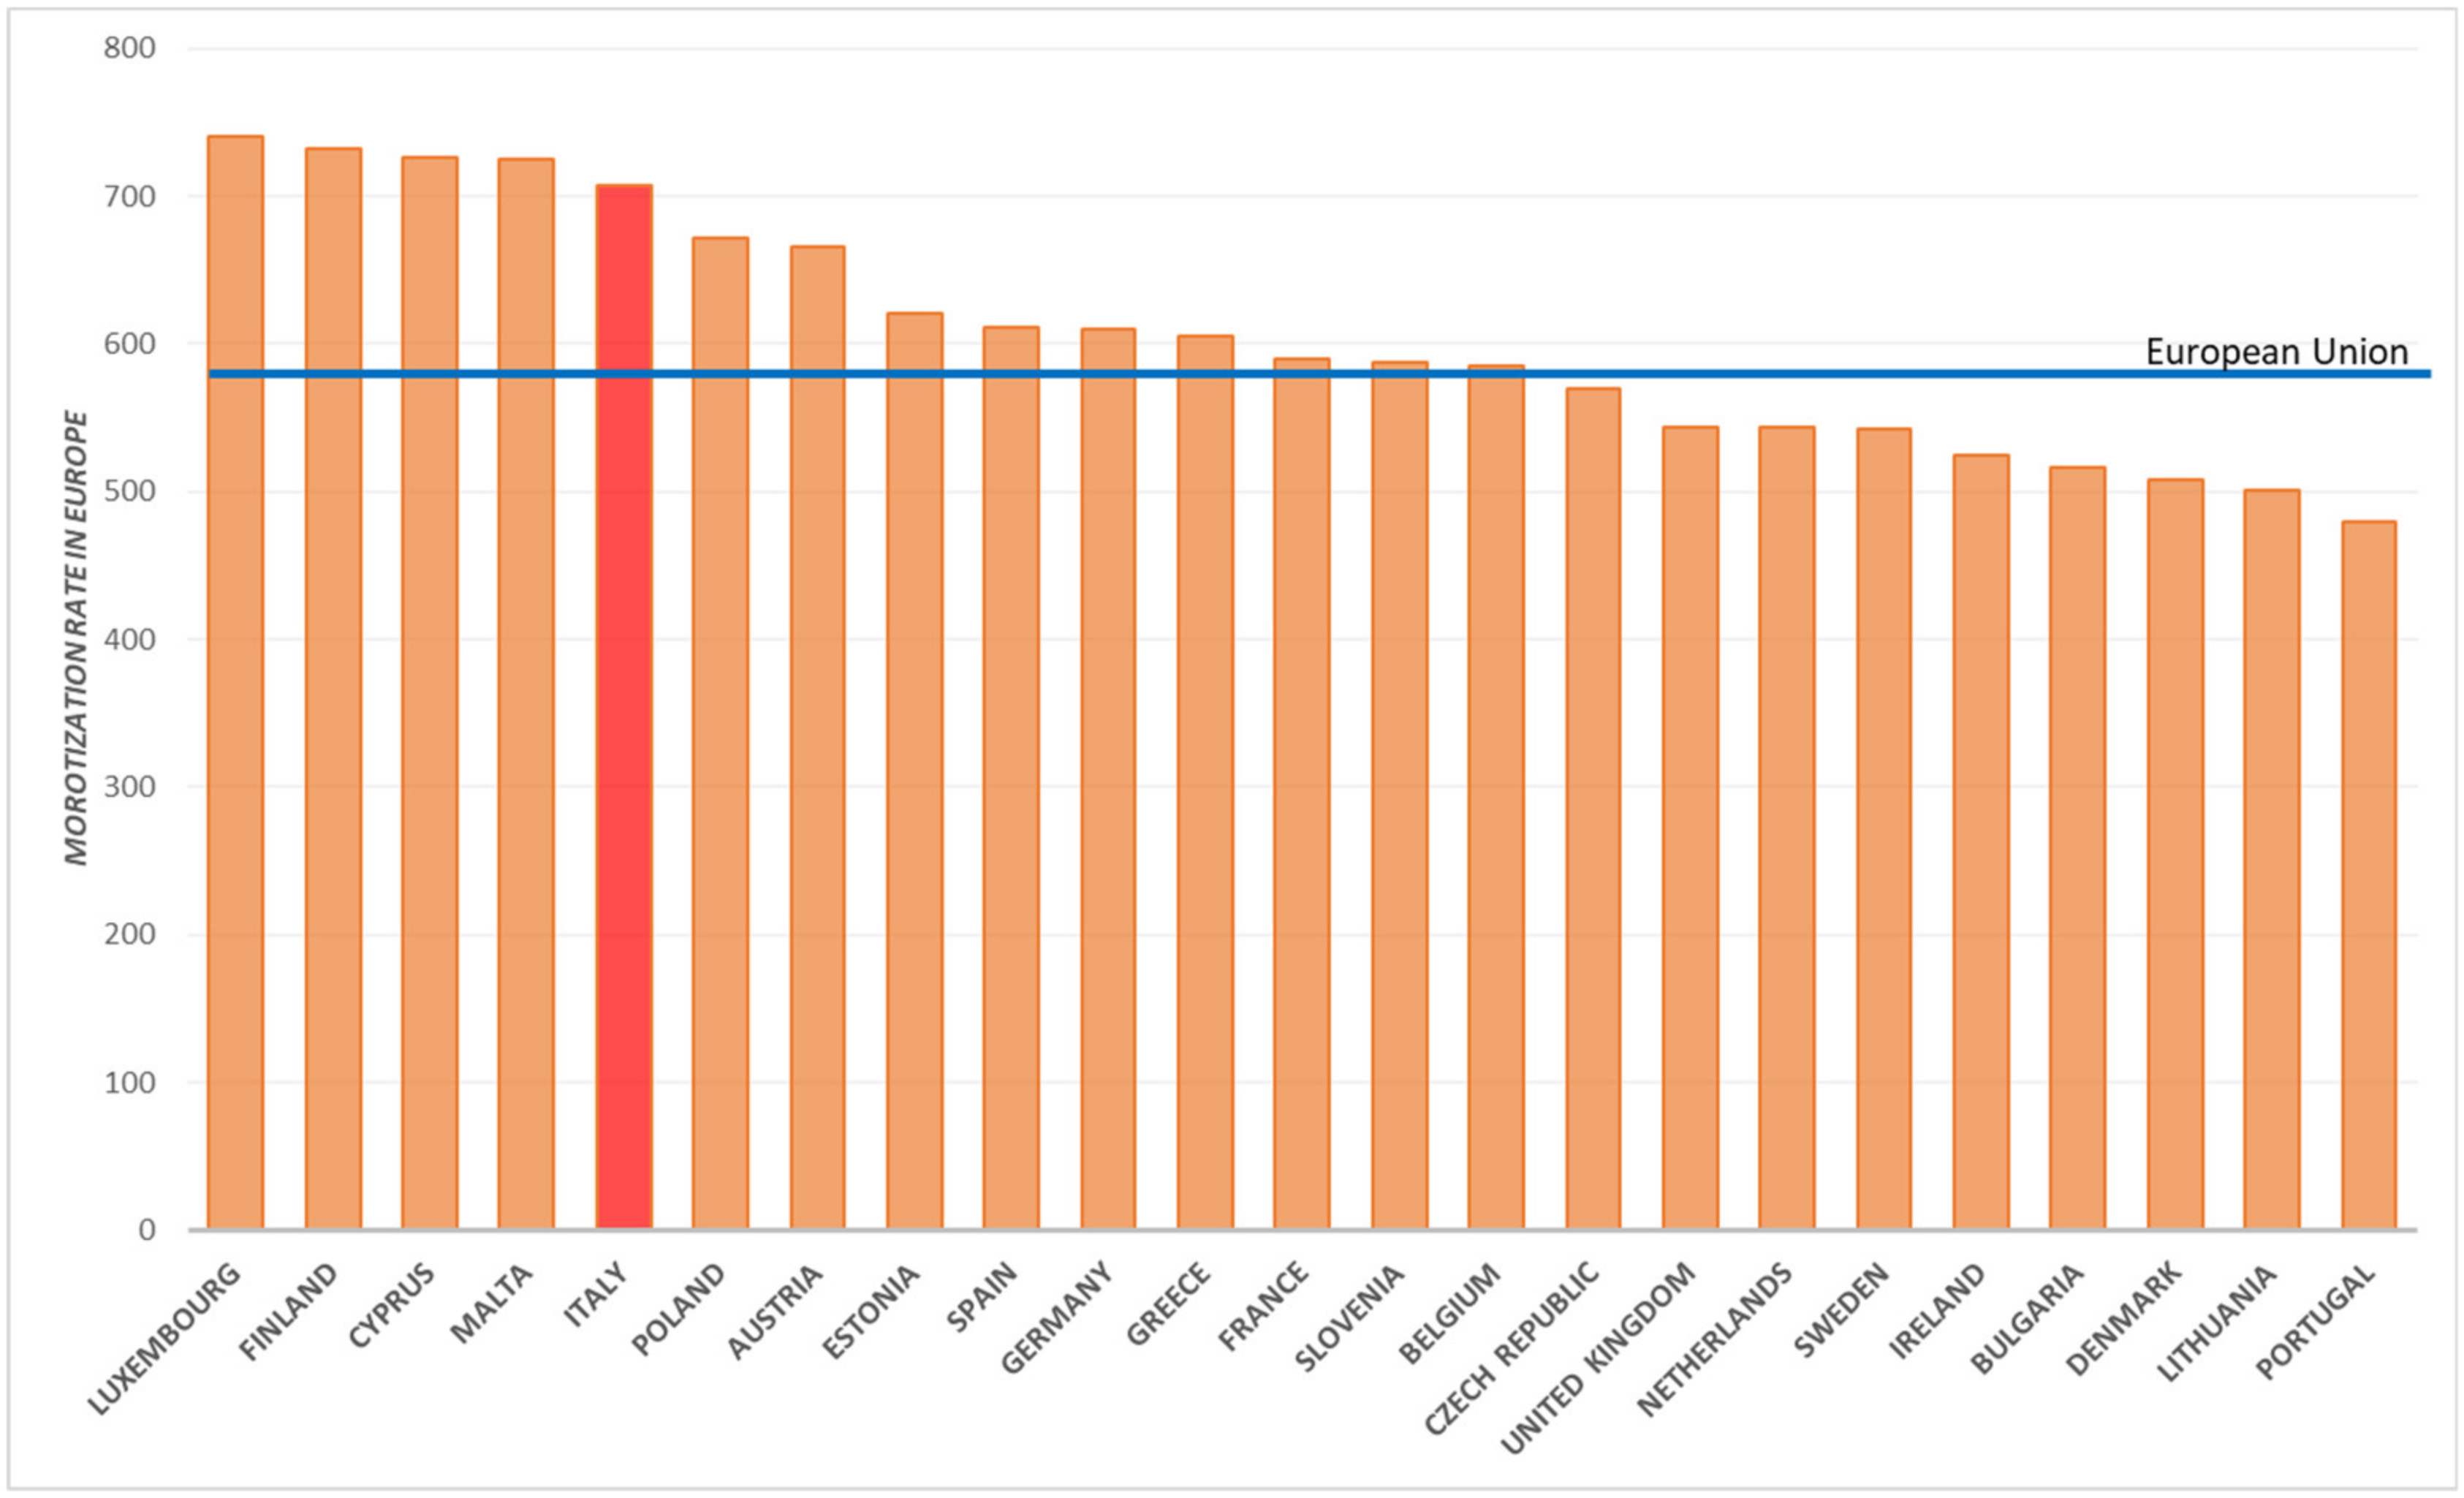
The Urban Ecosystem 2018 report by Legambiente [53] underlines the negative trend of Italian cities that are among the most motorized in Europe and informs that the cost of congestion due to private mobility has been of about 142 billion euros during the last 10 years. Figure 3 shows that Italy is one of the most motorized countries in Europe, since the value of its motorization rate (cars/1000 inhabitants) is significantly higher than the European average.
New possibilities for improving sustainable mobility in urban areas came from several forms of funding, which encouraged public administrations to provide cycle lanes (Figure 4), though the real fruition of these lanes often needs to be checked.
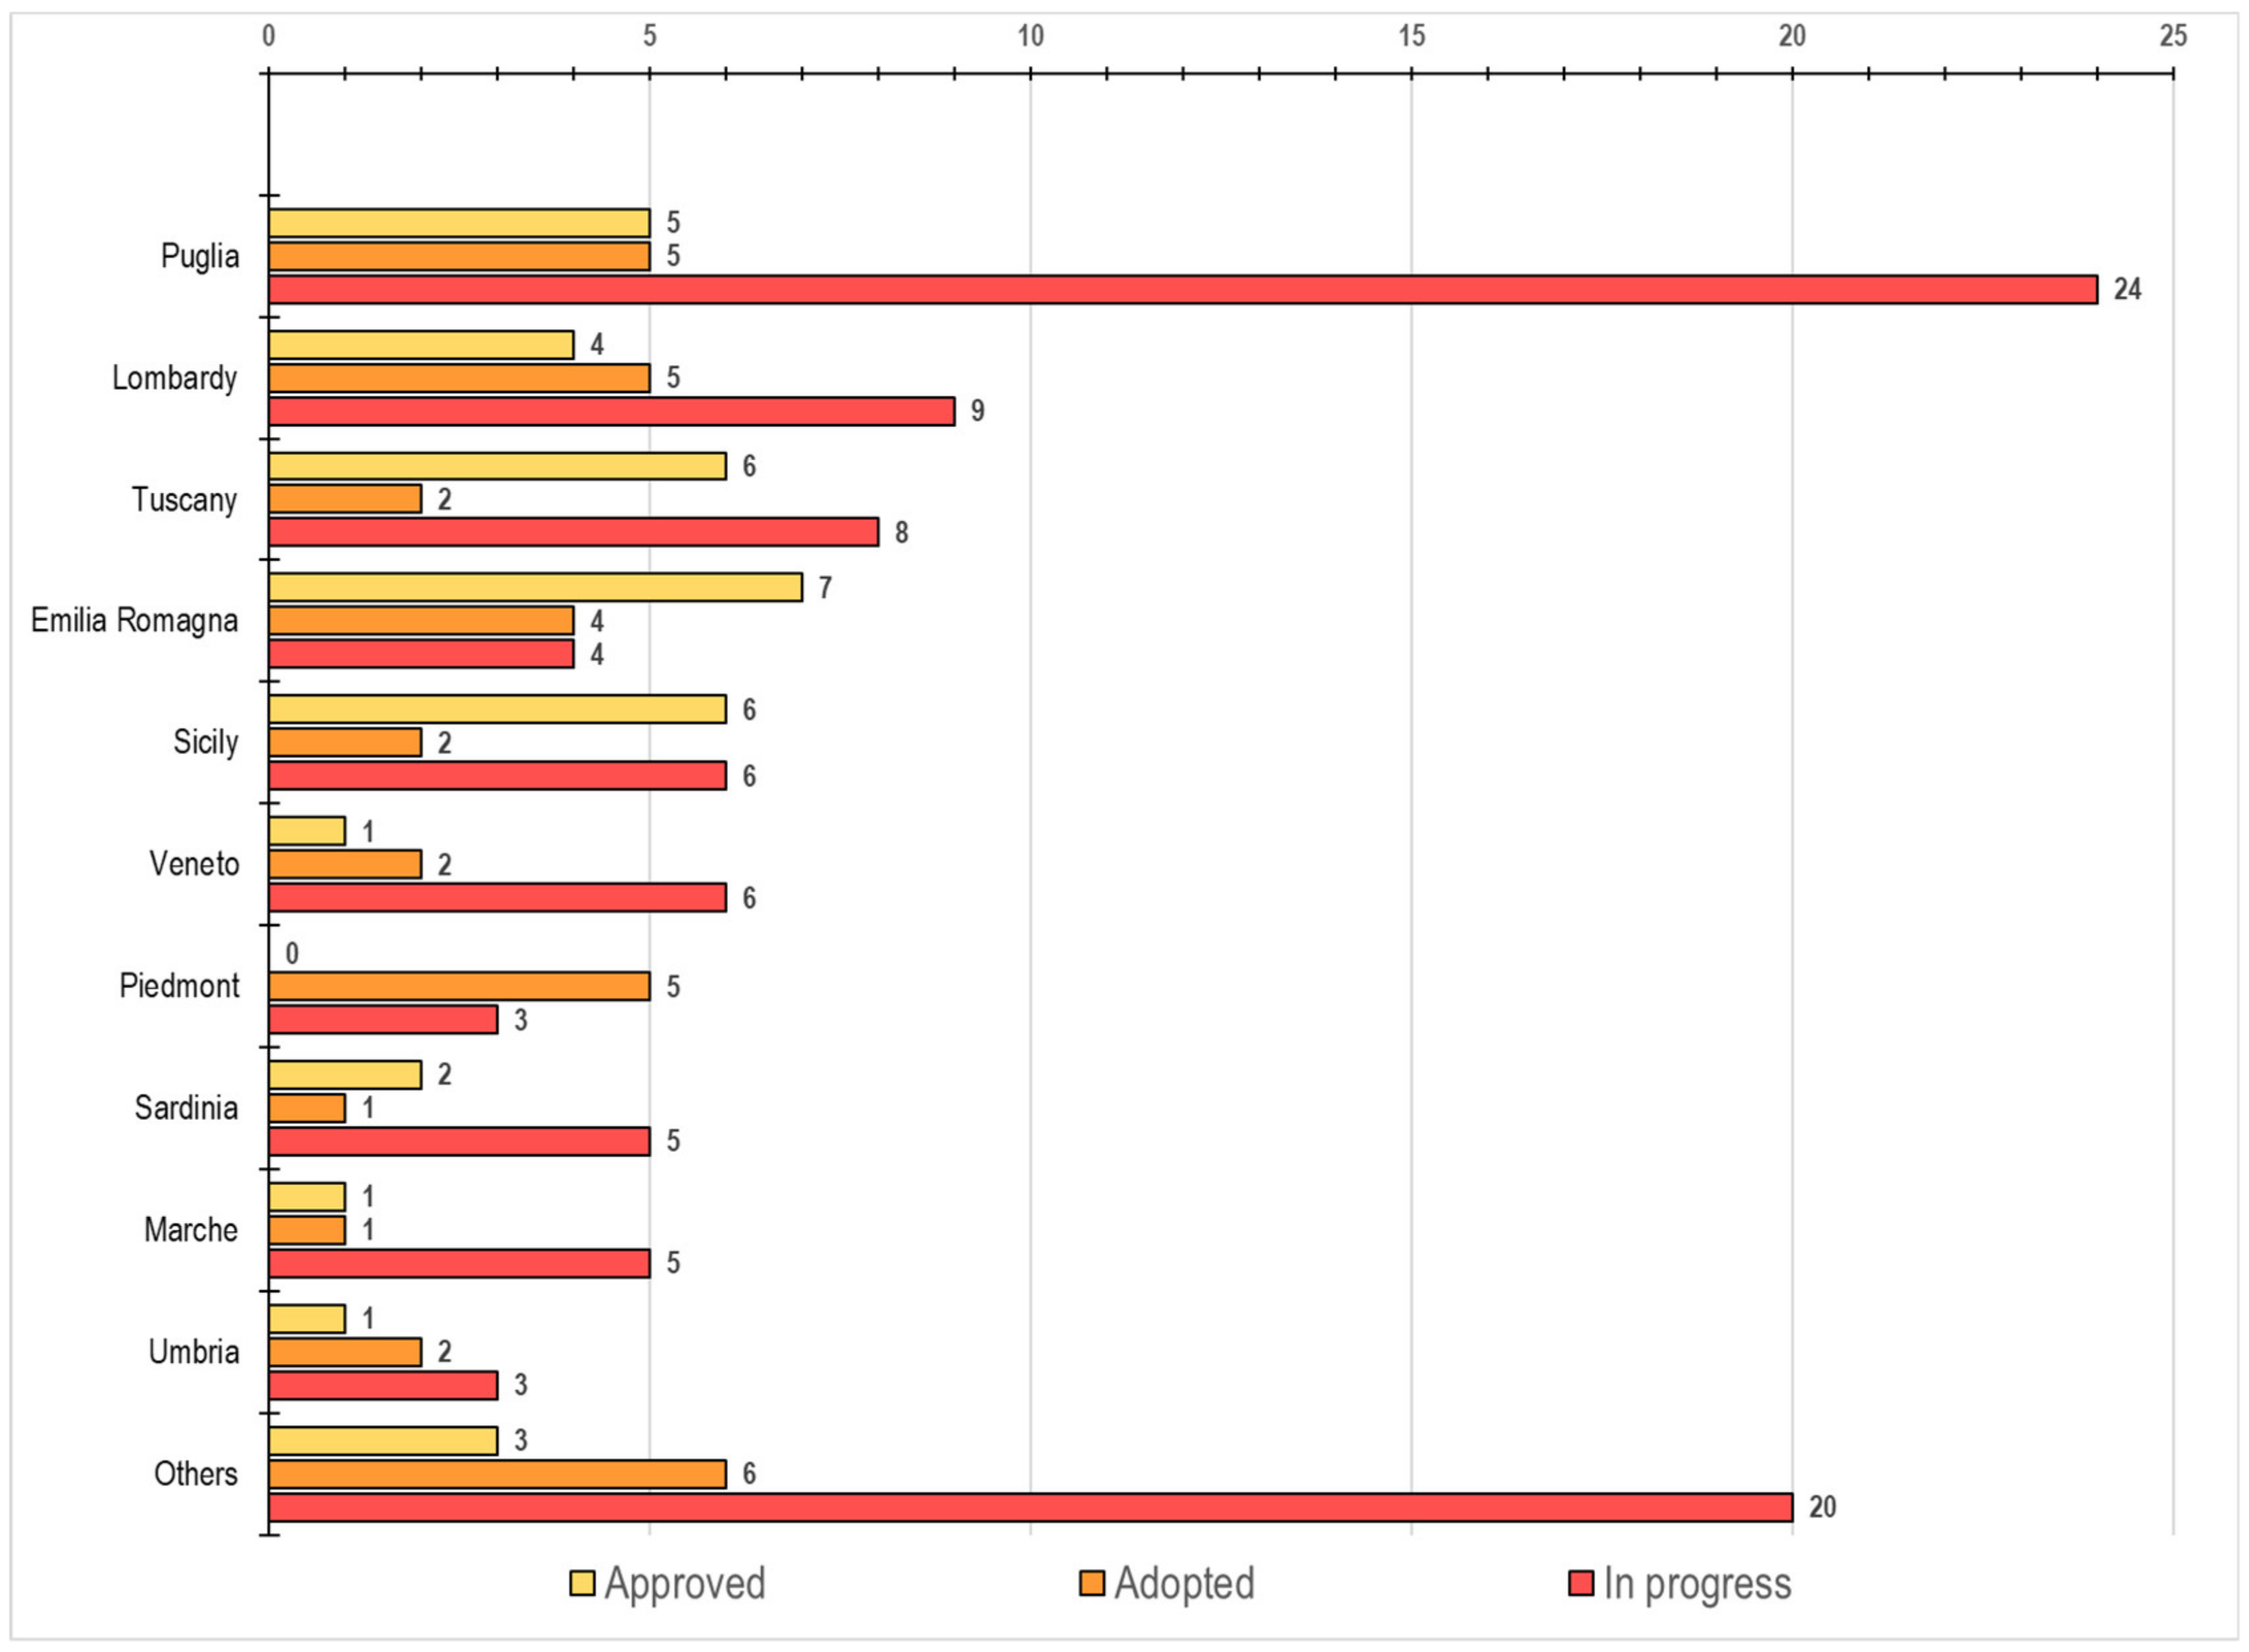
On the other side, many Italian cities promote sustainable mobility policies. The state of application of Sustainable Urban Mobility Plans (SUMPs) in Italy, for instance, is still heterogeneous in spite of the European indications and the guidelines introduced by Legislative Decree of August 2017. The observatory Endurance Italia refers to the state of the art of the SUMPs showing that (see Figure 5), thus far (February 2020), 36 cities approved a SUMP, 35 adopted it and 93 are drawing up a SUMP [55].
The number of SUMPs approved can be seen as an indicator of the aptitude towards sustainable mobility at a political and administrative level. Besides, taking into account that a SUMP has to be a participative plan, it could be also an indicator of the population propensity towards the use of sustainable mobility forms in the urban context. Cycling is surely one of these forms and the most largely used, probably also due to the present historical moment, in which people feel themselves to be part of a “revolution” needed to make a better “common future” [56].
The capability [57] to turn this change into real depends on different levels (political, social, economic) and especially on the interactions among them and their actors (decision makers, institutions, local administrators, people, residents, and so on). Cycling at urban scale in Italy suffers from this lack of interaction, and this makes it uncertain, discontinuous and sometimes degraded.
At the urban level, as concerns sustainable mobility and particularly cycling, the Biciplans are strategic plans for the planning of the cycling mobility promoted by FIAB (Italian Federation of Environment and Bicycle) in 2011, which, despite being technical and specialist tools, still remain at a conceptual level.
A great deal of attention has been paid to the attitude of Italian cities towards bike use by scholars and, even more, by associations and dedicated organizations that promote cycling and the use of soft mobility as a lifestyle. FIAB onlus [54], an association recognized by the Italian Ministry of the Environment (art. 13 L. 349/86), elaborated a report on the state of Italian cities with regard to their “suitability for cycling”. The report classifies cities according to four indicators (urban mobility, governance, cycling-tourism, promotion of policies for cycling) and gives a ranking of the spread and the state of the urban bike lanes in Italy (Figure 6). As shown in Table 3, very few cities per Italian region can be considered “suitable for cycling”; in fact, only 72 cities out of the total of 7998 are included in the ranking drawn up by FIAB. These numbers are evidence of how poor the culture of cycling in Italy is, despite a rising number of public projects both at national and regional levels that promote cycling at least as means for tourism mobility. As a matter of fact, mobility in Italy still depends greatly on the use of cars, even though some surveys [52] showed a “declared” propensity of people towards alternative transport modes for urban trips (see Table 4 and Figure 7).
In the European context, Italy holds a medium position, but it is lower with regard to frequency of bike use. Even though the rankings show the inclination to turn towards sustainable mobility, they do not give reasons about the difficulties users can meet, referring to the quality of existing paths and urban cycle lanes. They merely measure the length of existing lanes in kilometers, not taking account of their effective viability. By the state of viability of the cycle lanes, the quality of paving, the presence of efficient signage, safety conditions, and so on has been intended.
In 2018, ISFORT Report on behaviors of mobility in Italy showed the results of a survey aimed at valuating the propensity of Italians towards alternative ways for urban shifts. The question was: Which kind of transport mode do you think is alternative to the car and have to be improved by public funding?
2.3. Motivation
The literature review shows that, at our best knowledge, the real effectiveness of cycle lanes and networks had not been studied before and methods for measuring it were never proposed. Local administrators sometimes provide cycle paths and networks without a systematic approach.
For instance, in Italy the quality of life rankings consider the presence of cycle paths in the city as one of the evaluation indicators; this indicator is, however, calculated only on the basis of the length of the network, without any evaluation of its quality or effectiveness. This may lead policymakers, in order to increase this indicator, to build low quality and/or bike path sections non-organic with the rest of the network, only according to the available space and ease of realization. In some cases, this approach has led to bad practices, such as the case of a section of cycle path in Naples, on pavement with basalt, in an area with a strong commercial and pedestrian vocation and without any protection and division from pedestrian traffic.
This paper tries to overcome this problem, proposing a method for measuring the real effectiveness of a network of cycle paths that can address also the planning, design and maintenance phases.
3. Methodology
In order to assess the reliability and effectiveness of cycle networks in urban areas, a set of conditions that hinder the comfortable use of the cycle path or reduce its effectiveness was identified and classified into three types of conditions: spot, linear and global.
The first two can also be considered anomalies or dyscrasias with respect to an ideal condition.
Spot conditions refer to a specific section of a bike path where there is an anomaly with respect to the ideal condition (e.g., sudden interruption of the route).
Linear conditions refer to a section of a certain length (e.g., the width or slope of the segment).
Global conditions refer to the whole network, such as whether or not there is connection between the different sections.
Grounding on the previous literature framework and from the analysis of some examples of existing urban bikeways (Figure 8), a set of 10 dyscrasias has been classified and described in the following list.
- DYSC. 1 lack of connection between the cycle path and the main points of the mobility transport network within the urban context (railway stations, parking, underground stations, bus stations, etc.);
- DYSC. 2 unexpected changes in lane widths;
- DYSC. 3 uneven surface of paving (not-smooth paved path);
- DYSC. 4 poor maintenance of the path and lack of ancillary services;
- DYSC. 5 ghost tracks (sections of the track whose presence is not easily recognizable);
- DYSC. 6 unexpected disruption of the path (the path has not a starting or ending point, but it suddenly stops);
- DYSC. 7 promiscuous or dangerous crossings;
- DYSC. 8 presence of promiscuous sections (dangerous co-presence);
- DYSC. 9 presence of obstacles due to a misuse of the path (parking on the track, anomalous use of the path, e.g., presence of wheelchairs, strollers, etc.);
- DYSC. 10 lack or poor signage and services (horizontal, vertical, lighting, acoustic cycle route signs).
Detecting the dyscrasias listed above throughout an urban cycle path could help set up a method able to provide a synthetic expression of its inefficiency.
In further research developments, authors’ interest will be focused on the definition of different weights to be assigned to the detected dyscrasias also relating them to the territorial parameters (resident population, urbanized surface, length in km of the urban road network, etc.) according to the availability of data describing the urban context.
In the following, the proposed procedure will consider some of these anomalies.
The dyscrasias previously individuated and intended as anomalies (Table 5) can be related to the definition of typological clusters that correspond to the level of inhibitions for the use of a cycle lane in the urban context.
In this regard, a primary list of typological clusters can refer to:
- anomalies depending on design;
- anomalies that depend on organization;
- anomalies that depend on intersections;
- anomalies depending on the presence of obstacles.
The definition of a design vision inspired to a systemic approach is indispensable to create a real network of cycle lanes integrated within the urban system, in line with the needs of the city. The different rankings about the propensity of a city to be suitable for cycling have shown that the exclusive measurement of the length in km is not sufficient to assess the effectiveness of a cycle lane nor the urban livability.
In this regard, and according to the assumptions of the present study, an effective urban cycle lane should meet two main kinds of requirements:
- suitable design of each segment of the cycle path;
- supervision of the connections between each segment and of each segment with the network (points, nodes, lines, areas) of the existing urban mobility in the city.
The first requirement concerns the delineation of the cycle infrastructure with its single segments, taking care to assure high standards of design and safety, with particular reference to the width of the lane; the degree of separation between the bikeway and other public and private mobility flows (cars, buses, pedestrians, etc.); the quality of paving, lighting and protection of crossings (traffic lights); signals; and availability of ancillary services. Dyscrasias or irregularities could lead the cycle path far from these “ideal conditions”.
The second point concerns the connections between the cycle lane, its segments and the city form. It can be very hard to travel on a cycle lane not well integrated with the plan of the urban network of streets and places or cycle among pedestrians and motorized vehicular traffic. While travelling on a path integrated in a well-connected network of lanes and spaces can be safer and more comfortable for all cyclists.
In the context of these considerations, though in a preliminary phase, a method has been proposed to measure the real effectiveness of a cycle path resorting to the concept of “equivalent length”.
Considering a cycle path of 10 km having high structural and functional standards, its real length and its equivalent dimension coincide.
This is because the path is really usable for its total length (10 km). Conversely, if the path diverges from its optimal conditions, its equivalent length will be less than the real length. In this case, the path is not perceived as usable for its total length due to some negative conditions (dyscrasias) occurring along the way.
The concept of “equivalent length” thus refers to the real expendability of the path in optimal conditions, which means: good structural levels of usability and appropriate levels of safety.
In order to calculate the equivalent length of a cycle path, it is proposed to use the following equation:
where:
Leq = Σj (Lj × k1 × k2 ×...× kn) × Ccon − Σm hm
- Leq is the equivalent length of the path expressed in kilometers or meters;
- j indicates the generic segment of the route with homogeneous characteristics referring to the optimal conditions previously described;
- Lj is the length of the homogeneous segment j in kilometers or meters;
- k1, k2,…, kn are coefficients, whose value is less or equal to 1, which express how much the real characteristics of the track segment are far from the optimal ones (the value of these coefficients is equal to 1 in the optimal case); these coefficients refer to “continuous” dyscrasias (for instance, pavement quality or gradient);
- hm are terms expressed in meters (or km) that have to be used for considering the effects of spot dyscrasias (for instance, unexpected disruption);
- Ccon is a coefficient, whose value is less than 1; it measures the distance between the real condition of the path and the conditions concerning the optimal case of a fully connected network.
Coefficient k refers to the characteristics of a lane segment j and reduces the equivalent length considering the quality of the cycle lane in terms of efficiency and general quality of usability. At the present state of the research, it is possible to consider as significant the following coefficients:
- kw width of the lane (optimal width, kw = 1);
- ke separation from other traffic flows (exclusive and protected lane, ke = 1);
- kp paving (optimal paving, kp = 1);
- kl lighting (if present, kl = 1);
- ks signals (optimal signals, ks = 1);
- kg gradient (flat lane, kg = 1).
Term h, instead, refers to spot dyscrasias; its application reduces the total length of the network; for each dyscrasia (e.g., a non-protected crossing) some meters are subtracted from the total length (e.g., −50 meters for each non-protected crossing).
Further and more in-depth analyses are required to support the theoretical definitions through quantitative values and verify the validity of the hypothesis, though the current state of the research highlights some considerations referring to the coefficient of connection (Ccon).
Assuming the importance of an urban cycle lane to be integrated within a network that could propose itself as an urban infrastructure for sustainable mobility, it is possible to state the primary role of the coefficient Ccon, which can be expressed by the equation:
Ccon = (Σj Lj)/Lcon
In Equation (2), Lcon expresses the length of the network that can be obtained by adding some segments (as short as possible) to the current configuration of the path, in order to link the segments of the path together and thus to generate a connected network of cycling paths.
In Equation (1), the corrective coefficient “k” refers to the structural as well as functional characteristics of the cycle lane especially if it is located in an urban context. Among these coefficients, the paving has a fundamental role both for the level of safety and for the design of the cycle lane, and the issue can be more important than it seems.
The quality of the road transport system is strictly related to the quality of the road pavements (an engineered system of multiple layers able to transfer vehicle loads to the ground and provide a smooth and safe rolling surface over time). In this vision, it is quite clear that the roads’ quality necessarily depends on a variety of variables that all together concur to its outline.
The use of alternative materials to replace limestone or reduce neat bitumen as a binder in road paving constructions represents an innovative process that fully meets LCA requirements (ISO 14040, ISO 4044), defined as an objective procedure for assessing energy and environmental loads connected with a process or activity that can be carried out by identifying the energy, the materials used and the waste released into the environment for a specific process called “from cradle to new cradle”.
Many researchers are focusing on cycle path construction materials to improve safety during cyclists’ journeys, especially in rainy conditions or at nighttime, in the case of inadequacy or absence of public lights; the choice of bike tracks and materials adopted for their construction is based on an environment-safety integrated approach: the materials used, above all for the pavement surface, should have accurate mechanical performance but, at the same time, they should contribute to improving the scenic beauty and reduce negative impacts on the surrounding environment.
The Federal Highway Administration (FHWA) [58] defines bicycle facilities as improvements and reasonable amenities and provisions to accommodate, enhance or encourage bicycling, including but not limited to bicycle lanes and paths, traffic control devices, parking, storage facilities, and bicycle sharing systems.
A sustainable design approach can be used to build cycle paths, above all pavements, by selecting on the one hand raw secondary materials for the mix design, reducing the amount of waste produced going to landfills, and on the other hand alternative and innovative materials such as colored pavements and transparent binders.
Bike pavement solutions that contemplate the use of innovative transparent binders instead of the traditional black bitumen, integrate seamlessly with the environment, emphasizing its natural colors in contrast to the greyness of urban settings.
Colored cycle path pavements increase users’ safety since the use of the colors green and yellow in combination with bright lateral markers can much more improve their visibility in nighttime conditions. These solutions are really useful to discourage any drivers from parking on bicycle lanes that are not physically crossed by the remaining carriageway.
The National Association of City Transportation Officials (NACTO) reports that in the United States methods for coloring bicycle facilities are evolving rapidly. These methods involve material selection, application techniques and the impact of climatic factors.
The FHWA has specified, for example, the shade of green in terms of daytime and nighttime chromaticity for bike lanes; green colored pavement may be retro-reflective.
The pigmented pavement used in Europe refers to any asphalt or concrete with pigment added to the mixture prior to the placement; compared to pavement coatings, pigmented pavements are expected to offer superior durability.
The light color of the material also leads to low heat absorption, guaranteeing moderate temperatures for surfaces that are exposed to the sun.
These characteristics enhance faster heat dissipation and a reduction of the heat island effect. Other solutions can also be adopted in connection with colored pavements, such as cold laying that is an environment-friendly operation where low emission of fumes, low risk to the safety of operators and a significant saving in energy requirements for mixing can be recognized.
This aspect is crucial for identifying the optimal paving that corresponds to a value of 1 for the related coefficient k, and for calculating the value of this coefficient for the other pavements, different from the ideal one.
4. Numerical Example and Case Study
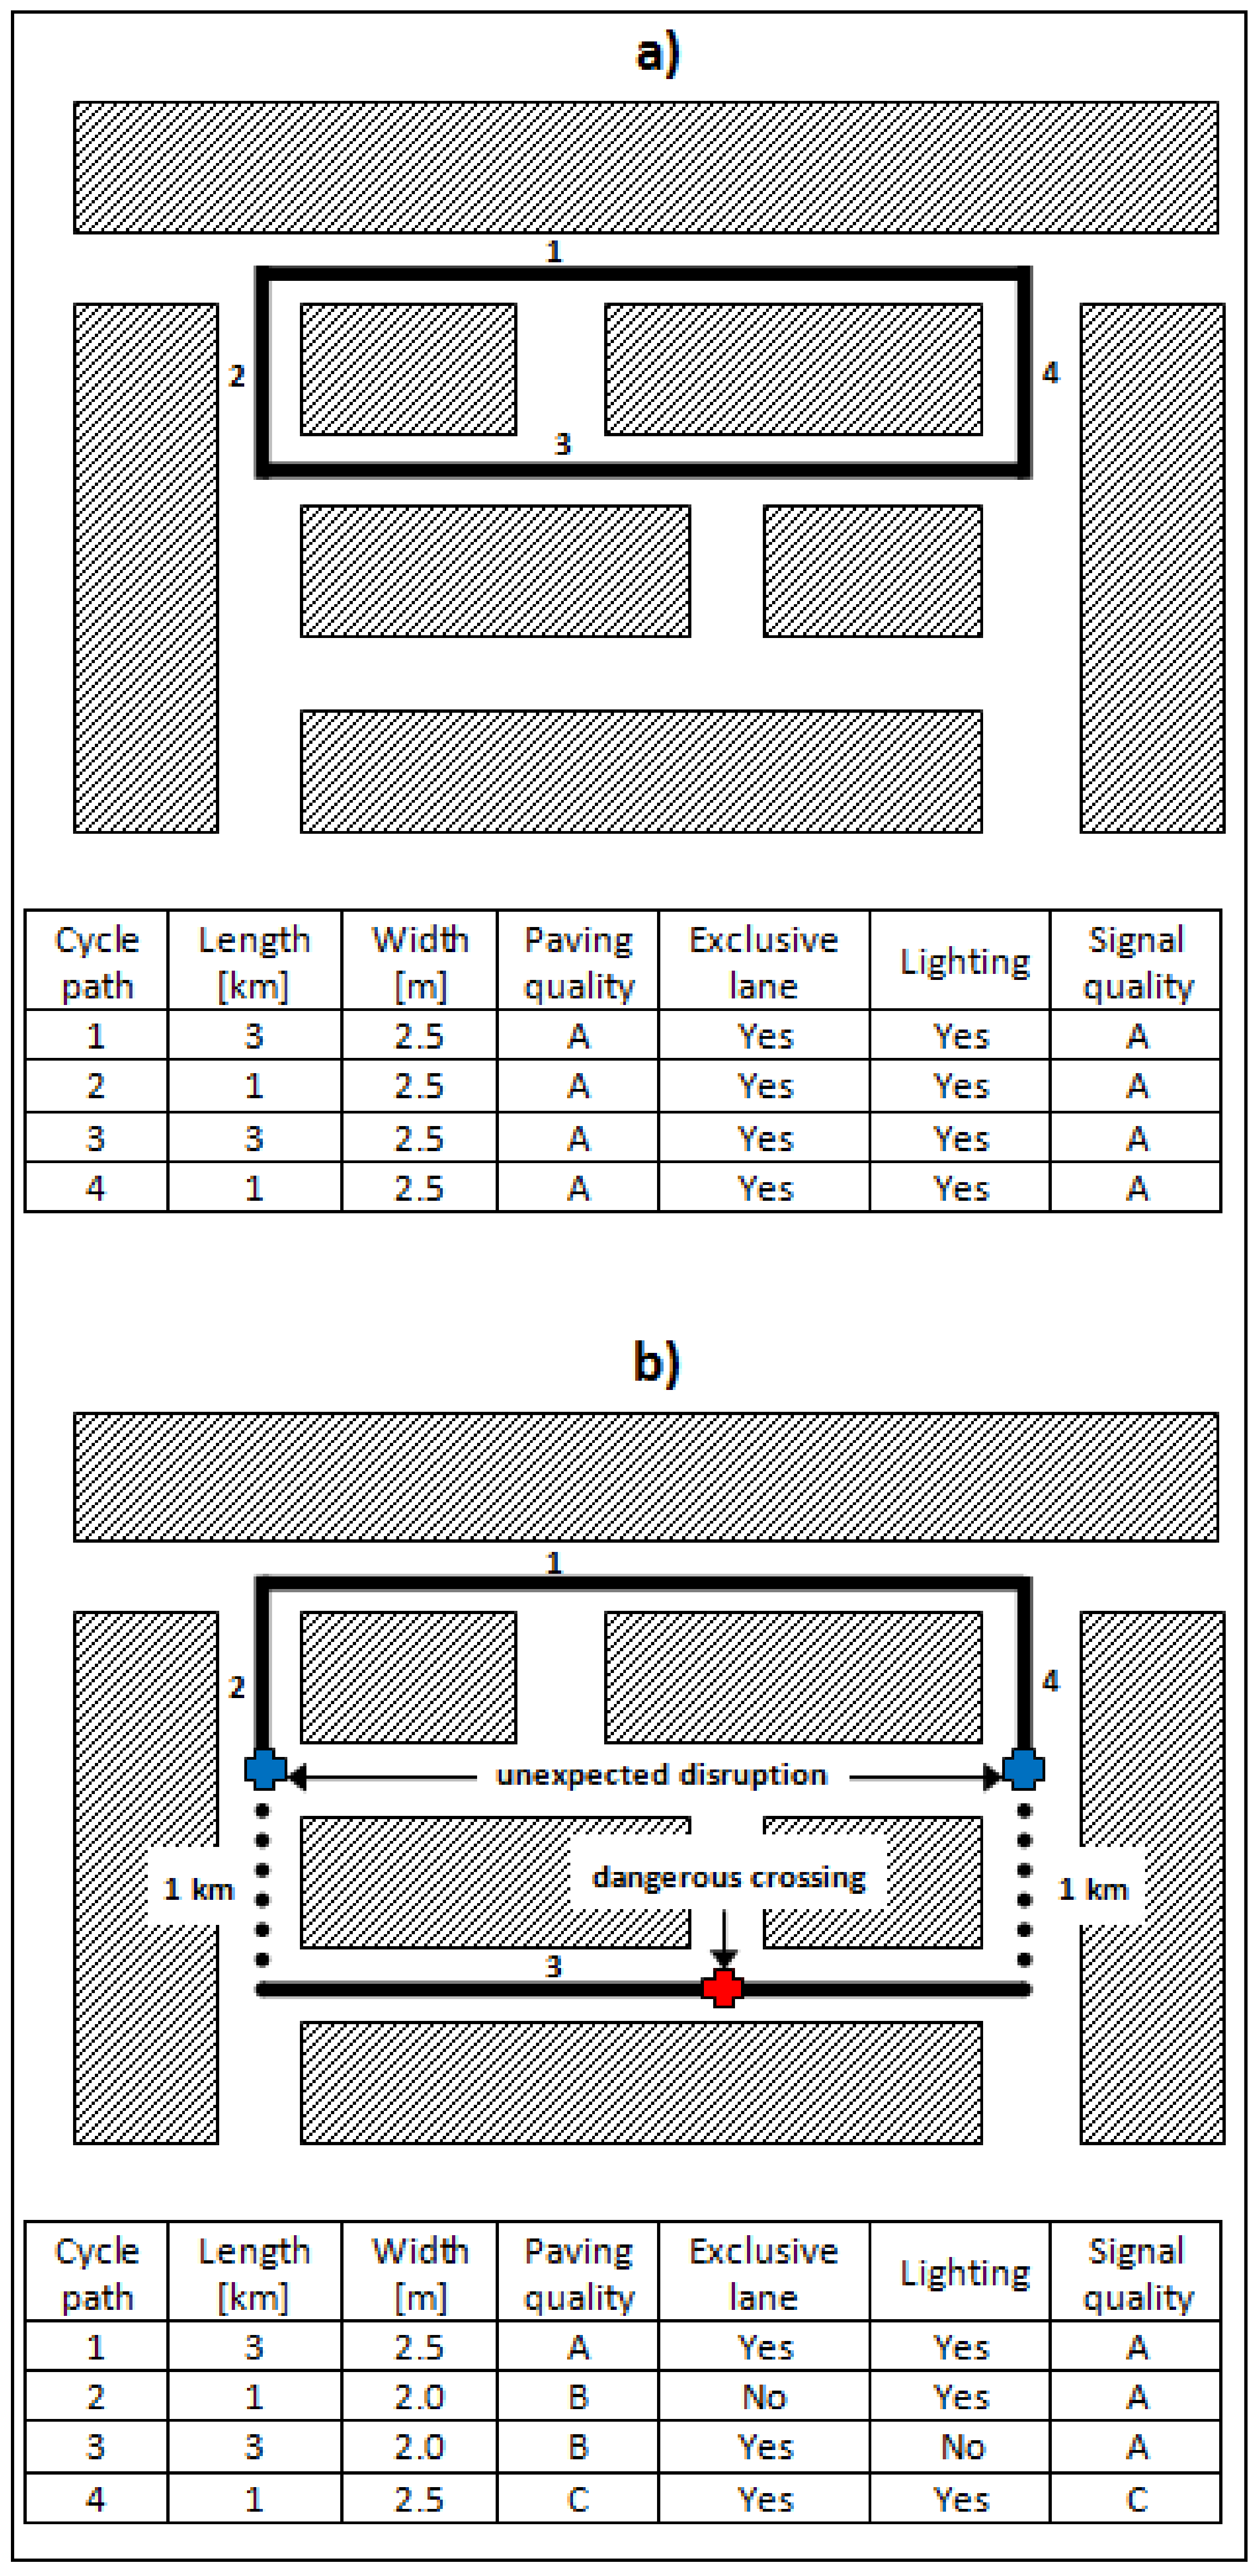
In this section, the description of the methodology and its application to a schematic trial network, comparing an “ideal” case with a non-ideal one with the same total length, has been proposed. Figure 9a shows the example of an ideal bike network, with all ideal conditions and without spot dyscrasias. The paving quality and signal quality are indicated with an evaluation rate from A (best) to F (worst). The real length of this network is 8 km and the equivalent length is 8 km too. Figure 9b, instead, shows another network, where the conditions are different from the ideal one.
The equivalent length of the network b) is calculated as follows, using the proposed approach:
where L1, L2, L3, and L4 are the real lengths of each cycle path.
Leq = [(L1 × kw,1 × ke,1 × kp,1 × kl,1 × ks,1 + L2 × kw,2 × ke,2 × kp,2 × kl,2 × ks,2 + L3 × kw,3 × ke,3 × kp,3 × kl,3 × ks,3 + L4 × kw,4 × ke,4 × kp,4 × kl,4 × ks,4) × Ccon] − kD,1 − kD,2 − kD,3
The coefficients k are calculated or assumed as:
- kw,1 = kw,4 = 1 (width 2.5 m is assumed as “ideal”), kw,2 = kw,3 = 0.8 (2.0/2.5);
- ke,1 = ke,3 = ke,4 = 1 (Yes), ke,2 = 0.7 (No);
- kp,1 = 1 (rate A), kp,2 = kp,3 = 0.9 (rate B), kp,4 = 0.8 (rate C);
- kl,1 = kl,2 = kl,4 = 1 (yes), kl,3 = 0.7 (no);
- ks,1 = ks,2 = ks,3 = 1 (rate A), ks,4 = 0.8 (rate C).
The term Ccon is calculated considering that it is possible to connect the network by adding 1 km of the cycle lane: Ccon = 8/9 = 0.89.
The coefficients kD refer to the spot dyscrasias and are assumed to be equal to 100 m. Under these assumptions, the equivalent length is given by:
Leq = [(3 × 1 × 1 × 1 × 1 × 1 + 1 × 0.8 × 0.7 × 0.9 × 1 × 1 + 3 × 0.8 × 1 × 0.9 × 0.7 × 1 + 1 × 1 × 1 × 0.8 × 1 × 0.8) × 0.89] − 0.1 − 0.1 − 0.1 = 4.73 km
It is clear that the numerical value corresponding to each rate from A to F and the definition of rate for each condition have to be accurately studied and defined, as well as the values of spot dyscrasia coefficients. In further steps of the research work, some specific surveys aimed at gathering the opinion of users will be devised to better define these points of the method.
Another important aspect of the proposed methodology concerns the identification of dyscrasias and the construction of the database necessary for its application.
In this part, a test of the methodological considerations has been carried out on the city of Naples as a meaningful sample both to check the visible anomalies and validate its compliance with the image of a smart and sustainable city that politicians try to propose.
The existing bikeway of Naples has been analyzed referring to the metropolitan municipality ordinance concerning sustainable mobility (2012) [59] that declares the creation of a cycling path connecting the city from Bagnoli (west side) to Piazza Garibaldi (east side), covering a total length of 20 kilometers.
The main characteristics of the path are illustrated in Table 6 according to the description in the municipal ordinance [59]; the last two columns refer to Legambiente criteria assigned to the bikeway of Naples. In a second phase, a direct analysis was developed to verify the conformity between the path as described in the municipal ordinance and the real condition of its usability, in its present configuration (October 2019). In particular, in the Urban Ecosystem report, elaborated by Legambiente [53], different sections composing a cycle path in the urban context are classified as follows: 0.5 points if the path has a reserved lane; 0.3 points if the path has mixed sections (bicycle/pedestrian); 0.2 points if the path is within a Zone 30.
Data coming from direct investigations have been compared with the 10 typologies of dyscrasias before mentioned, in order to individuate the weaknesses of the path and the points or segments that need priority interventions.
Table 7 shows the relation between the composition of the cycle path and the dyscrasia occurrences computed in the percentage of the total length of the path.
In its present configuration, the urban cycle path of Naples presents dyscrasias mainly connected to the lack of adequate signage: 35% of the path is not well marked especially in mixed sections (bicycle/pedestrian) characterized by a huge density of urban activities (e.g., along the commercial area of via Toledo and via Chiaia). Fifteen percent of the existing path is characterized by dangerous intersections between vehicular traffic and the cycle path; in fact, in some parts, bikes must be walked (e.g., close to Galleria Laziale).
Some segments of the path have not reserved lanes yet and might therefore be dangerous as cyclists are not protected from vehicular traffic. At the current state, the results of the field test have not yet considered the weight that each dyscrasia can assume in the global evaluation of the effectiveness of the path; however, some considerations can be equally elaborated, based on the analysis of the characteristics of the path.
Dyscrasia related to the lack of a systemic vision in the design of the path can be considered incoherent with the idea of an urban cycle lane that aspires to be a compelling alternative to improve sustainable urban mobility. Dyscrasia linked to the dangers that arise especially in the mixed sections can be clustered as conditions of shortcomings that denote a lack of dependability of the path.
In the following part of the study, some reflections have been elaborated considering the characteristics that mark the typologies of dyscrasias individuated.
The specific target of Equation (1) is the individuation of the segments of the lane that can be considered “homogenous”, having good structural and functional conditions as their main features and, thus, reliable segments of the whole path. In fact, as stated above, the equivalent length is the sum of the segments that have optimal conditions. In many cases, these segments are interrupted when a dyscrasia occurs along the path.
Is it possible to individuate the points in which dyscrasias occur? The authors’ intention, in this part of the research, has been focused on answering this question by using the GIS technology, specially referring to the network analysis. To better explain the target of this part, a technical procedure has been drawn up.
The procedure has been tested on the existing cycle lane of Naples both to check its compliance with the real conditions of viability and to have a direct control of the feedback coming from the application of the procedure itself.
The first phase has been focused on the drawing of the urban cycle lane of Naples. Using Google Earth (GE) as a virtual exploration, it has been possible to depict the whole path and, at the same time, to individualize the single point in which a dyscrasia occurs.
Google Earth allows for the development of successive elaborations in GIS. The drawing file elaborated in GE, thus, has been imported in QGIS, whose utilities allow for the creation of a geo-referenced database containing all the information about the structural characteristics of the cycle lane, the localization of the points and the lines where dyscrasias arise, the typology of dyscrasia occurring, and the type of segment of the cycle lane, individuated according to the Italian Ministerial Decree n. 557/1999. Querying the database, it is possible to identify all the dyscrasias and, thus, the segments of the cycle lane that have problems, or on the contrary, those with the best performances (Figure 10, Figure 11 and Figure 12). The decree indicates the typologies of the urban cycle lane, in order of their safety level: a) own cycle paths; b) cycle tracks on reserved lanes obtained from the sidewalk; c) cycle tracks on reserved lanes obtained from the roadway; d) promiscuous pedestrian and cycle paths; e) promiscuous cycle and vehicular routes.
The outputs of the procedure and the queries consist in the measure and the simultaneous visualization on the map of the segments of the cycle lane that can be really travelled in optimal conditions. The real-time control points out the anomalies and the segments of the cycle lanes where to assess priority intervention. This could be very useful for the administrative office in charge of the design and the maintenance of the cycle lane.
5. Discussion and Conclusions
This study dealt with the urban cycle lanes intended as the infrastructure that can improve sustainable ways of moving in the cities. In the framework of the European policies, cycling has been recently considered a “climate friendly transport mode” as it concerns both sustainability and people health. According to the thesis of this study, beyond these unconfutable requirements, the improvements of cycling in the urban context must also be a safe way of moving and enjoying the city. This last condition requires integration between mobility infrastructure planning and land use planning in order to guarantee high effectiveness of the urban infrastructure for sustainable mobility. The effort has been aimed to point out a methodology able to evaluate the real effectiveness of the cycling infrastructure that is sometimes much less usable than what administrations proclaim to get the label of sustainable or smart city.
Actually, the increasing attention towards cycling as a means for improving sustainability is not enough supported by an effective use nor by a propensity of citizens for cycling rather than for car use, even in urban contexts and especially in Italy. The issue is even more interesting if referred to several rankings about the cities’ livability that consider exclusively the density of cycle lanes calculated as their extension with respect to the municipal area. This indicator, however, does not consider the different types of segments that make the whole cycle lane, which can be very different from each other, both in terms of quality and structural characteristics. The indicator elaborated by Legambiente [53] in its annual Urban Ecosystem report differs from the others because it considers the equivalent meters related to 100 inhabitants, but it does not give reason of the quality of the cycle lane; hence, it is still a quantitative parameter giving information about the length. Moreover, the anomalies that can be found along the path are never considered, so that also the equivalent meters considered by Legambiente are limited to the typological classification of cycle lanes as reported in legislation.
The effort of the present study consists in proposing a different way of assessing the urban cycle lane. It investigates the possibility of calculating an “equivalent length” of an urban cycle network that corresponds to its effective usability. Considering that soft mobility represents one of the main drivers towards the sustainability and the smartness of an urban system, this method can be a quick way to evaluate the real contribution of the urban cycle lanes to this main objective. In other words, the effective contribution of an urban cycle path to the general sustainability of the city must be assessed in relation to the characteristics of the route that allow its continuous and plain fruition. We are now going further on the study trying to identify a threshold of effectiveness (in terms of plain fruition of the cycle network) and taking into account what are the origins and destination of the path, by defining an urban penetration factor. The use of the GIS environment helped demonstrate that it is possible to implement methods and tools to manage the state of the infrastructure that can have a strategic role in improving the sustainability of present cities. Aware that more in-depth analyses are needed to strengthen the thesis of the whole work, it could be appreciated the interdisciplinary nature of the research team engaged in this study, as it shows that the town planning and mobility system can match trying to define integrated solutions to improve urban livability.
The proposed methodology, which is original on the basis of the literature analyzed, can guide decision-makers and technicians to build more effective cycle paths for the community. Political decision-makers, only for electoral reasons, sometimes promote the construction of a km of cycle paths without an organic project of the network, since the overall length of the paths is the only parameter of evaluation. If, on the other hand, the cycle network is evaluated according to the proposed methodology, political decision-makers would be directed to the promotion of interventions aimed at maximizing the real effectiveness of the overall network rather than, simply, its length.
At present, the limitations of this study, which will be overcome in the next steps of the research, concern the values of the coefficients to be used in the procedure. Indeed, the definition of these values is necessary for the application of the procedure to real cases.
Future research will be aimed at specifying the values of the coefficients to be used in Equation (1), and also through specific surveys of the population and cyclists, its numerical application to several real cases, both to verify its possible application and the real differences between the different bike networks. Furthermore, authors believe that the work should be further extended and improved, also considering as a parameter of evaluation of the cycle network its integration with other collective transport systems (connections with railway stations and bus stations) and the ability to serve the urban places in which the demand for mobility concentrates (schools, offices, museums, etc.). Finally, integration with bike-sharing systems, present or to be designed, may be a further point in the development of the procedure.
Author Contributions
Although the study is the result of a conjunct work, the conceptualization was mostly due to R.F. and M.G.; methodology, M.G., R.A.L.R. and F.R.; software, R.F.; validation, R.F., M.G., R.A.L.R. and F.R.; formal analysis, M.G.; investigation, R.A.L.R. and F.R.; resources, R.F. and M.G.; data curation, M.G. and R.A.L.R.; writing—original draft preparation, M.G. and R.A.L.R.; writing—review and editing, all authors. All authors have read and agreed to the published version of the manuscript.
Funding
This research received no external funding.
Conflicts of Interest
The authors declare no conflict of interest.
References
- European Commission. Roadmap to a Single European Transport Area—Towards a competitive and resource efficient transport system; European Commission: Brussels, Belgium, 2011. [Google Scholar]
- Declaration on Cycling as a Climate Friendly Transport Model. Available online: http://www.eu2015lu.eu/en/actualites/communiques/2015/10/07-info-transports-declaration-velo/07-Info-Transport-Declaration-of-Luxembourg-on-Cycling-as-a-climate-friendly-Transport-Mode---2015-10-06.pdf (accessed on 10 February 2020).
- Cole-Hunter, T.; Donaire-Gonzalez, D.; Curto, A.; Ambros, A.; Valentin, A.; Garcia-Aymerich, J.; Martìnez, D.; Braun, L.M.; Mendez, M.; Jerrett, M. Objective correlates and determinants of bicycle commuting propensity in an urban environment. Transp. Res. Part D Transp. Environ. 2015, 40, 132–143. [Google Scholar] [CrossRef]
- Muñoz, B.; Monzon, A.; López, E. Transition to a cyclable city: Latent variables affecting bicycle commuting. Transp. Res. Part A Policy Pract. 2016, 84, 4–17. [Google Scholar] [CrossRef]
- Koglin, T.; Rye, T. The marginalisation of bicycling in modernist urban transport planning. J. Transp. Health 2014, 1, 214–222. [Google Scholar] [CrossRef] [Green Version]
- Yigitcanlar, T.; Velibeyoglu, K.; Martinez-Fernandez, C. Rising knowledge cities: The role of urban knowledge precincts. J. Knowl. Manag. 2008, 12, 8–20. [Google Scholar] [CrossRef] [Green Version]
- Caragliu, A.; Del Bo, C.; Nijkamp, P. Smart cities in Europe. J. Urban Technol. 2011, 18, 65–82. [Google Scholar] [CrossRef]
- Campbell, T. Beyond Smart Cities: How Cities Network, Learn and Innovate, 1st ed.; Earthscan Routledge: New York, NY, USA, 2013. [Google Scholar]
- Joss, S.; Cowley, R.; Tomozeiu, D. Towards the ‘ubiquitous eco-city’: An analysis of the internationalisation of eco-city policy and practice. Urban Res. Pract. 2013, 6, 54–74. [Google Scholar] [CrossRef]
- Newton, P.; Newman, P. Low Carbon Green Growth: Tracking Progress in Australia’s Built Environment Industry towards a Green Economy; Swinburne University of Technology: Melbourne, Australia, 2013. [Google Scholar]
- Viitanen, J.; Kingston, R. Smart cities and green growth: Outsourcing democratic and environmental resilience to the global technology sector. Environ. Plan. A Econ. Space 2014, 46, 803–819. [Google Scholar] [CrossRef] [Green Version]
- Ni, P.; Jie, Z.Q. Urban Competitiveness and Innovation; Edward Elgar Publishing: Cheltenham, UK, 2014. [Google Scholar]
- Watson, V. Locating planning in the New Urban Agenda of the urban sustainable development goal. Plan. Theor. 2016, 15, 435–448. [Google Scholar] [CrossRef]
- Banister, D. The sustainable mobility paradigm. Transp. Policy 2008, 15, 73–80. [Google Scholar] [CrossRef]
- Gabrielli, S.; Forbes, P.; Jylhä, A.; Wells, S.; Sirén, M.; Hemminki, S.; Nurmi, P.; Maimone, R.; Masthoff, J.; Jacucci, G. Design challenges in motivating change for sustainable urban mobility. Comp. Hum. Behav. 2014, 41, 416–423. [Google Scholar] [CrossRef]
- Bicalho, T.; Silva, C.; Cunha, I.; Teixeira, J.; Proença, A. Planners’ attitudes towards the cycling potential of their cities. Creating awareness for attitude change. Travel Behav. Soc. 2019, 17, 96–103. [Google Scholar] [CrossRef]
- Silva, C.; Teixeira, J.; Proença, A.C.; Bicalho, T.; Aguiar, A. The Potential for Cycling in Starter Cycling Cities. Transp. Res. Proc. 2009, 41, 637–654. [Google Scholar] [CrossRef]
- Liu, G.; te Brömmelstroet, M.; Krishnamurthy, S.; van Wesemael, P. Practitioners’ perspective on user experience and design of cycle highways. Transp. Res. Interdiscip. Perspect. 2019, 1, 100010. [Google Scholar] [CrossRef]
- Fernandez-Heredia, A.; Fernandez-Sanchez, G. Processes of civic participation in the implementation of sustainable urban mobility systems. Case Stud. Transp. Policy 2019, in press. [Google Scholar] [CrossRef]
- Serrano-López, R.; Linares-Unamunzaga, A.; San Emeterio, C.M. Urban sustainable mobility and planning policies. A Spanish mid-sized city case. Cities 2019, 95, 102356. [Google Scholar] [CrossRef]
- Silva, C.; Teixeira, J.; Proença, A.; Bicalho, T.; Cunha, I.; Aguiar, A. Revealing the cycling potential of starter cycling cities: Usefulness for planning practice. Transp. Policy 2019, 81, 138–147. [Google Scholar] [CrossRef]
- Wild, K.; Woodward, A. Why are cyclists the happiest commuters? Health, pleasure and the e-bike. J. Transp. Health 2019, 14, 100569. [Google Scholar] [CrossRef]
- Festa, D.C.; Forciniti, C. Attitude towards bike use in Rende, a small town in south Italy. Sustainability 2019, 11, 2703. [Google Scholar] [CrossRef] [Green Version]
- Di Mascio, P.; Fusco, G.; Grappasonni, G.; Moretti, L.; Ragnoli, A. Geometrical and functional criteria as a methodological approach to implement a new cycle path in an existing urban road network: A case study in Rome. Sustainability 2018, 10, 2951. [Google Scholar] [CrossRef] [Green Version]
- Cabral, L.; Kim, A.M.; Parkins, J.R. Bicycle ridership and intention in a northern, low-cycling city. Travel Behav. Soc. 2018, 13, 165–173. [Google Scholar] [CrossRef]
- Iwińska, K.; Blicharska, M.; Pierotti, L.; Tainio, M.; de Nazelle, A. Cycling in Warsaw, Poland–Perceived enablers and barriers according to cyclists and non-cyclists. Transp. Res. Part A Policy Pract. 2018, 113, 291–301. [Google Scholar] [CrossRef] [PubMed]
- Andrews, N.; Clement, I.; Aldred, R. Invisible cyclists? Disabled people and cycle planning—A case study of London. J. Transp. Health 2018, 8, 146–156. [Google Scholar] [CrossRef] [Green Version]
- Woods, R.; Masthoff, J. A comparison of car driving, public transport and cycling experiences in three European cities. Transp. Res. Part A Policy Pract. 2017, 103, 211–222. [Google Scholar] [CrossRef] [Green Version]
- Zhao, P.; Li, S.; Li, P.; Liu, J.; Long, K. How does air pollution influence cycling behaviour? Evidence from Beijing. Transp. Res. Part D Transp. Environ. 2018, 63, 826–838. [Google Scholar] [CrossRef]
- Zhao, C.; Nielsen, T.A.S.; Olafsson, A.S.; Carstensen, T.A.; Fertner, C. Cycling environmental perception in Beijing–A study of residents’ attitudes towards future cycling and car purchasing. Transp. Policy 2018, 66, 96–106. [Google Scholar] [CrossRef]
- Garau, C.; Masala, F.; Pinna, F. Cagliari and smart urban mobility: Analysis and comparison. Cities 2016, 56, 35–46. [Google Scholar] [CrossRef]
- Balducci, F.; Ferrara, A. Using urban environmental policy data to understand the domains of smartness: An analysis of spatial autocorrelation for all the Italian chief towns. Ecol. Indic. 2018, 89, 386–396. [Google Scholar] [CrossRef]
- Tabib, M.V.; Rasheed, A.; Uteng, T.P. Methodology for assessing cycling comfort during a smart city development. Energy Proced. 2017, 122, 361–366. [Google Scholar] [CrossRef]
- Battarra, R.; Gargiulo, C.; Tremiterra, M.R.; Zucaro, F. Smart Mobility in Italian Metropolitan Cities: A comparative analysis through indicators and actions. Sustain. Cities Soc. 2018, 41, 556–567. [Google Scholar] [CrossRef]
- Acheampong, R.A.; Siiba, A. Examining the determinants of utility bicycling using a socio-ecological framework: An exploratory study of the Tamale Metropolis in Northern Ghana. J. Transp. Geogr. 2018, 69, 1–10. [Google Scholar] [CrossRef] [Green Version]
- Vansteenkiste, P.; Zeuwts, L.; van Maarseveen, M.; Cardon, G.; Savelsbergh, G.; Lenoir, M. The implications of low quality bicycle paths on the gaze behaviour of young learner cyclists. Transp. Res. Part F Traffic Psychol. Behav. 2017, 48, 52–60. [Google Scholar] [CrossRef]
- Zayed, M.A. Towards an index of city readiness for cycling. Int. J. Transp. Sci. Technol. 2016, 5, 210–225. [Google Scholar] [CrossRef]
- Macedo, J.; Rodrigues, F.; Tavares, F. Urban sustainability mobility assessment: Indicators proposal. Energy Proced. 2017, 134, 731–740. [Google Scholar] [CrossRef]
- Boele-Vos, M.J.; Van Duijvenvoorde, K.; Doumen, M.J.A.; Duivenvoorden, C.W.A.E.; Louwerse, W.J.R.; Davidse, R.J. Crashes involving cyclists aged 50 and over in the Netherlands: An in-depth study. Accid. Anal. Prev. 2017, 105, 4–10. [Google Scholar] [CrossRef]
- Mantuano, A.; Bernardi, S.; Rupi, F. Cyclist gaze behavior in urban space: An eye-tracking experiment on the bicycle network of Bologna. Case Stud. Transp. Policy 2017, 5, 408–416. [Google Scholar] [CrossRef]
- Conti, A.; Ruggeri, D.; Bartolomei, L. Soft infrastructure as landscape–a methodology for the assessment and improvement of the user experience of soft mobility. Transp. Res. Proc. 2016, 14, 2314–2323. [Google Scholar] [CrossRef] [Green Version]
- Dozza, M.; Piccinini, G.F.B.; Werneke, J. Using naturalistic data to assess e-cyclist behavior. Transp. Res. Part F Traffic Psychol. Behav. 2016, 41, 217–226. [Google Scholar] [CrossRef] [Green Version]
- Tran, T.D.; Ovtracht, N.; D’Arcier, B.F. Modeling Bike Sharing System using Built Environment Factors. Procedia CIRP 2015, 30, 293–298. [Google Scholar] [CrossRef]
- Füssl, E.; Haupt, J. Understanding cyclist identity and related interaction strategies. A novel approach to traffic research. Transp. Res. Part F:Traffic Psychol. Behav. 2017, 46, 329–341. [Google Scholar] [CrossRef] [Green Version]
- Černá, A.; Černý, J.; Malucelli, F.; Nonato, M.; Polena, L.; Giovannini, A. Designing optimal routes for cycle-tourists. Transp. Res. Proc. 2014, 3, 856–865. [Google Scholar] [CrossRef] [Green Version]
- Fernández-Heredia, Á.; Monzón, A.; Jara-Díaz, S. Understanding cyclists’ perceptions, keys for a successful bicycle promotion. Transp. Res. Part A Policy Pract. 2014, 63, 1–11. [Google Scholar] [CrossRef]
- Seriani, S.; Fernandez, R.; Hermosilla, E. Experimental study for estimating capacity of cycle lanes. Transp. Res. Proc. 2015, 8, 192–203. [Google Scholar] [CrossRef] [Green Version]
- Brown, B.B.; Smith, K.R.; Hanson, H.; Fan, J.X.; Kowaleski-Jones, L.; Zick, C.D. Neighborhood design for walking and biking: Physical activity and body mass index. Am. J. Prev. Med. 2013, 44, 231–238. [Google Scholar] [CrossRef] [PubMed] [Green Version]
- Caulfield, B. Re-cycling a city–Examining the growth of cycling in Dublin. Transp. Res. Part A Policy Pract. 2014, 61, 216–226. [Google Scholar] [CrossRef]
- Bíl, M.; Bílová, M.; Kubeček, J. Unified GIS database on cycle tourism infrastructure. Tour. Manag. 2012, 33, 1554–1561. [Google Scholar] [CrossRef]
- Caselli, M.; de Gennaro, G.; Marzocca, A.; Trizio, L.; Tutino, M. Assessment of the impact of the vehicular traffic on BTEX concentration in ring roads in urban areas of Bari (Italy). Chemosphere 2010, 81, 306–311. [Google Scholar] [CrossRef]
- ISFORT (2018). 15° Rapporto Sulla Mobilità Degli Italiani. Osservatorio Audimob. Available online: https://www.isfort.it/wp-content/uploads/2019/09/Rapporto_Mobilita_2018.pdf (accessed on 11 November 2019).
- Legambiente 2019 Rapporto Sulle Performance Ambientali Delle Città 2019. Available online: https://www.legambiente.it/wp-content/uploads/rapporto-ecosistema-urbano-2019.pdf (accessed on 11 November 2019).
- FIAB Comuni Ciclabili 2019 2 Edizione. Available online: http://www.comuniciclabili.it/ (accessed on 10 October 2019).
- Endurance Italia Osservatorio PUMS. Available online: https://www.osservatoriopums.it/osservatorio/pums (accessed on 10 February 2020).
- Bruntland, G.H. World commission on environment and development. Our Common Future 1987, 17, 43–66. [Google Scholar]
- Sen, A. Capability and well-being. In The Quality of Life; Nussbaum, M., Sen, A., Eds.; Clarendon Press: Oxford, UK, 1993. [Google Scholar]
- U.S. Federal Highway Administration. Available online: https://highways.dot.gov/ (accessed on 23 January 2020).
- Comune di Napoli, Servizio Mobilità Sostenibile (2012). Istituzione di un Percorso di Mobilità Ciclistica “Bagnoli—Piazza Garibaldi”. Available online: http://www.comune.napoli.it/flex/cm/pages/ServeBLOB.php/L/IT/IDPagina/19882 (accessed on 11 November 2019).
Figure 1.
Physical and functional conditions that can or cannot make a cycle lane appropriate.

Figure 2.
Motorization rate in Italy [52].
Figure 2.
Motorization rate in Italy [52].

Figure 3.
Motorization rate (cars/1000 inhabitants) in Europe [52].
Figure 3.
Motorization rate (cars/1000 inhabitants) in Europe [52].

Figure 4.
Density of cycle lanes (meters/inhabitants) in Italy [54].
Figure 4.
Density of cycle lanes (meters/inhabitants) in Italy [54].

Figure 5.
The state of the art of the SUMPs in Italian regions [55].
Figure 5.
The state of the art of the SUMPs in Italian regions [55].

Figure 6.
The ranking of Italian cities elaborated by FIAB in 2019 [54]. The color scale indicates the best positions in green and the worst in red. The size of the dots refers to the role of the city (region capital or not). The Regions are in blue; the region capitals in uppercase; round fonts indicate the cities classified as cycling cities; the Provinces are indicated in brackets.

Figure 7.
Frequency of the use of bicycle in the European Countries in 2016 [54]
Figure 7.
Frequency of the use of bicycle in the European Countries in 2016 [54]

Figure 8.
Examples of dyscrasias on urban cycle lanes: in frame (a), a mixed bike and pedestrian path (8), adjacent to the carriageway (7), whose track sharply deviates towards a dangerous road-crossing not properly flagged (10). In frame (b), a misuse of the path (9).
Figure 8.
Examples of dyscrasias on urban cycle lanes: in frame (a), a mixed bike and pedestrian path (8), adjacent to the carriageway (7), whose track sharply deviates towards a dangerous road-crossing not properly flagged (10). In frame (b), a misuse of the path (9).

Figure 9.
Example of networks under different conditions. The explanation for (a) and (b) is given in the main text.
Figure 9.
Example of networks under different conditions. The explanation for (a) and (b) is given in the main text.

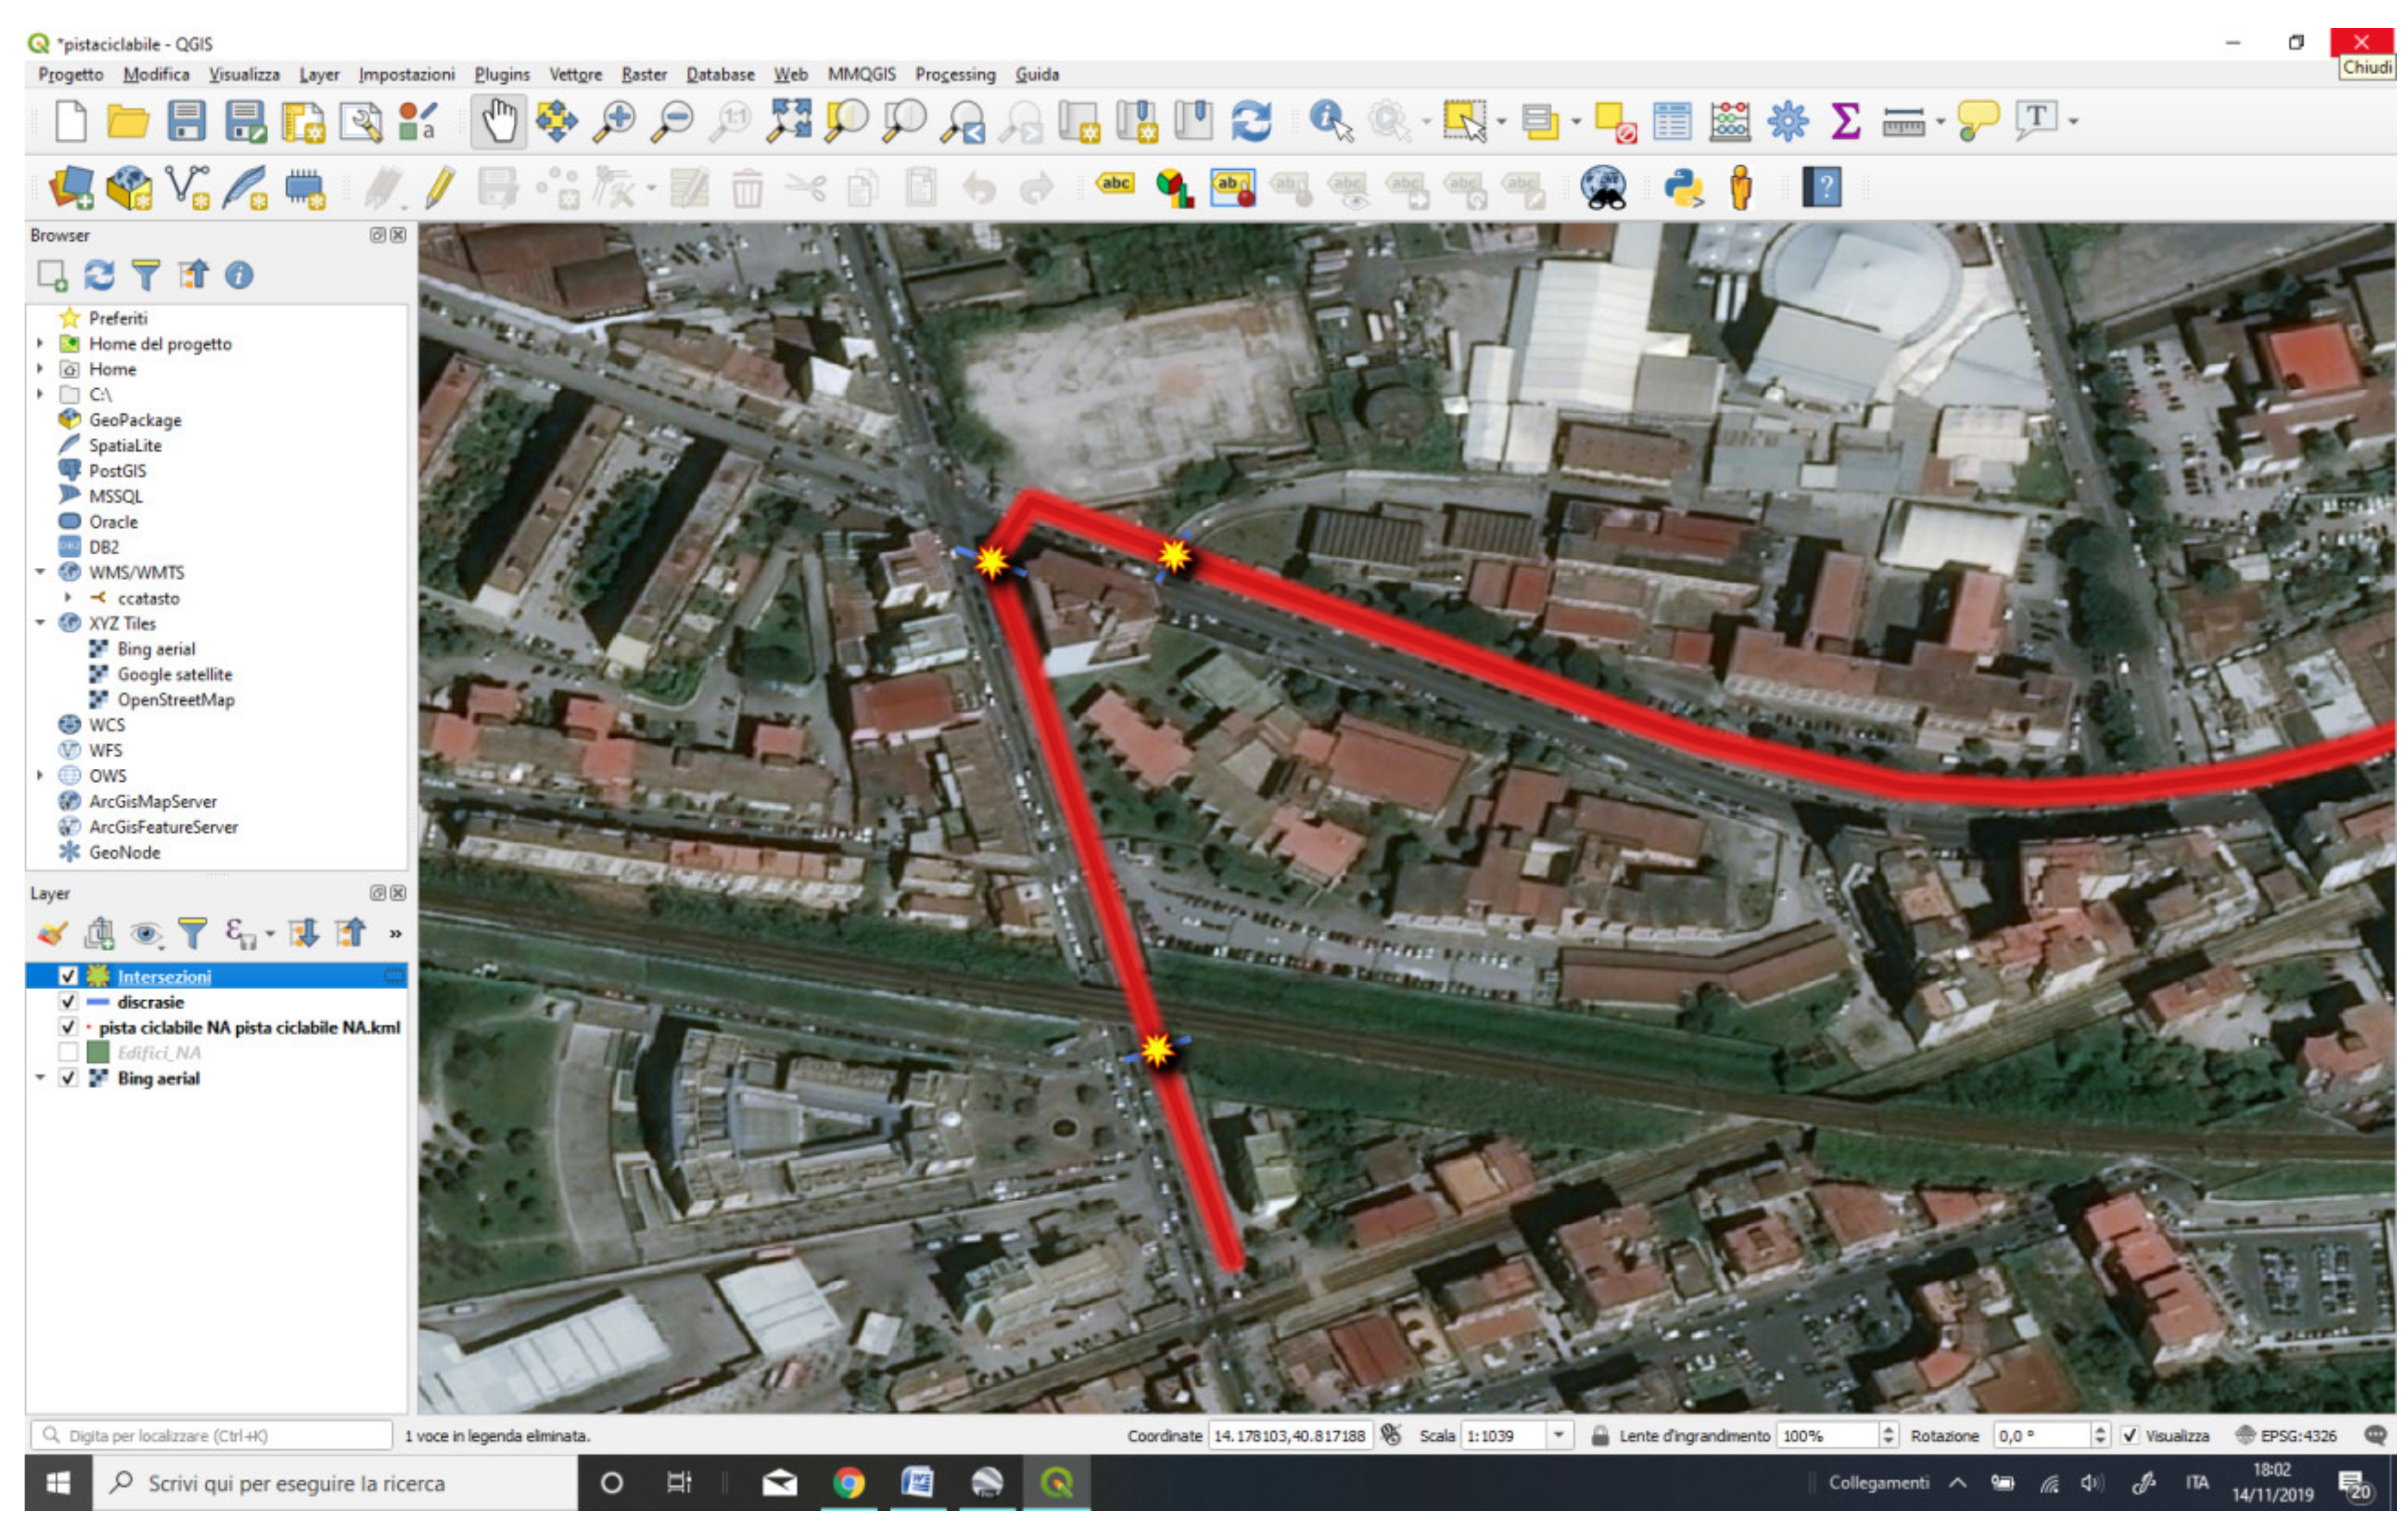
Figure 10.
The urban cycle lane in Naples (red line) and the dyscrasia points indicated as intersections (in blue) that subdivide the lane in different segments.
Figure 10.
The urban cycle lane in Naples (red line) and the dyscrasia points indicated as intersections (in blue) that subdivide the lane in different segments.

Figure 11.
The output window of the query in QGIS to automatically individuate the typology of dyscrasia occurring along the segments. By using the intersect function available in QGIS, it is possible to choose the linear path of the cycle lane as the input vector and the dyscrasias as the intersect vector.

Figure 12.
The geo-localized design of the output of the query. The yellow points (dyscrasias) are associated with both the information about the structural characteristics of the lane and the type of anomaly registered. Furthermore, all the cycle lanes are subdivided in a number of segments by considering the dyscrasias as start nodes and end nodes of each segment. In this way, it is quickly possible to evaluate how many segments have subdivided the path and the effective contribution to urban soft mobility.


Table 1.
Results of the first round of queries.
| Keyword | SD | WoS | Total |
|---|---|---|---|
| Urban cycle paths | 3 | 20 | 23 |
| Urban sustainable mobility | 17 | 10 | 27 |
| Soft Mobility | 56 | 18 | 74 |
| Cycling Indicator | 4 | 6 | 10 |
| Design of cycle lanes | 5 | 58 | 63 |
| TOTAL | 85 | 112 | 197 |
Table 2.
Selected papers composing the literature database. Columns “Thematic Cluster” and “Affinity Level” respectively refer to the typology of paper according to its content and to the affinity with the topic of this study.
Table 2.
Selected papers composing the literature database. Columns “Thematic Cluster” and “Affinity Level” respectively refer to the typology of paper according to its content and to the affinity with the topic of this study.
| Ref | Year | Thematic Cluster | Affinity Level | Ref | Year | Thematic Cluster | Affinity Level |
| [19] | 2019 | 4 | Low | [20] | 2019 | 4 | Medium |
| [21] | 2019 | 3 | Medium | [16] | 2019 | 2 | High |
| [22] | 2019 | 2 | Medium | [23] | 2019 | 2 | Medium |
| [24] | 2018 | 3 | High | [25] | 2018 | 3 | Medium |
| [26] | 2018 | 2 | High | [27] | 2018 | 2 | High |
| [28] | 2018 | 2 | Low | [29] | 2018 | 2 | Low |
| [30] | 2018 | 2 | Medium | [31] | 2018 | 1 | Low |
| [32] | 2018 | 1 | Medium | [33] | 2018 | 1 | Medium |
| [34] | 2018 | 1 | Medium | [35] | 2018 | 1 | Medium |
| [36] | 2017 | 3 | Low | [37] | 2017 | 1 | High |
| [38] | 2017 | 1 | Medium | [39] | 2017 | 1 | Medium |
| [40] | 2016 | 2 | Medium | [41] | 2016 | 1 | High |
| [42] | 2016 | 1 | High | [43] | 2015 | 3 | Medium |
| [44] | 2015 | 2 | Medium | [45] | 2014 | 3 | High |
| [46] | 2014 | 2 | High | [47] | 2014 | 1 | Medium |
| [48] | 2013 | 3 | Medium | [49] | 2013 | 3 | Medium |
| [50] | 2012 | 1 | High | [51] | 2010 | 1 | Low |
Table 3.
Number of cities considered as “suitable for cycling” according to FIAB 2018 [54].
Table 3.
Number of cities considered as “suitable for cycling” according to FIAB 2018 [54].
| Regions | Residents | Area (Km2) | Population Density (Ab/km2) | Number of Cities | Number of Metropolitan Districts | Number of Cities Suitable for Cycling | %(*) |
|---|---|---|---|---|---|---|---|
| Abruzzo | 1,322,247 | 10,795 | 122.5 | 305 | 4 | 10 | 3 |
| Basilicata | 570,365 | 9995 | 57.1 | 131 | 2 | 0 | 0 |
| Calabria | 1,965,128 | 15,081 | 130.3 | 409 | 5 | 1 | 0 |
| Campania | 5,839,084 | 13,590 | 429.7 | 550 | 5 | 2 | 0 |
| Emilia-Romagna | 4,448,841 | 22,456 | 198.1 | 334 | 9 | 7 | 2 |
| Friuli Venezia Giulia | 1,217,872 | 7855 | 155 | 216 | 4 | 6 | 3 |
| Lazio | 5,898,124 | 17,208 | 342.8 | 378 | 5 | 0 | 0 |
| Liguria | 1,565,307 | 5421 | 288.8 | 235 | 4 | 2 | 1 |
| Lumbardy | 10,018,806 | 23,863 | 419.8 | 1.527 | 12 | 7 | 0 |
| Marche | 1,538,055 | 9366 | 164.2 | 236 | 5 | 4 | 2 |
| Molise | 310,449 | 4433 | 70 | 136 | 2 | 0 | 0 |
| Piedmont | 4,392,526 | 25,402 | 172.9 | 1.202 | 8 | 4 | 0 |
| Puglia | 4,063,888 | 19,371 | 209.8 | 258 | 6 | 9 | 3 |
| Sardinia | 1,653,135 | 24,089 | 68.6 | 377 | 8 | 1 | 0 |
| Sicily | 5,056,641 | 25,703 | 196.7 | 390 | 9 | 1 | 0 |
| Tuscany | 3,742,437 | 22,990 | 162.8 | 279 | 10 | 4 | 1 |
| Trentino Alto Adige | 1,062,860 | 13,607 | 78.1 | 293 | 2 | 1 | 0 |
| Umbria | 888,908 | 8456 | 105.1 | 92 | 2 | 2 | 2 |
| Valle d’Aosta | 126,883 | 3263 | 38.9 | 74 | 1 | 0 | 0 |
| Veneto | 4,907,529 | 18,391 | 266.8 | 576 | 7 | 8 | 1 |
(*) It shows the percentage of cities suitable for cycling per region calculated on the total number of cities considered in the survey.
Table 4.
Survey elaborated by ISFORT [52], in 2018.
Table 4.
Survey elaborated by ISFORT [52], in 2018.
| Mode | 2018 | 2016 | % 2018–2016 |
|---|---|---|---|
| Public Transport | 85 | 84 | 1 |
| Bike | 76 | 77 | −1 |
| Bike sharing | 61 | 53 | 8 |
| Car sharing | 57 | 42 | 15 |
| Car pooling | 55 | 37 | 18 |
| Taxi | 81 | 26 | 55 |
Table 5.
Relations between dyscrasias and clusters of anomalies.
| DYSC. 1 | DYSC. 2 | DYSC. 3 | DYSC. 4 | DYSC. 5 | DYSC. 6 | DYSC. 7 | DYSC. 8 | DYSC. 9 | DYSC. 10 | |
|---|---|---|---|---|---|---|---|---|---|---|
| anomalies depending on design | ■ | ■ | ■ | ■ | ■ | ■ | ■ | ■ | ||
| anomalies that depend on organization | ■ | ■ | ■ | ■ | ■ | ■ | ||||
| anomalies that depend on intersections | ■ | ■ | ■ | ■ | ■ | |||||
| anomalies depending on the presence of obstacles | ■ | ■ |
Table 6.
Characteristics, per section, of the cycle path in Naples.
| Composition of the Path | N° of Sections | % of Tot km | Total Length of Sections km | Legambiente Multiplier | Total Points |
|---|---|---|---|---|---|
| Mixed pedestrian-bicycle sections | 16 | 15 | 3 | 0.3 | 4.8 |
| Sections obtained from the sidewalk | 4 | 30 | 6 | 0.2 | 0.8 |
| Sections in reserved lane on the vehicular streets | 6 | 10 | 2 | 0.5 | 3 |
| Cycle crossings | 10 | 10 | 2 | 0.3 | 3 |
| Mixed cycle/pedestrian crossings | 3 | 3 | 0.6 | 0.3 | 0.9 |
| Sections where to get off the bike and walk it | 2 | 1 | 0.2 | 0.3 | 0.6 |
| Reserved lanes | 3 | 30 | 6 | 0.2 | 0.6 |
| Zone 30 | 2 | 1 | 0.2 | 0.2 | 0.4 |
Table 7.
The relation between the composition of the cycle lane in Naples and dyscrasias defined above.
Table 7.
The relation between the composition of the cycle lane in Naples and dyscrasias defined above.
| DYSC 1 | DYSC 2 | DYSC 3 | DYSC 4 | DYSC 5 | DYSC 6 | DYSC 7 | DYSC 8 | DYSC 9 | DYSC 10 | |
|---|---|---|---|---|---|---|---|---|---|---|
| Naples’ bikeway (% of tot length) | 0 | 7 | 15 | 1 | 3 | 5 | 15 | 10 | 9 | 35 |
In the cells, the values refer to the percentage number of segments along which dyscrasias occur.
© 2020 by the authors. Licensee MDPI, Basel, Switzerland. This article is an open access article distributed under the terms and conditions of the Creative Commons Attribution (CC BY) license (http://creativecommons.org/licenses/by/4.0/).
Share and Cite
MDPI and ACS Style
Fistola, R.; Gallo, M.; La Rocca, R.A.; Russo, F. The Effectiveness of Urban Cycle Lanes: From Dyscrasias to Potential Solutions. Sustainability 2020, 12, 2321. https://0-doi-org.brum.beds.ac.uk/10.3390/su12062321
AMA Style
Fistola R, Gallo M, La Rocca RA, Russo F. The Effectiveness of Urban Cycle Lanes: From Dyscrasias to Potential Solutions. Sustainability. 2020; 12(6):2321. https://0-doi-org.brum.beds.ac.uk/10.3390/su12062321
Chicago/Turabian StyleFistola, Romano, Mariano Gallo, Rosa Anna La Rocca, and Francesca Russo. 2020. "The Effectiveness of Urban Cycle Lanes: From Dyscrasias to Potential Solutions" Sustainability 12, no. 6: 2321. https://0-doi-org.brum.beds.ac.uk/10.3390/su12062321
Note that from the first issue of 2016, this journal uses article numbers instead of page numbers. See further details here.