1. Introduction and Background
Transport accounts for one quarter of total air pollution and CO
2 emissions in Europe [
1]. Governments and states globally and in the EU try to reduce traffic congestion and car dependency with policies and regulations, such as giving movement priority to public transport (PT) or reducing space allocated to private cars [
2], increasing urban densities, increasing the occupancy (number of people in a vehicle) of vehicles, increasing walkability, supporting cycling, multimodal transport, and shared mobility modes [
3].
Shared mobility modes can be divided into two major groups: (i) Sharing a passenger ride (carpooling, vanpooling, etc.), and (ii) sharing a vehicle (carsharing, bike sharing, and scooter sharing) [
4]. The range and availability of all kinds of shared mobility modes are rapidly growing and are supposed to become more desirable using information communication technologies (ICTs) and new transport technologies like autonomous and connected vehicles [
5]. Ridesharing is a specific kind of shared mobility mode in which a couple of people who have a common starting point, destination, or both, travel together with a car (so-called carpooling) or van (so-called vanpooling). Carpooling is an alternative way to travel that can be implemented without major problems and can provide benefits for commuters and society. Carpooling is not about being against the private ownership of cars but is about being against the inefficient use of private cars. Carpooling is also not about being against PT but is about being against insufficient and inefficient PT usage. “Causal carpooling” is sharing a ride with known passengers like friends or colleagues, and is used for short-distance trips e.g., from home to work or education (school, university). Meanwhile, “on-demand ride service” is sharing a ride with an unknown passenger on demand via agreement on web/mobile applications, and is normally used for long-distance trips e.g., between cities. On the other hand, transportation network companies are providing ride-sourcing services like vanpooling and ride-hailing (taxi) services such as Uber and Lyft. This kind of service aims to address the limitation of using PT such as metro, tram, and bus in particular in areas of low demand. For example, it can be a shuttle bus (van) service for employees of a workplace or educational center. The timetable is tailored to the working hours of the participating companies and is therefore ideal for employees who cannot use PT.
Across the world and in Europe, there are countries/regions which are characterized by a dispersed settlement, with many stand-alone one-family houses e.g., Slovenia. Such a kind of density of population results in lower development of fixed public transport lines. In addition, the car is the number one solution for travelling to work and to school, where parking is not the evident problem. To avoid congestion inside the cities and on highways, together with shared mobility modes, we should consider shared mobility infrastructures as well.
There are two kinds of shared mobility infrastructures: (i) Park and ride (P+R) lots, and (ii) park and pool (P+P) lots which are described below:
Park and ride (P+R) lots are generally located out of the city ring, even better if they are further away in distance. With this, lots people can leave their car or other vehicle (bicycle, motorcycle), and take PT (train, bus) for traveling to the city center [
6]. Lots are effective only if there are existing PT stops nearby, or there is the possibility to introduce new PT lines and stops nearby.
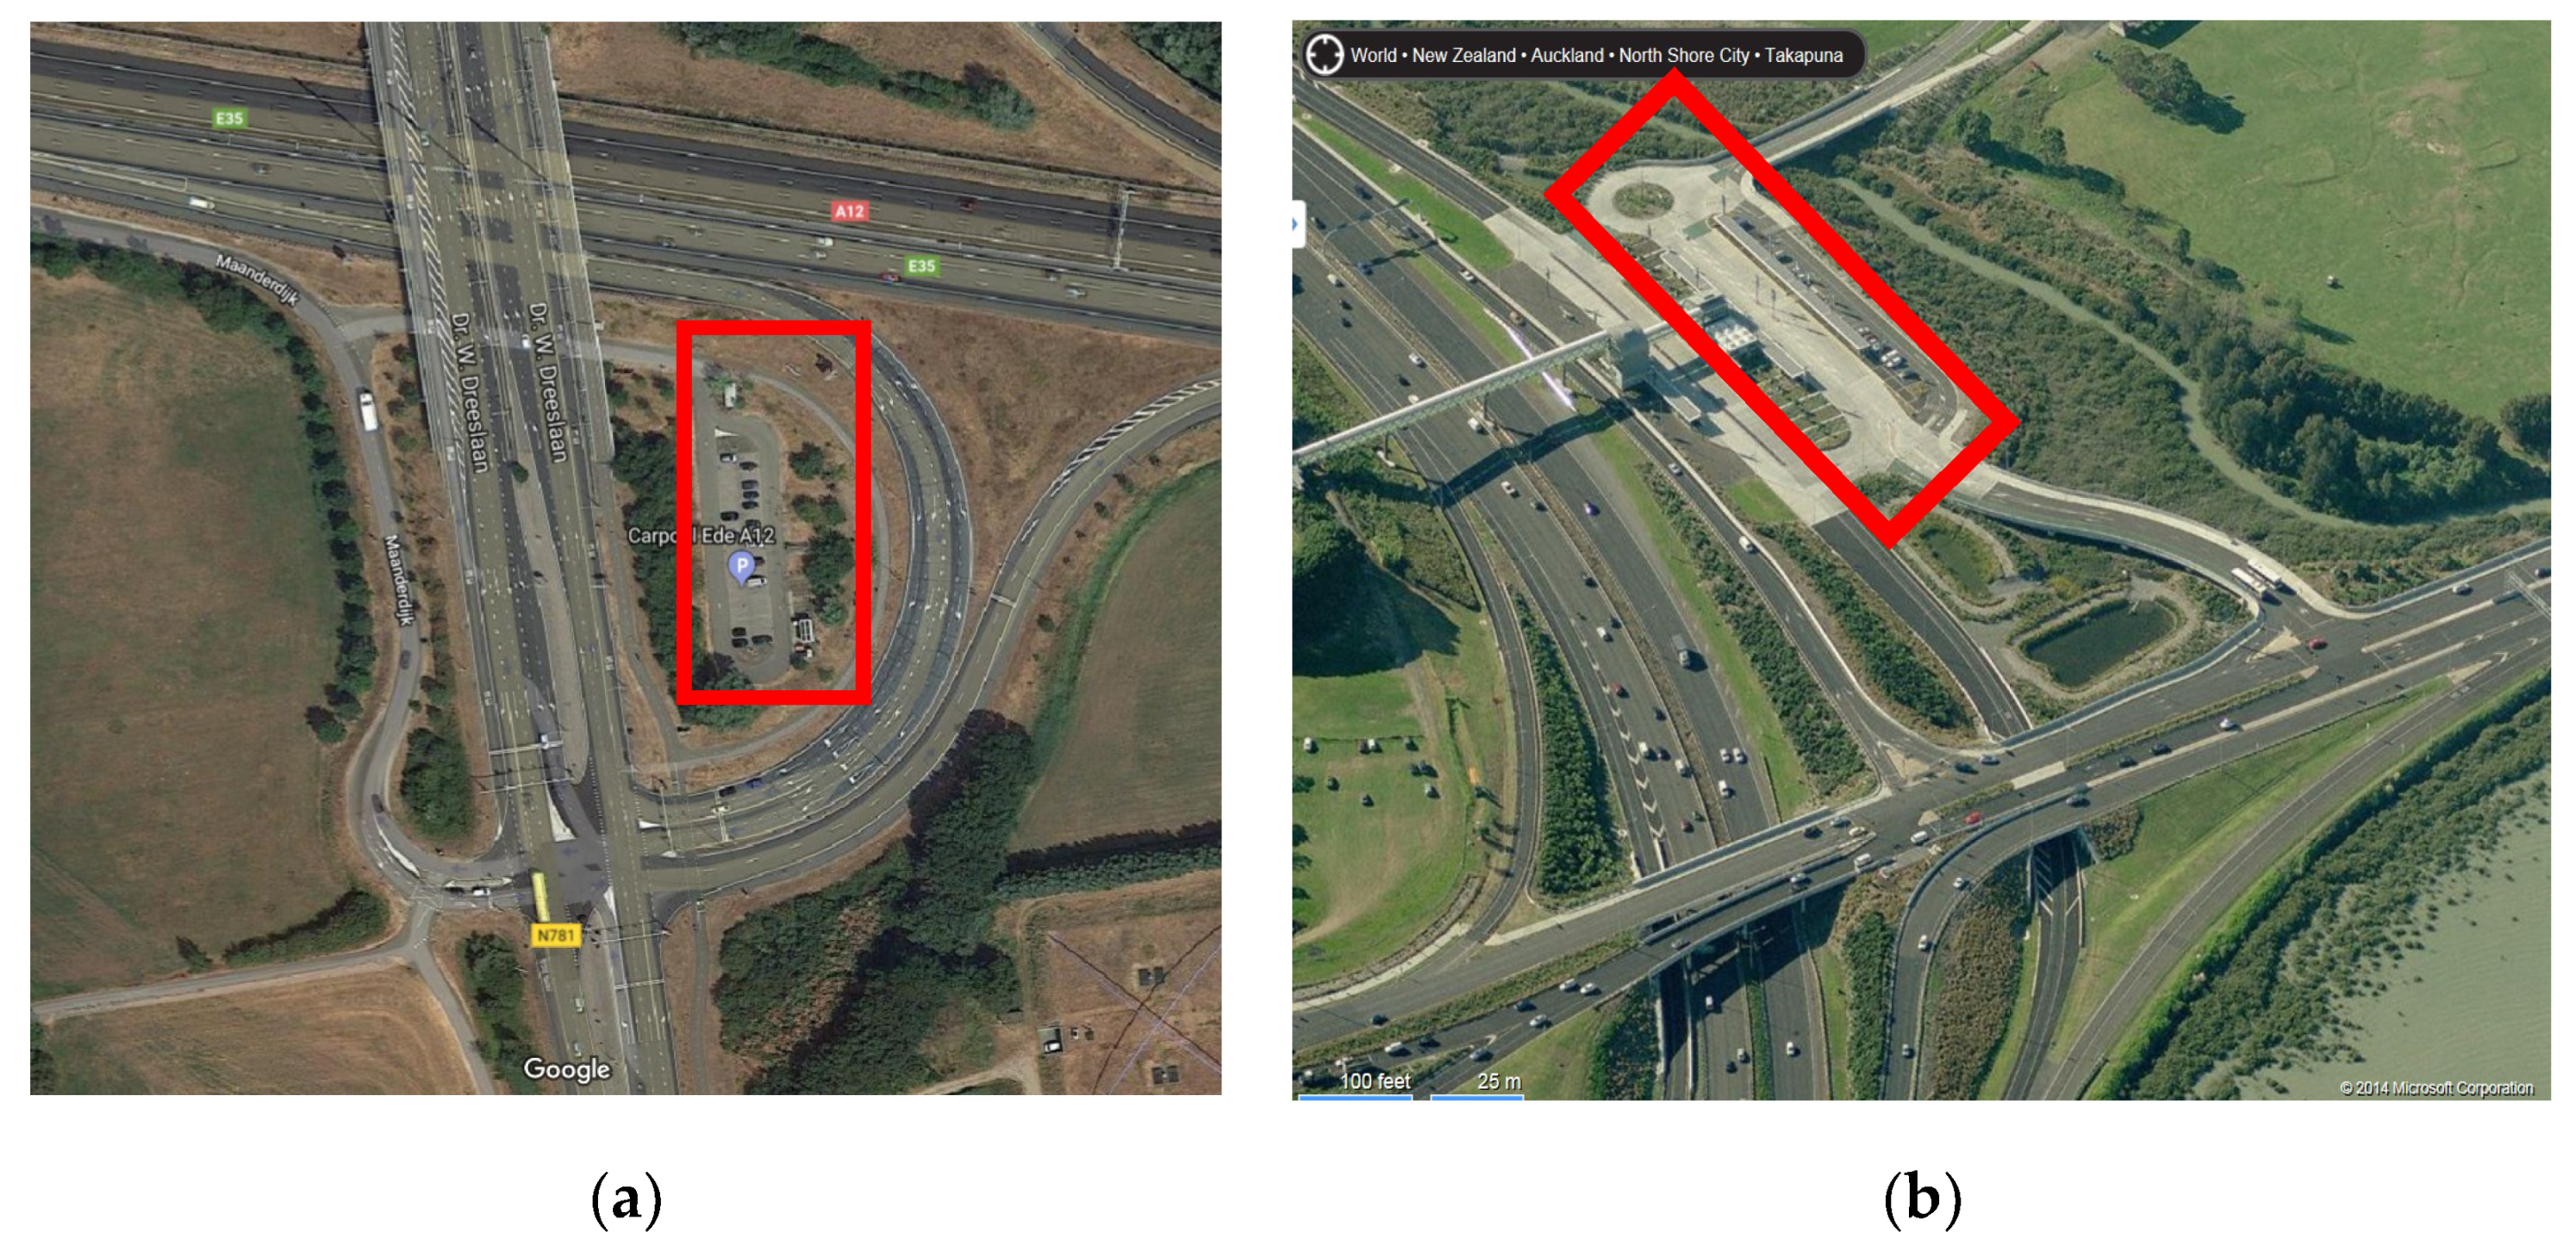
P+P lots describe parking spaces where commuters and drivers can meet to form carpools. The difference between P+R and P+P is that P+P lots are built in the low demand area of PT or where there is no PT network coverage. One of the potential places to implement P+P lots is near interchanges in the dispersed settlement areas where there are no fixed public transport lines. For instance, there are P+P lots implemented near interchanges: Germany (Parken-und-Mitfahren), the UK, the USA, Canada. the Netherlands (
Figure 1a), and New Zealand (
Figure 1b).
A survey in the USA [
7] showed that 1% of private vehicles joining carpooling can save three billion liters of gasoline and 10% can save 28 billion liters annually. Seyedabrishami [
8] claimed that about 240 million liters of fuel would be saved annually if 30% of travelers joined carpooling in Tehran. In addition, another study shows that 14% to 18% of vehicle-km would be saved if 28% to 36% of all carpooling requests were fulfilled. Hence, ride-sharing is an effective method of transportation management to reduce the proportion of single-occupant vehicle trips (SOV) and to ease traffic congestion [
9]. Jacobson and King [
10] identified that carpooling can improve the fuel economy of cars if no additional travel is required to pick up passengers. They conclude that adding one additional passenger for every 100 vehicles would reduce the national annual fuel consumption by 3.03–3.11 million liters per year in the US. But in fact, it is not the fuel economy of cars that defines the total environmental benefit of carpooling, but the reduction in total vehicle kilometers travelled (VKT) results in fuel savings and reduced greenhouse gas (GHG) emissions [
11]. Gargiulo et al. [
12] examined carpooling’s impacts on travel distance and CO
2 reduction in Dublin. Around 12,600 tons of CO
2 were eliminated by carpooling on weekdays, which corresponded to approximately 706,428 euros. Amey [
13] found that total daily travel distance would be shortened by as much as 9%–27% when 50%–77% of the total commuting population of the faculty and students at the Massachusetts Institute of Technology used carpooling.
One of the important questions regarding carpooling is who is interested in carpooling and why. Using a campus travel pattern survey at Ohio State University, Park et al. [
14] found that safety, flexibility, and parking cost-savings were the most important factors for people willing to be a passenger; while the convenience and opportunities for socializing through a carpool trip were the most influential factors for people willing to take the role of driver. Olsson et al. [
15] also mentioned that psychological factors, namely monetary and time benefits, reducing congestion, and environmental concerns are more important than socio-demographic variables. In a case study in Lisbon, Correia and Viegas [
9] concluded that the passengers joining in carpooling were mostly concerned with travel budgets, namely saving fuel costs, toll costs, and workplace parking costs. Huang [
16], through conducting a practical trial (survey), found that travel time, travel cost, and safety are three key factors among potential influencing factors. Delhomme and Gheorghiu [
17] utilized the binary logit regression to analyze the influence of gender on carpooling choice. Moreover, they developed a multinomial logit regression model to study modal choice between public transit modes, casual carpooling, and driving alone. Huang [
16] also examined the impacts of these on each other (particularly the travel time and travel cost) using a binary logit regression analysis. Olaru [
18] used discrete choice models to examine the travelers’ attitudes in choosing P+R facilities in Western Australia.
Kwon [
7] discovered that some high occupancy vehicle (HOV) lanes are under-utilized in California. About 81% of HOV lanes carry below 1400 vehicles per hour per lane during peak hours. Providing HOV lane usage for carpooling vehicles (which can improve their travel time) would attract more drivers and passengers to use this system during peak hours as well as improve its function during off-peak hours [
19]. On the other hand, and inside the cities, as Dadashzadeh and Ergun [
2] stated, the spatial bus priority methods like dedicated bus lanes provide great benefits to bus movement. Dadashzadeh and Ergun also examined the effects of giving priority to buses on highways, in particular around on-ramp bottleneck areas [
20]. Another possible option to improve the travel time and delay of carpoolers is to let them use these bus lanes inside the cities to avoid any conflicts with mixed traffic. This option is also examined as one of our scenarios to explore its effects on the mode choice of road users. Carpool preferential parking permit is another attracting factor which allows carpooling drivers to park in designated carpool parking spaces in the parking lots of workplaces, educational institutions, organizations, etc. These are the effective measures that can be used to develop scenarios.
Although carpooling has become more popular these days, passenger pick-up and drop-off locations (matching point) remain an important challenge for drivers, passengers, and transport officials. Selecting a suitable matching location (i.e., P+P lot) along the daily commute of highway users can be a determining factor for how successfully the P+P lot will be utilized. Several factors can be important. In this study we examine the P+P lots near interchanges’ impacts on carpooling and mode choice behavior of highway users and on improving sustainable mobility.
The rest of the article is organized as follows:
Section 2 proposes a brief background on ridesharing in Slovenia which is followed by survey among Slovene carpoolers and non-carpoolers to understand their attitudes.
Section 3 describes carpooling modelling and integration with macroscopic transport model. The results of carpooling and P+P lots’ impacts on transport and the environment is discussed in
Section 4. Lastly,
Section 5 concludes and discusses the findings of the study and presents a few directions for further research on the subject.
2. Ridesharing in Slovenia (Ljubljana Urban Region)
Ljubljana Urban Region (LUR) is located in the center of the country and is today home to around 537,000 inhabitants. It hosts around 43,000 students, 65,000 companies, a large number of tourists, and several events and festivals [
21]. One of the largest education institutions in Slovenia, the University of Ljubljana (UL), is located in the city of Ljubljana (LJ). UL has 26 departments (three art academies and 23 faculties), around 38,000 students, and 6100 staff [
22]. In the city of Ljubljana, governmental offices, public and private companies, and educational institutes are the three main trip attractors and have an important role in daily traffic inside the city and highways nearby. According to the statistics, around 127,600 people are travelling to LJ from other municipalities every day.
Over the last couple of decades, the average occupancy rate for private cars in Slovenia has decreased to approximately 1.35 persons/vehicle, and sometimes even less. Although there are PT services provided by the government and municipalities in the region, PT is still not seen as a sufficiently attractive means of transport. Therefore, the LUR can be considered as a car-dependent region in which the share of cars in transport is around 84.3%, while PT has only a share of 14.6% of total trips [
23]. Considering the daily congestion on Slovenian roads, it is necessary to find a solution that would reduce the demand on personal car usage and improve the level of services. Fewer vehicles on the roads would not only mean a reduction in the problems faced by personal cars, but also a decrease in fuel consumption and emissions, and an improvement in road safety. One such solution would be to “fill” the vacant seats within vehicles by encouraging people to travel in pairs or groups when travelling to the same destination point, or for at least a leg of the journey, thereby decreasing traffic volume.
For example, it is observed that travelers heading to LJ tend to carpool at interchanges close to settlement areas. The general finding is that the number of parked vehicles at collection points increases with distance from the destination point. We rarely noticed illegally parked vehicles next to interchanges within the ring of LJ. A variety of telecommunication media and services are used to connect the carpoolers. In Slovenia, according to our research, in addition to conventional voice communication over the telephone networks, the most widespread forms of communication occur via the internet or via the use of applications for smart phones. One of the common online platforms for carpooling and vanpooling is
www.prevoz.org.
Regarding ridesharing facilities, P+R places have been introduced in some parts of the city such as P+R Dolgi Most, Barje, Jezica, and Stozice [
24]. Generally, the only transport mode available nearby is a bus. Like other European capitals and cities, ridesharing, in particular carpooling, has become popular in LJ and all over Slovenia. According to a survey carried out by the authors in 2014, about 12,000 users offered carpooling rides through online platforms, of which 75% made offers more than once [
25]. We estimated offers where the destination was LJ to be around 1000 per day.
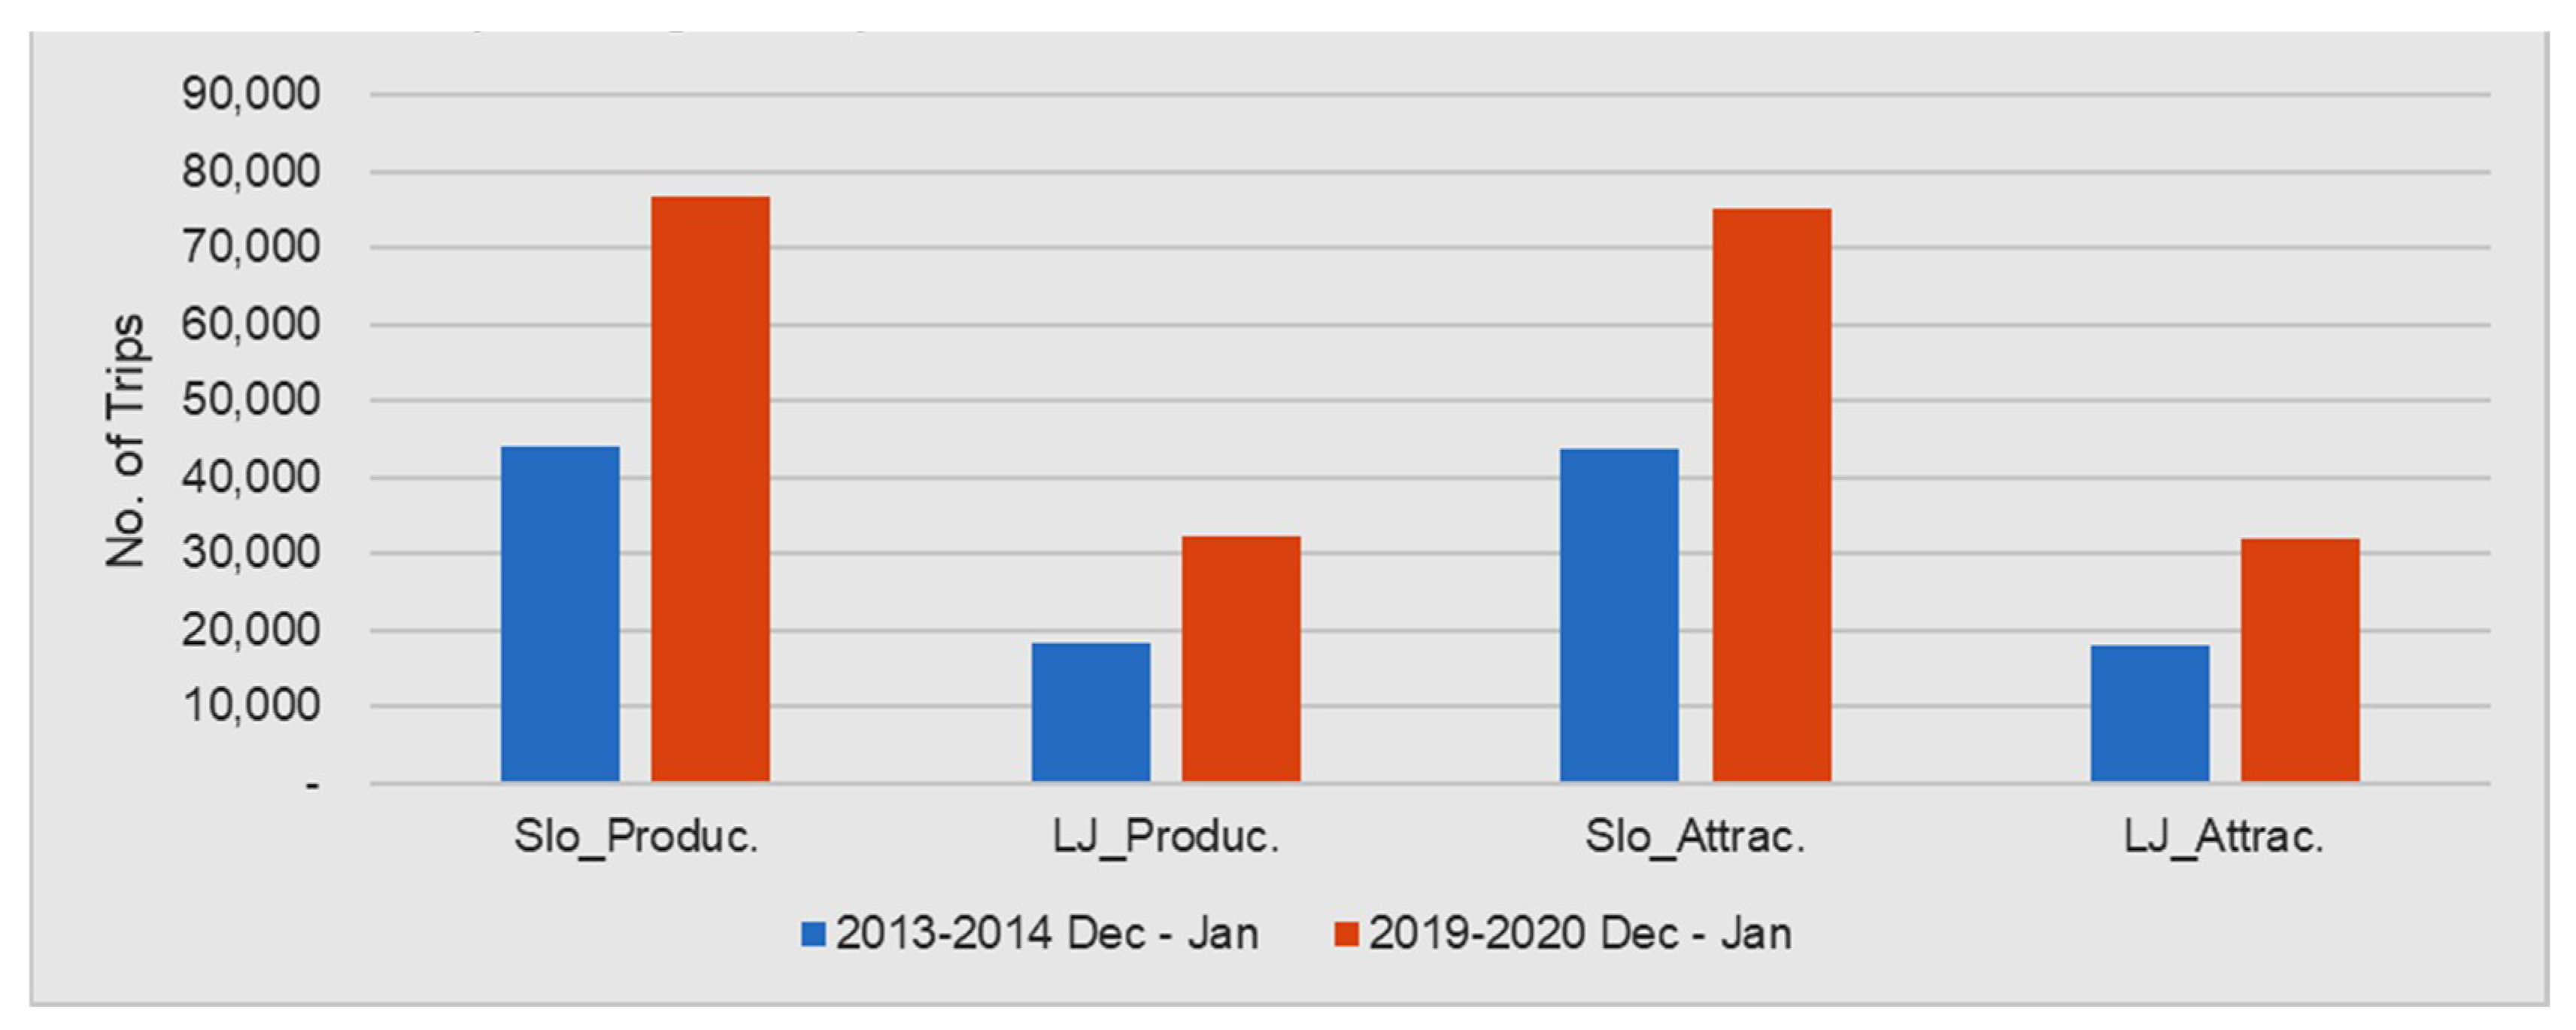
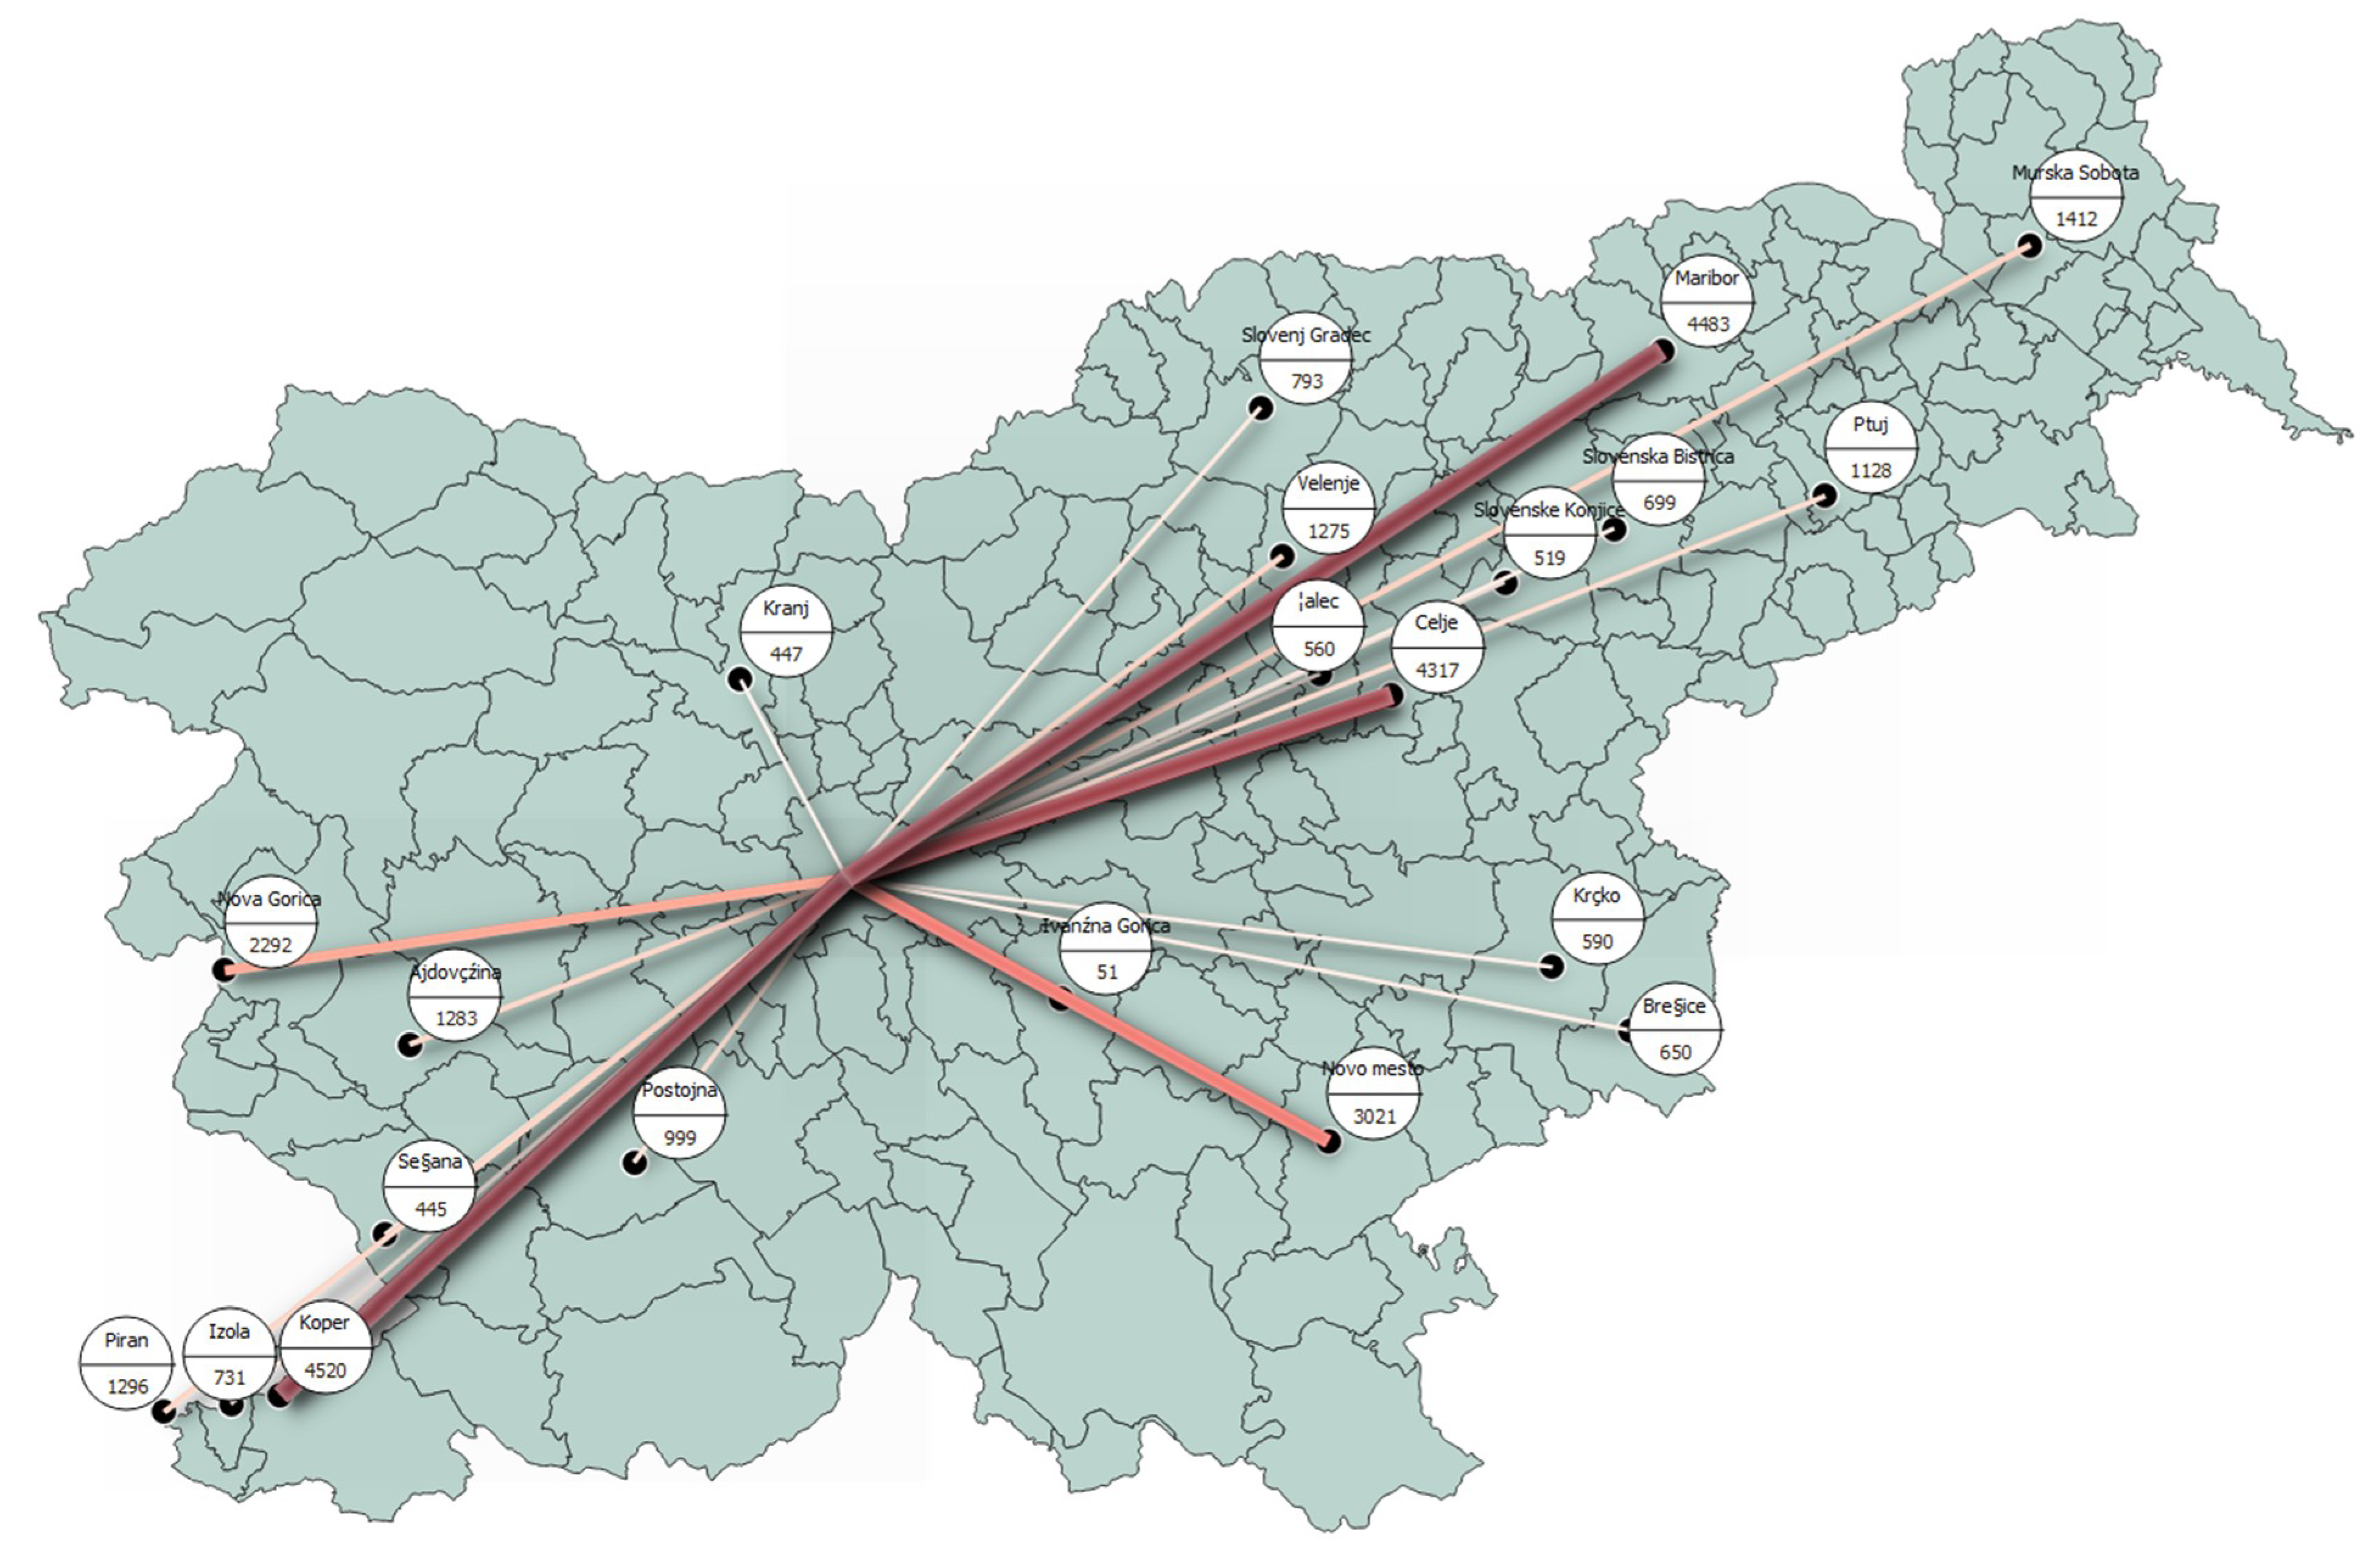
Considering the new carpooling data (10/12/2019 to 11/01/2020), it is obvious that there has been a significant increase in the number of carpooling trips offered by drivers (on average around 75%) over the last five years. We have prepared a rough comparison of carpooling trips provided from 10/12/2013 to 11/01/2014 and the same period for 2019 to 2020, divided into trips produced (trip origin) and attracted (trip destination) in Slovenia and also LJ. Having looked at
Figure 2, it can be seen that LJ (LJ_Produc. and LJ_Attrac.) has a share of around 42% of total trips produced-attracted in Slovenia.
Figure 3 demonstrates the average carpooling trip offers from/to LJ. However, carpooling has not yet been paid sufficient attention despite its merits of convenience, cost-efficiency, and sustainability in Slovenia.
In order to increase the proportion of people carpooling, it would be necessary to make infrastructural changes and effectively promote this mode of transport. One of the major issues that carpoolers and transport officials have faced over the years is illegal parking in unorganized lots near interchanges, resulting in chaos in terms of traffic management and physical safety (theft of vehicles). Having looked at the existing studies, it can be found that P+R facilities were studied and implemented well in LJ [
23,
26] and around the world [
27,
28,
29,
30,
31] to address this problem inside the cities. However, there is no scientific and robust study regarding the exploration of the effectiveness of the introduction of P+P lots near interchanges. Thus, this study’s objectives are as follows: (i) To explore the influencing factors in carpooling in Slovenia, and (ii) to model carpooling with special focus on P+P lots near interchanges.
2.1. Data Collection and Survey
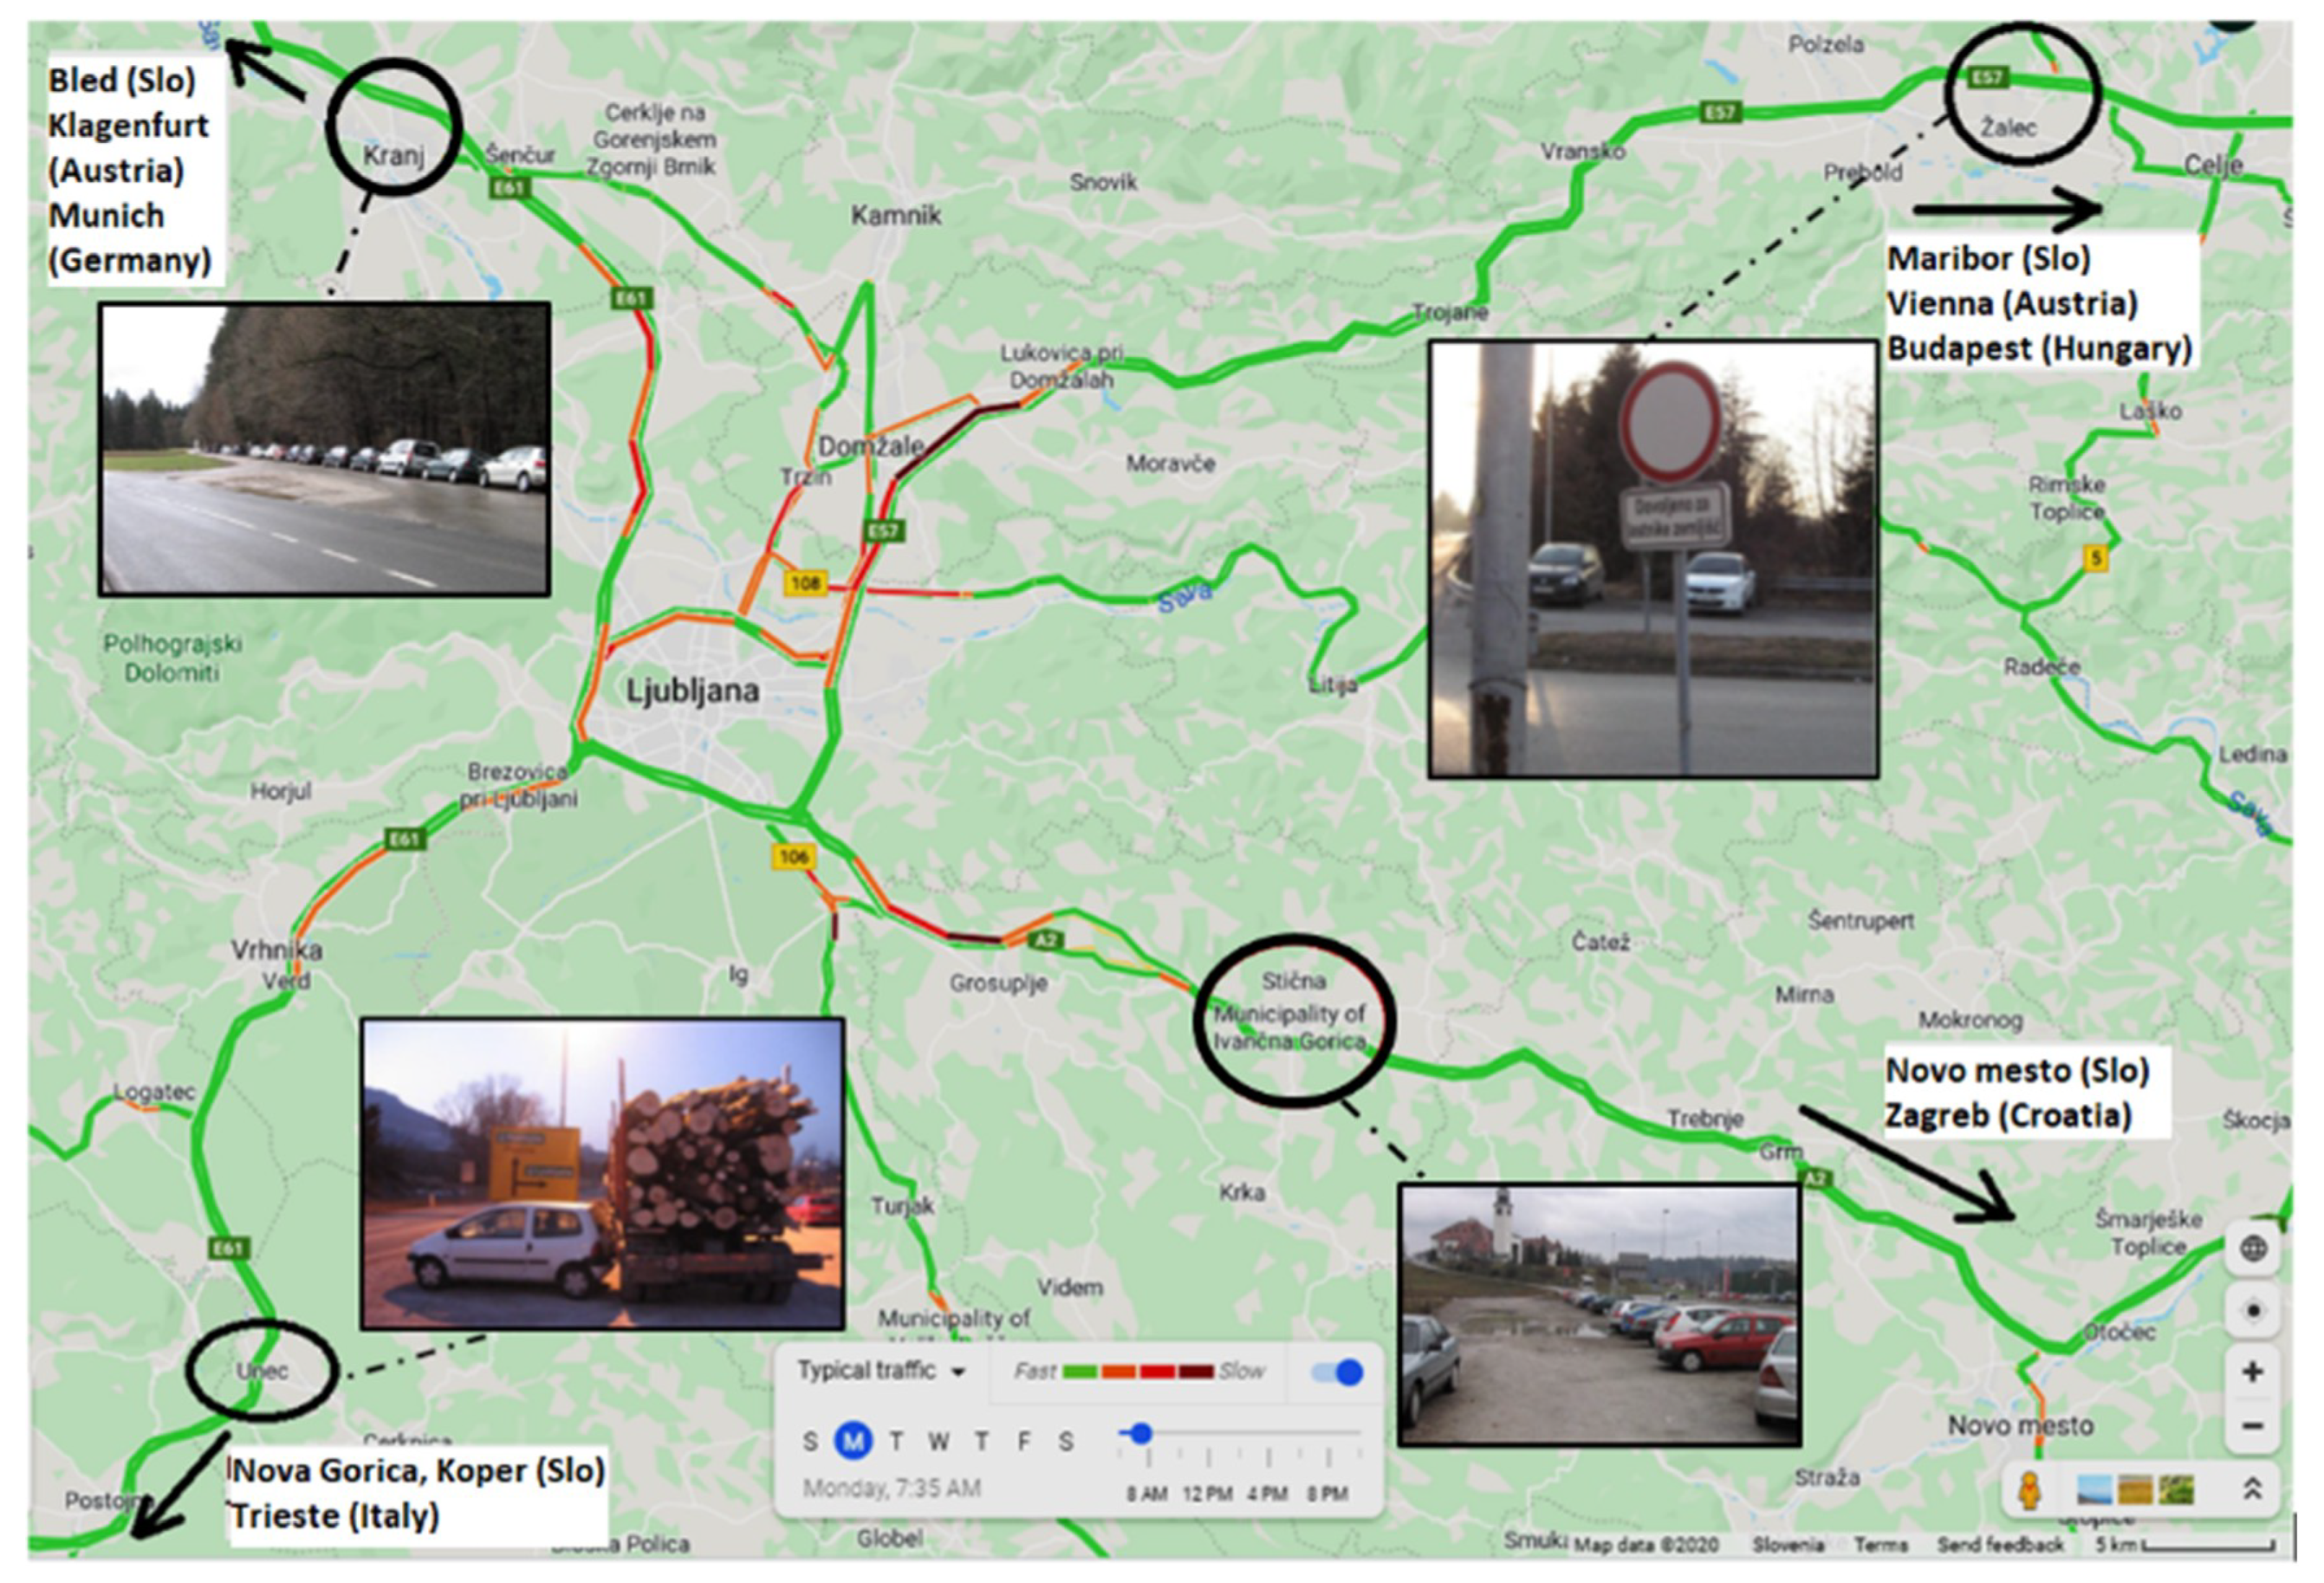
We conducted a survey among road users coming to LJ to examine the influencing factors on carpooling (
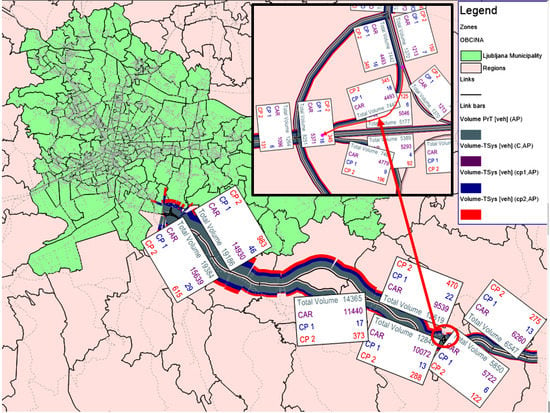
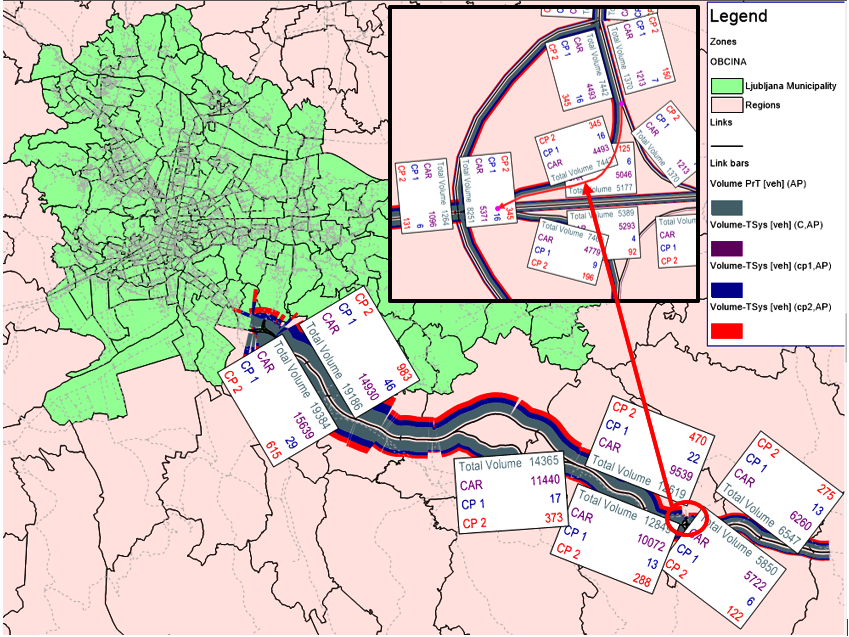
Appendix A). It is carried out between two different groups of users, namely (i) current carpoolers and (ii) non-carpoolers. The survey was carried out near interchanges, namely Primorska (e.g., Unec), Gorenjska (e.g., Kranj), Štajerska (e.g., Žalec), and Dolenjska (e.g., Ivančna Gorica) during the morning peak period. In all survey points, it is observed that some people park their car illegally on the roadside to take a carpool vehicle, as shown in
Figure 4 below. Therefore, we asked a few questions regarding the implementation of P+P lots near interchanges during the survey, too.
Figure 4 depicts the location of survey points with black circles. Traffic congestion levels on highways is shown for a Monday morning peak hour.
2.2. Survey among Carpoolers
Despite the fact that Slovenia is a small country and it is very difficult to collect data for bigger populations using interviews, our sample size was around 9% of the total number of vehicles travelling in peak hour. This means, in total, 247 questionnaires were distributed via envelopes among carpooling users at the selected locations. They were asked to deliver questionnaires through these two options: (i) To the interviewer a day after at the same place, (ii) to send them to our faculty via the prepaid post services.
The response rate was around 50%. Respondents were unbalanced in terms of gender including 57% male, and 43% female respondents, with an average age of 35 years. Respondents were mainly daily migrants. The largest number of them were travelling 5 days a week (54%), followed by those totaling 4 days a week (24%), and 6 days a week (12%). Among trip purposes, home to work trips had a share of 80%, while home to school trips were 16% of all trips. The majority (76%) most often travel with co-workers, to the same destination of travel (76%), and always with the same people (84%).
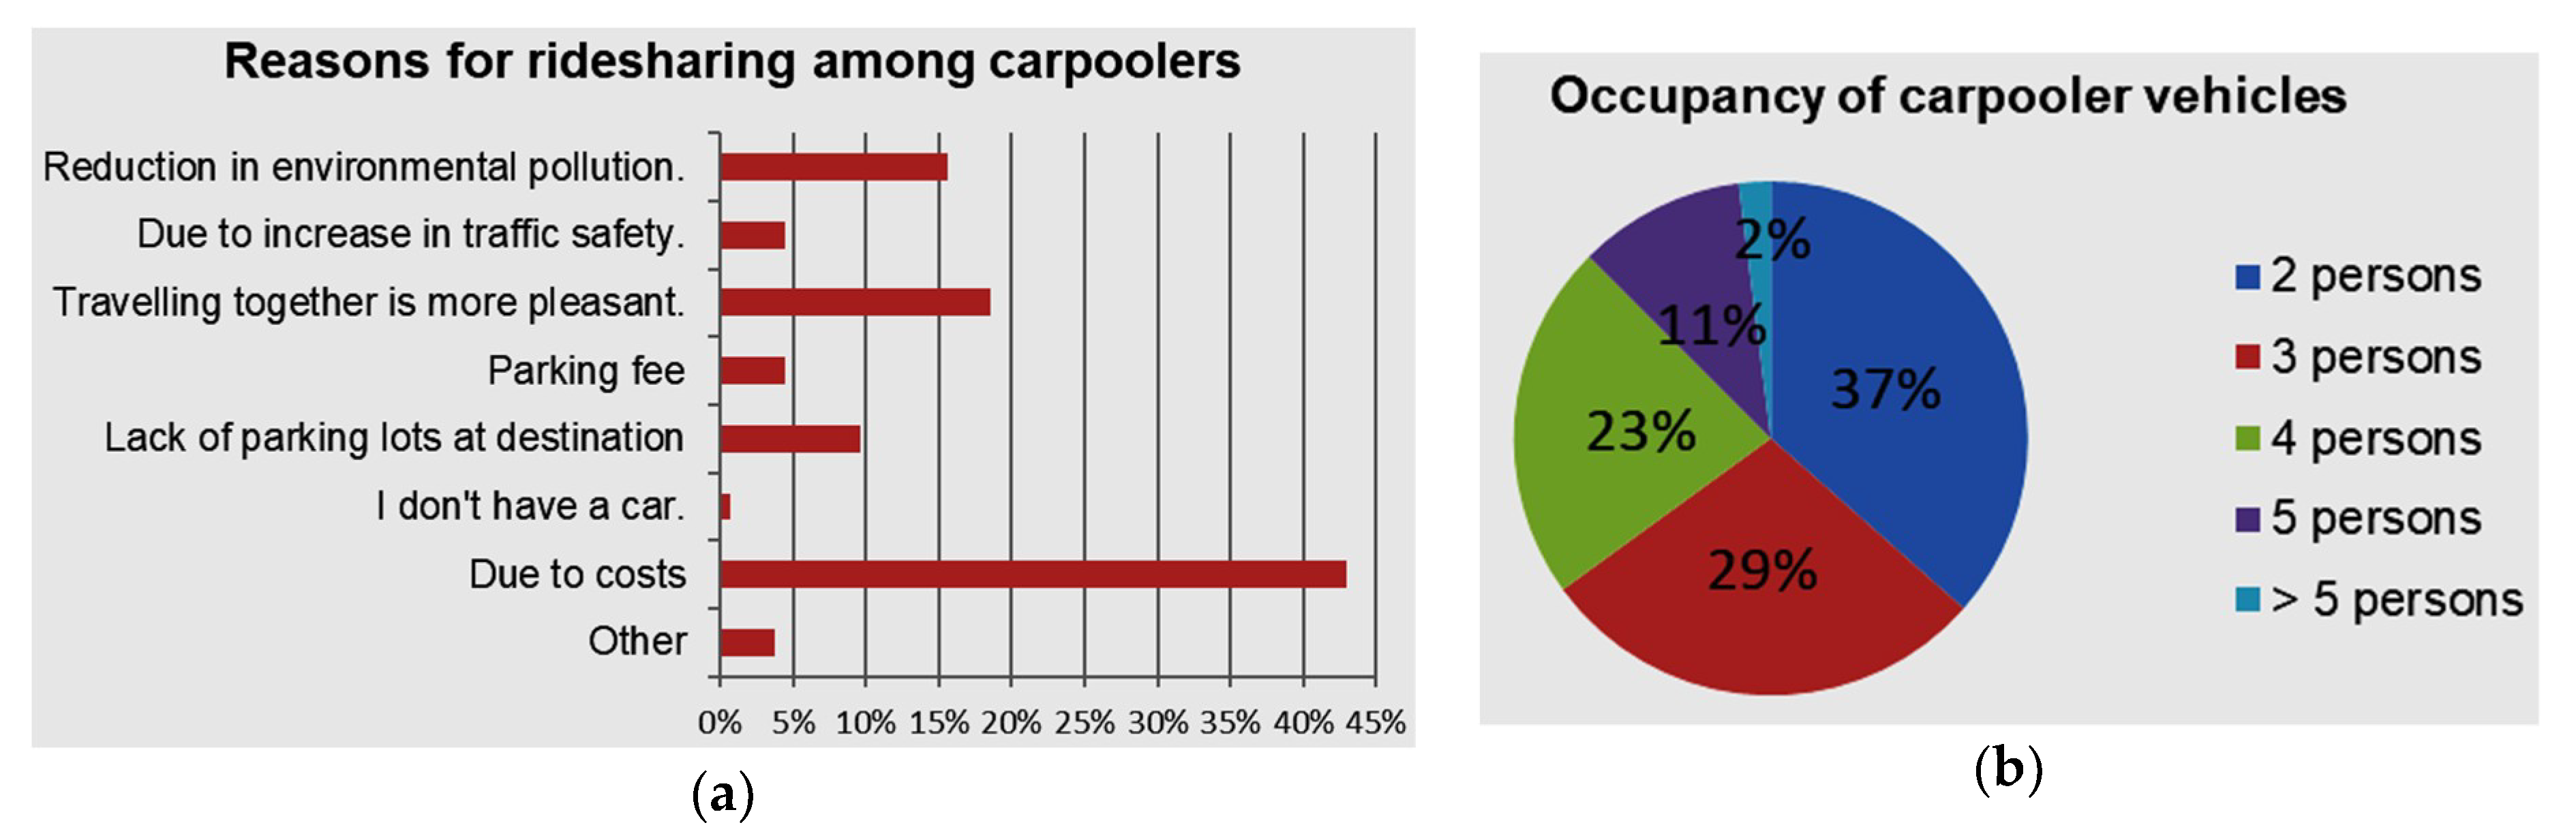
Figure 5 shows the most common reasons for carpooling and the occupancy of carpooler vehicles. As seen, the most important factor in choosing carpooling is “travel cost” with a share of 43%, followed by other factors such as “travelling together is more pleasant,” “reduction in environmental pollution,” and a “lack of parking lots at the destination”.
As noted, the average occupancy of vehicles is around 1.35 persons/vehicle in Slovenia. Through the field survey, we found that the average occupancy of the carpooler vehicles is around 2.98 persons/vehicle. This is a potentially good prospect for an increase in vehicle occupancy at peak hours in the event of a change in driving culture and vehicle sharing.
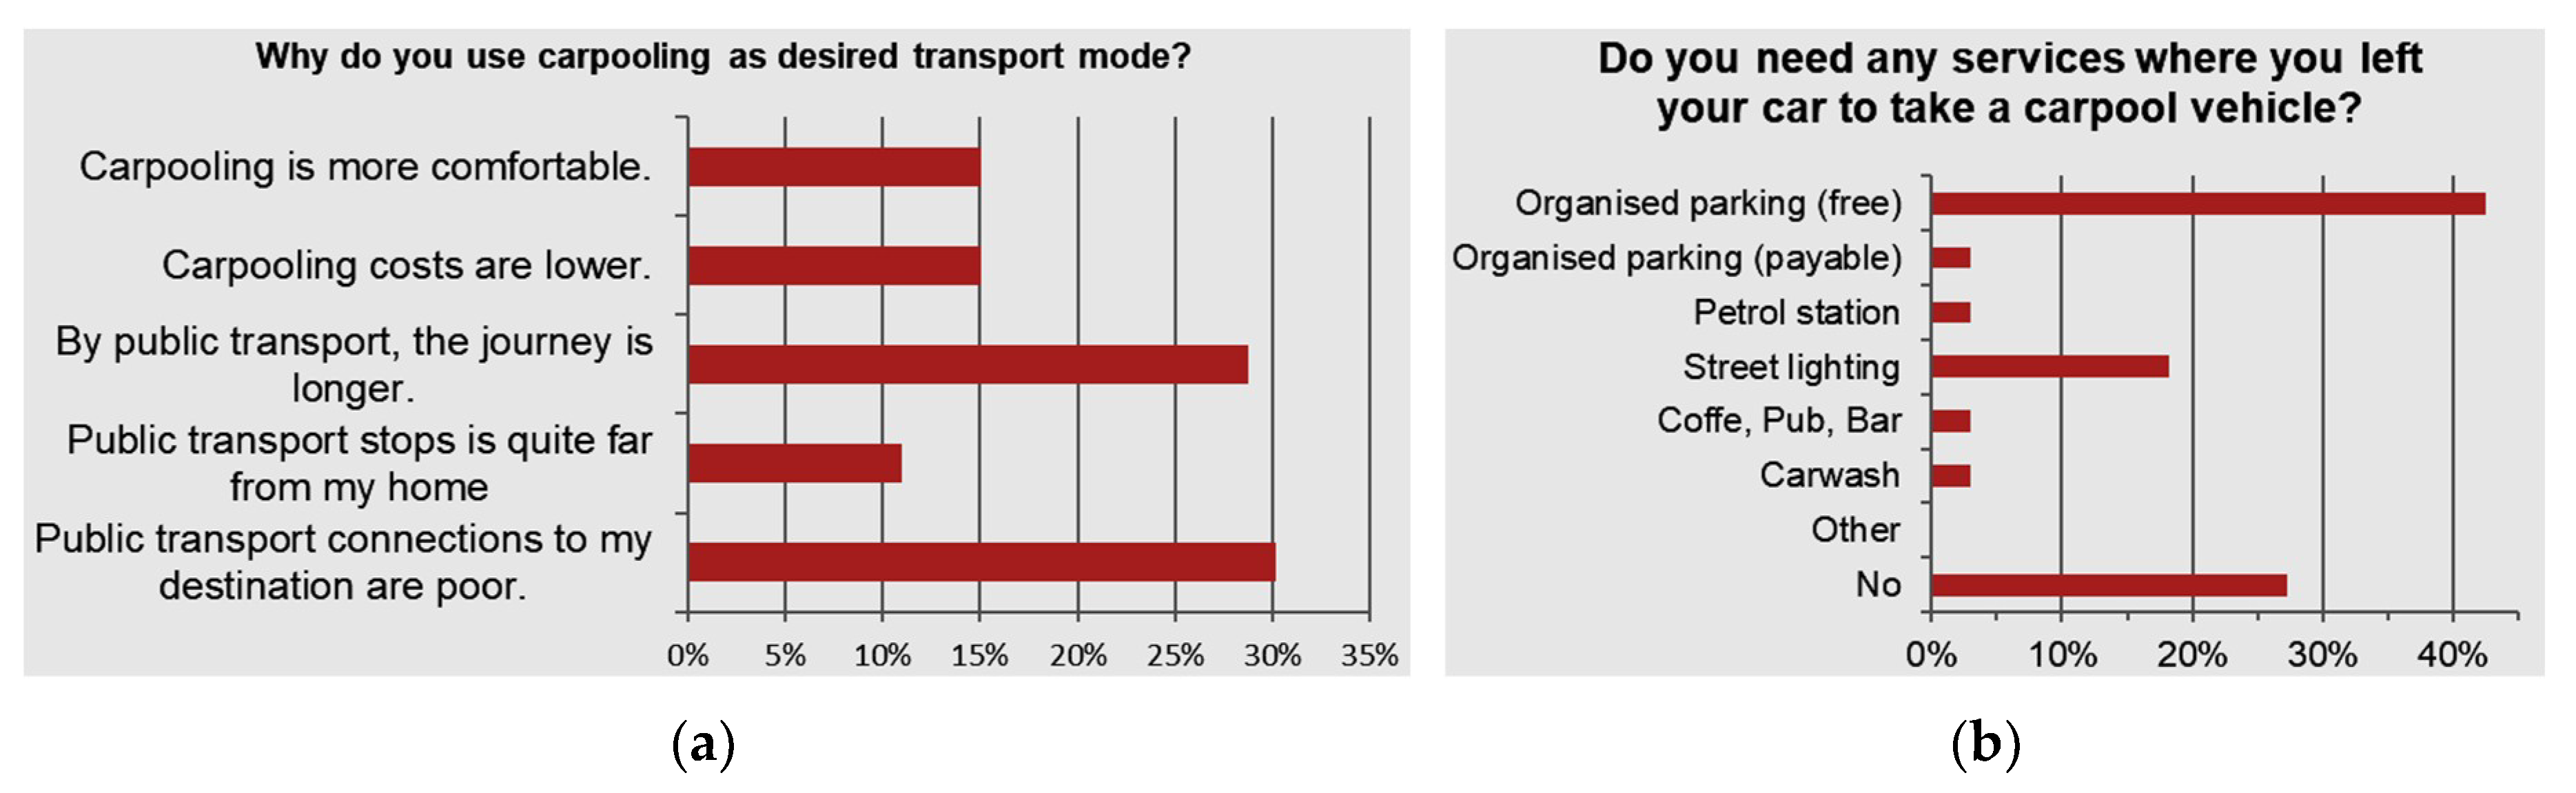
The answers to the question about the reasons for choosing a carpool car indicate that most of the people were dissatisfied with the available PT services and connections (see
Figure 6a). For today’s lifestyle, where the value of time plays a vital role, traveling by PT, especially over longer distances, is still too long compared to traveling by car. The disadvantages of PT in some locations are also reflected in the poor network diversification and the insufficient number of daily PT options offered by the government.
When carpooling users were asked about satisfaction regarding places where they leave their cars to take a carpool vehicle, only a quarter of those were unhappy with the location. They stated that it could be an organized parking lot. In the next question (see
Figure 6b), where respondents were offered the opportunity to choose additional services at this location, less than a third of respondents said that they did not miss additional services at the location. Most of them declared the need for organized parking lots that should remain free of charge, and some exposed poor public lighting.
Certainly, there is a need to arrange car parks for carpooling users to encourage ridesharing, but it is doubtful whether car parks should be charged for or not. According to the survey, most respondents would find another free location to park their car if parking was introduced. The purpose of the study is to promote such a mode of transport, so we believe that the introduction of parking fees is not a suitable solution for parking lots intended to attract road users to leave their cars during carpooling with another person. Only a quarter of respondents were prepared to pay a parking fee. The average amounts calculated from the respondents’ proposals were €1.40/day or €23 /month.
2.3. Survey among Non-Carpoolers
Once the survey among the existing carpooling users was completed, we conducted another survey among drivers who were not doing carpooling, and most often driving alone. The survey was carried out at the petrol and toll stations near to the selected interchanges in the afternoon peak. The questionnaires, together with the envelope and postage stamp, were distributed to identify the reasons why they do not carpool and what the motivation would be to opt for this mode of transport.
In this survey, the sample size was around 15% of the total number of vehicles travelling in peak hour. This means a total of 374 envelopes with questionnaires were distributed among non-carpooling vehicles. The response rate was around 61%. Respondents were quite gender-balanced consisting of 49% males and 51% females. The average age of the respondents was 38.5 years. The target group of the survey was drivers who drove without passengers. Of those surveyed, 82% of drivers regularly travel without passengers. Most of them commute to work (87%), but they are daily migrants, as they travel 5 days a week (78%), followed by those who travel 6 days a week (11%). The majority of those surveyed were locals who reside in the vicinity of the selected interchanges, and most of them were commuting to LJ daily.
In the preparation of the survey, we considered the possibility that people need their cars for mobility at the destination. In addition, they probably do not have the opportunity to go to the destination with another person. However, the results of the survey showed as many as 84% of those surveyed do not need their own car at destination, while 14% of them stated they need it. More than expected, around 56% of respondents, also stated that they have an option to drive with someone to the same destination, while 44% of them stated they do not have any ridesharing options.
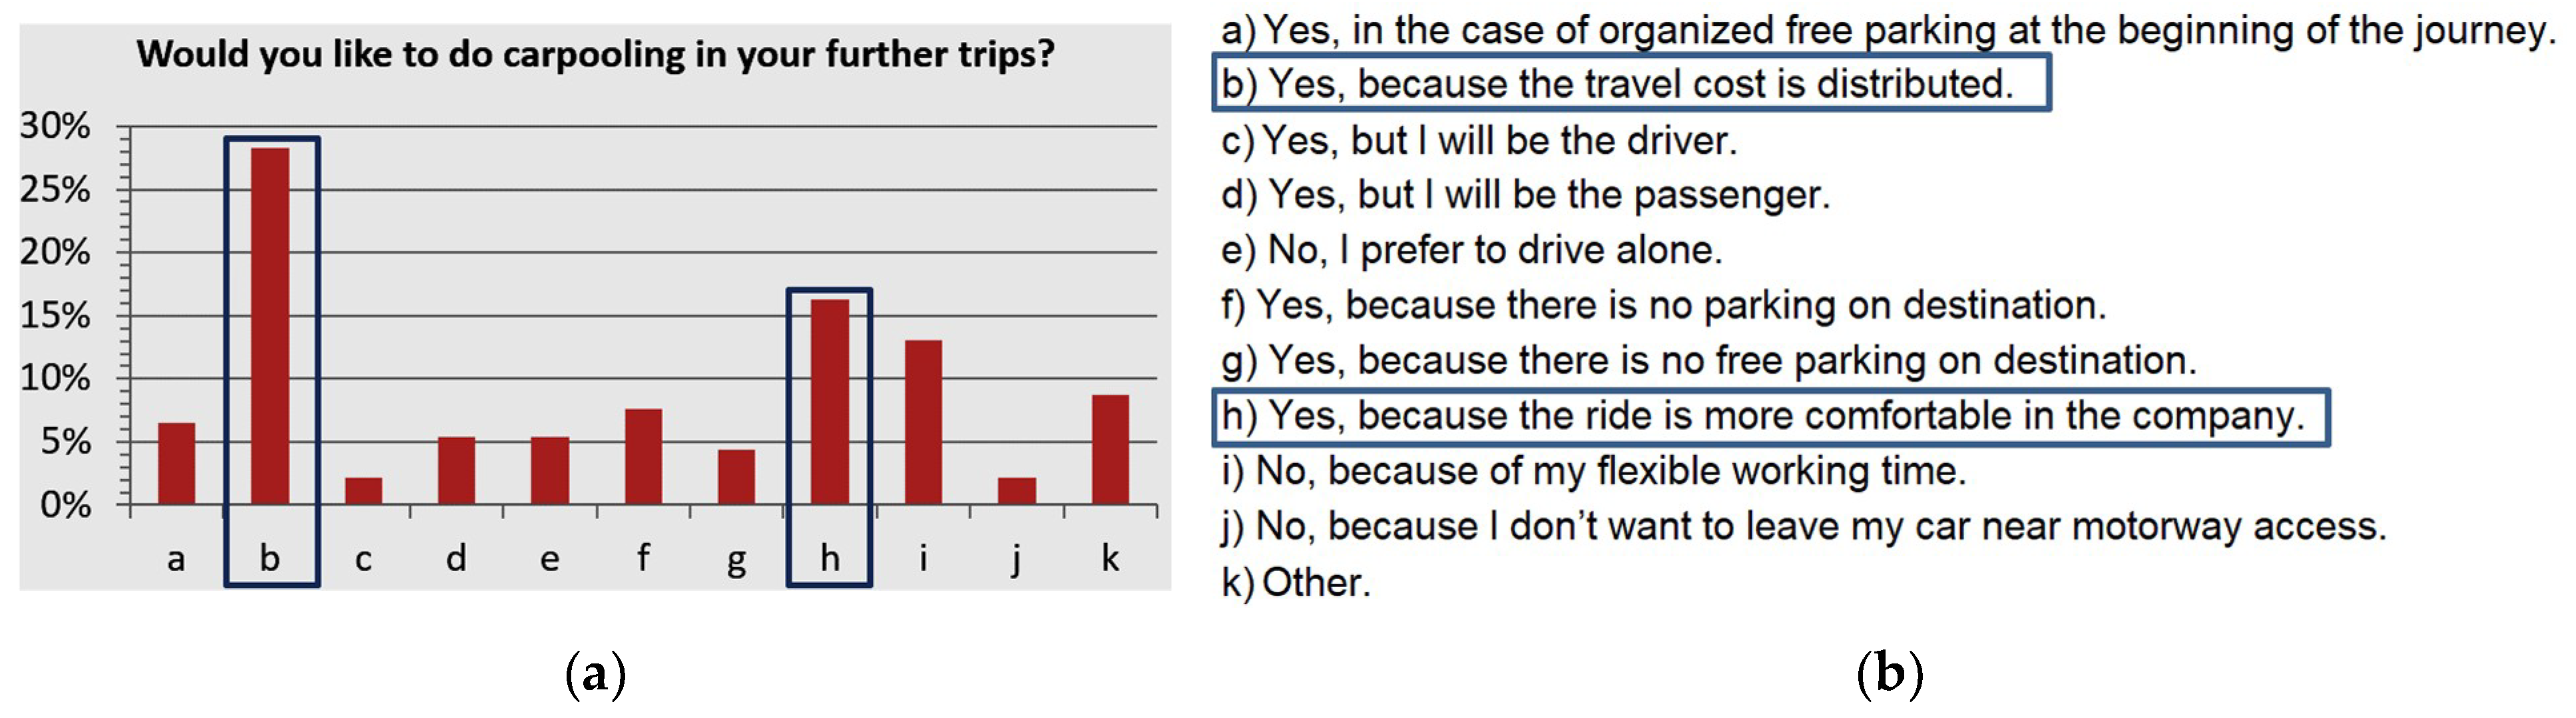
The respondents were also asked about their views for and against carpooling through a multiple-choice question as shown in
Figure 7. The analysis of the answers showed a similar situation as in the case of the survey conducted among existing carpooling users. The most influential factor for doing carpooling is the distribution of costs. In addition, respondents believe that driving in company with others is more enjoyable than driving alone. A small proportion of the answers were those who are not interested in carpooling and prefer to drive alone.
Obviously, the main reason why people do not opt for carpooling is the variable working hours causing difficulties in coordination of departures from home to work or from work to home. Among other things, the respondents stated that freedom of movement is restricted by carpooling. Moreover, some of them were disturbed by the delay of other passengers, which is another important factor for the successful coordination and implementation of carpooling. Rarely, respondents were concerned about leaving their car at the places near interchanges, or if they were in carpooling vehicles, they prefer to be driver.
The finding of a parking lot at the destination or parking fee at the destination were not a big concern for the respondents (73% of respondents do not have a problem with parking at the destination). From this, it can be summarized that parking facilities at the destination will not motivate new users of the carpooling mode, so it will be necessary to look elsewhere for motivation.
One of the possible motivations is P+P parking lots near highway connections, as 59% of respondents are willing to leave their car in such lots. Then, they continue their journey with another person heading to the same or nearby destination. For some, even the setting up of a tidy parking is a prerequisite for making a decision on carpooling. Considering answers to the question about the cost sharing of a possible carpooling, it can be concluded that many respondents are willing to pay for carpooling. Travelers often do not reside close to each other, so they would need a well-organized parking lot at the collection point to continue their journey.
To promote carpooling, online platform and infrastructure limitations should be improved by service providers and transport officials. In our case study, these limitations identified:
Carpooling platform should have (i) simplified communication or confirmation of a ride (one-click booking), (ii) different payment options such as cash, and bank cards, (iii) driver/passenger rating system (e.g., reliability, punctuality, etc.), (iv) pick-up/drop-off points rating system (e.g., location, safety), (v) insurance scheme (part of each payment for a ride could be allocated for passenger insurance).
P+P lots should have (i) good lighting (night use of parking lots), (ii) charging stations for electric vehicles for cases such as electrical carsharing, bike-sharing, scooter-sharing, (iii) dedicated parking spaces for two-wheeled forms of transport (e.g., bicycles) and vulnerable users (disabled and/or elderly people), (iv) telecommunications connection to road management system, (v) traffic variable message signs (shows parking capacity online), and (vi) video surveillance of the area for safety and security reasons.
3. Carpooling and Park and Pool Lots Modelling on Highways
A disaggregated four-step transport model has been developed for LUR which contains personal car, PT, cycling, and walking modes [
33]. The model was developed using a well-known transport demand modelling software, PTV VISUM [
34]. The model contains 482 zones, more than 13,000 nodes and more than 30,000 links. It contains all the data about PT lines, stops, and timetables. The standard four-step transport model generally includes the trip generation, trip distribution, mode choice, and assignment steps. Trip purposes can also be defined as home–work, home–school, home–shopping, home–leisure, home–rest, work–home, school–home, shopping–home, leisure–home, rest–home, work–other, other–work etc.
To model the effects of ridesharing on the mode choice and travel behavior of people, the existing calibrated and validated LUR transport model should be upgraded. To this end, two new transport systems (tsys) have been introduced in the VISUM model for LUR as follows: (i) CP1: Carpool using P+P lots, and (ii) CP2: Direct carpool. From driver’s point of view, CP1 referred to as a driver comes to the P+P lots by a private car, and then pick up the passengers (who already left their car at P+P parking lots). While the CP2 refers to a driver collecting passengers from their homes along the journey.
Generally, random utility theory and mode choice models (nested, multinomial and mixed logit, and probit) have been used to model the travel behavior of people in different situations [
35]. The general formula of utility of mode choice (U
i) is:
where
Vi indicates the systematic component and
indicates the random component of the total utility of choosing mode
i from
n modes.
There are also different kinds of logit (logistic probability) models which can be used in modal split step of traditional four-step transport models or EVA model [
36], namely multinomial logit, binary logit, and nested (hierarchical) logit models. In the general form of nested logit model, there are two transport modes, car and PT. PT has also two sub-group modes: Bus and metro. The probability of selection of a specific mode (PT and metro) can be formulated as follows:
In this study, the nested logit model has been used to incorporate carpooling into the LUR transport model. After the trip distribution and modal split phases in the EVA model, where origin–destination matrices for all modes were calculated, we add an additional mode choice model for the home–work, and work–home journeys. At this stage, we first divide the trips according to whether they travel alone by their private car (without taking passenger), hereinafter called CAR, or involved ridesharing hereinafter called CP (carpooling). We then divide the trips involving ridesharing into two categories, namely CP1 and CP2. The nested logit model has been used in this study to represent these two transport modes so-called CAR and CP, and the sub-group of CPs namely CP1, and CP2. The viability of given CAR can be calculated by the following formula:
The utility function of CP1 user can be calculated by the formula:
The utility function of CP2 user can be calculated by the formula:
where:
tt: Travel time
lt: Time lost due to waiting by a passenger/for a passenger: 1.1 min/passenger
dist: Distance
OCCCP1: Average occupancy rate of the CP1 car: 3,
OCCCP2: Average occupancy rate of the CP2 car: 2,
OCCCAR: Average occupancy rate of the car: 1.35,
Cost: Travel costs per kilometre travelled: €0.08/km,
Places: Number of parking spaces
Type: Organization of parking site (1: Un-organized, 2: Marked, 3: Marked and asphalted, 4: 3 and lit, 5: 4 and security measures present)
Total utility of CP1 and CP2 has been calculated using the following equation:
The likelihood of using modes CP1 and CP2 has been calculated using the following equations:
Lastly, the equilibrium-Lohse [
36] method has been used for the assignment step. Then, to evaluate the effects of carpooling and P+P lots near interchanges, a P+P lot has been modelled in one of our observation points at the Ivančna Gorica (IG) interchange, along the A2 highway; LJ–Novo Mesto (Slovenia)–Zagreb (Croatia) direction. We conducted traffic counting on three groups of vehicles, namely normal cars, cars with occupancy more than two people, and cars parked illegally on the roadside in the study area. To validate our model using the these modal split formulas, the study area has been simulated with the existing carpooling users and the users parking their car illegally. Then we compared the results of mode choice with the vehicle counting results to ensure that our model represents the actual conditions properly (Scenario V0: Current situation). Once the validity of the model was achieved, the following scenarios were developed and analyzed by the LUR transport model:
Scenario V1 (implementation of P+P lot near IG interchange): We simulated the effectiveness of introducing the P+P lot in one of the locations where we observed illegal car parking by carpoolers. We estimated that this scenario will increase the number of carpooling users (CP) in general.
Scenario V2 (Scenario 1 with the possibility of using bus lanes in LJ): We simulated the effectiveness of introducing the possibility for vehicles with two or more people in LJ to use the dedicated bus lane. We estimate that this option reduces travel time by one-third.
Scenario V3 (Scenario 2 and a congestion pricing for entry into LJ): We simulated the effectiveness of introducing a congestion pricing policy (entry fee of 5 euro) in LJ. Thereby, we tried to understand the impacts of travel cost on the mode choice of carpooling users.
These scenarios have not been produced by the LUR transport model. Scenarios which incorporate carpooling were evaluated by the LUR model. Scenario analysis results are discussed in the next section in terms of their impacts on traffic, economics, and the environment.
4. Results and Discussions
4.1. Traffic Impacts Analysis
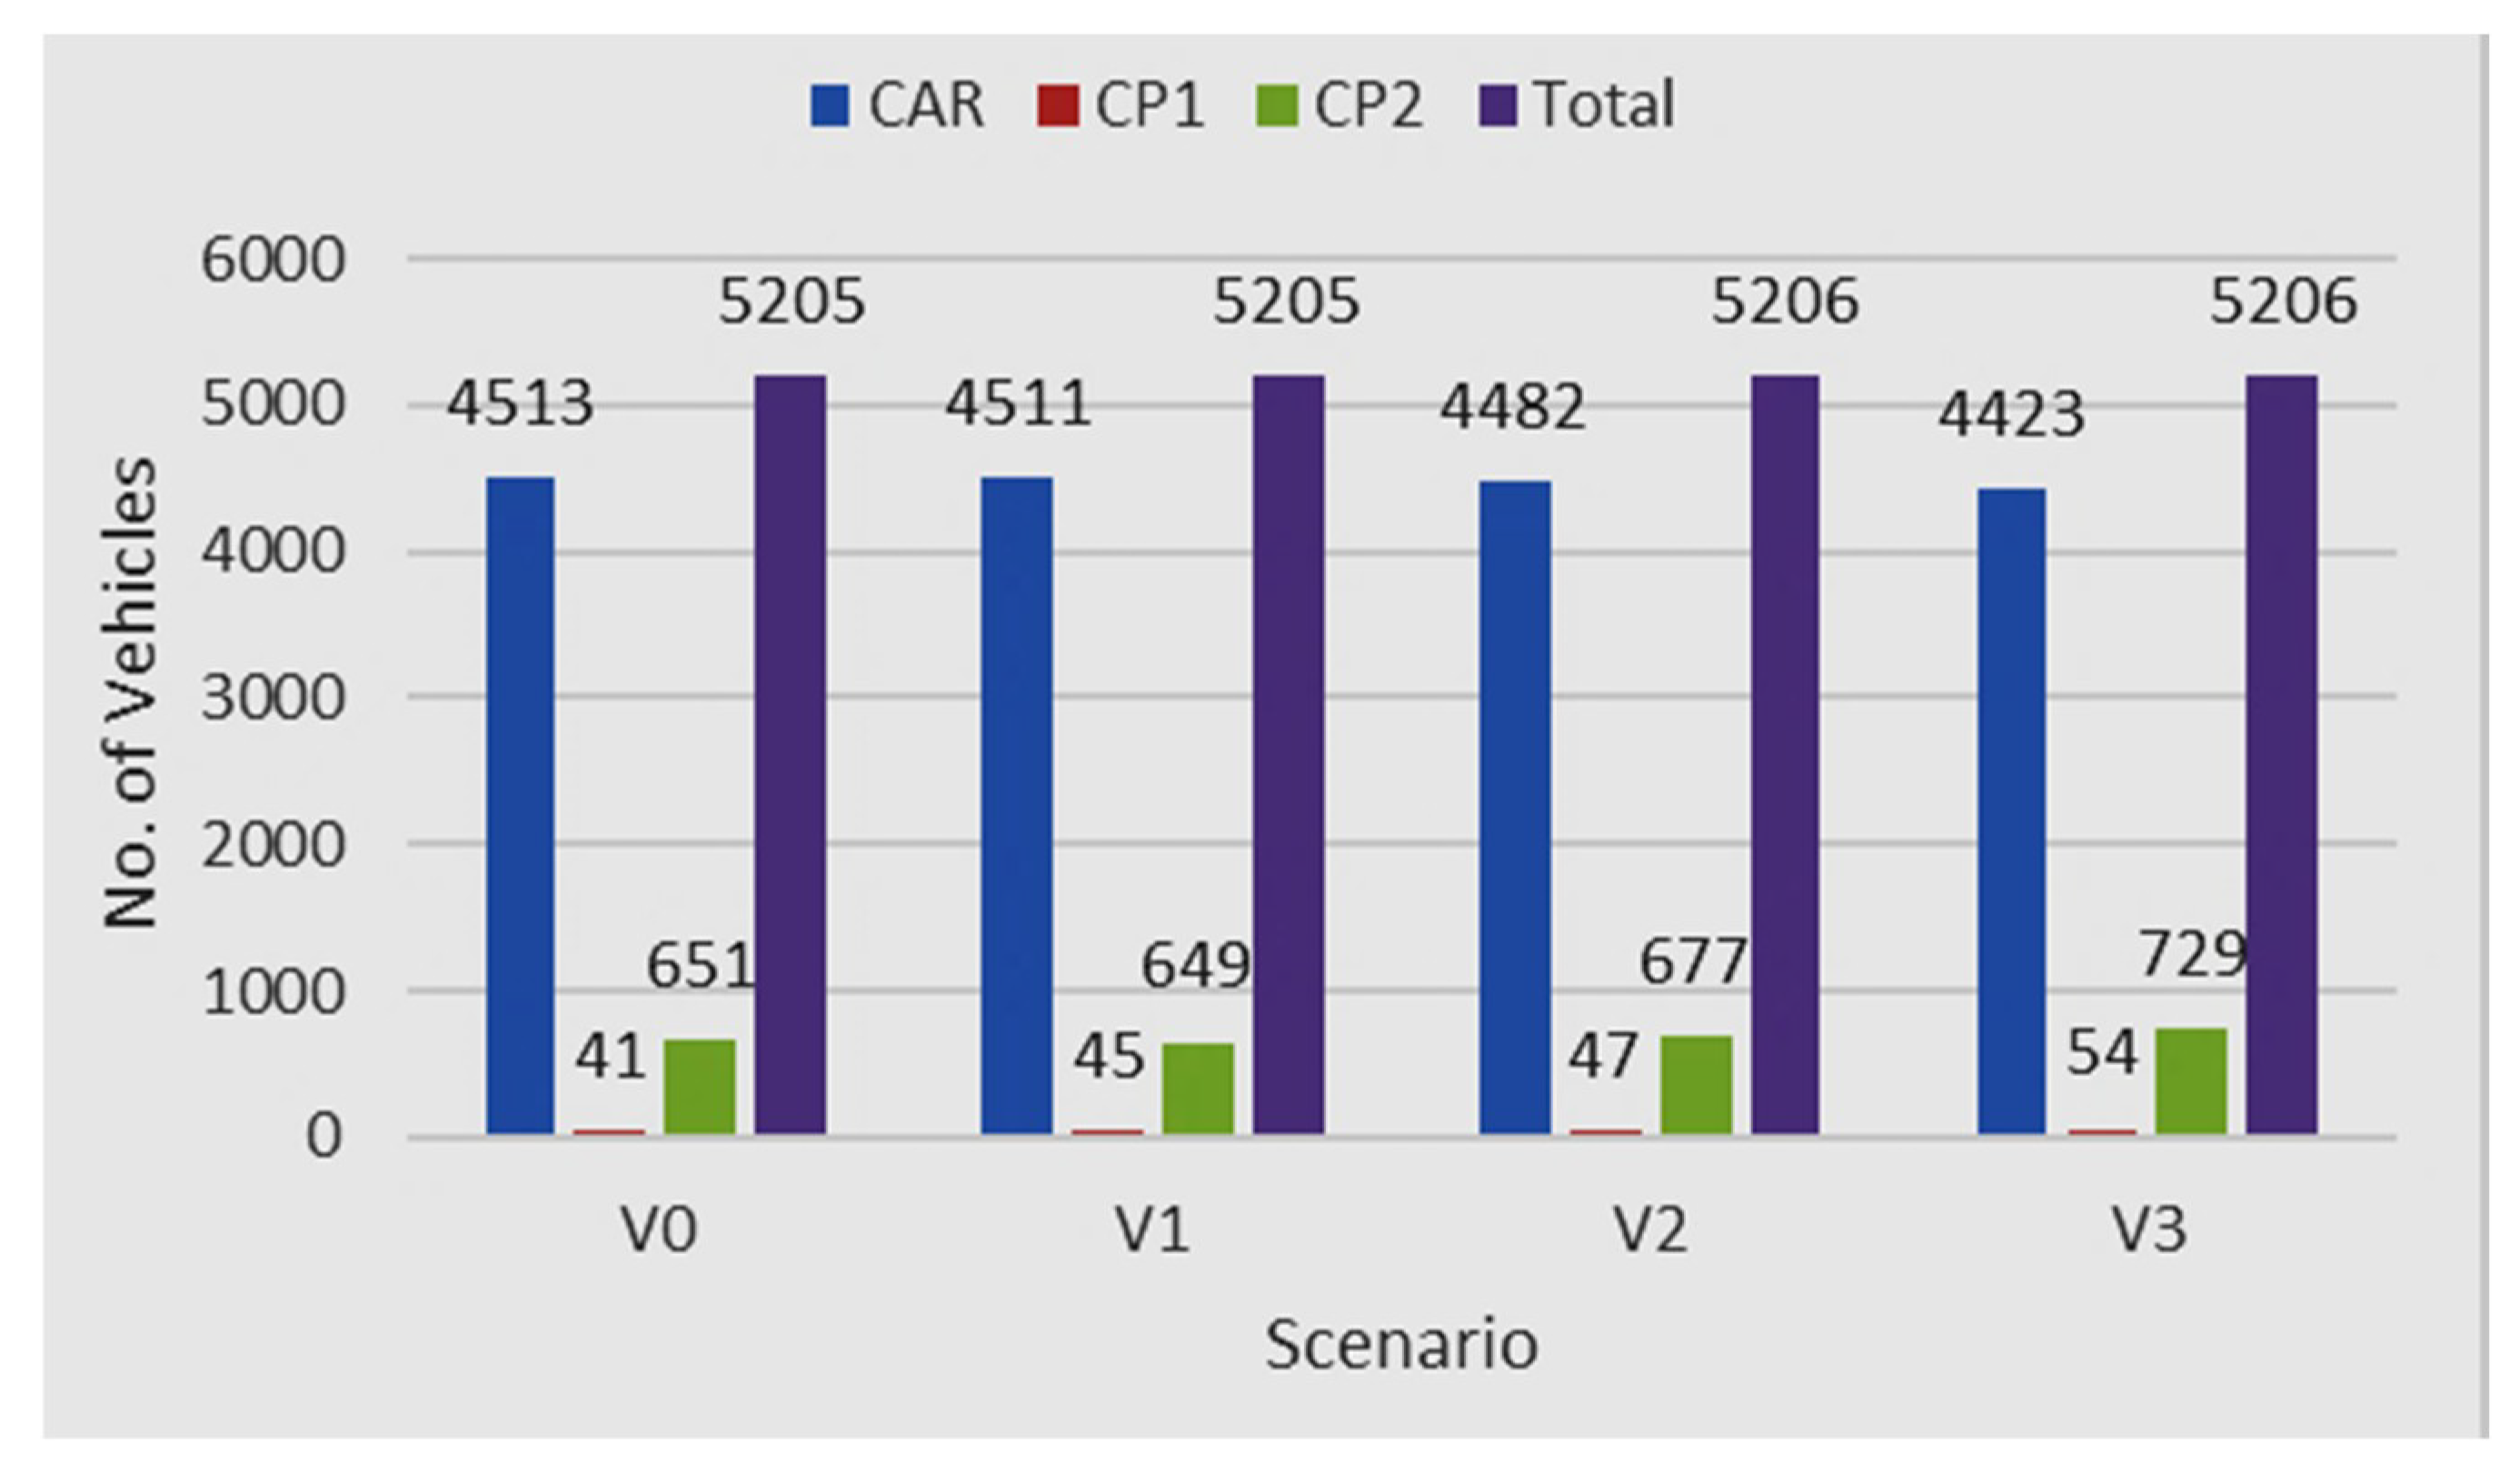
In this section, the transport network measures will be discussed in two segments: (i) On the ramp of the Ivančna Gorica (IG) connection to LJ, and (ii) on highway segment between Novo Mesto and LJ crossing IG interchange. In the current situation (V0), a total of 5205 trips per working day are made on the ramp of the IG connection to LJ. It comprises of 4513 CAR trips (87% of all) in which the driver is alone and 692 CP trips (13% of all) with more than one person. The results of the calculation show that of these 692 trips, 41 were those where passengers entered the P+P lot and changed into a common vehicle (CP1), and 651 were trips where the passengers started the journey either at the driver’s home or were picked up by the driver on the way (CP2).
Figure 8 shows the transport modal split for the ramp of the IG connection to LJ. For example, in scenario V2, which is thought to be realistic and achievable, the number of journeys by private cars would be reduced by 0.8%, mode CP1 would increase by 15%, and mode CP2 by 4%. On a daily basis, this would mean approximately 1250 fewer vehicle kilometers travelled. If this is expressed in monetary terms, then this represents an annual savings of around 25,000 EUR over the current situation, of which 10% would be savings in external costs [
37].
The regulation of the P+P (V1), without any other measures, has little effect on increasing its use (less than one percent). However, the introduction of P+P lots with the possibility of using LJ’s bus lanes leads to an increase in the use of group transport by two percent. Last but not least, considering the results of third scenario, it is found that P+P lots implementation near interchanges in combination with congestion pricing policies inside the cities results in an increase in the use of carpooling by one percent more compared to other scenarios.
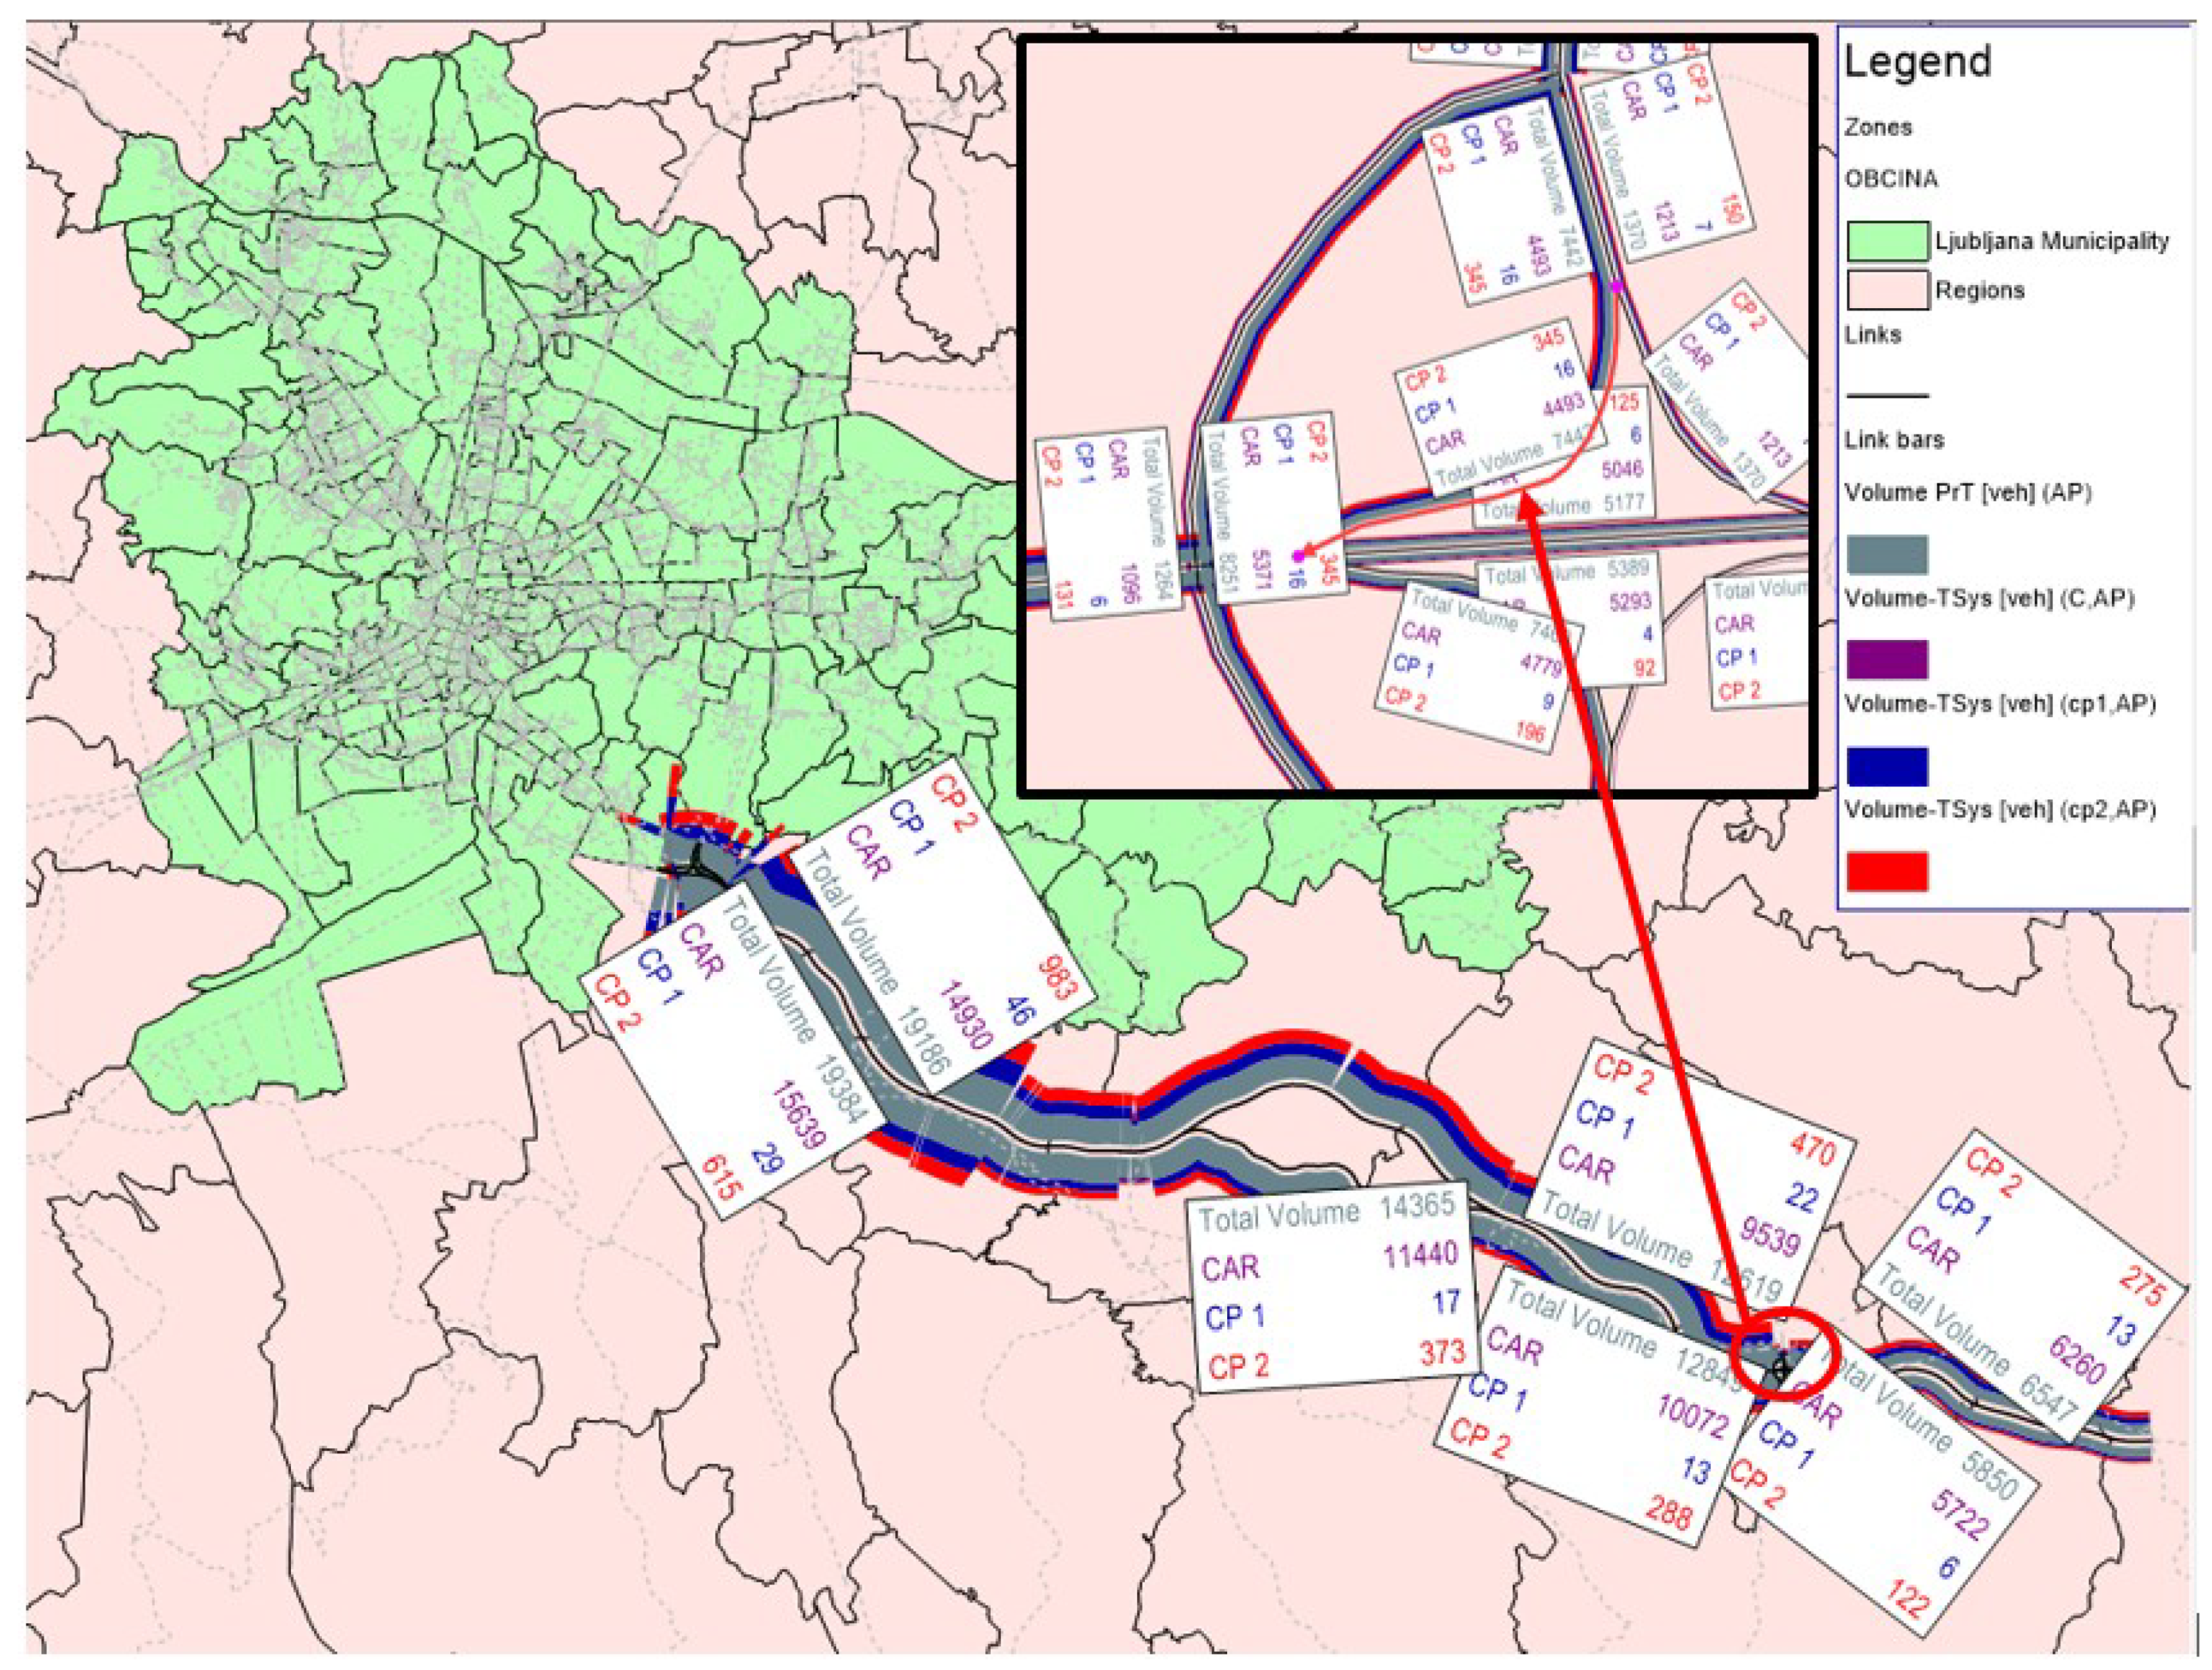
Figure 9 demonstrates the modal split results for scenario V2 at both IG interchange and on a highway segment with a length of 68.8 km.
To have a broad view of the effectiveness of the introduction of P+P lots near highways, we need to evaluate the highway segment’s results as well. To do so,
Table 1 summarizes traffic performance measures’ results such as total traffic volume, total VKT (vehicle-km), total travel time (veh-hour), and total delay (hour) per a working day.
Having looked at the model results, it can be found that scenario V3 is the best scenario for this segment of IG–LJ highway, with the capability to reduce the total traffic volume by 4567 vehicles, total VKT by 3797 veh-km, total travel time by 75 veh-hour, and total delay by 40 h. Simultaneously, Scenario 2, noted as the more realistic and implementable scenario, has reduced the total traffic volume by 2413 vehicles, total VKT by 2256 veh-km, total travel time by 35 veh-hour, and total delay by 16 h. In this study, the P+P lot was modelled for only one intersection on highway (i.e., IG). However, the results presented changes in the whole LUR area and not only for one intersection. Although the differences seem to be not noticeable, e.g., 0.5% reduction in total volume in V3 compared to V0, in such studies is a remarkable change (4567 fewer vehicles).
4.2. Economic and Environmental Impacts Analysis
The calculation of all environmental measures is based on transport volumes. The volumes are adopted from the assignment results of the model. That means the current traffic volume, speed, and travel time per link and transport mode were obtained via links.
Road traffic air emissions have been determined based on emission factors provided by the Swiss Federal Office for the Environment (BAFU) using the macroscopic simulation model [
34]. According to the software manual, the calculation of the pollutant emission values is carried out using the speed values for cars and heavy vehicles (HGV), with every value multiplied by the number of vehicles. This procedure is based on emission factors issued by BAFU for pollutants NOx, CO, HC, and SO
2, for both cars and HGVs. To calculate the emissions, the following regression polynomial curve (fifth degree) has been used:
where
v is the speed (km/h) of cars or HGVs and the coefficients namely a, b, c, d, e, and f are determined separately considering BAFU.
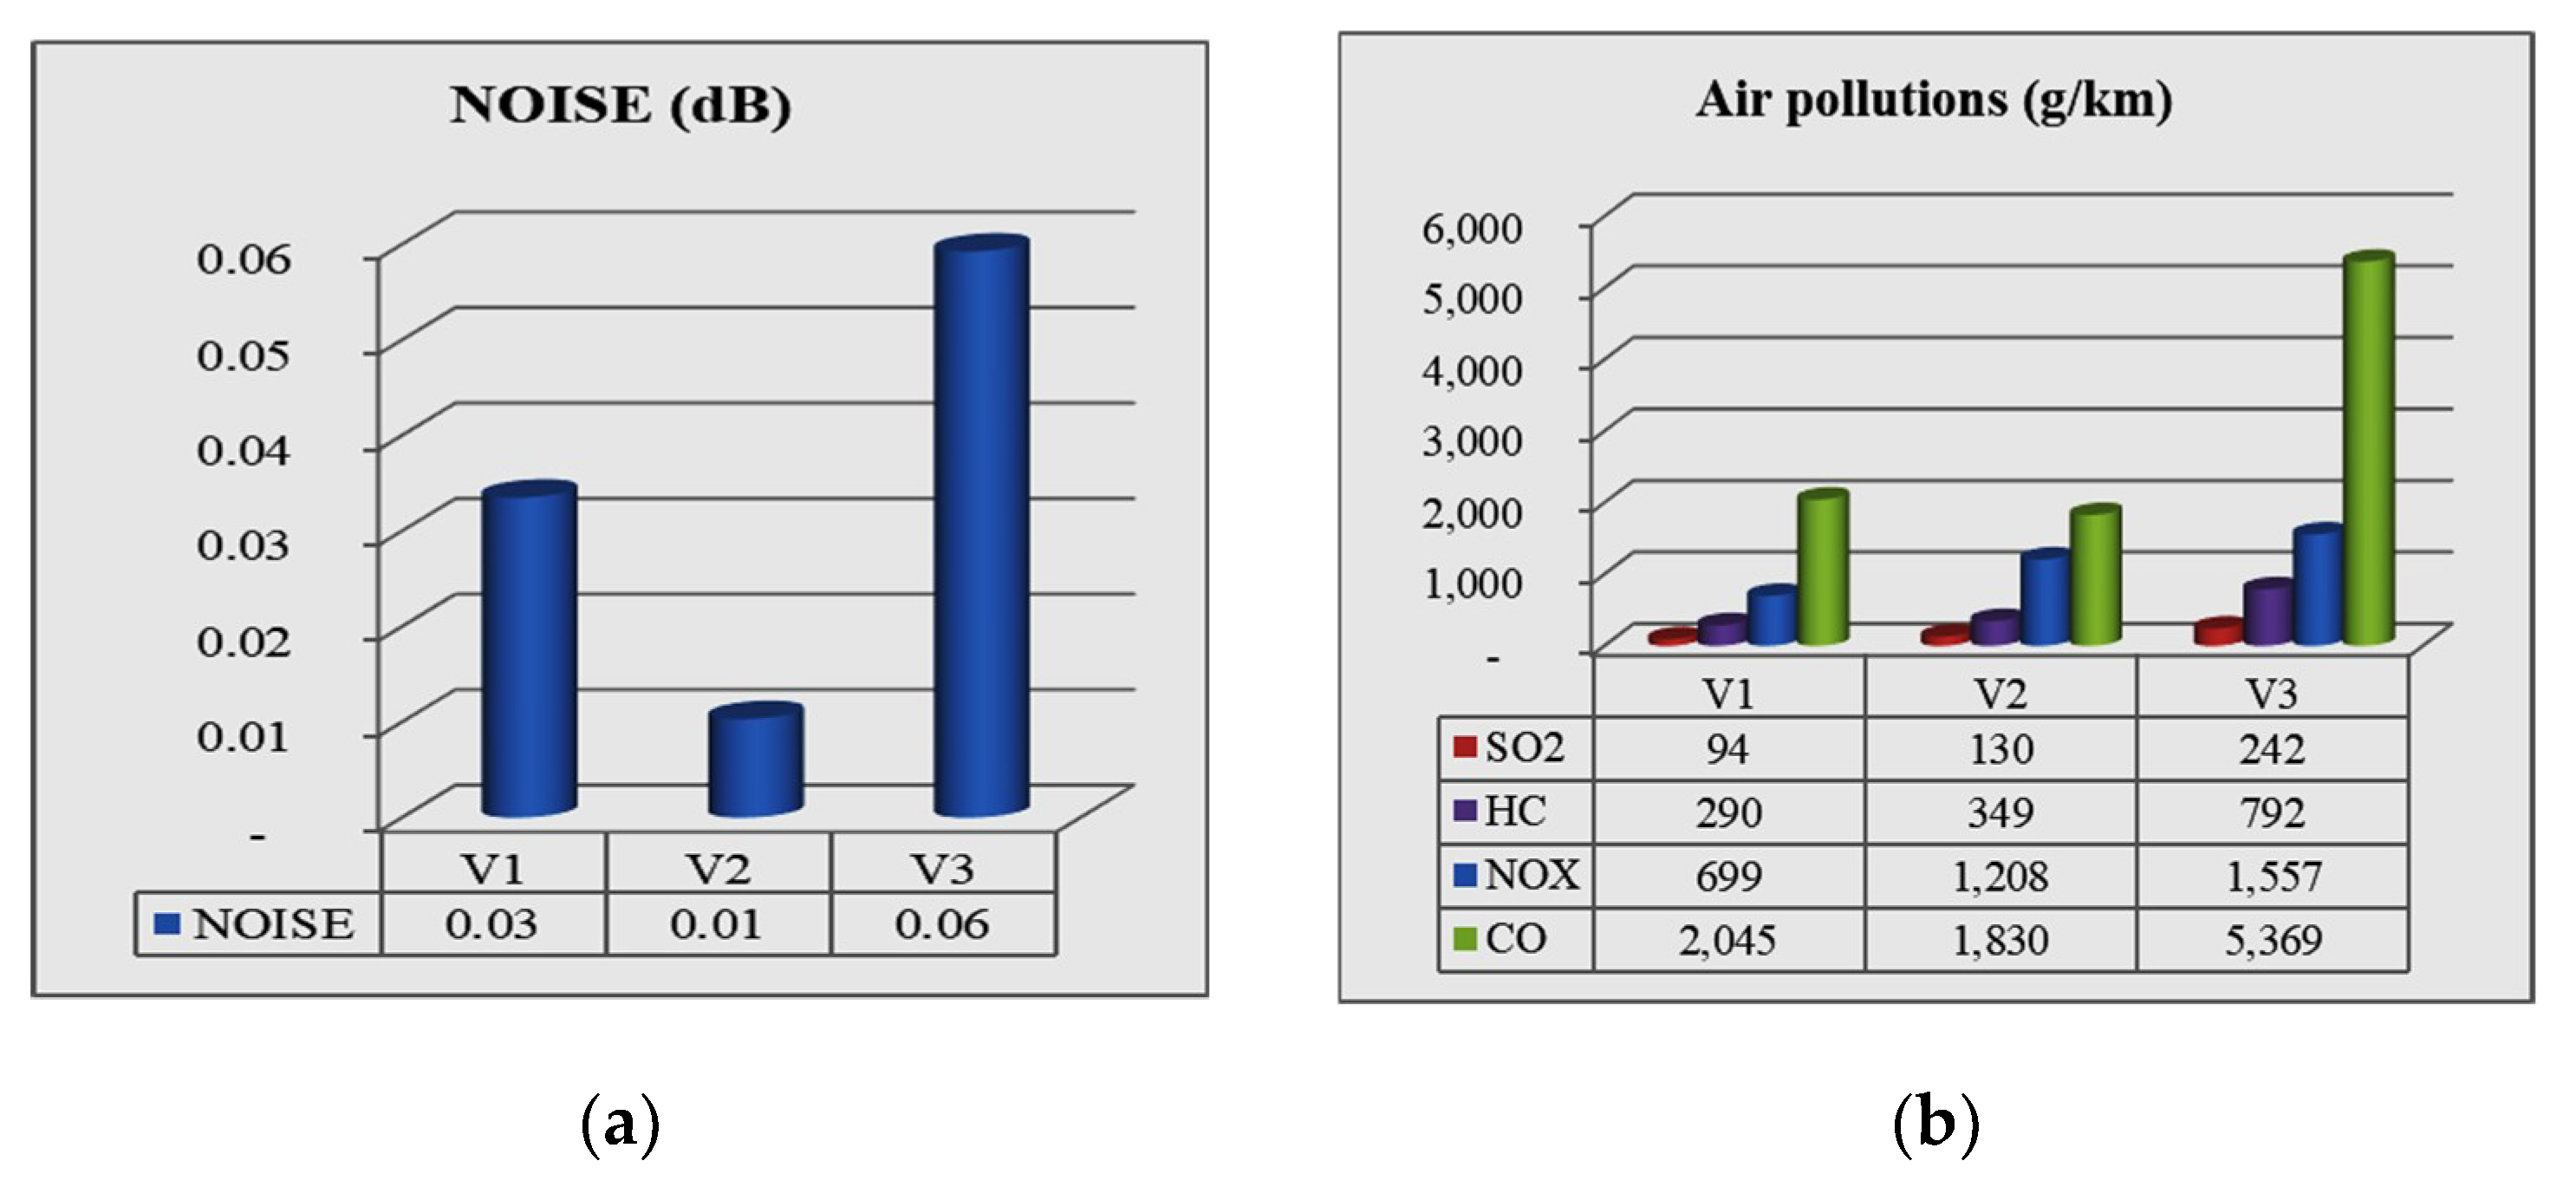
Noise calculation is based on the so-called relevant hourly traffic volume M in [car/h]. If the volumes used as a calculation basis are available as average daily traffic volumes (ADT) in [car/24h], M is determined as mADT by specifying the conversion factors. To clarify, we have just considered the results for one link (IG ramp with a length of 220 m) in noise calculation. However, to calculate the pollutant emissions, the IG–LJ highway segment with a length of 34 km has been considered.
Figure 10 depicts the environmental measures reductions in terms of noise and air pollution compared to current situation (V0).
As seen, Scenario V3 has the best results in terms of reduction in both noise and air pollutant amount compared to V0. This policy is able to reduce the noise level by 0.06 dB, while Scenarios V1 and V2 have a reduction of 0.03 and 0.01 dB, respectively. On the other hand, Scenario V3 is able to reduce the pollutant emissions namely SO2, HC, NOX, and CO by 242, 792, 1557, 5369 g/km, respectively.
From the reduction in the total amount of travel time and the total VKT (see
Table 1), we are also able to measure the economic and environmental factors that are associated with this form of transport. To do so, first operating cost, namely driving cost, and value of time were calculated using the total VKT by each category (vehicle-kilometers) and total travel time (vehicle-hour). In Slovenia, the driving cost is assumed to be 0.08 €/km as mentioned in
Section 3. The average value of time for Slovenians is assumed as about 6.7 €/hour as the average monthly salary is around 1200 €, and monthly working time is around 180 h.
Figure 11 demonstrates the relevant operating cost results.
Driving cost = veh-km/day * 0.080 €/veh-km * 230 working days/year,
Value of time = veh-hour/day * 6.7 €/hour * 230 working days/year.
In addition to the savings in operating costs, the external costs of transport, namely accidents, noise and air pollution, climate change, congestion (delay) can also be calculated. To this end, the following relationships and relevant unit costs assumed using [
37]. The results of calculation for external costs are shown in
Figure 11.
Accidents cost = veh-km/day * 0.040 €/veh-km * 230 working days/year,
Pollutants cost = veh-km/day * 0.010 €/veh-km * 230 working days/year,
Climate change cost = veh-km/day * 0.019 €/veh-km * 230 working days/year,
Noise cost = veh-km/day * 0.004 €/veh-km * 230 working days/year,
Congestion cost (delay) = veh-km/day * 0.009 €/veh-km * 230 working days/year.
The total annual savings (in €) resulting from the use of carpooling and P+P lot in the IG area are shown in
Figure 12.
As depicted, the introduction of P+P lots near interchanges in the combination of congestion pricing policy (V3) can reduce the total transport cost (operating + external) by around €210,000 annually. Other scenarios, namely V2 and V1, are also able to reduce the cost by €97,200 and €29,600, respectively. These economic and environmental benefits achieved with the introduction of P+P lots near interchanges to encourage carpooling transport are only in one specific location, the IG interchange. It can be much more effective if it is extended to all interchanges near highways in the vicinity of LUR.
5. Conclusions
This study contributes to the debate regarding carpooling and the implementation of P+P lots near interchanges. It examines the impacts of P+P lots near interchanges in terms of transport network performance, economic, and environmental effects. Moreover, at a disaggregated level, this research sheds light on the profile of those people who are more likely to reduce their car use after the implementation of P+P lots near interchanges. It is found that:
The average occupancy of the carpooling vehicles in Slovenia is around three persons/vehicle, while the average occupancy of non-carpooling vehicles is around 1.35 persons/vehicle.
Factors such as travel cost, public transport service limitations, and improved parking facilities impact highway users’ tendency to reduce car use and use of carpooling.
The main reason why people do not opt for carpooling is the variable working hours causing difficulties in coordination of departures home-to-work or work-to-home.
Sixty percent of respondents are willing to leave their car in P+P lots near interchanges.
Parking fees are not a suitable solution for P+P parking lots intended to attract highway users to leave their cars during carpooling. Only 25% of respondents are willing to pay the parking fee (on average €1.40/day or €23/month).
In terms of transport network performance, economic, and environmental effects, thanks to P+P lots, the results show that:
Scenario V3 is the best scenario in the highway segment studied (68.8 km) with the capability to reduce the total traffic volume by 4567 vehicles, total VKT by 3797 veh-km, total travel time by 75 veh-h, and total delay by 40 h. While Scenario 2, noted as a more realistic and implementable scenario, has reduced the total traffic volume by 2413 vehicles, total VKT by 2256 veh-km, total travel time by 35 veh-h, and total delay by 16 h.
Scenario V3 is able to reduce the noise level by 0.06 dB, while Scenarios V1 and V2 have a reduction of 0.03 and 0.01 dB, respectively. On the other hand, Scenario V3 is able to reduce pollutant emissions namely SO2, HC, NOX, and CO by 242, 792, 1557, and 5369 g/km, respectively.
Scenario V3 can reduce the total transport cost (operating + external) by around €210,000 annually. Other scenarios, namely V2 and V1, are also able to reduce the cost by €97,200 and €29,600, respectively.
Scenario V2 does not need any political and social consensus, however, Scenario V3 is at the moment politically not acceptable to the Municipality of Ljubljana. Public opinion research on possible improvements of the traffic management in Ljubljana was against congestion charging [
38].
General policy guidance and recommendations for Scenario V2 could be as follows:
Increase the awareness (promotional campaign) of users, in particular private car users, about shared mobility modes and infrastructure.
Improve the education of urban and mobility planners as well as other stakeholders about shared mobility modes and infrastructure.
Prepare national guidelines to support/implement carpooling services and infrastructure, and improvement of ITS (intelligent transport system and services).
General policy guidance and recommendations for Scenario V3 could be as follows:
Promote and implement other traffic management and spatial planning measures for sustainable mobility (e.g., space used by private car).
Convince local and state authorities (policy stakeholders) to adopt additional objectives to existing SUMP (sustainable urban mobility plan).
Although implementation of P+P lots is a not-for-profit solution, and not one intended to generate revenue, the provision of its associated systems and services will provide opportunities for the further development of widely dispersed municipalities and regions. To reap the greatest environmental benefits, carpooling promotion policies could be more effective if used in combination with other policies such as the possibility of using HOV lanes and reduced toll payments on highways, and/or dedicated bus lanes, dedicated parking lots, and free entry to congestion pricing zones inside the cities. Last but not least, the research limitations and directions for future studies are:
Slovenia is a small country and field surveys (questionnaires) with a large simple size are a very difficult and challenging step. Although the sample size of the survey is not large, this article presents some interesting results which can be used as preliminary findings for future studies with a larger sample size.
Once P+P lots introduced by the Slovenian government, a before-and-after study at the locations of potential P+P lots would be needed to have a more reliable assessment of its consequences on modal shifts of highway users.
As only explanatory variables like travel time and cost have been used in this study, a “new hybrid mode choice model” can be developed to examine the effects of explanatory and latent variables simultaneously.


