Article

Silage Fermentation and In Vitro Degradation Characteristics of Orchardgrass and Alfalfa Intercrop Mixtures as Influenced by Forage Ratios and Nitrogen Fertilizing Levels

1
Key Laboratory of Grasslands Management and Utilization, Ministry of Agriculture and Rural Affairs, College of Grassland Science and Technology, China Agricultural University, Beijing 100193, China
2
State Key Laboratory of Animal Nutrition, College of Animal Science and Technology, China Agricultural University, Beijing 100193, China
*
Author to whom correspondence should be addressed.
Sustainability 2020, 12(3), 871; https://0-doi-org.brum.beds.ac.uk/10.3390/su12030871
Submission received: 2 January 2020 / Revised: 17 January 2020 / Accepted: 18 January 2020 / Published: 23 January 2020
(This article belongs to the Special Issue Sustainable Livestock Production)

Abstract

:
Intercropping is a globally accepted method of forage production and its effect on silage quality depends not only on forage combination but also fertilization strategy. In the present study, field intercropping of orchardgrass (Dactylis glomerata) and alfalfa (Medicago sativa) at five seed ratios (100:0, 75:25: 50:50, 25:75, 0:100 in %, based on seed weight) was applied under three N fertilizing levels (0, 50, and 100 kg/ha), and harvested for silage making and in vitro rumen degradation. As a result of intercropping, the actual proportions (based on dry matter) of alfalfa in mixtures were much closer to seed proportion of alfalfa in field, except 75:25 orchardgrass-alfalfa intercrops with no fertilization. The actual proportions of alfalfa in mixtures decreased by 3–13% with the increase of N level. Increases of alfalfa proportion in mixtures increased silage quality, nutrients degradability and CH4 emissions. Increasing N levels increased silage pH, concentration of butyric acid, and fiber fractions. In summary, inclusion of alfalfa at around 50% in orchardgrass-alfalfa silage mixtures were selected for favorable ensiling and higher forage use efficiency while also limiting CH4 emissions, compared to monocultures. The silage quality and feeding values of mixtures were influenced more by forage ratios than by N levels.

1. Introduction

Ensiling has been increasingly used for forage preservation across the world, especially where precipitation patterns limit opportunities for dependable hay production. Orchardgrass (Dactylis glomerata) as a high nutritive grass widely cultivated in North America, Europe, and East Asia [1,2]. Although orchardgrass is suitable for ensiling with high water-soluble carbohydrates (WSC) [3], its protein content is commonly insufficient to satisfy nutrient requirements of ruminants [4,5]. In contrast, the sole use of legumes (e.g., alfalfa, Medicago sativa, and clover) can increase the protein content of silage but cause undesirable fermentation and proteolysis due to the high buffering capacity and low WSC and poor utilized nitrogen (N) by ruminants [6,7]. Additionally, previous studies noted that the high degradable nutrients in alfalfa provided a large number of substrates to methanogens, resulting in relative high methane (CH4) and carbon dioxide (CO2) emissions [8,9]. To overcome the imbalance of nutrient supply, intercropping of grass and legumes has been increasingly accepted as a good practice of high-quality forage production in terms of either mixed hay or mixed silage [10,11]. It is important to identify the suitable ratio of grass-to-legume that well coordinates with the needs in the field and during the ensiling process, quickly increasing acidity and reducing proteolysis. However, it is presently not clear whether the intercrop mixtures of orchardgrass and alfalfa at appropriate ratios would make superior quality silage with high nutritive values and nutrients’ degradability and low CH4 emissions.
The effect of intercropping on forage yield and nutritive quality depends not only on forage ratio but also N fertilization strategy, since the N fertilizing level plays a vital role in plant growth processes [12]. The effects of N level on forage nutritive value and digestibility are varied, which might result in the difference in CH4 emissions. A previous study noted that increasing the N level from 0 to 336 kg/ha increased the protein content but did not affect fiber content in alfalfa [13]. Orchardgrass has a life cycle that matches well with alfalfa and exhibits consistent growth throughout the growing season [14]. Orchardgrass also has high polyphenol oxidase activity to reduce protein degradation and lipolysis during the aerobic conditions of ensiling and rumen fermentation [15,16]. We hypothesized that orchardgrass and alfalfa intercrop mixtures would improve silage quality and nutrients’ digestibility while also reducing CH4 emissions, compared to sole silage crops, and the increases of N levels might compromise silage quality and digestibility. Therefore, the objectives of our study were to: (1) investigate the appropriate ratios of orchardgrass and alfalfa intercrop mixtures for acquiring high silage quality and in vitro degradability and low CH4 emissions and (2) evaluate the effect of N levels on silage fermentation and in vitro degradation characteristics of intercrop mixtures.

2. Materials and Methods

2.1. Experimental Site

Field experiments were conducted at the Teaching and Research Station of China Agricultural University in Dongchengfang County, Zhuozhou City, Hebei Province. The experimental site was located at 39°21′ N and 115°51′ E at 41 m altitude. The sward soil was a sandy loam with pH 7.89, 12.5 g/kg organic matter (OM), 0.76 g/kg total N, 14.8 mg/kg phosphorus (P), and 79.3 mg/kg available potassium (K). Corn was planted and harvested before conducting the current field experiment. The annual rainfall in the field was about 550 mm in 2016, with rainfall mainly occurring in the summer (July to August).

2.2. Field Experimental Design

The field experiment was arranged in a two factorial randomized complete block design with four replications, in which the two main treatments included five intercropping ratios and three N levels. The intercropping ratios and N levels were randomly assigned to each plot. The five intercropping ratios of orchardgrass (cv. Aba) to alfalfa (cv. WL534) were 100:0, 75:25, 50:50, 25:75, and 0:100 (in %, based on seed weight). The three N levels provided by urea (46% N) were 0, 50, and 100 kg/ha, and fertilization was performed annually via top-dressing soon after regrowth began (4 April 2016). Before seeding, the field was plowed, harrowed, and then divided into four blocks. Compound fertilizer (containing 28, 28, and 28 kg/ha of N, P, and K, respectively) at 187 kg/ha was uniformly incorporated into the top 20 cm of the soil. Each plot had an area of 25 m2 (5 × 5 m) and comprised 17 rows with a 30 cm spacing. All plots were separated by a 1-m-wide discard zone, and the two species in each plot were sown manually and simultaneously in different rows at depths of 2 cm according to the current experimental design on 13 September 2015. After planting, all plots were uniformly irrigated, and a sprinkler irrigation system was used during the entire experimental period. Swards were weed-free, and no pests were observed throughout the entire growth period.
Whole fresh orchardgrass and alfalfa plants at the jointing and early bloom stages respectively, were harvested with a reaping hook from the field plots. The cutting dates were on 22 May 2016 for the first cut and on 30 June 2016 for the second cut. Three square areas (1 × 1 m) from each plot were randomly selected and harvested at a stubble height of 5 cm above the ground. The harvested fresh samples were immediately sorted and separately weighed after cutting. A representative fresh subsample of 500 g from each species from each plot was oven-dried to 65 °C for 48 h and then weighed to determine the actual proportions (based on dry matter, DM) of the two species and the chemical composition of mixtures.

2.3. Silage Production and Chemical Analysis

The remaining fresh forages were sun-wilted by placing on a polyethylene sheet with occasional turning until the DM content increased to 400 g/kg. The DM content was rapidly checked at regular intervals by using a microwave oven. No leaf or stem loss was observed during the wilting process, and the weather conditions were favorable for field drying, with no rainfall during harvest. The wilted orchardgrass and alfalfa intercrop mixtures were chopped to a particle size of 2 cm, and then samples of approximately 750 g were packed into polyethylene silos (1 L capacity), with three silos per plot. All silos were sealed with screw lids to prevent oxygen inflow but to enable escape of gas from the silage and kept in a dark room at 25 °C.
After 40 days of ensiling, the silos were opened, and a subsample of 20 g from the ensiled mixtures was homogenized in a blender with 180 mL of distilled water for 1 min. The content of the blender was filtered through four layers of cheesecloth to make a silage extract for the determination of silage pH, ammonia N, and organic acid, e.g., lactic acid, acetic acid, propionic acid, and butyric acid. Finally, silages were oven-dried at 65 °C for 48 h and ground in a mill and passed through a 1.0 mm sieve for subsequent chemical analysis and in vitro incubation.
The crude protein (CP) was determined using a KjeltecTM 2300 (Foss, Hillerod, Denmark). The neutral detergent fiber (NDF), acid detergent fiber (ADF) and acid detergent lignin (ADL) concentrations were determined by the batch procedures outlined by ANKOM Technology Corporation (Fairport, New York, NY, USA). The concentrations of cellulose and hemicellulose were calculated by subtracting ADL from ADF and ADF from NDF, respectively. The concentrations of ammonia N and organic acids in the silage extract were determined according to the method described by Li and Meng [17].

2.4. Rumen Fluid Collection

The Institutional Animal Care and Use Committee of the College of Animal Science and Technology of China Agricultural University approved the animal experimental procedures in the current study (CAU20171014-1). Rumen fluid was collected from three lactating Holstein dairy cows (510 ± 20 kg body weight) fitted with permanent rumen cannula, and cows were fed a total mixed ration made up of 4.0 kg alfalfa hay, 3.0 kg whole corn silage, and 6.0 kg commercial concentrate ad libitum. The ration was provided twice daily in equal meals at 06:00 and 18:00 h, and fresh water was available to cows at all times. Rumen contents from the three cows were obtained 1 h before the morning feeding, squeezed and filtered through four layers of gauze, and then mixed in equal volumes to obtain a representative rumen fluid. The fluid was held under CO2 in a water bath at 39 °C for later in vitro inoculation.

2.5. In Vitro Batch Culture and Sample Collection

Dried silage samples of each treatment weighing 500 mg each were placed into a total of 180 glass bottles (five mixtures × three nitrogen levels × four field plots × three bottles per plot) with a capacity of 120 mL and sealed with a rubber stopper and screw caps. Fifty milliliters of fresh buffer solution with a pH of 6.85 [18] and 25 mL of homogeneous rumen fluid were added to each bottle and continuously flushed with N2 to maintain anaerobic conditions. After sealing the bottles with rubber stoppers and screw caps, all bottles were incubated at 39 °C for 48 h. Simultaneously, four bottles without forage samples were incubated as blanks to correct the final values. The harvested forage samples from the first and second cuts were separately arranged to conduct in vitro incubation at different times. All of these batch cultures were repeated in three experimental runs during different weeks.
At the end of incubation, the bottles were uncapped, and the pH value in the cultured fluids was immediately measured by a pH meter (FiveEasy 20 K, Mettler Toledo International Inc., Greifensee, Switzerland). The entire content of each bottle was filtered with pre-weighed nylon bags (8 × 12 cm, 42 μm pore size) to obtain the non-degraded particles. Ten milliliters of filtrate were sampled to measure the concentrations of ammonia N and volatile fatty acids (VFAs) [19]. The nylon bags were then thoroughly rinsed with fresh water and then oven-dried at 65 °C for 48 h. The in vitro dry matter disappearance (IVDMD), in vitro neutral detergent fiber disappearance (NDFD), and in vitro acid detergent fiber disappearance (ADFD) was calculated by the difference between the pre-incubated and post-incubated amounts, corrected by the blanks after the incubation.

2.6. Calculations

Metabolizable energy (ME, MJ/kg DM) and organic matter digestibility (OMD, g/100 g DM) were calculated according to CSIRO [20] and IRNA [21] as in the following Equations (1) and (2):
ME   =   0.172   IVDMD     1.707
OMD   =   62.9   +   0.137   ×   CP     0.23   ×   10 3   ×   CP 2     0.020   ×   NDF     0.479   ×   FL
where CP and NDF are the crude protein and neutral detergent fiber contents (g/kg DM) and FL is the feeding level (since FL is not known, the designated value in this equation is 2.1 as recommended by the original authors).
Fermentative CO2 production (mmol/L) was estimated [22,23] with Equation (3):
CO 2   = Acetate / 2 + Propionate / 4 + 1.5   Butyrate
Methane production (mmol/L) was estimated [24] with Equation (4):
CH 4   =   0.45   Acetate     0.275   Propionate   +   0.40   Butyrate
The production, utilization, and recovery of metabolic hydrogen (H) were calculated according to the method of Dijkstra [25], as shown in Equations (5)–(7):
Production   of   metabolic   H 2   =   2   Acetate   +   Propionate   +   4   Butyrate   +   2   Isovalerate   +   2   Valerate
Utilization   of   metabolic   H 2   =   2   Propionate   +   2   Butyrate   +   4   Methane   +   Valerate
Recovery   of   metabolic   hydrogen   =   H 2   utilization / H 2   production   ×   100   ( % )

2.7. Statistical Analysis

The field experiment was arranged in a two-factorial randomized complete block design with four replications, and analysis of variance (ANOVA) was conducted to determine the main effects of intercropping ratios and N levels as well as their interactions. Regression analyses were performed to evaluate the effects of intercropping ratios and N fertilizer levels on response variables. The means comparison of each feature was calculated using Tukey’s HSD test, and significance was considered to be p < 0.05 unless otherwise noted. Since there were significant interactions between the two main treatments (intercropping ratios and N levels) and cuts on most variables of field yield, the results of the treatment effects were analyzed separately for each cut.
Linear and nonlinear models were used to simulate the regression of chemical composition, ensiling characteristics, and in vitro degradation characteristics of silage mixtures with the actual alfalfa proportions and the N levels, respectively. Models with the least Akaike’s information criteria (AIC) were finally selected. In vitro incubation data of each of the three experimental runs within the same treatment were averaged before statistical analysis. All statistical analyses were performed using R software (version 3.2.3), and the figures were plotted using SigmaPlot 12.0. Since there were different in vitro incubation periods between the first and the second cut forage samples, the results of the treatment effects were analyzed separately for each cut.

3. Results

3.1. Forage DM Yield of Orchardgrass and Alfalfa Intercrop Mixtures

Both the increases in alfalfa seeding rate with intercropping and increasing N levels increased the total DM yield during the two harvests (p ≤ 0.001, Table 1). The actual proportion of alfalfa in intercrop mixtures increased with the increases of its respective seeding rate in both of the two harvests (p < 0.001, Table 1). Increases in N levels significantly decreased the actual proportion of alfalfa in the first cut (p < 0.001, Table 1), and marginally decreased that in the second cut (p = 0.091, Table 1). Significant interactions between the intercropping ratios and N levels were observed on the total DM yield and actual proportion of alfalfa and orchardgrass for either of the two cuts (p < 0.05, Table 1).

3.2. Chemical Composition of Orchardgrass and Alfalfa Intercrop Mixtures Prior to Ensiling

The chemical composition of orchardgrass and alfalfa intercrop mixtures prior to ensiling was shown in Table 2. Alfalfa was usually rich in CP and ADL and lacking fiber fractions’ (e.g., NDF and ADF) accumulation, compared with orchardgrass. Increases in N levels significantly increased the concentrations of ADF and ADL and decreased the concentration of Ash in the First cut. The DM concentration was not affected by the actual alfalfa proportion or N levels (p > 0.05).

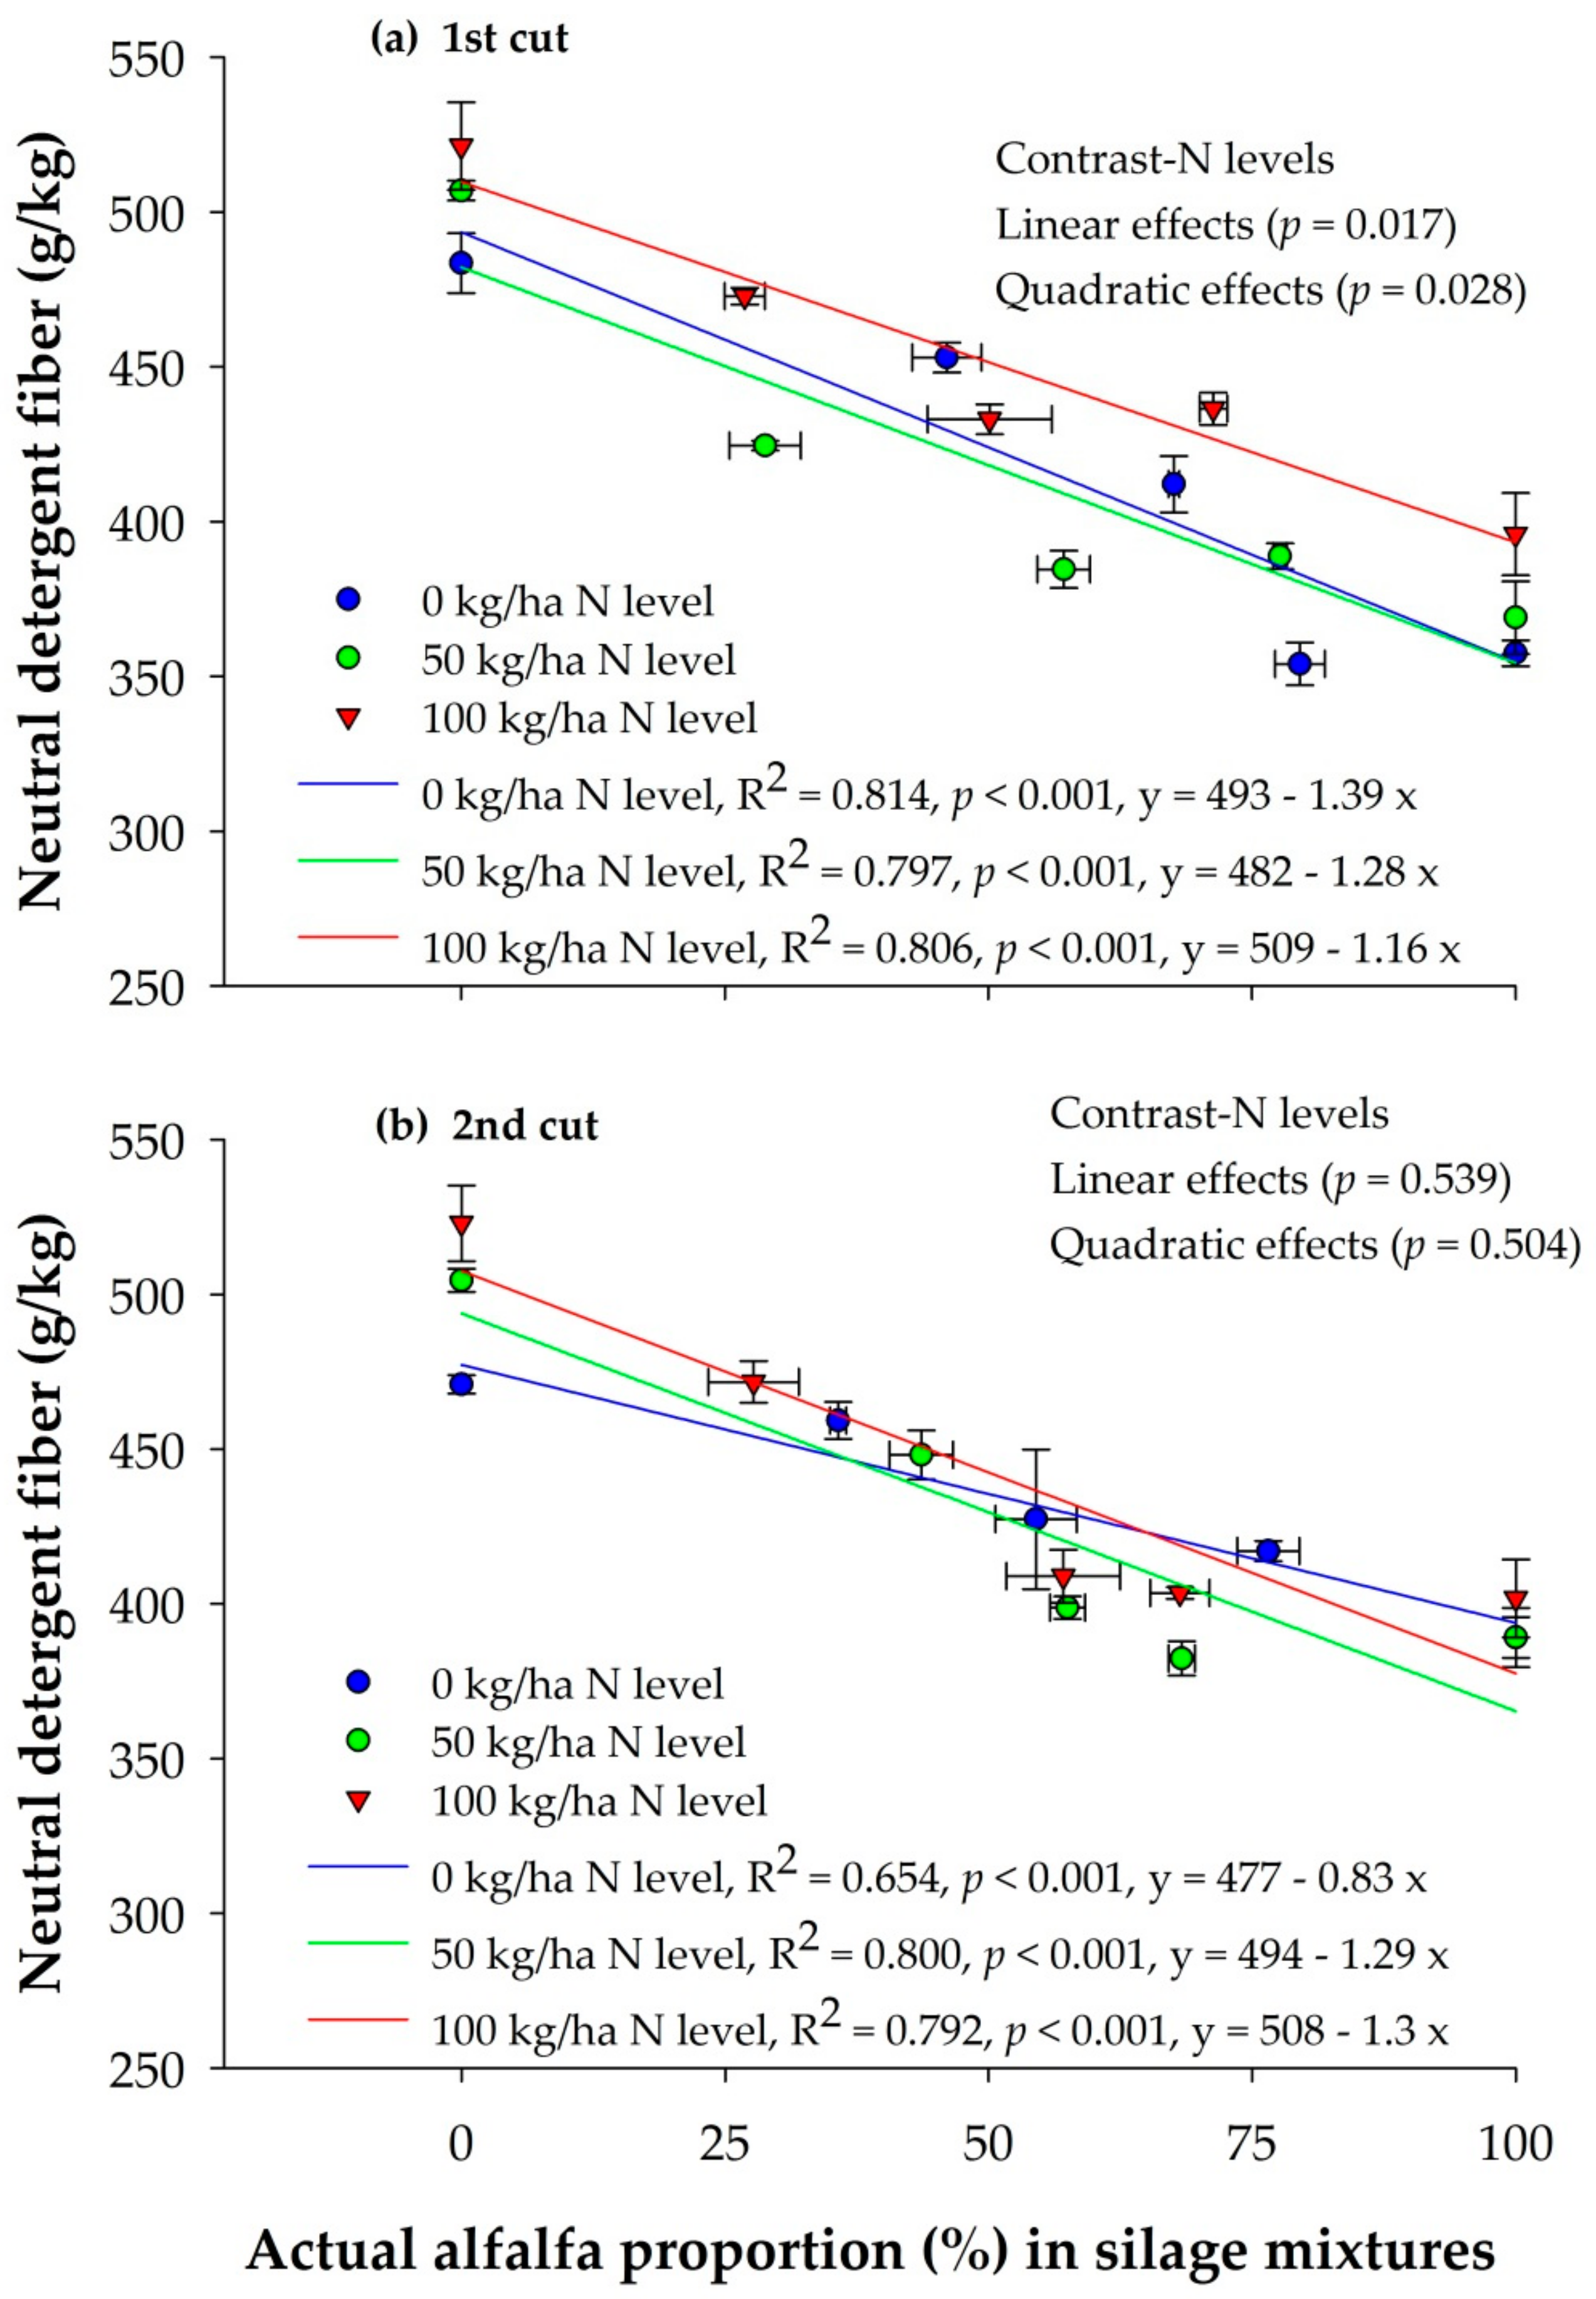
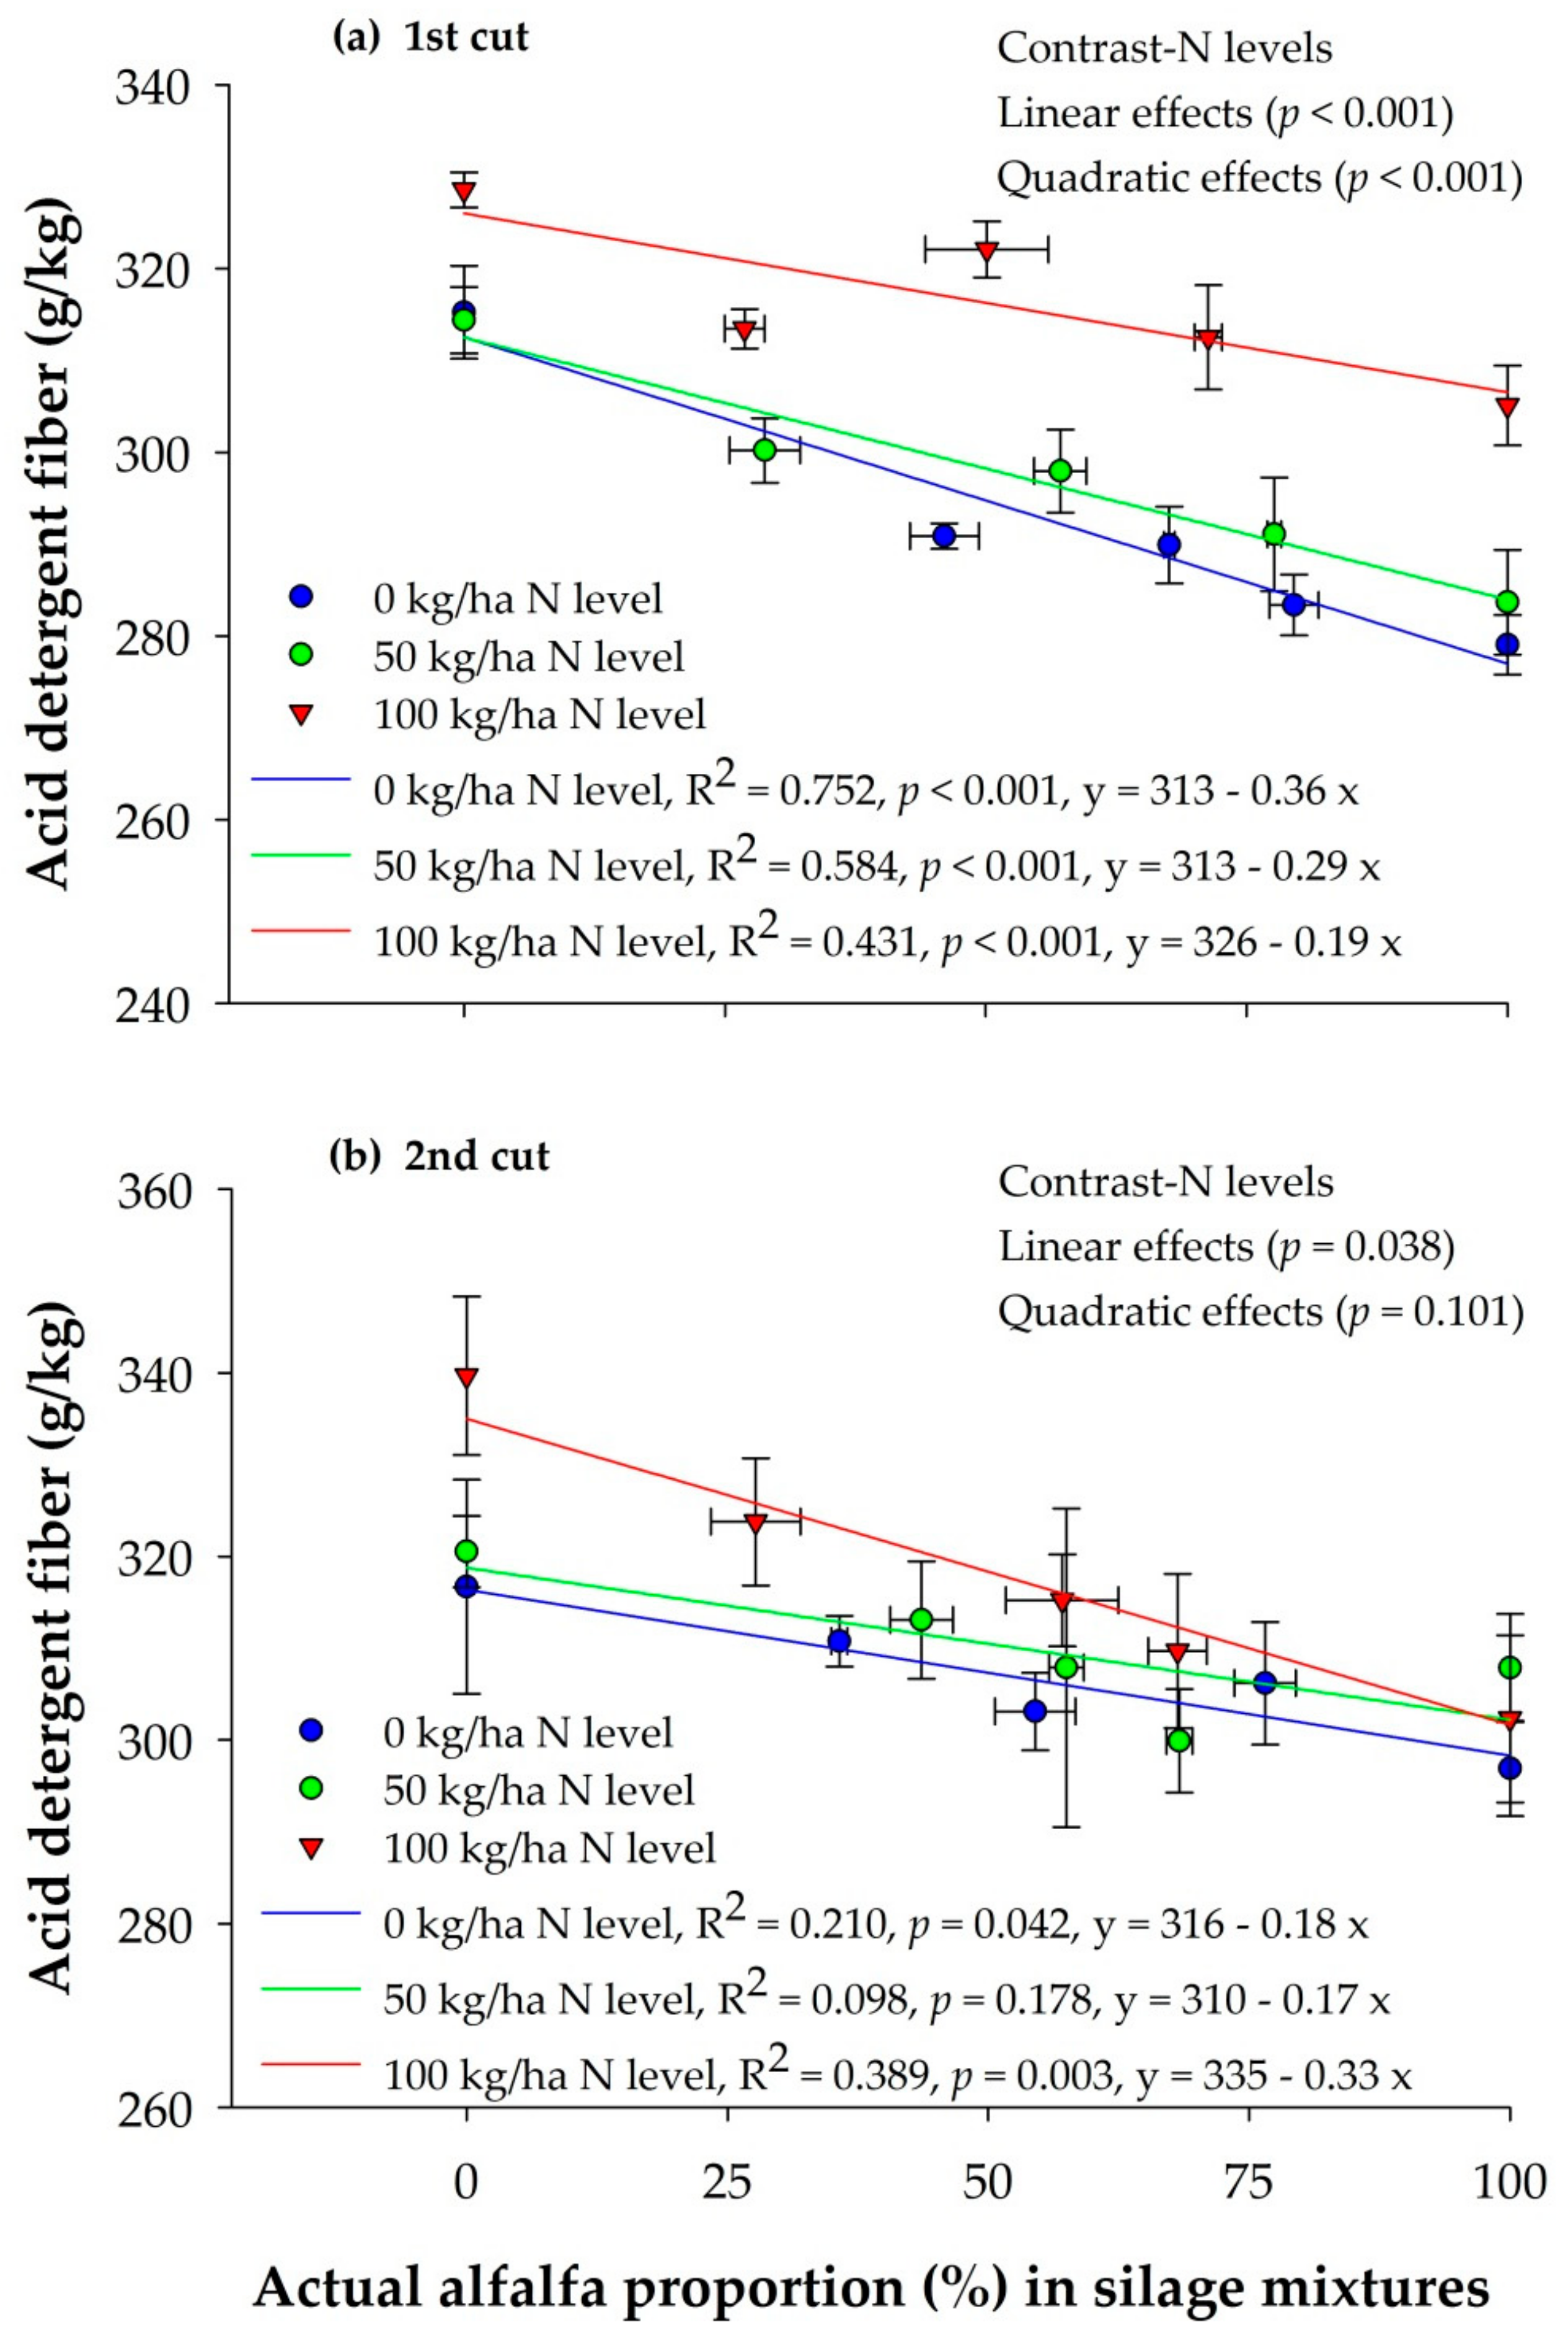
3.3. Chemical Composition of Orchardgrass and Alfalfa Silage Mixtures

The different chemical composition of silage mixtures followed a similar pattern as those observed with raw forage mixtures. The concentrations of CP and ADL increased (p < 0.001, Table 3), whereas those of NDF, ADF, ash, hemicellulose, and cellulose decreased with the increase in the actual alfalfa proportion of the mixtures (p < 0.05, Figure 1 and Figure 2, Table 3). No effect of N levels on CP concentration was observed in the two harvests (p > 0.05, Table 3). Increases in N levels significantly increased the concentrations of ADF and ADL and decreased the concentration of Ash in the two harvests (p < 0.05, Figure 2, Table 3). The N fertilizer level at 100 kg/ha resulted in the highest concentrations of ADF, ranging from 302 to 340 g/kg and ADL ranging from 44.3 to 80.2 g/kg, respectively. Silage DM concentration was not affected by the actual alfalfa proportion or N levels (p > 0.05, Table 3).

3.4. Ensiling Characteristics of Orchardgrass and Alfalfa Silage Mixtures

Quadratic effects were observed on silage pH and the concentrations of ammonia N, lactic acid, acetic acid, and propionic acid (p < 0.05, Table 4), while no effects occurred on the concentration of butyric acid, as the actual alfalfa proportion increased among intercrop mixtures for both harvests (p > 0.05, Table 4). Increasing N level increased the silage pH and the concentrations of ammonia N and butyric acid but decreased the concentration of lactic acid for the two harvests (p < 0.05, Table 4). Silage mixtures with no N fertilization had the lowest silage pH, ammonia N, and the highest lactic acid concentration.

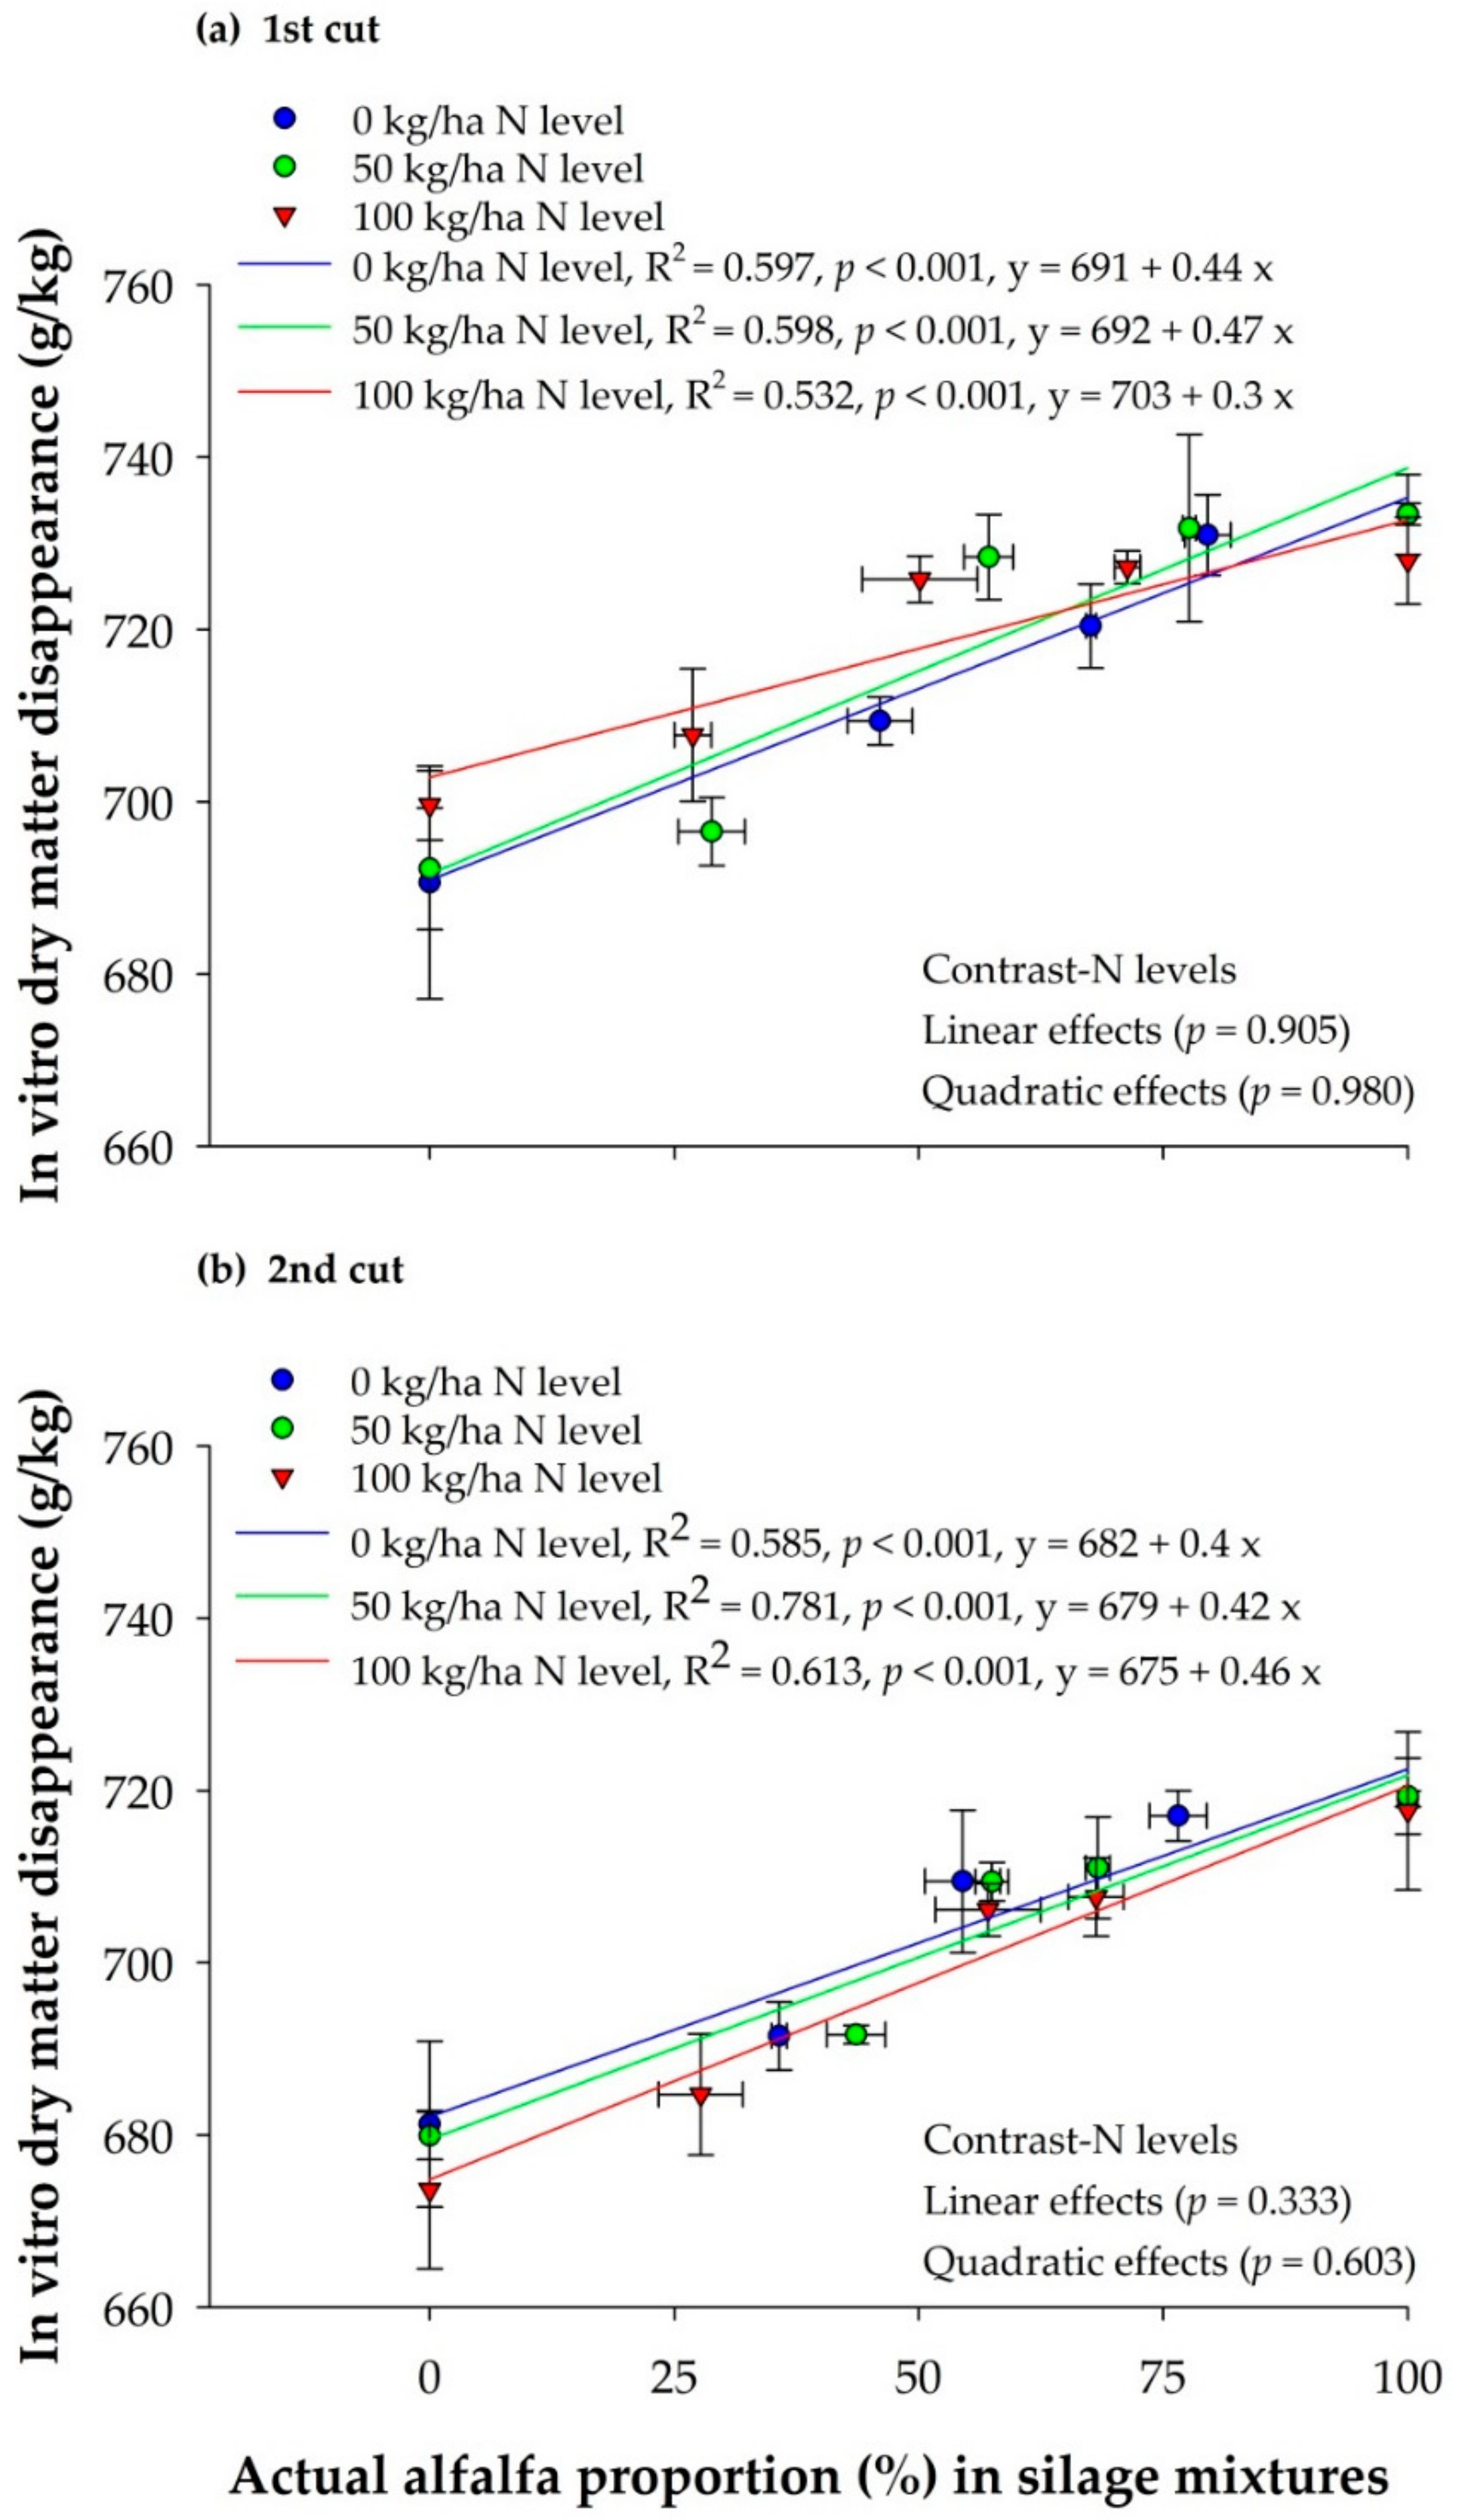
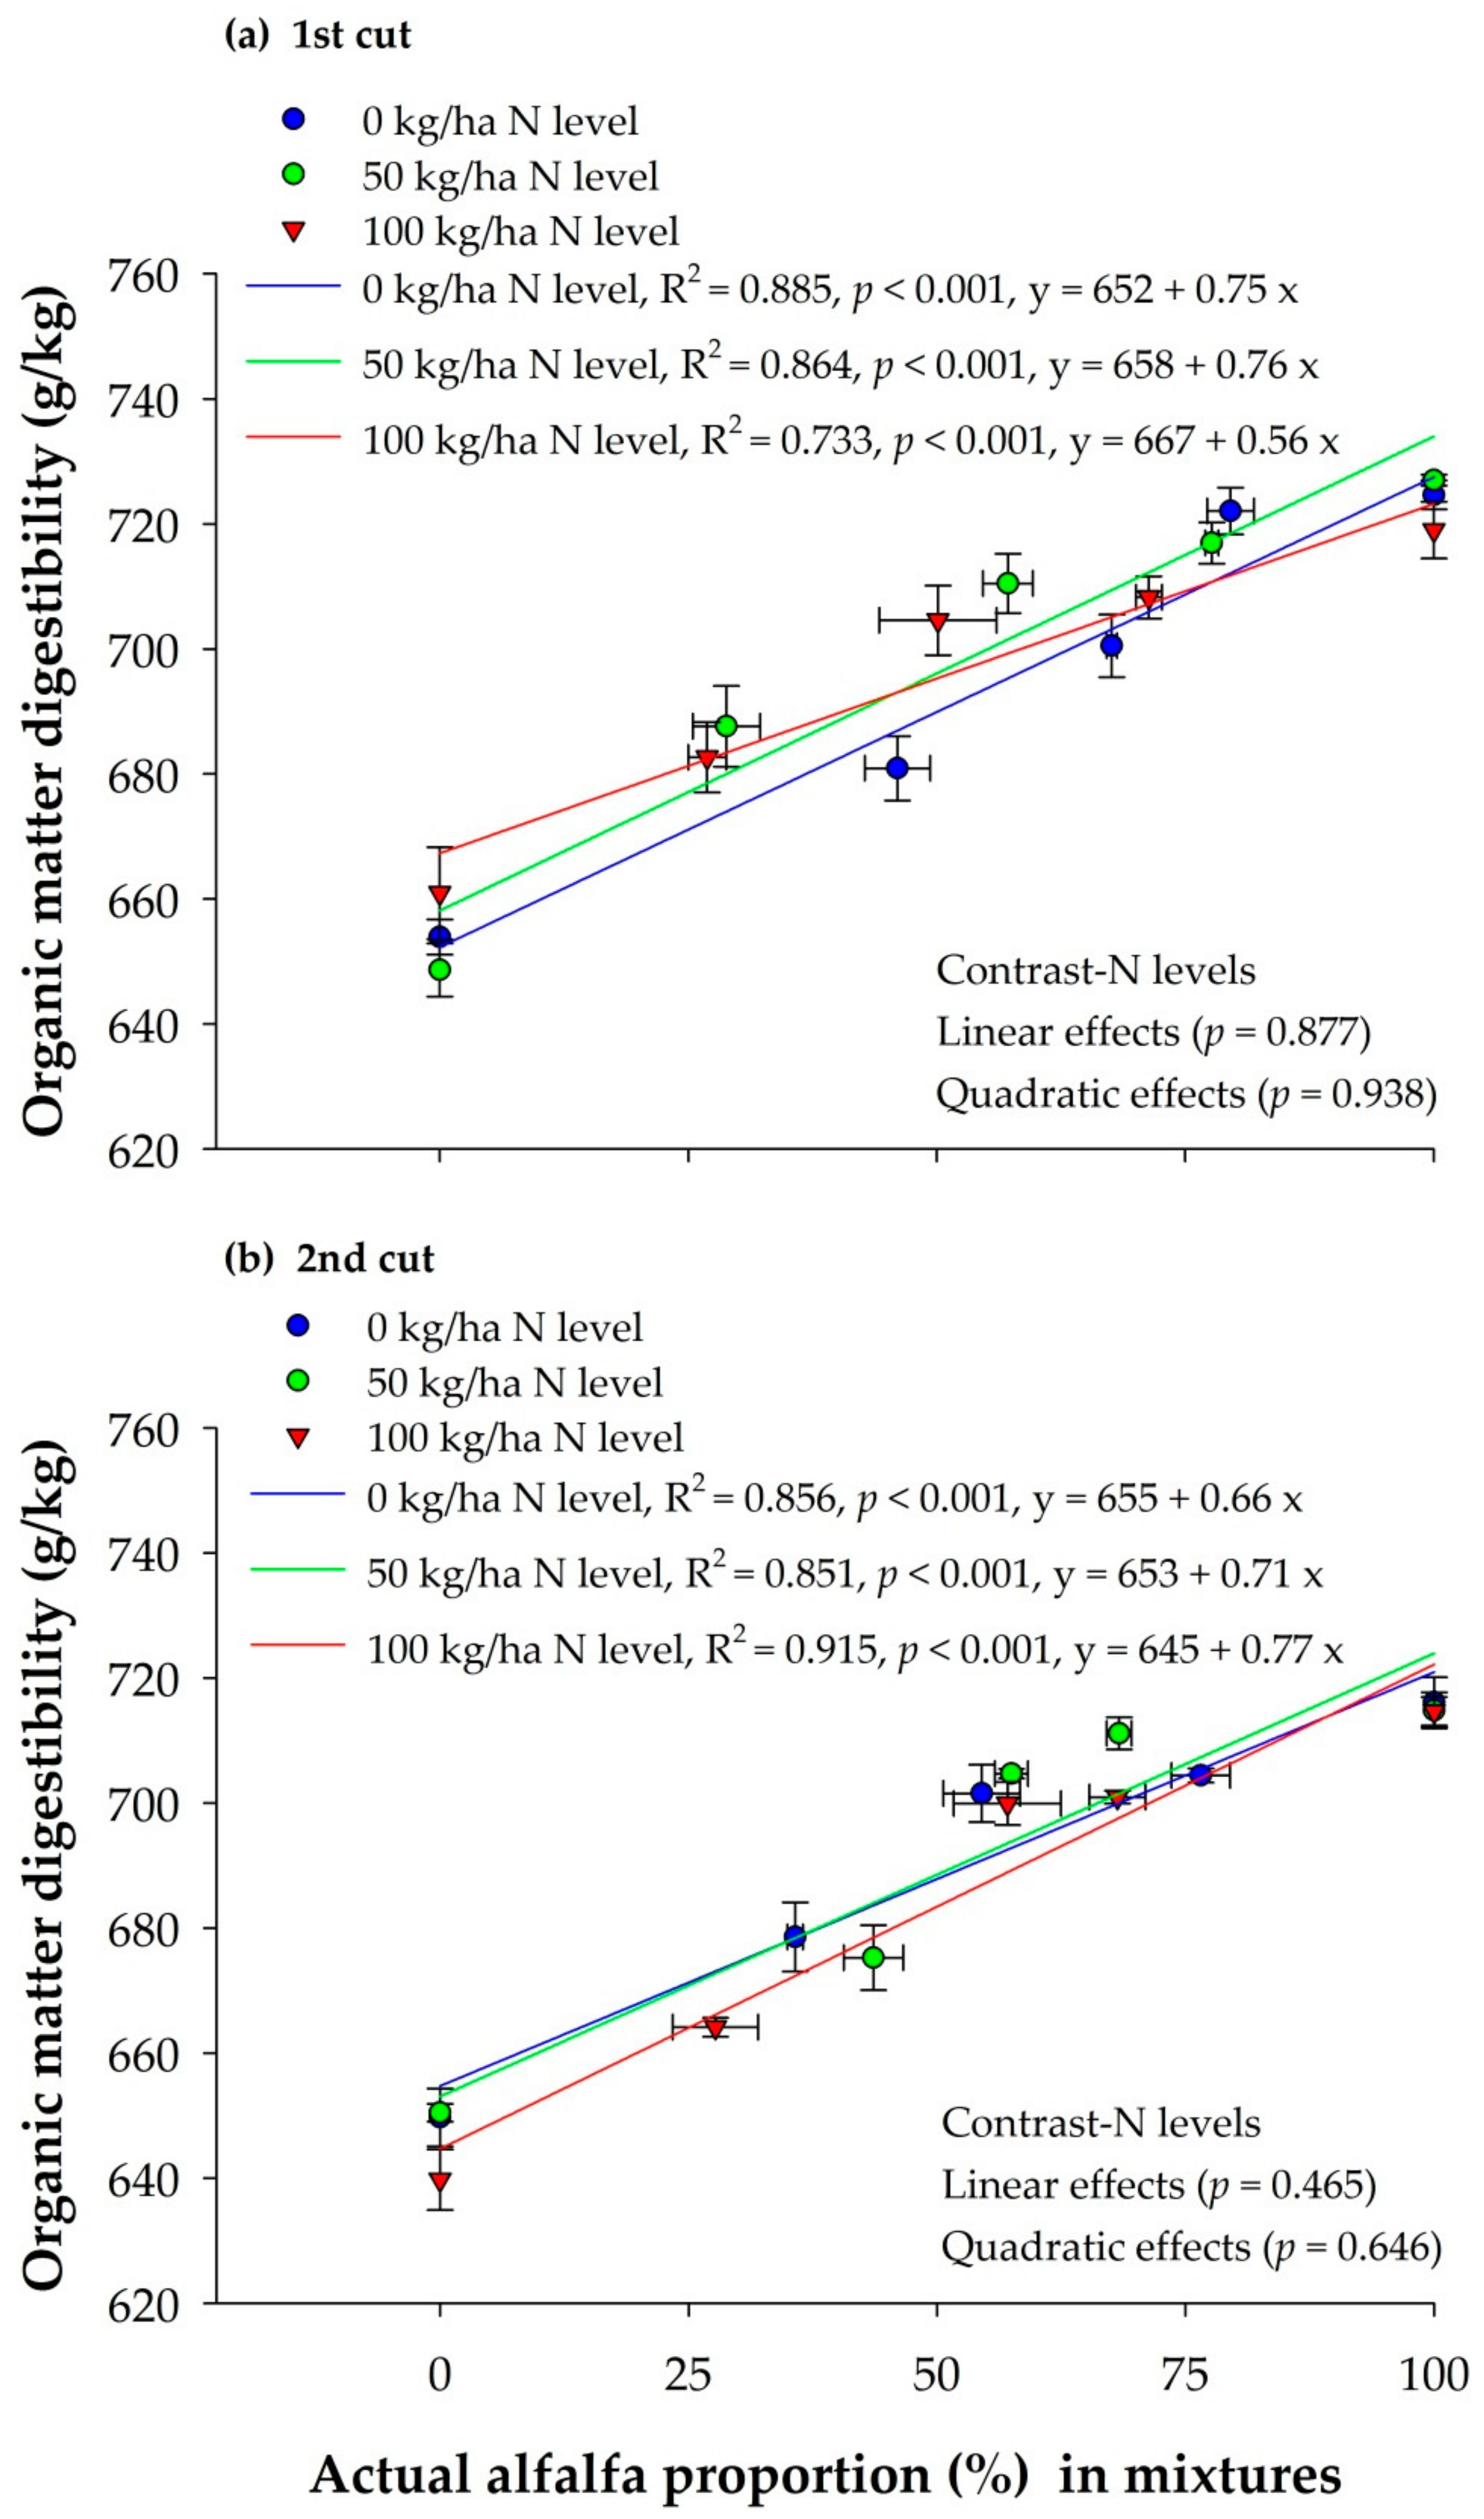
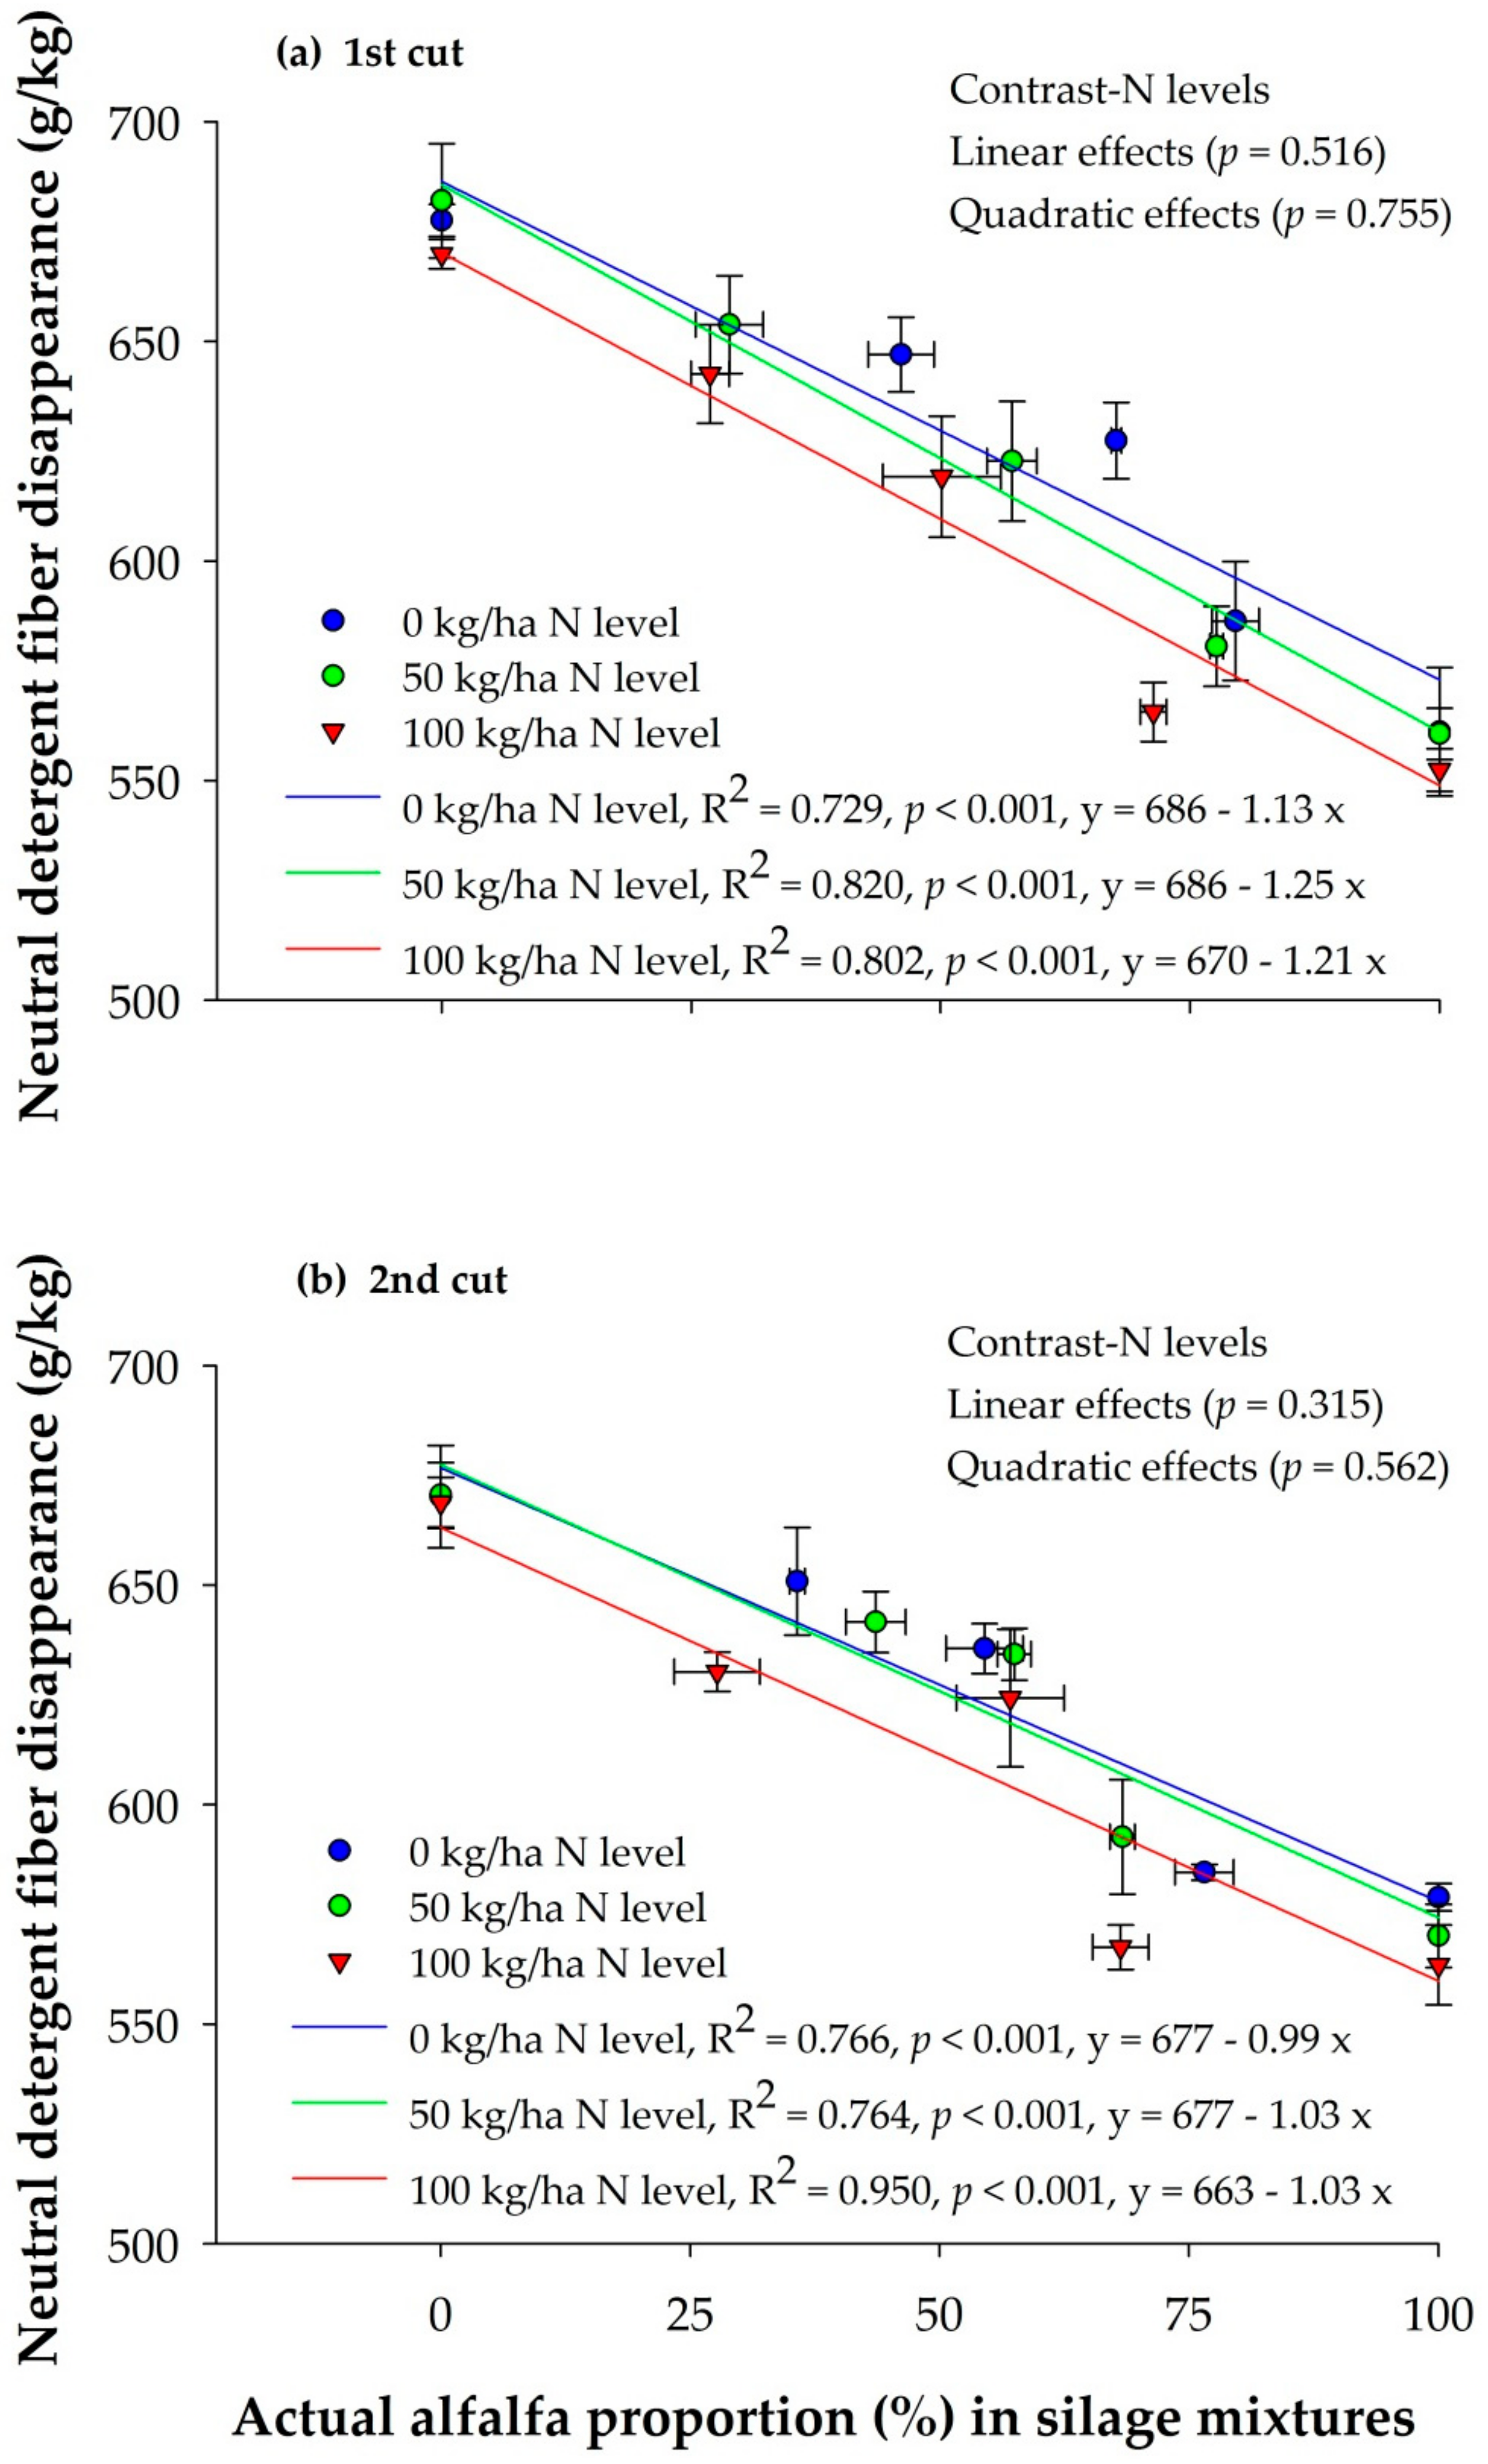
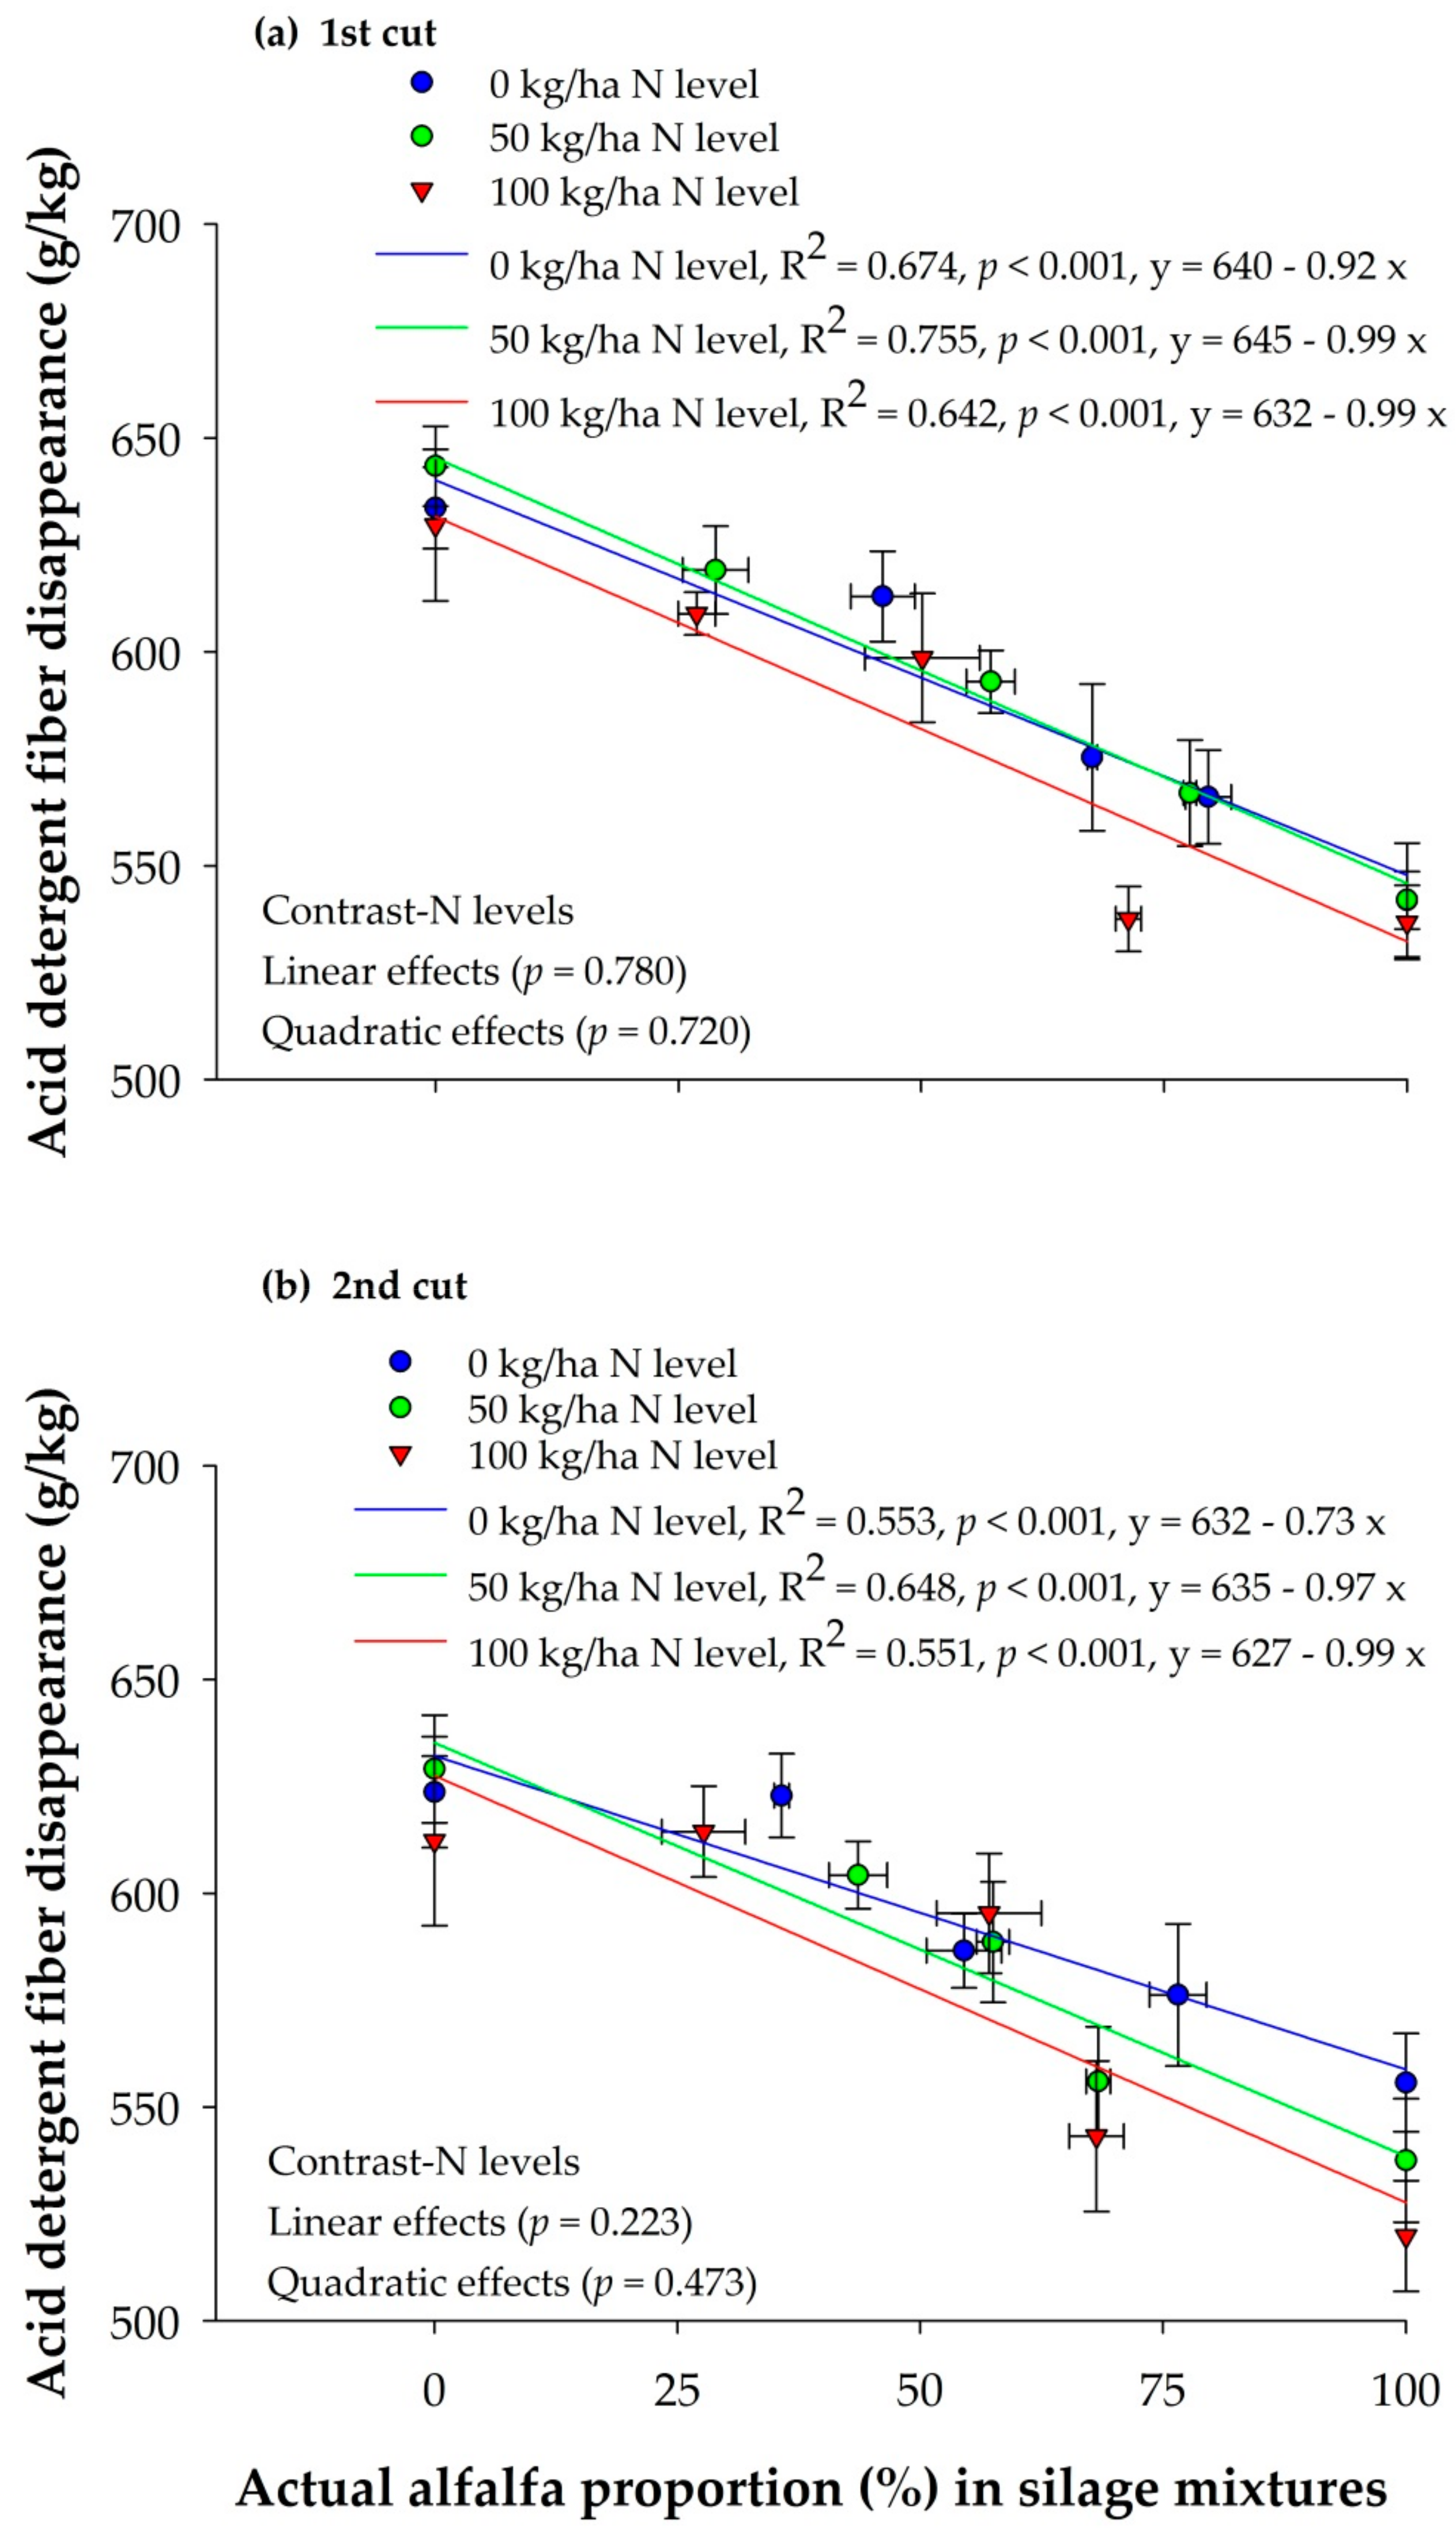
3.5. In Vitro Degradation Characteristics of Silage Mixtures

The IVDMD (Figure 3), OMD (Figure 4), and ME (Table 5) increased, whereas NDFD (Figure 5) and ADFD (Figure 6) decreased as the actual alfalfa proportion increased among silage mixtures for both harvests (p < 0.001). Nitrogen fertilization did not change the nutrients’ degradability in both harvests (p > 0.05, Figure 3, Figure 4, Figure 5, and Figure 6).
The final pH, ammonia N, and total VFAs increased with an increasing alfalfa proportion in the silage mixtures for the two harvests (p < 0.05; Table 5 and Table 6). Regarding the fermentation end-products, there was an increase in the concentrations of acetate, isobutyrate, valerate, and isovalerate as the actual alfalfa proportion increased among the silage mixtures (p < 0.05; Table 5 and Table 6). The increase in the alfalfa proportion in the silage mixtures also increased the CO2 and CH4 for both harvests (p < 0.05; Table 6). Compared with sole alfalfa, silage mixtures of orchardgrass and alfalfa caused a great decrease (up to 17.4%) in the estimated CH4 emissions. Nitrogen levels promoted the production of total VFAs and acetate (p < 0.05), although these effects were marginal in the first cut (p < 0.10; Table 5).

4. Discussion

As we hypothesized, the mixture of orchardgrass and alfalfa at appropriate forage ratios is a good option for making well-preserved silage as indicated by better ensiling profiles, silage quality, and feeding values, with less proteolysis during ensiling and fewer CH4 emissions during ruminal fermentation (Figure 7). The effect of N levels in this study caused less favorable ensiling fermentation and more fiber fractions’ accumulation but did not change IVDMD and ME (Figure 7). These results in our study were helpful for the effective production, preservation, and utilization of superior forages in dairy systems, achieving desirable animal performances but without causing environmental concerns.

4.1. Forage Yield of Orchardgrass and Alfalfa Intercrops

Intercropping legumes with grasses increases forage productivity, nutritive value, and resource-use efficiency [26]. In our current study, the total DM yield increased as the seeding rate of alfalfa increased in intercropping, and the intercropping ratios of orchardgrass and alfalfa at 50:50 commonly resulted in higher total DM yield than other ratios for the two harvests. This might be due to the complementarity and facilitation effects of the intercropped orchardgrass and alfalfa, which increased the resource-use efficiency of light, water, and soil nutrients through the role of soil microorganisms in these processes, hence reducing interspecific competition [27]. Consistently, many studies noted that the total forage DM yield was improved by a grass-legume intercropping system [28,29]. Nitrogen is an essential nutrient for growth and development of plants, and N fertilization is usually practiced to improve forage yield. As expected in the current study, N fertilization increased the total DM yield of orchardgrass and alfalfa intercrops in most occasions, compared with the sole crops. In accordance with a previous study [30], application of 78 kg N/ha to bermudagrass, stargrass, and bahiagrass increased the forage mass by an average of 129% over the value observed under the condition of no N fertilization. Grasses responded positively to higher soil N level, but legumes usually saved the soil N pool, which explained the significant interactions between intercropping ratios and N levels on the total forage DM yield in the current study. High N levels that are in excess of legumes’ needs may interfere with the effect of N-fixing bacteria and reduce the percentage of N derived from the atmosphere and the amounts of fixed N from the legume species, resulting in low DM yields [31,32].

4.2. Chemical Composition of Silage Mixtures

Generally, grasses tend to increase the fiber fractions, such as NDF and ADF, of mixtures owing to the abundant cell wall materials [33], and legumes are usually richer in CP than grasses due to their substantial biological fixation of N from the atmosphere [34]. Similar to the current study, increasing the alfalfa proportion in mixtures increased CP and decreased NDF, ADF, hemicellulose, and cellulose concentrations, suggested that forage mixtures improved nutritive values and reduced the need for purchased protein supplements in ruminant rations [35]. In the present study, an increase in N levels did not change CP in the two cuts, possibly because of the lack of N accumulation in aboveground biomass and the more developed root biomass [36]. In the present study, the concentrations of ADF and ADL increased as the N level increased, because of the quicker plant growth and greater development [37] as well as more cell wall biosynthesis and fibrous tissue accumulation [38]. Similarly, the increase in N levels was negatively associated with the concentrations of NDF in perennial ryegrass [39]. The decrease in the concentration of ash for orchardgrass and alfalfa intercrop mixtures receiving higher N levels in the current study, similar to the study from Waramit et al. [40], was possibly because of higher plant growth rate that increased photosynthetic activity and accumulated more carbon compounds in plants [41].

4.3. Ensiling Characteristics of Silage Mixtures

Silage pH is one of the main determinants that influence the extent of fermentation and quality of ensiled crops, and well-preserved silage usually has a low pH but high lactic acid concentration. In our current study, the increase in the alfalfa proportion in mixtures increased the silage pH, and the concentrations of ammonia N and acetic acid, in agreement with the previous study from Contreras-Govea et al. [42] showing that legumes such as alfalfa, pea, and red clover do not easily make good silage because of their high buffering capacity and low WSC content as well as their high level of proteolysis under the combined effects of both plant and silage microbial enzymes, which compromises the ensiling quality compared with that associated with grasses. Higher production of acetic acid facilitates enterobacteria activity, leading to poor fermentation during the early stages, lowering DM and energy, and the process of acetic acid production directly competes with lactic acid bacteria for nutrient use [6], resulting in a tendency and shift toward acetate production especially when sugar concentrations are low.
In our current study, silage from intercrop mixtures of orchardgrass and alfalfa tended to have higher lactic acid compared with those from an alfalfa monoculture, probably because the higher content of WSC in orchardgrass provided a more readily available fermentation substrate, e.g., soluble sugars for lactic acid-producing bacteria, associated with a more rapid decline in pH for successful fermentation compared with that in sole alfalfa silage [3]. The lower silage pH and ammonia N from silage mixtures than from sole alfalfa crops might also be attributed to the activity of polyphenol oxidase in orchardgrass and the mediated and reduced alfalfa proteolysis, since much higher activity of polyphenol oxidase was observed when orchardgrass was at 740.6 U/g (fresh weight) than with perennial ryegrass, timothy and tall fescue at 119.0, 16.3, and 6.5 U/g, respectively [15].
The increase of N levels increased silage pH in our current study, which could be explained by the increased ammonia N accumulation that acted as a buffer against the pH decline. In comparison with a previous study [43], application of N fertilizer level at 75 kg/ha to alfalfa resulted in the silage pH value at 4.96 and ammonia N concentration at 11.1 mmol/L, lower than the values of sole alfalfa silage under the 50 kg/ha N level in the current study, which could be explained by the different concentrations of CP and lactic acid of alfalfa silage in response to different N levels. Although the accumulation of acetic acid was helpful to improve aerobic stability of silage, excessively accumulated acetic acid and ammonia N may negatively decrease silage intake by cows [44,45]. In the current study, increasing N levels resulted in the increase in acetic acid formation accompanying the decrease in lactic acid concentration, which implied certain hetero-fermentation rather than homo-fermentation during the ensiling process [6]. The decrease in lactic acid concentration might also be owing to substantial lactate acting as the substrate for different fermentation processes, such as acetate fermentation [46]. Similar to the study from Tremblay et al. [47], a higher N application rate for timothy caused less favorable ensiling properties.

4.4. In Vitro Degradation Characteristics

In the present study, the increase in the actual alfalfa proportion in the mixtures increased the IVDMD and OMD compared with that from an orchardgrass monoculture for both harvests. In agreement with a previous study [48], IVDMD quadratically increased when the proportion of alfalfa increased in axonopus-alfalfa and tall fescue-alfalfa mixtures. This may be because balanced digestible nutrients from orchardgrass and alfalfa silage mixtures set off a ruminal synergistic effect on the fractional rate of degradation and the extent of fermentation, followed by better nutrient availability and utilization efficiency for rumen microorganisms [49]. The association between fermented nutrients from grass and legume mixtures may also lead to synergistic effects on the dominant microbial populations and shifts in the microbial community composition [50], and different metabolic pathways might be simultaneously driven through niche compartmentalization and functional dominance between abundant bacteria [51]. In the current study, no differences were observed in the IVDMD and OMD for silage mixtures when alfalfa proportion was ≥50%. If a mixture with a high level of IVDMD and OMD is needed, at least 50% alfalfa is required.
Higher fiber content means a lower degradation rate and longer fermentation time [52], and the indigestible fiber, e.g., ADL, in particular, is the main physical barrier interfering with microbial attachment and degradation, and this is negatively correlated with fiber digestibility [33]. In accordance with the present study, the decrease in NDFD and ADFD with an increasing alfalfa proportion in silage mixtures is due to the higher ADL in the cell wall of alfalfa compared with that of orchardgrass, and the higher degree of NDF lignification and lower level of digestible NDF fractions in alfalfa than in grass [53], corresponding to the diversified populations of the three predominant fibrolytic bacteria, e.g., F. succinogenes, R. albus, and R. flavefaciens in the rumen [54]. In the current study, no effect of N levels was observed on IVDMD, in parallel with the previous study [55], and the pronounced fiber fractions accumulation with increasing N levels in the second cut explained the decreased NDFD and OMD in the present study.
The end-product gases (e.g., CH4, CO2, and H2) are mainly produced from the process of carbohydrate fermentation rather than protein fermentation during in vitro incubation, and only a small proportion of gas is indirectly produced from the buffering of short chain VFAs [56]. These gases imply not only lower efficiency and productivity of livestock systems but also considerable threats to our environment [57]. In the current study, the increase of alfalfa proportion in orchardgrass and alfalfa mixtures increased the CO2 and CH4. Consistent with the previous studies [58,59], the amount of CO2 and CH4 produced from grass pastures was less than that from alfalfa pastures, because CH4 production was positively corrected with the concentrations of readily fermentable nitrogen free extract and IVDMD. In contrast, the CH4 production from orchardgrass hay was higher than from alfalfa hay at 15.76 and 20.56 mol/100 mol respectively, which was mainly due to the higher ratio of acetate to propionate in orchardgrass than in alfalfa [60]. Other researchers also confirmed that tannins in forages could suppress the methanogenic bacteria to mitigate CH4 emissions [61]. However, N levels did not affect the end-product gases due to the similar responses of IVDMD and the ratio of acetate to propionate to different N levels.

4.5. In Vitro Fermentation Characteristics

The final pH and ammonia N in cultured fluid tends to be associated with the proportion of legumes in the fermented forages [62]. In the current study, increasing the alfalfa proportion increased the final pH and ammonia N in the cultured fluid, possibly indicating the rapid release of NH3 from soluble protein degradation and lower NH3 uptake by ruminal bacteria. Similarly, a higher concentration of NH3 was found in sole alfalfa silage at 32.8 mg/dL than in sweet sorghum sole silage at 25.6 mg/dL [54]. Volatile fatty acids from ruminal degradation of feed constituents account for the majority of the energy utilized by the host animal, especially the total VFAs and the relative concentrations of important determinants, e.g., acetate, propionate, and butyrate [63]. Higher levels of soluble carbohydrates provided energy resources for better fermentative environments and ruminal microbe growth, and coincided with higher VFAs production, degradation rates, and effective degradability [64]. Our present study also confirmed that increasing alfalfa inclusion increased the total VFAs’ production. Nitrogen fertilization did not change the total VFAs’ production in the current study, in agreement with the study from Peyraud an Astigarraga [55].
Branched-chain VFAs (e.g., isobutyrate, valerate, and isovalerate) are mainly fermented in the rumen as end-products from protein degradation, and they are the essential factors for cellulolytic bacterial growth. The concentrations of branched-chain VFAs produced were mainly dependent on the composition and extent of ruminal deamination of amino acids in feeds, and higher CP was significantly correlated with the higher molar concentrations of valerate and isovalerate production [65], which explained the higher ruminal valerate and isovalerate production with increasing alfalfa proportion in the present study. However, no effects of N levels occurred on the molar concentrations of branched-chain VFAs in the present study because the community of dominant ruminal microbes and fermentation pathways of VFA end-products were not affected or changed [19].

5. Conclusions

Inclusion of alfalfa at 62%, 57%, and 54% under a 0, 50, and 100 kg/ha N level respectively, in orchardgrass-alfalfa mixtures is a good option to make well-preserved silage with higher forage quality and feeding values but with lower CH4 emissions than sole crops. The intercrop mixtures possibly compensated for the low WSC content and high buffering capacity of alfalfa that favored good ensiling and also alleviated the extensive proteolysis which may adversely affect the utilization of N by ruminants. Compared with unfertilized intercrops, a high N level at 100 kg/ha caused less favorable ensiling fermentation and more fiber fractions’ accumulation accompanied by more acetate and total VFAs’ production, although it did not change the nutrients’ degradability. This practice in our study provides guidance and reference on effective production, preservation, and utilization of superior forages in dairy rations, which underpins to achieve desirable animal performances and profitability but with a reduction of up to 17.4% of estimated CH4 emissions.

Author Contributions

Conceptualization, Z.X.; methodology, Z.X. and Y.Z.; formal analysis, Z.X. and Y.Z.; investigation, Z.X., Y.W., and S.L.; data curation, Z.X. and Y.Z.; writing—original draft preparation, Z.X.; writing—review and editing, H.Y. and Y.Z.; supervision, Y.Z.; project administration, Y.Z.; funding acquisition, Y.Z. All authors have read and agreed to the published version of the manuscript.

Funding

This study was funded by the China Forage and Grass Research System (CARS-34).

Conflicts of Interest

There are no conflict of interest in this work.

References

  1. Stewart, A.V.; Ellison, N.W. Dactylis. In Wild Crop Relatives: Genomic and Breeding Resources: Millets and Grasses; Kole, C., Ed.; Springer: Berlin/Heidelberg, Germany, 2011; pp. 73–87. [Google Scholar]
  2. Majidi, M.M.; Hoseini, B.; Abtahi, M.; Mirlohi, A.; Araghi, B. Genetic analysis of seed related traits in Orchardgrass (Dactylis glomerata) under normal and drought stress conditions. Euphytica 2015, 203, 409–420. [Google Scholar] [CrossRef]
  3. Nguyen, H.V.; Kawai, M.; Takahashi, J.; Matsuoka, S. Change in nitrogen fractions and ruminal nitrogen degradability of orchardgrass and alfalfa during the ensiling process and the subsequent effects on nitrogen utilization by sheep. Asian Australas. J. Anim. Sci. 2004, 17, 1524–1528. [Google Scholar] [CrossRef]
  4. Tenikecier, H.S.; Ates, E. Research article chemical composition of six grass species (Poaceae sp.) From protected forest range in northern bulgaria. Asian J. Appl. Sci. 2018, 11, 71–75. [Google Scholar] [CrossRef] [Green Version]
  5. National Research Council. Nutrient Requirements of Dairy Cattle; National Academies Press: Washington, DC, USA, 2001. [Google Scholar]
  6. McDonald, P.; Henderson, A.; Heron, S. The Biochemistry of Silage; Chalcombe Publications: Aberyswyth, UK, 1991. [Google Scholar]
  7. Winters, A.; Cockburn, J.; Dhanoa, M.; Merry, R. Effects of lactic acid bacteria in inoculants on changes in amino acid composition during ensilage of sterile and non-sterile ryegrass. J. Appl. Microbiol. 2000, 89, 442–452. [Google Scholar] [CrossRef]
  8. Chaudhry, A.S.; Khan, M.M.H. Impacts of different spices on in vitro rumen dry matter disappearance, fermentation and methane of wheat or ryegrass hay based substrates. Livest. Sci. 2012, 146, 84–90. [Google Scholar] [CrossRef]
  9. Cronje, P.B. Ruminant Physiology: Digestion, Metabolism, Growth, and Reproduction; CABI Publishing: Wallingford, UK, 2000. [Google Scholar]
  10. Adesogan, A.; Salawu, M.; Williams, S.; Fisher, W.; Dewhurst, R. Reducing concentrate supplementation in dairy cow diets while maintaining milk production with pea-wheat intercrops. J. Dairy Sci. 2004, 87, 3398–3406. [Google Scholar] [CrossRef] [Green Version]
  11. Maxin, G.; Andueza, D.; Le Morvan, A.; Baumont, R. Effect of intercropping vetch (Vicia sativa L.), field pea (Pisum sativum L.) and triticale (X Triticosecale) on dry-matter yield, nutritive and ensiling characteristics when harvested at two growth stages. Grass Forage Sci. 2017, 72, 777–784. [Google Scholar] [CrossRef]
  12. Kumar, A.; Patel, A. Effect of date of sowing and cutting intervals on yield attribute, yield, quality and soil fertility of Lucerne [Medicago sativa L.] under North Gujarat agroclimatic conditions. J. Pharmacogn. Phytochem. 2017, 6, 245–255. [Google Scholar]
  13. Cherney, D.J.R.; Cherney, J.H.; SicilianoJones, J. Alfalfa composition and in sacco fiber and protein disappearance as influenced by nitrogen application. J. Appl. Anim. Res. 1995, 8, 105–120. [Google Scholar] [CrossRef]
  14. Miller, D.A. Forage Crops; McGraw-Hill Book Company: New York, NY, USA, 1984. [Google Scholar]
  15. Lee, M.R.; Olmos Colmenero, J.D.J.; Winters, A.L.; Scollan, N.D.; Minchin, F.R. Polyphenol oxidase activity in grass and its effect on plant-mediated lipolysis and proteolysis of Dactylis glomerata (cocksfoot) in a simulated rumen environment. J. Sci. Food Agric. 2006, 86, 1503–1511. [Google Scholar] [CrossRef]
  16. Merry, R.J.; Lee, M.R.; Davies, D.R.; Dewhurst, R.J.; Moorby, J.M.; Scollan, N.D.; Theodorou, M.K. Effects of high-sugar ryegrass silage and mixtures with red clover silage on ruminant digestion. 1. In vitro and in vivo studies of nitrogen utilization. J. Anim. Sci. 2006, 84, 3049–3060. [Google Scholar] [CrossRef]
  17. Li, Y.; Meng, Q. Effect of different types of fibre supplemented with sunflower oil on ruminal fermentation and production of conjugated linoleic acids in vitro. Arch. Anim. Nutr. 2006, 60, 402–411. [Google Scholar] [CrossRef]
  18. Menke, K.H.; Steingass, H. Estimation of the energetic feed value obtained from chemical analysis and in vitro gas production using rumen fluid. Anim. Res. Dev. 1988, 28, 7–55. [Google Scholar]
  19. Cui, J.; Yang, H.; Yu, C.; Bai, S.; Wu, T.; Song, S.; Sun, W.; Shao, X.; Jiang, L. Effect of urea fertilization on biomass yield, chemical composition, in vitro rumen digestibility and fermentation characteristics of straw of highland barley planted in Tibet. J. Agric. Sci. 2016, 154, 151–164. [Google Scholar] [CrossRef]
  20. CSIRO. Nutrient Requirements of Domesticated Ruminants; CSIRO Publishing: Collingwood, Australia, 2007. [Google Scholar]
  21. INRA. INRA Feeding System for Ruminants; Wageningen Academic Publishers: Wageningen, The Netherlands, 2018; pp. 44–59. [Google Scholar]
  22. Wolin, M.J. A theoretical rumen fermentation balance. J. Dairy Sci. 1960, 43, 1452–1459. [Google Scholar] [CrossRef]
  23. Groot, J.C.; Williams, B.A.; Oostdam, A.J.; Boer, H.; Tamminga, S. The use of cumulative gas and volatile fatty acid production to predict in vitro fermentation kinetics of Italian ryegrass leaf cell walls and contents at various time intervals. Br. J. Nutr. 1998, 79, 519–525. [Google Scholar] [CrossRef] [Green Version]
  24. Moss, A.R.; Jouany, J.P.; Newbold, J. Methane production by ruminants: Its contribution to global warming. Ann. Zootech. 2000, 49, 231–253. [Google Scholar] [CrossRef] [Green Version]
  25. Dijkstra, J.; Forbes, J.M.; France, J. Quantitative Aspects of Ruminant Digestion and Metabolism; CABI International: Wallingford, UK, 2005. [Google Scholar]
  26. Lithourgidis, A.S.; Vasilakoglou, I.B.; Dhima, K.V.; Dordas, C.A.; Yiakoulaki, M.D. Forage yield and quality of common vetch mixtures with oat and triticale in two seeding ratios. Field Crop. Res. 2006, 99, 106–113. [Google Scholar] [CrossRef]
  27. Duchene, O.; Vian, J.F.; Celette, F. Intercropping with legume for agroecological cropping systems: Complementarity and facilitation processes and the importance of soil microorganisms. A review. Agric. Ecosyst. Environ. 2017, 240, 148–161. [Google Scholar] [CrossRef]
  28. Hauggaard-Nielsen, H.; Lachouani, P.; Knudsen, M.T.; Ambus, P.; Boelt, B.; Gislum, R. Productivity and carbon footprint of perennial grass–forage legume intercropping strategies with high or low nitrogen fertilizer input. Sci. Total Environ. 2016, 541, 1339–1347. [Google Scholar] [CrossRef] [Green Version]
  29. Choudhary, M.; Prabhu, G.; Palsaniya, D.R. Response of guinea grass (Megathyrsus maximus) genotypes to intercropping with forage legumes under varying nitrogen management options. Grass Forage Sci. 2018, 73, 888–896. [Google Scholar] [CrossRef]
  30. Johnson, C.R.; Reiling, B.A.; Mislevy, P.; Hall, M.B. Effects of nitrogen fertilization and harvest date on yield, digestibility, fiber, and protein fractions of tropical grasses. J. Anim. Sci. 2001, 79, 2439–2448. [Google Scholar] [CrossRef]
  31. Kermah, M.; Franke, A.C.; Adjei-Nsiah, S.; Ahiabor, B.D.K.; Abaidoo, R.C.; Giller, K.E. N2-fixation and N contribution by grain legumes under different soil fertility status and cropping systems in the Guinea savanna of northern Ghana. Agric. Ecosyst. Environ. 2018, 261, 201–210. [Google Scholar] [CrossRef]
  32. Saturno, D.F.; Cerezini, P.; Moreira da Silva, P.; Oliveira, A.B.D.; Oliveira, M.C.N.D.; Hungria, M.; Nogueira, M.A. Mineral nitrogen impairs the biological nitrogen fixation in soybean of determinate and indeterminate growth types. J. Plant Nutr. 2017, 40, 1690–1701. [Google Scholar] [CrossRef]
  33. Buxton, D.R.; Redfearn, D.D. Plant limitations to fiber digestion and utilization. J. Nutr. 1997, 127, 814S–818S. [Google Scholar] [CrossRef] [Green Version]
  34. Jahanzad, E.; Sadeghpour, A.; Hosseini, M.B.; Barker, A.V.; Hashemi, M.; Zandvakili, O.R. Silage yield and nutritive value of millet-soybean intercrops as influenced by nitrogen application. Agron. J. 2014, 106, 1993–2000. [Google Scholar] [CrossRef]
  35. Adesogan, A.T.; Salawu, M.B.; Deaville, E.R. The effect on voluntary feed intake, in vivo digestibility and nitrogen balance in sheep of feeding grass silage or pea-wheat intercrops differing in pea to wheat ratio and maturity. Anim. Feed Sci. Technol. 2002, 96, 161–173. [Google Scholar] [CrossRef]
  36. Li, M.; Wang, Y.; Adeli, A.; Yan, H. Effects of application methods and urea rates on ammonia volatilization, yields and fine root biomass of alfalfa. Field Crop. Res. 2018, 218, 115–125. [Google Scholar] [CrossRef]
  37. Eltelib, H.A.; Hamad, M.A.; Ali, E.E. The effect of nitrogen and phosphorus fertilization on growth, yield and quality of forage maize (Zea mays L.). J. Agron. 2006, 5, 515–518. [Google Scholar] [CrossRef] [Green Version]
  38. Coblentz, W.K.; Akins, M.S.; Cavadini, J.S.; Jokela, W.E. Net effects of nitrogen fertilization on the nutritive value and digestibility of oat forages. J. Dairy Sci. 2017, 100, 1739–1750. [Google Scholar] [CrossRef] [Green Version]
  39. Loaiza, P.A.; Balocchi, O.; Bertrand, A. Carbohydrate and crude protein fractions in perennial ryegrass as affected by defoliation frequency and nitrogen application rate. Grass Forage Sci. 2017, 72, 556–567. [Google Scholar] [CrossRef]
  40. Waramit, N.; Moore, K.J.; Heggenstaller, A.H. Composition of native warm-season grasses for bioenergy production in response to nitrogen fertilization rate and harvest date. Agron. J. 2011, 103, 655–662. [Google Scholar] [CrossRef]
  41. Sarmadi, B.; Rouzbehan, Y.; Rezaei, J. Influences of growth stage and nitrogen fertilizer on chemical composition, phenolics, in situ degradability and in vitro ruminal variables in amaranth forage. Anim. Feed Sci. Technol. 2016, 215, 73–84. [Google Scholar] [CrossRef]
  42. Contreras-Govea, F.; Marsalis, M.; Angadi, S.; Smith, G.; Lauriault, L.M.; VanLeeuwen, D. Fermentability and nutritive value of corn and forage sorghum silage when in mixture with lablab bean. Crop Sci. 2011, 51, 1307–1313. [Google Scholar] [CrossRef]
  43. Xue, Z.; Liu, N.; Wang, Y.; Yang, H.; Wei, Y.; Moriel, P.; Palmer, E.; Zhang, Y. Combining orchardgrass and alfalfa: Effects of forage ratios on in vitro rumen degradation and fermentation characteristics of silage compared with hay. Animals 2020, 10, 59. [Google Scholar] [CrossRef] [Green Version]
  44. Danner, H.; Holzer, M.; Mayrhuber, E.; Braun, R. Acetic acid increases stability of silage under aerobic conditions. Appl. Environ. Microbiol. 2003, 69, 562–567. [Google Scholar] [CrossRef] [Green Version]
  45. De Oliveira, J.S.; Santos, E.M.; dos Santos, A.P.M. Intake and digestibility of silages. In Advances in Silage Production and Utilization, 1st ed.; Da Silva, T., Santos, E.M., Eds.; IntechOpen: Rijeka, Croatia, 2016. [Google Scholar]
  46. Namihira, T.; Shinzato, N.; Akamine, H.; Maekawa, H.; Matsui, T. Influence of nitrogen fertilization on tropical-grass silage assessed by ensiling process monitoring using chemical and microbial community analyses. J. Appl. Microbiol. 2010, 108, 1954–1965. [Google Scholar] [CrossRef]
  47. Tremblay, G.F.; Belanger, G.; Drapeau, R. Nitrogen fertilizer application and developmental stage affect silage quality of timothy (Phleum pratense L.). Grass Forage Sci. 2005, 60, 337–355. [Google Scholar] [CrossRef]
  48. Dal Pizzol, J.G.; Ribeiro-Filho, H.M.N.; Quereuil, A.; Le Morvan, A.; Niderkorn, V. Complementarities between grasses and forage legumes from temperate and subtropical areas on in vitro rumen fermentation characteristics. Anim. Feed Sci. Technol. 2017, 228, 178–185. [Google Scholar] [CrossRef]
  49. Kiran, D.; Krishnamoorthy, U. Rumen fermentation and microbial biomass synthesis indices of tropical feedstuffs determined by the in vitro gas production technique. Anim. Feed Sci. Technol. 2007, 134, 170–179. [Google Scholar] [CrossRef]
  50. Pandit, R.J.; Hinsu, A.T.; Patel, S.H.; Jakhesara, S.J.; Koringa, P.G.; Bruno, F.; Psifidi, A.; Shah, S.; Joshi, C.G. Microbiota composition, gene pool and its expression in Gir cattle (Bos indicus) rumen under different forage diets using metagenomic and metatranscriptomic approaches. Syst. Appl. Microbiol. 2018, 41, 374–385. [Google Scholar] [CrossRef] [Green Version]
  51. Hart, E.H.; Creevey, C.J.; Hitch, T.; Kingston-Smith, A.H. Meta-proteomics of rumen microbiota indicates niche compartmentalisation and functional dominance in a limited number of metabolic pathways between abundant bacteria. Sci. Rep. 2018, 8, 10504. [Google Scholar] [CrossRef] [Green Version]
  52. Diaz, A.; Dolores Carro, M.; Palacios, C.; Mateos, I.; Saro, C.; Luisa Tejido, M.; Jose Ranilla, M. Nutritive value for ruminants of winter oats-legume intercrops in organic cultivation. Anim. Prod. Sci. 2014, 54, 1791–1795. [Google Scholar] [CrossRef] [Green Version]
  53. Akin, D.E.; Morrison, W.H.; Himmelsbach, D.S. Characterization of digestion residues of alfalfa and orchardgrass leaves by microscopic, spectroscopic and chemical-analysis. J. Sci. Food Agric. 1993, 63, 339–347. [Google Scholar] [CrossRef]
  54. Chen, L.; Dong, Z.; Li, J.; Shao, T. Ensiling characteristics, in vitro rumen fermentation, microbial communities and aerobic stability of low-dry matter silages produced with sweet sorghum and alfalfa mixtures. J. Sci. Food Agric. 2019, 99, 2140–2151. [Google Scholar] [CrossRef]
  55. Peyraud, J.; Astigarraga, L. Review of the effect of nitrogen fertilization on the chemical composition, intake, digestion and nutritive value of fresh herbage: Consequences on animal nutrition and N balance. Anim. Feed Sci. Technol. 1998, 72, 235–259. [Google Scholar] [CrossRef]
  56. Getachew, G.; Blummel, M.; Makkar, H.P.S.; Becker, K. In vitro gas measuring techniques for assessment of nutritional quality of feeds: A review. Anim. Feed Sci. Technol. 1998, 72, 261–281. [Google Scholar] [CrossRef]
  57. Rojas-Downing, M.M.; Nejadhashemi, A.P.; Harrigan, T.; Woznicki, S.A. Climate change and livestock: Impacts, adaptation, and mitigation. Clim. Risk Manag. 2017, 16, 145–163. [Google Scholar] [CrossRef]
  58. Chaves, A.; Thompson, L.; Iwaasa, A.; Scott, S.; Olson, M.; Benchaar, C.; Veira, D.; McAllister, T. Effect of pasture type (alfalfa vs. grass) on methane and carbon dioxide production by yearling beef heifers. Can. J. Anim. Sci. 2006, 86, 409–418. [Google Scholar] [CrossRef]
  59. Jayanegara, A.; Wina, E.; Soliva, C.; Marquardt, S.; Kreuzer, M.; Leiber, F. Dependence of forage quality and methanogenic potential of tropical plants on their phenolic fractions as determined by principal component analysis. Anim. Feed Sci. Technol. 2011, 163, 231–243. [Google Scholar] [CrossRef]
  60. Xu, M.; Rinker, M.; McLeod, K.R.; Harmon, D.L. Yucca schidigera extract decreases in vitro methane production in a variety of forages and diets. Anim. Feed Sci. Technol. 2010, 159, 18–26. [Google Scholar] [CrossRef]
  61. Danielsson, R.; Dicksved, J.; Sun, L.; Gonda, H.; Müller, B.; Schnürer, A.; Bertilsson, J. Methane production in dairy cows correlates with rumen methanogenic and bacterial community structure. Front. Microbiol. 2017, 8, 226. [Google Scholar] [CrossRef]
  62. Hess, H.D.; Monsalve, L.M.; Lascano, C.E.; Carulla, J.E.; Díaz, T.E.; Kreuzer, M. Supplementation of a tropical grass diet with forage legumes and Sapindus saponaria fruits: Effects on in vitro ruminal nitrogen turnover and methanogenesis. Aust. J. Agric. Res. 2003, 54, 703–713. [Google Scholar] [CrossRef]
  63. Vlaeminck, B.; Fievez, V.; Cabrita, A.R.J.; Fonseca, A.J.M.; Dewhurst, R.J. Factors affecting odd- and branched-chain fatty acids in milk: A review. Anim. Feed Sci. Technol. 2006, 131, 389–417. [Google Scholar] [CrossRef]
  64. Cho, A.S.; Ueda, K.; Kondo, S. Evaluation of associative effects on ruminal digestion kinetics between pasture and grains using in vitro gas production method. Anim. Sci. J. 2012, 83, 650–655. [Google Scholar] [CrossRef]
  65. Getachew, G.; Robinson, P.; DePeters, E.; Taylor, S. Relationships between chemical composition, dry matter degradation and in vitro gas production of several ruminant feeds. Anim. Feed Sci. Technol. 2004, 111, 57–71. [Google Scholar] [CrossRef]
Figure 1. Effects of orchardgrass and alfalfa silage mixtures on the neutral detergent fiber (NDF) concentration in (a) the first cut and (b) the second cut. The data are shown as means ± standard error. The horizontal error bar represents the variations of actual alfalfa proportion in silage mixtures, and the vertical error bar represents the variations of NDF concentrations. Contrasts were tested to symbolize the linear and quadratic effect of both the actual alfalfa proportion and the N fertilizing levels on NDF concentrations.
Sustainability 12 00871 g001
Figure 2. Effects of orchardgrass and alfalfa silage mixtures on the acid detergent fiber (ADF) concentration in (a) the first cut and (b) the second cut. The data are shown as means ± standard error. The horizontal error bar represents the variations of actual alfalfa proportion in silage mixtures, and the vertical error bar represents the variations of ADF concentrations. Contrasts were tested to symbolize the linear and quadratic effect of both the actual alfalfa proportion and the N fertilizer levels on ADF concentrations.
Sustainability 12 00871 g002
Figure 3. Effects of orchardgrass and alfalfa silage mixtures on the in vitro dry matter disappearance (IVDMD) in (a) the first cut and (b) the second cut. The data are shown as means ± standard error. The horizontal error bar represents the variations of actual alfalfa proportion in silage mixtures, and the vertical error bar represents the variations of IVDMD concentrations. Contrasts were tested to symbolize the linear and quadratic effect of both the actual alfalfa proportion and N levels on IVDMD concentrations.
Sustainability 12 00871 g003
Figure 4. Effects of orchardgrass and alfalfa silage mixtures on the organic matter digestibility (OMD) in (a) the first cut and (b) the second cut. The data are shown as means ± standard error. The horizontal error bar represents the variations of actual alfalfa proportion in silage mixtures, and the vertical error bar represents the variations of OMD concentrations. Contrasts were tested to symbolize the linear and quadratic effect of both the actual alfalfa proportion and the N levels on OMD concentrations.
Sustainability 12 00871 g004
Figure 5. Effects of orchardgrass and alfalfa silage mixtures on the in vitro neutral detergent fiber disappearance (NDFD) in (a) the first cut and (b) the second cut. The Data are shown as means ± standard error. The horizontal error bar represents the variations of actual alfalfa proportion in silage mixtures, and the vertical error bar represents the variations of NDFD concentrations. Contrasts were tested to symbolize the linear and quadratic effect of both the actual alfalfa proportion and the N levels on NDFD concentrations.
Sustainability 12 00871 g005
Figure 6. Effects of orchardgrass and alfalfa silage mixtures on the in vitro acid detergent fiber disappearance (ADFD) in (a) the first cut and (b) the second cut. The data are shown as means ± standard error. The horizontal error bar represents the variations of actual alfalfa proportion in silage mixtures, and the vertical error bar represents the variations of ADFD concentrations. Contrasts were tested to symbolize the linear and quadratic effect of both the actual alfalfa proportion and the N levels on ADFD concentrations.
Sustainability 12 00871 g006
Figure 7. A qualitative scheme indicating the effects of forages ratios and nitrogen (N) fertilizer levels on the ensiling characteristics, nutritive values and in vitro degradation characteristics of orchardgrass and alfalfa silage mixtures. Note: CP, crude protein; ADL, acid detergent fiber; NDF, neutral detergent fiber; ADF, acid detergent fiber; IVDMD, in vitro dry matter disappearance; OMD, organic matter digestibility; ME, metabolizable energy; VFA, volatile fatty acids; CO2, carbon dioxide; CH4, methane; NDFD, neutral detergent fiber disappearance; ADFD, acid detergent fiber disappearance.
Sustainability 12 00871 g007
Table 1. Forage dry matter (DM) yield of intercrops mixtures and the actual proportions of orchardgrass and alfalfa in intercrops mixtures in the first and second cut.
N Level
(kg/ha)
Intercropping Ratios of
Orchardgrass to Alfalfa
Total Yield (g/m2)Actual Orchardgrass (%)Actual Alfalfa (%)
First
Cut
Second
Cut
First
Cut
Second
Cut
First
Cut
Second
Cut
0100:0328cB329bB100a100a0e0e
75:25479bcB426aB54bB64b46dA36d
50:50638ab487a32cB45c68cA55c
25:75768a514a20d23d80b77b
0:100573b392a0e0e100a100a
50100:0449cAB418bAB100a100a0e0d
75:25516cB631aA71bA56b29dB44c
50:50600bc574a43cAB43c57cAB57b
25:75720ab508a22d32c78b68b
0:100647ab552a0e0d100a100a
100100:0576aA438aA100a100a0e0d
75:25713aA496aAB73bA72b27dB28c
50:50683a565a50cA43c50cB57b
25:75675a458a29d32c71b68b
0:100598a467a0e0d100a100a
SEM 117.012.44.64.44.64.4
ANOVA-Intercropping ratios<0.001<0.001<0.001<0.001<0.001<0.001
ANOVA-N levels0.001<0.001<0.0010.091<0.0010.091
Contrast-Intercropping ratios 2
Linear<0.0010.150<0.001<0.001<0.001<0.001
Quadratic<0.001<0.001<0.001<0.001<0.001<0.001
Contrast-N level 3
Linear0.0270.0680.4270.8020.4270.802
Quadratic0.0780.0010.7240.9500. 7240.950
Interaction 4<0.0010.049<0.0010.009<0.0010.009
1 SEM: standard error of means. ANOVA: analysis of variance. Different small letters indicate significant differences at p < 0.05 among intercropping ratios under the same N level, and different capital letters indicate significant differences at p < 0.05 among N levels under the same intercropping ratio. 2 Contrast-Intercrop ratios: linear and quadratic polynomial contrasts for intercropping ratios. 3 Contrast-N level: linear and quadratic polynomial contrasts for N levels. 4 Interaction indicates the interaction between intercropping ratios and N levels.
Table 2. Chemical composition of orchardgrass and alfalfa intercrop mixtures prior to ensiling in the first and second cut (on dry matter basis, g/kg).
N Level
(kg/ha)
Actual Alfalfa Proportion (%)DM 1CPNDFADFADLAsh
First
Cut
Second
Cut
First
Cut
Second
Cut
First
Cut
Second
Cut
First
Cut
Second
Cut
First
Cut
Second
Cut
First
Cut
Second
Cut
First
Cut
Second
Cut
00025526712011455057329932134.839.797.0119.9
463626524814614249156430732943.749.0105.7115.1
685527524715317644150928532344.861.7103.491.2
807726325018120042947128630258.473.0101.886.6
10010025526419120439243025629661.076.995.983.0
500024524511912056958531433541.848.293.3112.7
294426725414215447855829433942.862.695.5108.6
575726127815618347451530532455.366.999.7102.7
786826126618219745550428831866.671.096.890.9
10010025326320719939244928131563.986.797.284.6
1000025225713712556059832334145.755.6102.4109.0
272826025614414449956230833958.556.499.3103.5
505726125215517546954830032662.164.797.492.4
716827326217518644751229532865.373.889.187.9
10010024424618220141140429629477.489.688.781.2
SEM 20.40.40.40.40.80.80.30.30.170.200.070.18
Contrast-actual alfalfa proportion 3
Linear0.7940.448<0.001<0.001<0.001<0.001<0.001<0.001<0.001<0.0010.143<0.001
Quadratic0.2730.713<0.001<0.001<0.001<0.001<0.001<0.001<0.001<0.0010.015<0.001
Contrast-N level 4
Linear0.6630.6250.9840.9360.3580.430<0.0010.104<0.0010.114<0.0010.340
Quadratic0.8750.7450.9250.9020.6290.7030.0040.1530.0040.2270.0020.484
1 DM: dry matter, CP: crude protein, NDF: neutral detergent fiber, ADF: acid detergent fiber, ADL: acid detergent fiber. 2 SEM: standard error of means. 3 Contrast-actual alfalfa proportion: linear and quadratic polynomial contrasts for actual alfalfa proportion. 4 Contrast-N level: linear and quadratic polynomial contrasts for N levels.
Table 3. Chemical composition of orchardgrass and alfalfa silage mixtures as affected by alfalfa proportion and N levels in first and second cut (on dry matter basis, g/kg).
N Level
(kg/ha)
Actual Alfalfa Proportion (%)Crude ProteinAshHemicelluloseCelluloseDry MatterAcid Detergent Lignin
First
Cut
Second
Cut
First
Cut
Second
Cut
First
Cut
Second
Cut
First
Cut
Second
Cut
First
Cut
Second
Cut
First
Cut
Second
Cut
First
Cut
Second
Cut
00012111312612116815427827538037937.541.6
463614914711611716214923726138138053.849.6
685516617310911212212423424438638055.359.3
807718417411011170.611122724137938156.365.1
10010019018610611178.592.221323538238466.161.9
500012012111612119218427427137637540.649.2
294415113911310412413524925638738251.156.9
575717416810710886.690.924325038337855.357.6
786818717410410897.880.622723737738263.963.2
10010020018310310285.381.321523638037769.072.1
1000014011311011219318328429138338644.349.0
272815813010510415914825626438138257.959.6
505718116410610411193.726425437438358.161.4
716818916410410012493.824324237838169.667.6
10010019518898.398.490.999.523022237638374.780.2
SEM 13.63.40.851.055.475.282.992.962.81.81.441.35
Contrast-actual alfalfa proportion 2
Linear<0.001<0.001<0.001<0.001<0.001<0.001<0.001<0.0010.8080.855<0.001<0.001
Quadratic<0.001<0.001<0.001<0.001<0.001<0.001<0.001<0.0010.9220.983<0.001<0.001
Contrast-N level 3
Linear0.2450.424<0.001<0.0010.2590.8560.0150.6480.6170.6300.0430.014
Quadratic0.5100.7000.004<0.0010.3500.6430.0380.8130.8780.6580.1180.049
1 SEM: standard error of means. 2 Contrast-actual alfalfa proportion: linear and quadratic polynomial contrasts for actual alfalfa proportion. 3 Contrast-N level: linear and quadratic polynomial contrasts for N levels
Table 4. Ensiling characteristics of orchardgrass and alfalfa mixtures in the first and second cut.
N Level
(kg/ha)
Actual Alfalfa Proportion (%)pHAmmonia N (mmol/L)Lactic Acid (mmol/L)Acetic Acid (mmol/L)Propionic Acid (mmol/L)Butyric Acid (mmol/L)
First
Cut
Second
Cut
First
Cut
Second
Cut
First
Cut
Second
Cut
First
Cut
Second
Cut
First
Cut
Second
Cut
First
Cut
Second
Cut
First
Cut
Second
Cut
0004.474.424.693.68102511361.822.780.841.150.080.07
46364.634.485.046.899109971.996.500.561.600.100.08
68554.684.826.517.188598744.796.890.390.650.060.06
80774.545.056.288.677547185.209.890.411.600.080.05
1001005.115.187.469.065335987.069.990.670.560.230.02
50004.524.565.125.9372410682.082.900.411.380.130.06
29444.544.796.587.985889832.927.250.251.320.090.10
57574.534.658.048.995749777.547.870.510.700.150.10
78684.765.058.0610.45387947.888.770.830.460.130.06
1001005.225.2310.311.65155468.638.680.140.290.220.04
100004.674.644.347.407959133.384.760.972.220.440.06
27284.815.135.989.047228063.375.920.781.800.370.12
50574.775.127.1611.57407737.577.900.201.870.340.16
71684.845.189.7712.75116657.737.950.220.340.380.05
1001005.235.3313.213.440944110.26.230.190.210.410.14
SEM 10.0350.0430.4200.35630.529.80.4150.3280.0450.0940.0210.009
Contrast-actual alfalfa proportion 2
Linear<0.001<0.001<0.001<0.001<0.001<0.001<0.001<0.0010.008<0.0010.7540.648
Quadratic<0.001<0.001<0.001<0.001<0.001<0.001<0.001<0.0010.022<0.0010.4260.458
Contrast-N level 3
Linear0.0370.0050.040<0.0010.0140.0460.0240.4180.3570.455<0.0010.024
Quadratic0.0800.0140.101<0.0010.0040.0580.0670.6910.3970.064<0.0010.057
1 SEM: standard error of means. 2 Contrast-actual alfalfa proportion: linear and quadratic polynomial contrasts for actual alfalfa proportion. 3 Contrast-N level: linear and quadratic polynomial contrasts for N levels.
Table 5. Metabolizable energy (ME) and in vitro fermentation characteristics of orchardgrass and alfalfa silage mixtures in the first and second cut.
N Level
(kg/ha)
Actual Alfalfa Proportion (%)ME
(MJ/kg DM)
Ammonia N
(mmol/L)
tVFAs 1
(mmol/L)
Acetate
(mmol/L)
Propionate
(mmol/L)
Butyrate
(mmol/L)
Isobutyrate
(mmol/L)
First
Cut
Second
Cut
First
Cut
Second
Cut
First
Cut
Second
Cut
First
Cut
Second
Cut
First
Cut
Second
Cut
First
Cut
Second
Cut
First
Cut
Second
Cut
First
Cut
Second
Cut
00010.210.061.926.290.272.351.642.620.918.411.07.532.370.83
463610.510.265.827.594.978.652.146.223.318.810.28.732.531.06
685510.710.562.731.695.575.154.245.122.517.111.08.382.540.96
807710.910.674.834.195.380.854.849.121.518.310.68.422.531.03
10010010.910.769.733.196.778.055.449.222.216.510.57.412.660.96
500010.29.9961.730.192.772.353.842.322.318.510.86.552.340.75
294410.310.270.831.794.771.251.742.824.817.09.906.462.440.89
575710.810.567.133.494.582.652.943.322.720.410.38.792.401.05
786810.910.569.333.495.177.754.246.020.918.910.37.932.380.96
10010010.910.774.936.496.278.154.147.722.716.810.48.412.541.05
1000010.39.8864.027.893.172.853.942.222.218.411.07.462.370.86
272810.510.170.330.394.575.654.644.624.418.611.48.092.611.00
505710.810.465.731.494.770.854.243.320.815.79.797.642.360.84
716810.810.568.834.396.973.856.946.522.914.711.16.922.590.82
10010010.810.673.533.396.974.855.945.922.715.710.78.722.600.91
SEM 20.040.0410.750.970.360.750.330.460.210.330.0850.1510.0230.020
Contrast-actual alfalfa proportion 3
Linear<0.001<0.001<0.001<0.0010.0170.0100.008<0.0010.6220.0170.1910.0230.0050.130
Quadratic<0.001<0.001<0.001<0.0010.0590.0240.023<0.0010.2450.0200.4280.0480.0200.016
Contrast-N level 4
Linear0.9050.3330.4310.5390.0560.0020.0680.0060.3120.0830.4550.2180.7260.009
Quadratic0.9800.6030.6000.2280.0830.0080.0630.0250.4700.0210.4200.2640.1470.025
1 tVFAs: total volatile fatty acids. 2 SEM: standard error of means. 3 Contrast-actual alfalfa proportion: linear and quadratic polynomial contrasts for actual alfalfa proportion. 4 Contrast-N level: linear and quadratic polynomial contrasts for N levels.
Table 6. Volatile fatty acids and fermentative gases emissions of orchardgrass and alfalfa silage mixtures in the first and second cut.
N Level
(kg/ha)
Actual Alfalfa Proportion (%)Valerate
(mmol/L)
Isovalerate
(mmol/L)
Acetate/PropionatepHCarbon Dioxide
(mmol/L)
Methane
(mmol/L)
Recovery Hydrogen
(%)
First
Cut
Second
Cut
First
Cut
Second
Cut
First
Cut
Second
Cut
First
Cut
Second
Cut
First
Cut
Second
Cut
First
Cut
Second
Cut
First
Cut
Second
Cut
First
Cut
Second
Cut
0001.981.532.981.452.482.346.626.7346.637.221.617.186.087.3
46362.291.782.982.022.242.466.616.7347.740.921.219.186.086.7
68552.251.832.981.812.412.796.616.7649.339.422.619.086.186.8
80772.291.943.052.022.562.756.646.7648.241.822.920.486.086.8
1001002.311.943.152.022.513.016.676.7549.739.923.220.686.086.6
50001.771.372.581.412.422.296.596.7047.335.622.016.686.687.3
29442.391.613.081.702.092.536.626.7049.435.321.117.286.086.8
57572.091.962.842.032.342.376.626.7347.542.421.719.686.286.7
78682.102.022.861.972.602.446.666.7547.239.622.618.786.286.6
1001002.492.073.472.072.402.856.706.7649.240.722.520.285.686.5
100002.271.512.891.502.442.306.656.7148.536.922.416.986.287.2
27282.491.623.181.822.262.406.626.7450.139.122.318.285.986.9
50571.961.702.711.572.602.766.706.7347.037.022.618.286.487.0
71682.461.703.151.682.503.186.636.7651.337.323.919.786.186.9
1001002.581.613.141.932.473.136.676.8050.239.923.319.885.986.8
SEM 10.0400.0380.0450.0400.0270.0570.0270.0080.0070.4280.1590.2310.0500.048
Contrast-actual alfalfa proportion 2
Linear0.007<0.0010.022<0.0010.081<0.0010.0120.0030.019<0.0010.003<0.0010.063<0.001
Quadratic0.028<0.0010.051<0.0010.101<0.0010.0260.0120.0630.0020.007<0.0010.149<0.001
Contrast-N level 3
Linear0.1770.0160.9240.0020.8340.6110.1860.8930.0680.0090.1400.0530.6900.015
Quadratic0.1460.0300.8570.0080.3760.0560.4070.3490.0690.0340.0580.0580.8470.036
1 SEM: standard error of means. 2 Contrast-actual alfalfa proportion: linear and quadratic polynomial contrasts for actual alfalfa proportion. 3 Contrast-N level: linear and quadratic polynomial contrasts for N levels.

