Spatio-Temporal Evolution of Urban Morphology in the Yangtze River Middle Reaches Megalopolis, China


1
School of Environmental Science and Engineering, Huazhong University of Science and Technology, Wuhan 430074, China
2
Chief Engineer Office, Tinystep Geospacial Information Technologies Co., Ltd, Wuhan 430070, China
3
Branch of Wuhan, Southgis Technologies Co., Ltd., Guangzhou 510665, China
4
Environmental Change Institute, University of Oxford, Oxford OX1 4BH, UK
*
Author to whom correspondence should be addressed.
Sustainability 2020, 12(5), 1738; https://doi.org/10.3390/su12051738
Submission received: 15 January 2020
/
Revised: 14 February 2020
/
Accepted: 21 February 2020
/
Published: 26 February 2020
(This article belongs to the Section Sustainable Urban and Rural Development)
Abstract
:The Yangtze River Middle Reaches Megalopolis (YRMRM) is the primary urban cluster in central China, which is of vital ecological and economic importance over the Yangtze River basin. To fill the gap on updated evidence needed to support sustainable spatial planning and development in the YRMRM, we systematically characterise its urban spatial patterns and analyse their changes from 2000 to 2015 from two levels. At the regional level, landscape indices are used to depict urban morphology from four aspects, including fragmentation, complexity, contiguity and dispersion. At the local level, spatial autocorrelation analysis is conducted to detect whether the urban morphological patterns, as described by the four landscape indices, are clustered locally. The results showed an increasingly accelerated urban expansion in the YRMRM (approximately 250 km−2/a), contributed mainly by agricultural land conversion (60–80%, depending on subdivisions). An uneven spatial development pattern is identified in the three key metropolitan areas in the YRMRM. The Wuhan Metropolitan Area develops in a continuous and less fragmented fashion, with increased shape complexity and local dispersion. The spatial pattern of the Changsha-Zhuzhou-Xiangtan Metropolitan Area seems to be increasingly fragmented, complex and dispersed. The spatial development pattern in the Poyang Lake Metropolitan Area is overall continuous with an increasingly complex shape and severe local dispersion. Using landscape indices as indicators of sustainability, we discuss the potential environmental and climatic challenges in the YRMRM and the three metropolitan areas. Our results could help to raise awareness and concern for well-targeted management and planning in specific areas.
1. Introduction
Exploring the patterns of land-use/cover change (LUCC) is regarded as an efficient way to understand the earth’s surface change owing to anthropogenic activities [1]. The sustainable management of LUCC could improve the supply of ecosystem services, such as supporting biodiversity, regulating global warming, supplying foods stably, purifying air, etc. [2,3,4,5]. These potential benefits have made understanding the evolution of LUCC a core topic for environmental management and regional planning [6].
With rapid economic development and population growth, China has experienced dramatic LUCC over the past few decades [7]. Urbanisation in modern China began after the Reform and Open-Door Policy in 1978 then accelerated tremendously after Deng Xiaoping’s Southern Tour in 1992 [8]. As of 2017, 8.13 × 10⁸ people live in cities and towns, accounting for 58.52% of the total population according to China’s Statistical Yearbook of 2018. On the one hand, rapid and uncontrolled urbanisation is often accompanied by negative environmental impacts, such as habitat destruction (other land conversions into construction land), biodiversity loss, and change of water cycle (an increase of impervious surface). On the other hand, it may cause socioeconomic problems like traffic congestion, inefficient use of energy, and disturbance to rural economic stability and lifestyle. Besides, the urban area is where climate change challenges the comfort and security of human living. Reasonable spatial urban planning can avoid these problems and create a more resilient city. Smith et al. [9] argued that better designed urban spaces could improve sustainability and the quality of life in a warming climate. Thus, urban morphology must be monitored and controlled for cities striving for their sustainable development goals [10,11]. A comprehensive understanding of the spatio-temporal changes in urban land cover is the prerequisite for the next-step analysis of their consequences on the ecosystem and living environment.
Spatio-temporal dynamics of urban land cover can be depicted by remote sensing images and characterised by landscape indices [12,13,14]. Landscape indices quantify various aspects of the spatial form of land cover (i.e., fragmentation, shape complexity, dispersion, etc.) at three levels, namely, the patch (each patch in the landscape), class (each class of land cover in the landscape) and landscape (landscape as a whole) levels [15]. Numerous studies have applied landscape indices to investigate changes in urban land cover at various scales and details [16,17]. Gao et al. [18] used patch density and mean patch size indices to measure the rate and fragmentation of urbanisation in Shanghai, China. Zhang et al. [19] used the mean perimeter-to-area ratio as an indicator to study the association between the climate and urban land-cover changes in the north USA. Irwin et al. [20] used indices of contiguity (contrasting edge ratio/proportion) and dispersion (mean dispersion) to investigate the dynamics and extent of land-use change in a rapidly urbanised region in Maryland, USA. Sometimes, landscape indices can be viewed as single values of global measures and, thus, cannot adequately grasp the details on spatial heterogeneity for various parts on the local scale. Local indicators of spatial association (LISA) have been widely used to examine the extent and intensity of a variable’s spatial dependence [21]. Compared with global spatial autocorrelation measures that may underrepresent the spatial clustering nature, which varies locally, LISA measures focus on variations within the patterns of spatial dependence and, thus, have the potential to uncover discrete and local spatial regimes [22,23,24]. While the existing studies remain somewhat limited, the local-level characterisation of the dynamics of urban land-cover change is required to uncover the unevenness of urban development and raise awareness and concern for the need of better urban management and planning in specific areas.
The region of the Yangtze River Middle Reaches Megalopolis (YRMRM) is an integral part of China. The study area, the YRMRM, covers three key metropolitan areas in central China, i.e., the Wuhan Metropolitan Area (WHM), the Changsha-Zhuzhou-Xiangtan Metropolitan Area (CZT) and the Poyang Lake Metropolitan Area (PLM). As some national policies have been acted and implemented, such as the strategy of the Rise of Central China and the development of the Yangtze River Economic Zone, this region has become one of the most important economic growth poles in China, as well as been accompanied by intense land-use and land-cover change over the past decades [25]. As of 2018, China committed to protecting ecosystems in the Yangtze River basin. It thus raised challenges to local governments to design economic development strategies towards a green and sustainable fashion. Landscape indices, as a tool for sustainability assessment, can reflect the intensity of land use and the magnitude of the deviation from the potential natural vegetation caused by human activities [26]. A large number of studies on landscape patterns focused on developed Chinese metropolises [27], such as Shanghai [28] and Beijing [29], however, there has been little empirical evidence on the patterns of the urban landscape in central China [30].
The research questions this study aims to address are: (i) What are the land-cover sources of urban expansion over the YRMRM region and the three local metropolitan areas, i.e., WHM, CZT and PLM? (ii) What are the spatial characteristics of urban morphological changes, in terms of changes in fragmentation, complexity, contiguity and dispersion? (iii) Is there any spatial dependency on urban morphological changes at the local scale? This study could provide detailed information on recent trends in the spatial development of a region of vital ecological and economic importance in China. It could also shed light on the extent to which landscape indices and spatial autocorrelation indices could distinguish the urban morphological changes at the regional and local levels.
2. Materials and Methods
2.1. Study Area
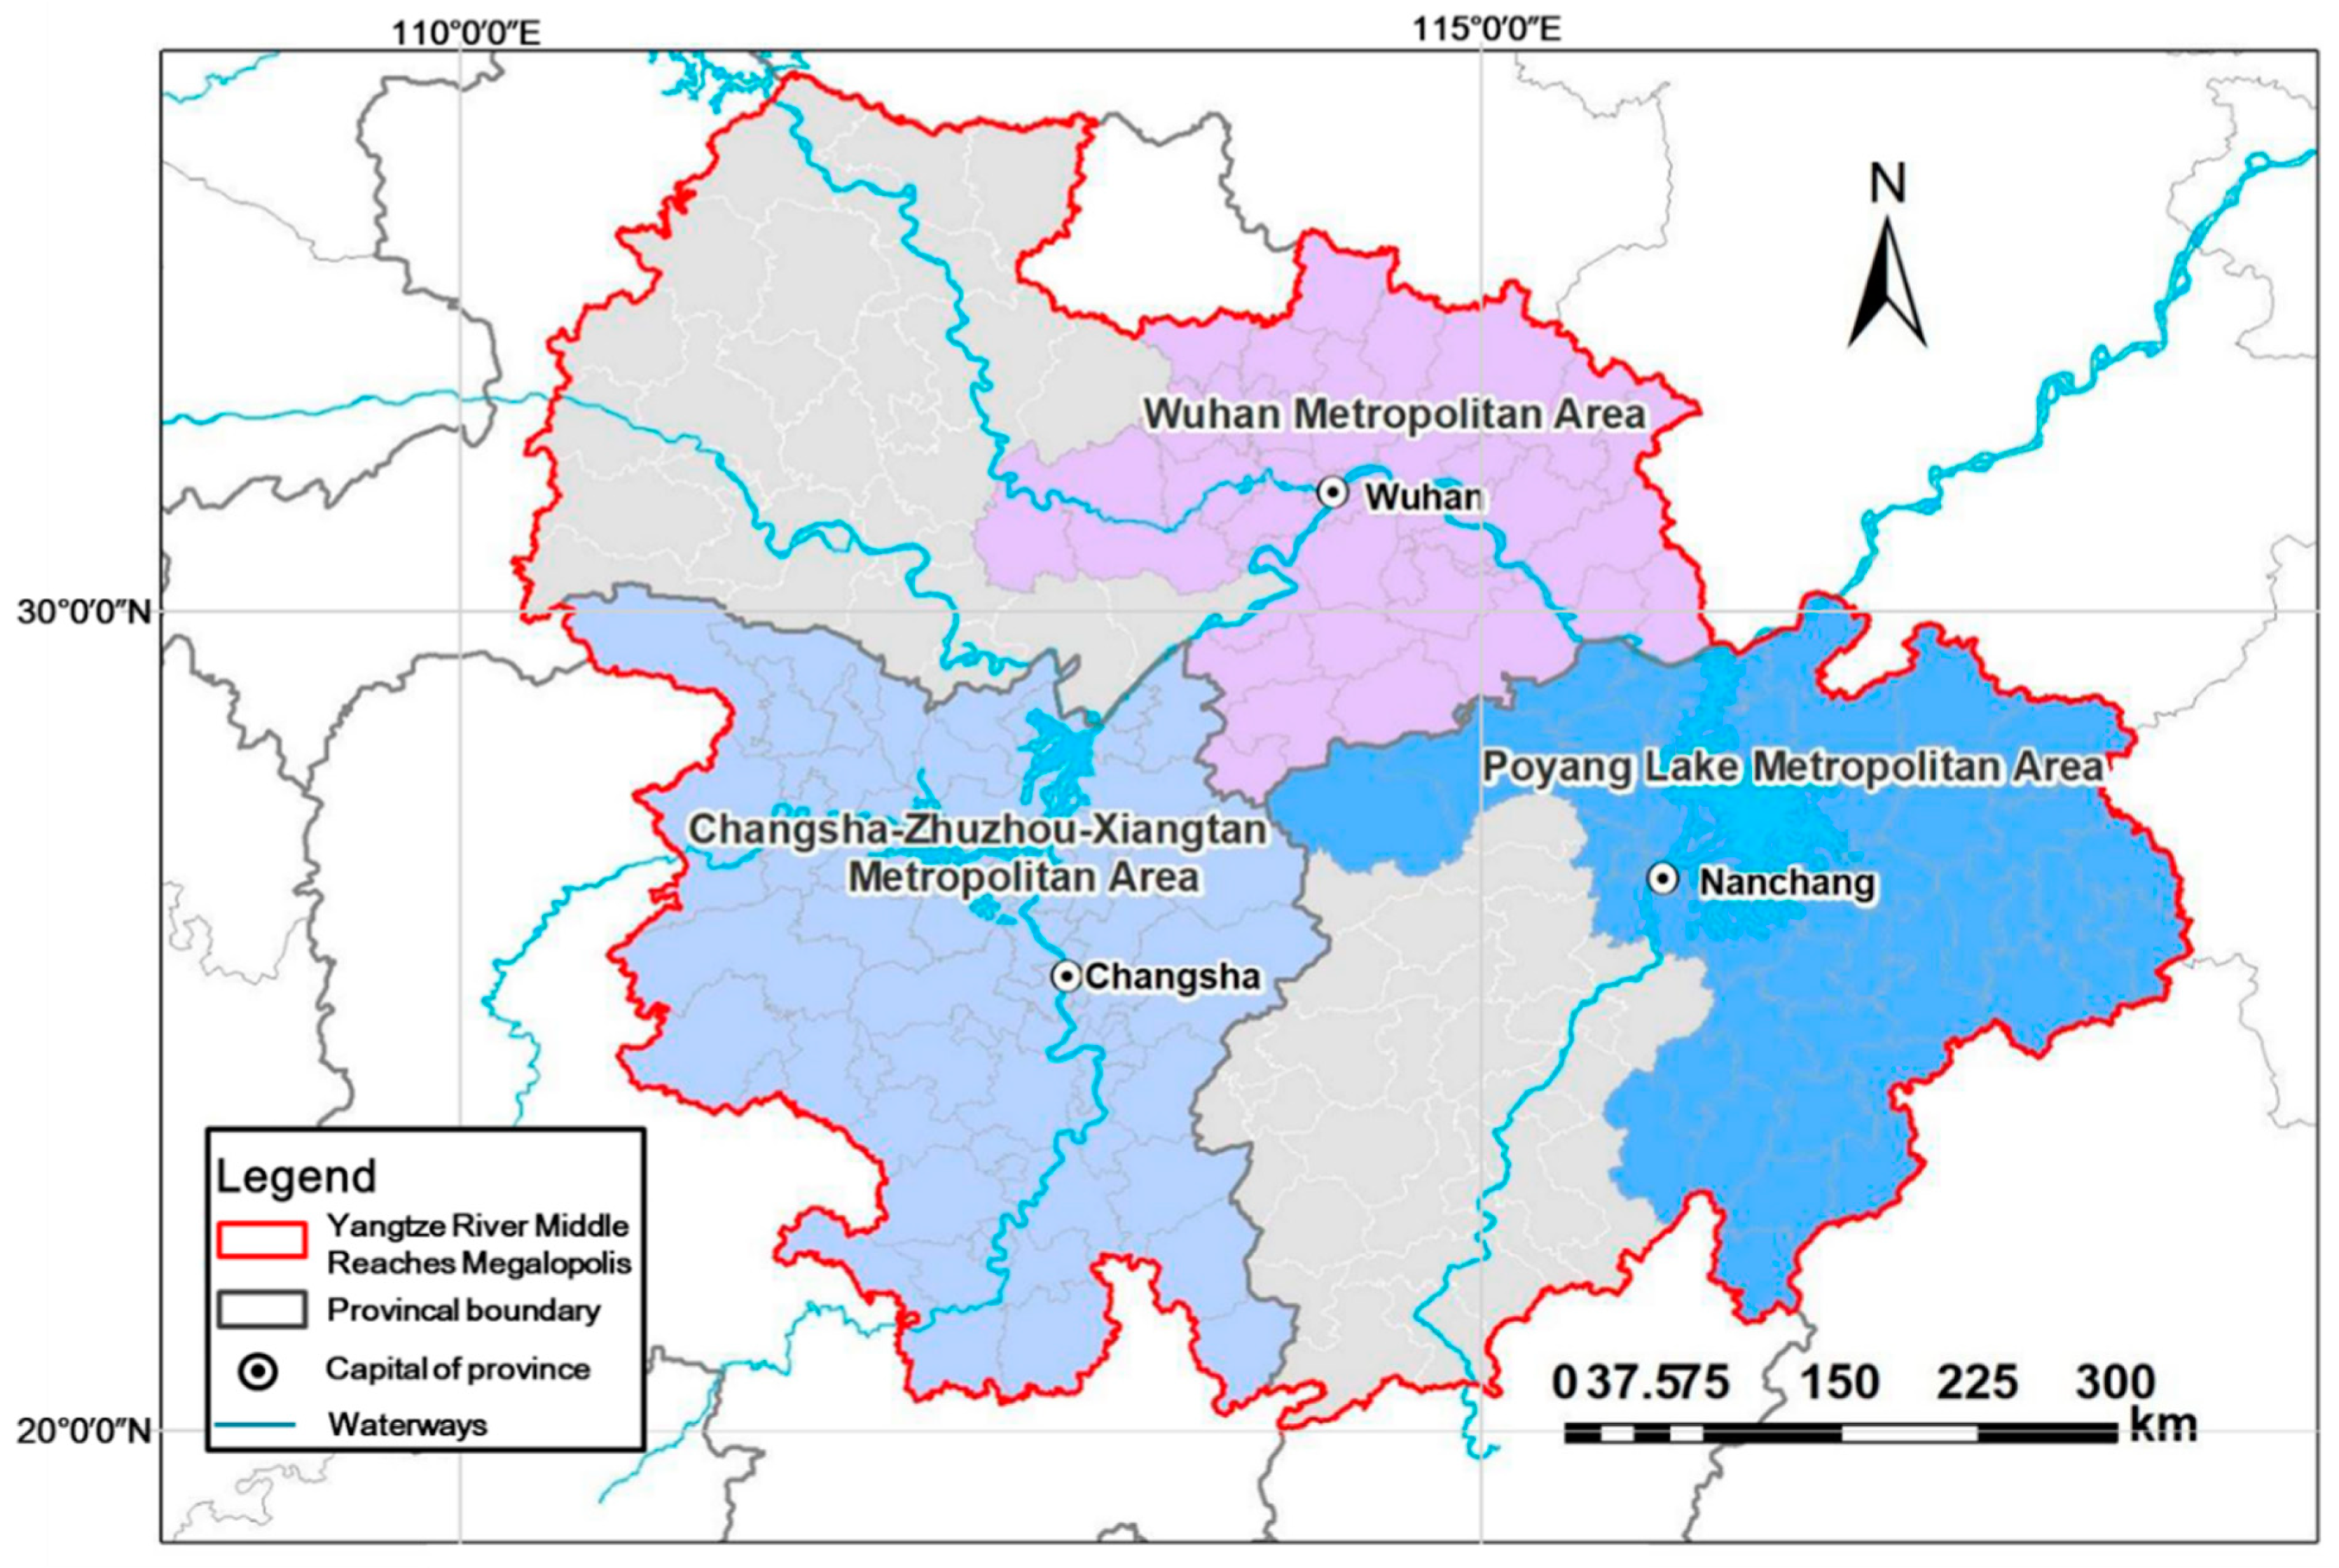
The extent of the YRMRM (Figure 1) is 3.261 × 10⁵ km2, accounting for 3.4% of the total area of China. The region is composed of 229 county-level divisions (including counties, county-level cities, prefectural districts and forestry districts) under 28 prefecture-level cities. As of 2017, the region had 1.25 × 10⁸ residents (9.0% of China’s population) and a GDP of 7.9 × 10¹² Chinese Yuan (9.6% of China’s GDP). It lies in the subtropical monsoon climatic zone of China, and its rural areas are mostly mountainous and hilly. Moreover, the infrastructure conditions in this region are superior, while the urbanisation rate of the permanent population exceeded 55% in 2014. The YRMRM consists of three urban clusters. Wuhan in Hubei province is the central city, which leads the development in central China. Our study selected the county-level administration units as landscape area, which was the most suitable unit in the study area, considering the total area and situation of China.
2.2. Data Preparation and Processing
The LUCC datasets (30m resolution) used in this study were provided by the Data Centre for Resources and Environmental Sciences (http://www.resdc.cn), Chinese Academy of Sciences (RESDC). Having been produced, quality-controlled, and managed by experienced scientists, the datasets are one of the most commonly used LUCC data products in China. They included 25 types of land uses distinguished based on Landsat images. The steps of data processing and reliability checking were detailed in Xu et al. [31]. The present study analysed the built-up land-use type, which contained urban land, rural land and industrial land (including factories, large industrial sites, mines, oilfields, salterns, quarries, etc.). The overall identification accuracy of the 25 land-use types was above 91% [32], with 98% for the built-up land-use types [33]. The administrative boundary data were acquired from the National Catalogue Service for Geographic Information (http://www.webmap.cn), Ministry of Natural Resources, China. The county-level divisions were selected as the analytical unit because they were at the most suitable administrative level in China where planning decisions were made. All the data preparation, processing and analytical steps were conducted with ArcGIS (version 10.5).
2.3. Characterisation of Urban Land Expansion
LUCC datasets for the years 2000, 2005, 2010 and 2015 were used to analyse the extent to which urban areas were expanded over the YRMRM. The RESDC adopts such a five-year interval to update this data product. A long-term timescale (e.g., five-year, decadal or longer) is often required when developing adaptive land-use strategies and establishing urban infrastructure projects [34,35]. The sources of land being converted into the urban areas were further summarised for each county-level division in the region’s three major metropolitan areas, i.e., WMA, CZT and PLM. By investigating land-use dynamics in each five-year interval, we analysed the consistency in the rate and origins of urban land expansion.
2.4. Landscape Indices for Regional Urban Changes
To characterise changes in the spatial patterns of urban development, we used six landscape indices to depict the size, shape, spatial arrangement and complexities of urban patches at patch and landscape levels (see definition and equations in Table 1). While these indices are amongst the most widely applied measures of urban morphological studies [27,31], we further examined their usefulness in the study area. Patch density (PD, 1/km2) and mean patch size (MPS, km2) could reflect the fragmentation of urban areas in a county-level division, with higher PD and smaller MPS indicating a severer fragmented pattern. Mean perimeter-to-area ratio (MPAR, km/km2) depicted the overall shape complexity of urban patches and a higher value referred to greater complexity. Contrasting edge ratio and proportion (CER and CEP) were similar indices to measure the interspersion of urban land use against non-urban land use. With smaller CER and CEP values, the urban area was more likely to expand in a spatially contiguous manner. Mean dispersion (MD) described the proportion of non-urban cells within a given neighbourhood (e.g., 1km) of an urban cell. A higher MD indicated greater urban dispersion or sprawl.
2.5. Spatial Autocorrelation Analysis of Local Morphological Changes
Absolute change in each of the six landscape indices between 2000 and 2015 was tested with the local Moran’s I to examine whether and to which extent spatial autocorrelation existed. The local Moran’s I statistic was used as the local indicators of spatial association (LISA) to assess the degree of dependency between each division and its neighbouring divisions [21]. The local Moran’s I was calculated as:
where is the deviation of element i from its average value, is the weight of elements i and j, n is the number of elements and S0 is the aggregation of all spatial weights.
LISA could identify four types of spatial clusters based on local Moran’s I statistics. The High-High (H-H) clusters, or hot spots, referred to the divisions with high levels of change in one landscape index surrounded by divisions with high levels of change in the same landscape index. The Low-Low (L-L) clusters, or cold spots, indicated that the divisions with low levels of change in one landscape index were surrounded by divisions with low levels of change. Spatial outliers, including the Low-High (L-H) and High-Low (H-L) clusters, represented that divisions with low or high levels of landscape indices change were found in neighbourhood composites of divisions with high or low levels of change. Thus, the LISA analysis helped to identify and compare the spatial clustering of the local spatial development patterns, as measured by the changes in each of the selected landscape indices, over the YRMRM region between 2000 and 2015.
3. Results
3.1. Land-Use and Land-Cover Change in the Yangtze River Middle Reaches Megalopolis
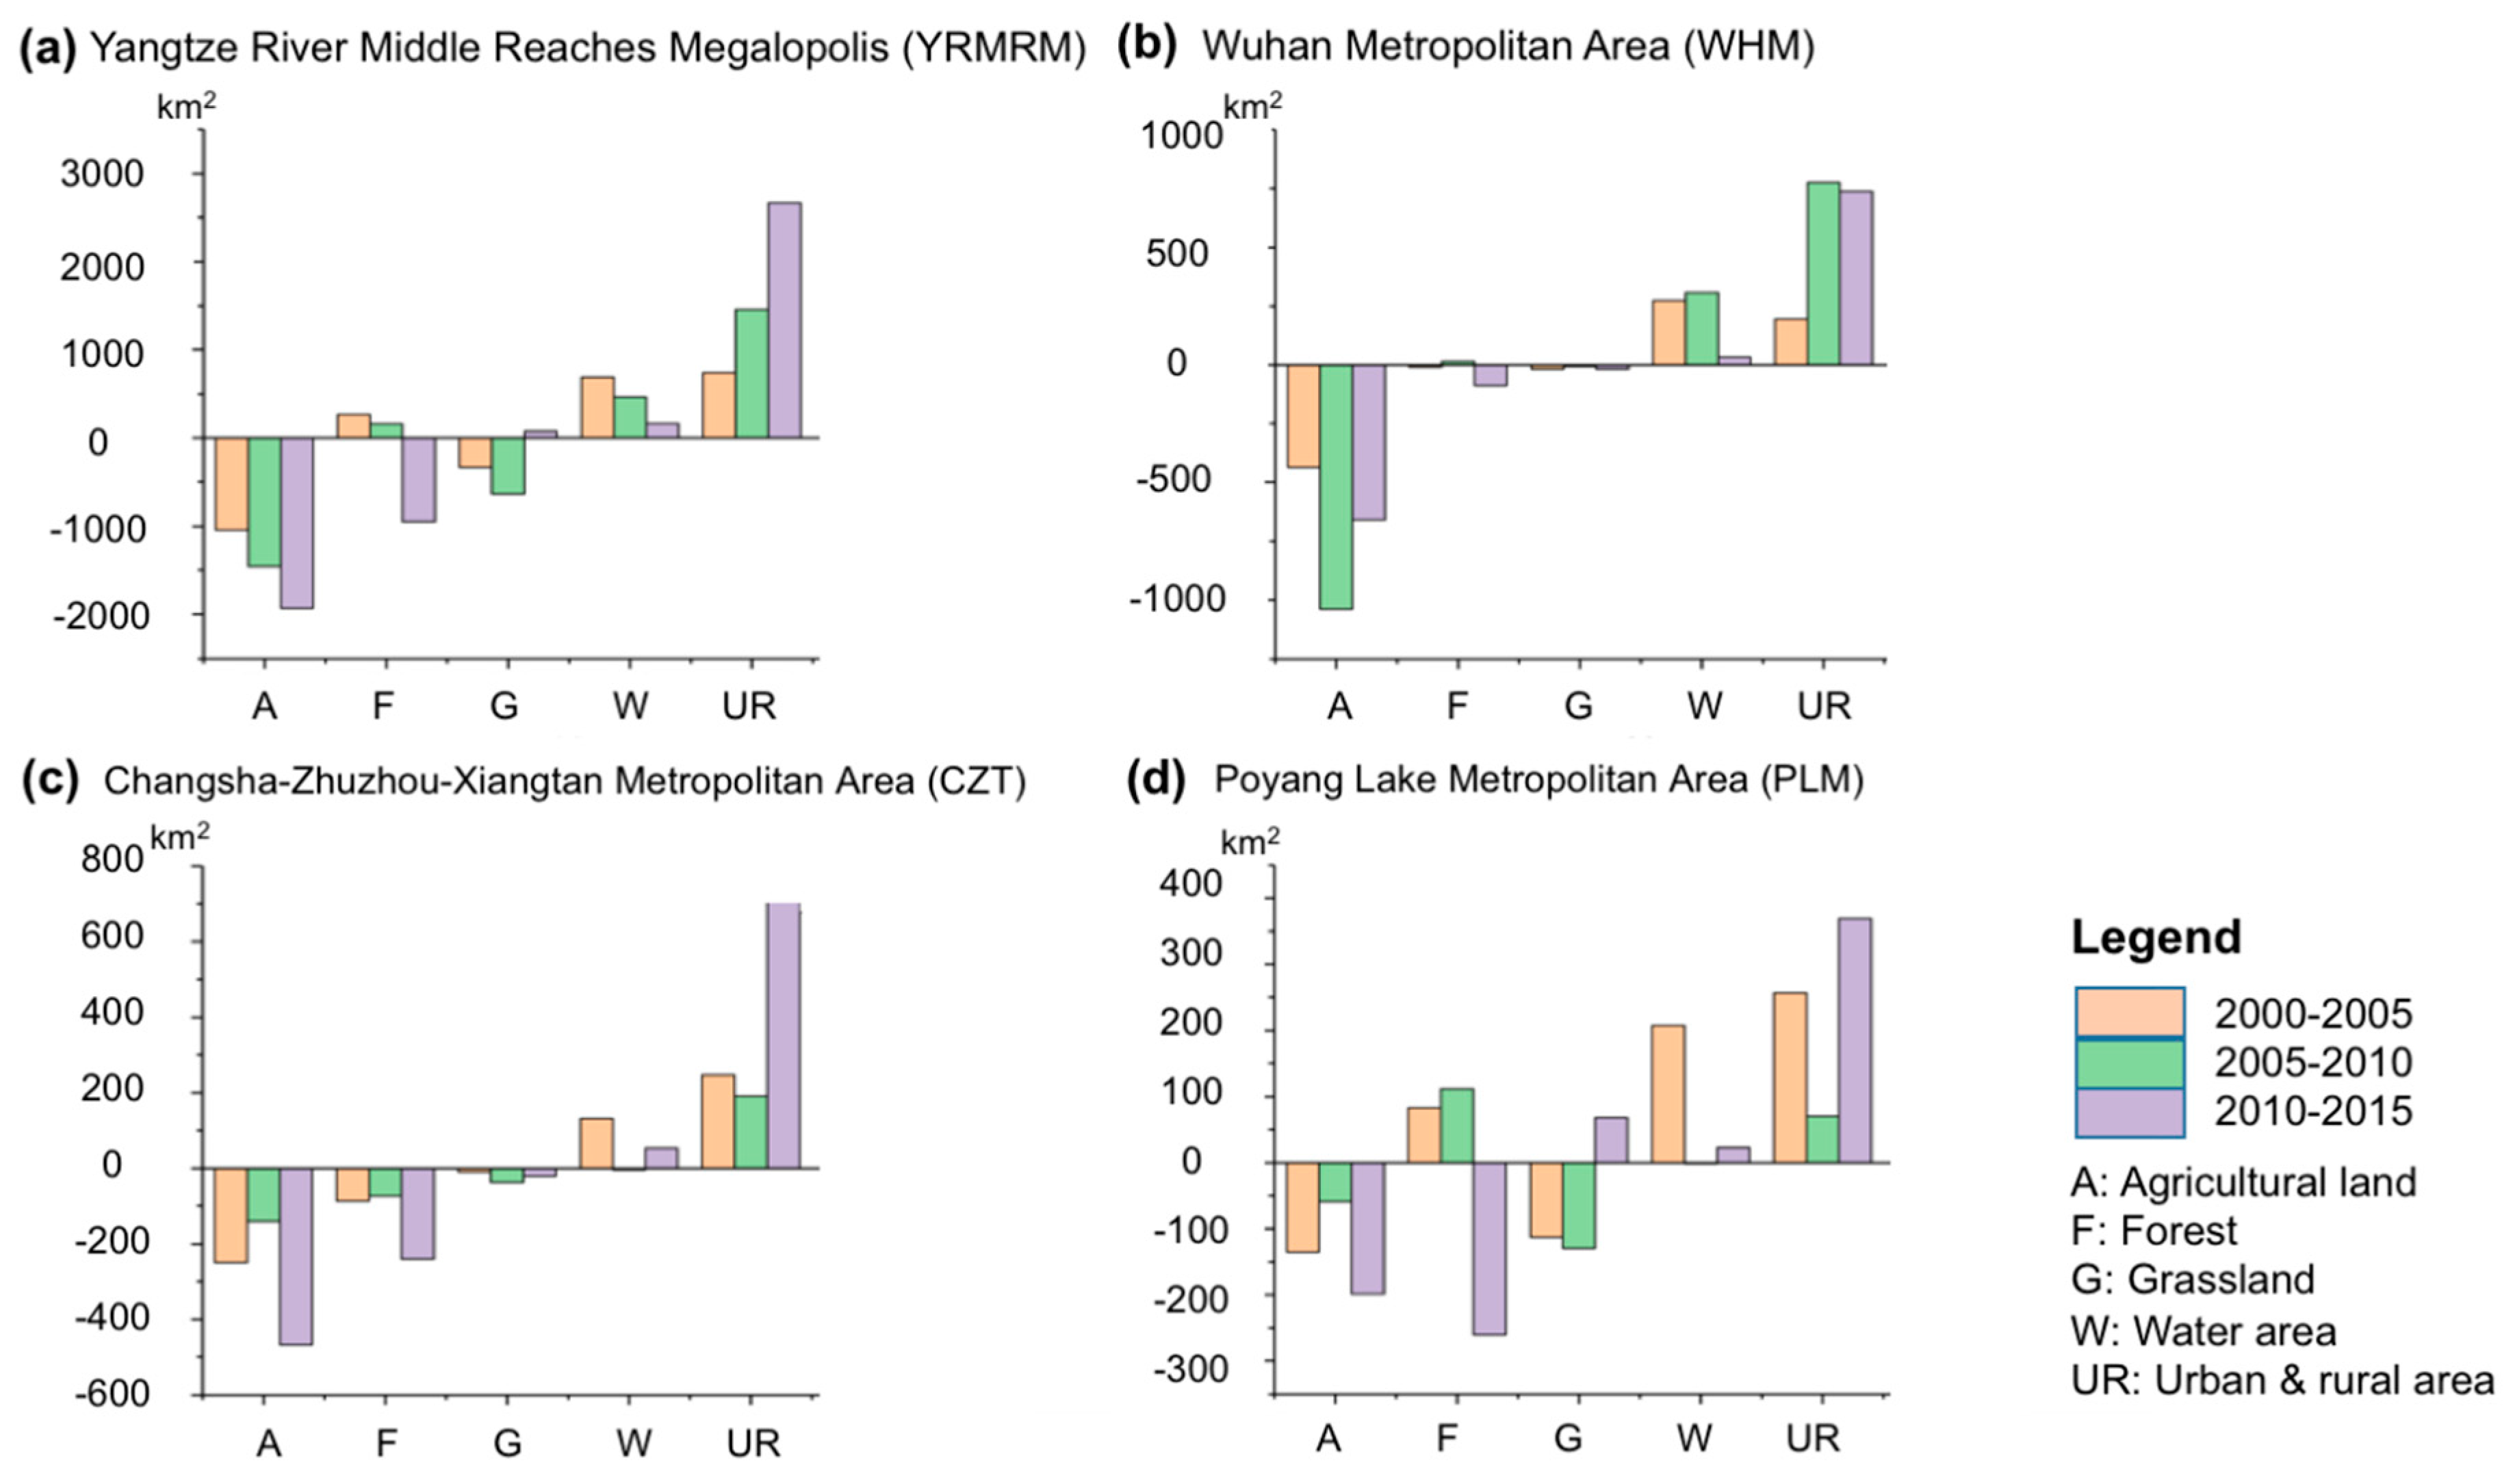
We found that urban expansion and agricultural shrinkage were the major processes driving the dynamics of a rapid LUCC between 2000 and 2015 in the YRMRM (Figure 2). An increasingly accelerated urban expansion was observed, with gained extents of 696.96 km2 from 2000 to 2005, 1239.58 km2 from 2005 to 2010 and 1811.80 km2 from 2010 to 2015. As of 2015, the urban area occupied 2.73% of the whole of the YRMRM, and 4.41%, 1.98% and 0.57% of WHM, CZT and PLM, respectively. Such an increasing pattern was found to be primarily contributed by local urban expansion in WHM between 2000 and 2005 (194.82 km2), and between 2005 and 2010 (775.26 km2), and by both WHM and CZT between 2010 and 2015 (737.55 km2 and 705.28 km2). The decrease in agricultural land was significantly and continuously worsened at the three five-year intervals, with reductions of 820.17 km2, 1239.58 km2 and 1325.83 km2, respectively. WHM was found to have severer agricultural shrinkage (by 2134.34 km2) than CZT (by 858.44 km2) and PLM (by 392.81 km2). Deforestation was observed between 2010 and 2015 (by 586.80 km2), which was found to be mostly contributed by CZT (400.66 km2) and WHM (80.84 km2). The water surface was found to have increased in WHM (by 614.17 km2), CZT (by 180.29 km2) and PLM (by 229.67 km2) from 2000 to 2015, suggesting the successful restoration and conservation of water resources (because of the “Returning Farmland to Lake” practices and protection of wetlands) in this ecologically important region.
3.2. Composition of Land Being Converted to Urban Area
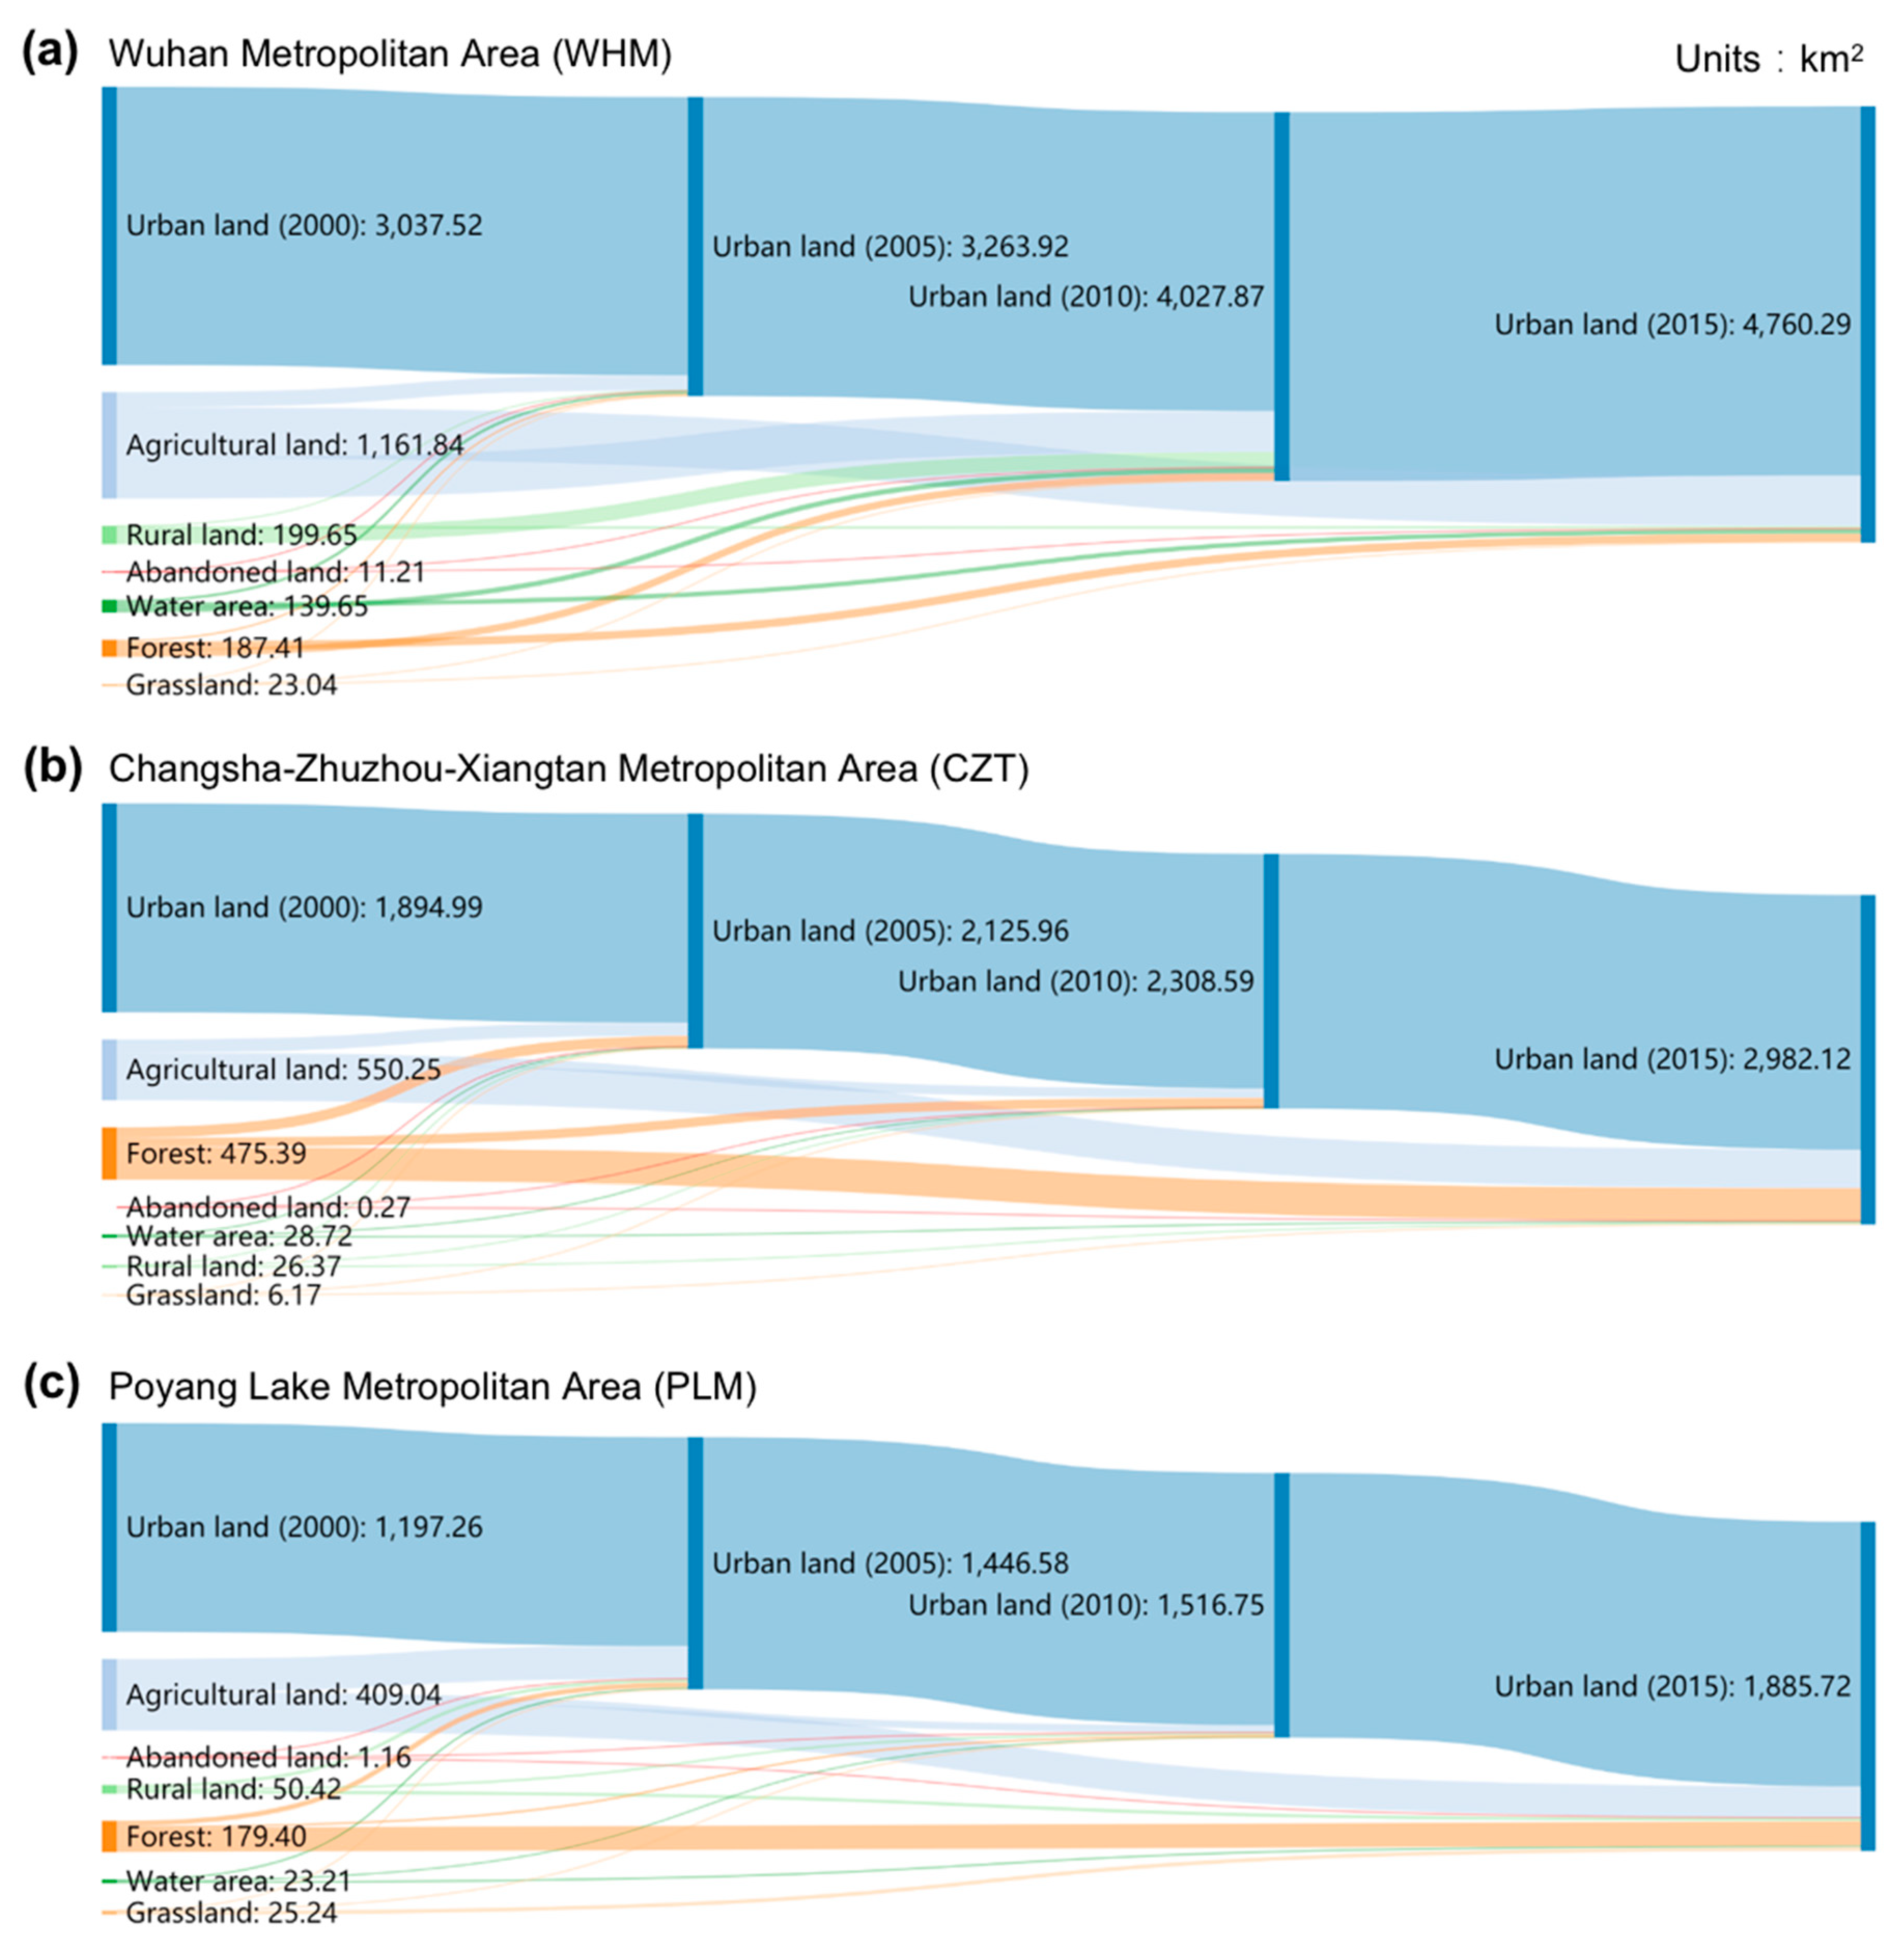
Among the three metropolitan areas, WHM had the highest rate of urban expansion consistently over the three five-year intervals, with the urban area being increased by 7.45% from 2000 to 2005, 23.4% from 2005 to 2010 and 18.18% from 2010 to 2015 (Figure 3). In CZT and PLM, the urban expansion was low in the first two five-year intervals (230.97 km2, 249.32 km2), while dramatically amplified in the third interval to 673.53 km2 and 368.97 km2, respectively. From 2000 to 2015, the increase in the urban area in WHM (1722.77 km2) was primarily converted from agricultural land (67.44%), followed by rural area (11.59%), forest (10.88%) and water area (8.11%) to a limited extent. In CZT, a similar extent of agricultural land (550.25 km2) and forest (475.39 km2) were converted to urban area, which contributed to the 94.34% of the total urban land conversion. Similarly, in PLM, where urban area expanded at a relatively slow speed, the majority of the gained urban area (85.47%) originated from agricultural land (409 km2) and forest (180 km2).
3.3. Spatial Characteristics of Regional Urban Developments
The spatial features of the three metropolitan areas were found to have changed towards different directions from 2000 to 2015 (Figure 4).
- (i)
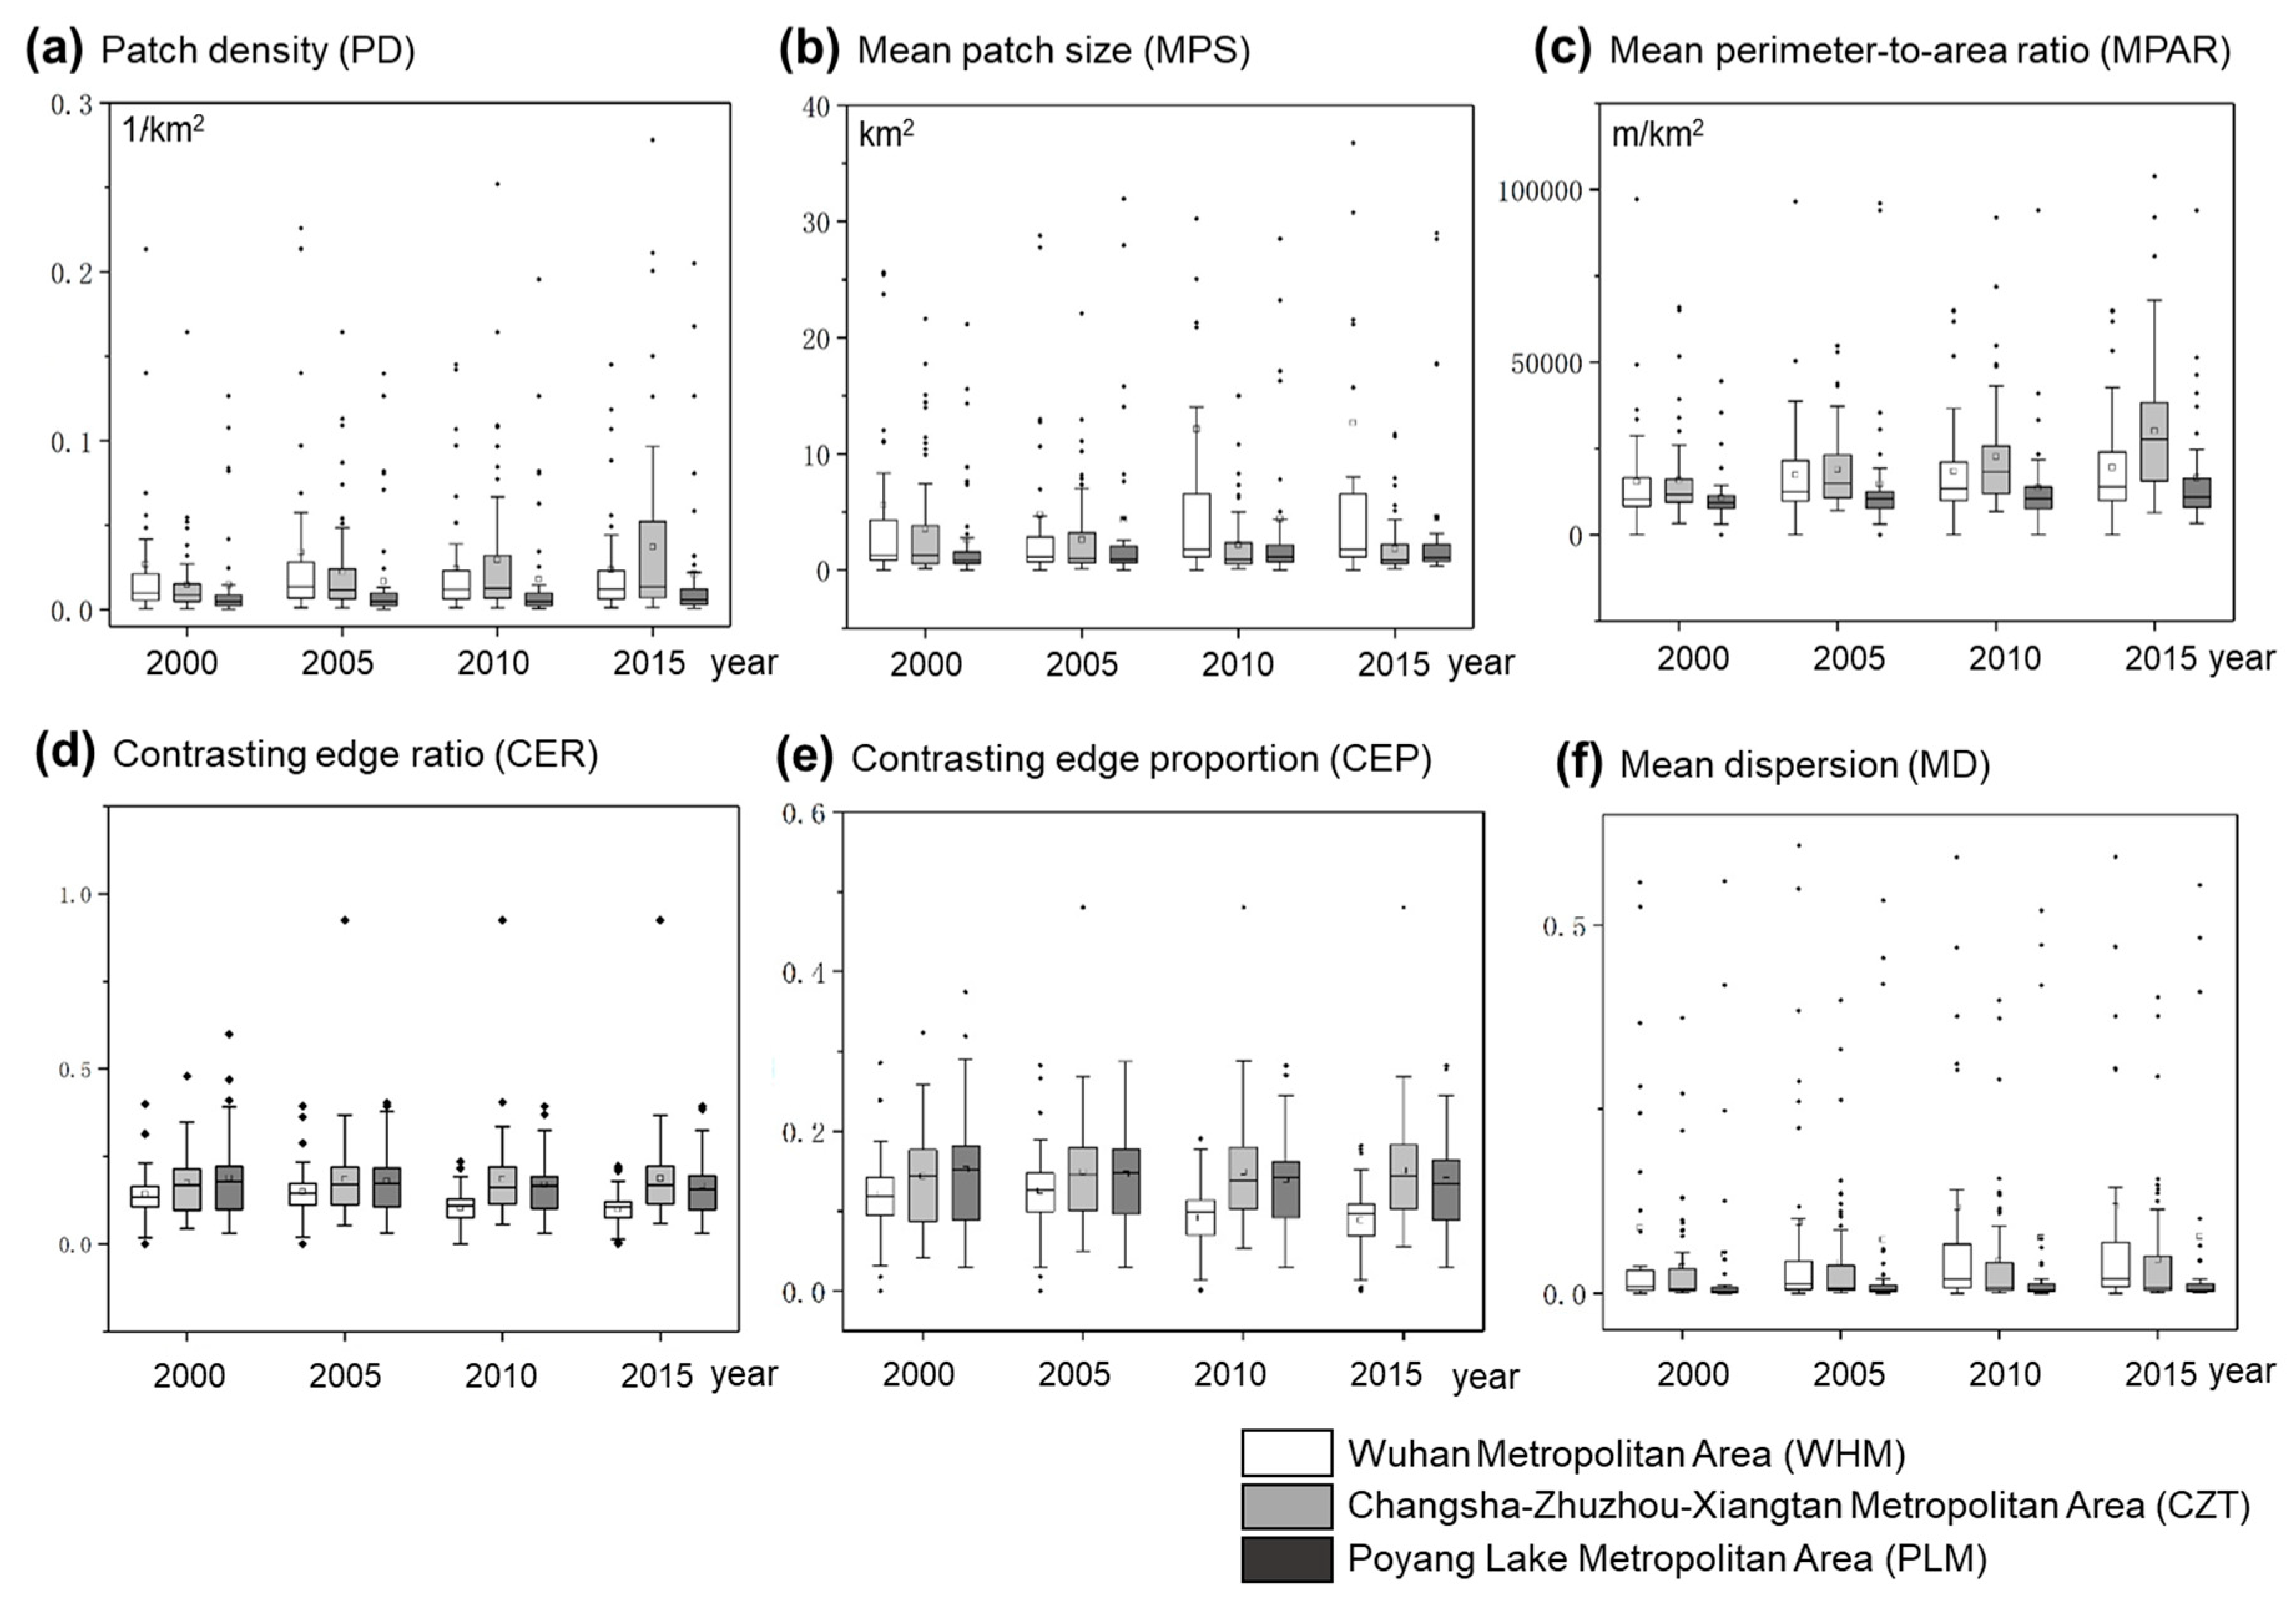
- Fragmentation: Urban areas in WHM were expanded in a less fragmented fashion. A slightly reduced patch density (PD, by 11.56%) with increased mean patch size (MPS, by 128.88%) suggested the likely expanding and merging of existing urban patches. CZT, however, experienced increasingly severe urban land fragmentation in which new and small urban patches might have emerged over the area, leading to increased PD (by 149.66%) and decreased MPS (by 48.16%). The urban fragmentation pattern in PLM seemed to change only marginally.
- (ii)
- Complexity: Shape complexity, as measured by the mean perimeter-to-area ratio (MPAR), was found to have increased in all three metropolitan areas, with CZT having the greatest urban shape complexity in 2015 (30,076.13 m/km2), followed by WHM (19,480.30 m/km2) and PLM (16,455.69 m/km2).
- (iii)
- Contiguity: Urban expansion in WHM and PLM was found to follow a continuous way by which both contrasting edge ratio and proportion decreased (i.e., CER and CEP decreased by 30.08% and 26.96% in WHM and by 16.67% and 9.17% in PLM). This indicated that new urban areas were often built adjacent to the existing urban developments in these areas. CZT, however, did not show an obvious change in the contiguity of urban spatial development.
- (iv)
- Dispersion: Urban developments were found to be increasingly dispersed in WHM, CZT and PLM, with mean dispersion (MD) increased by 31.89%, 27.84% and 46.56%, respectively. MD measured sprawl within a 1km neighbourhood. This indicated that small-scale leapfrogging and scattered urban developments were occurring more frequently.
3.4. Spatial Dependency of Local Urban Spatial Development
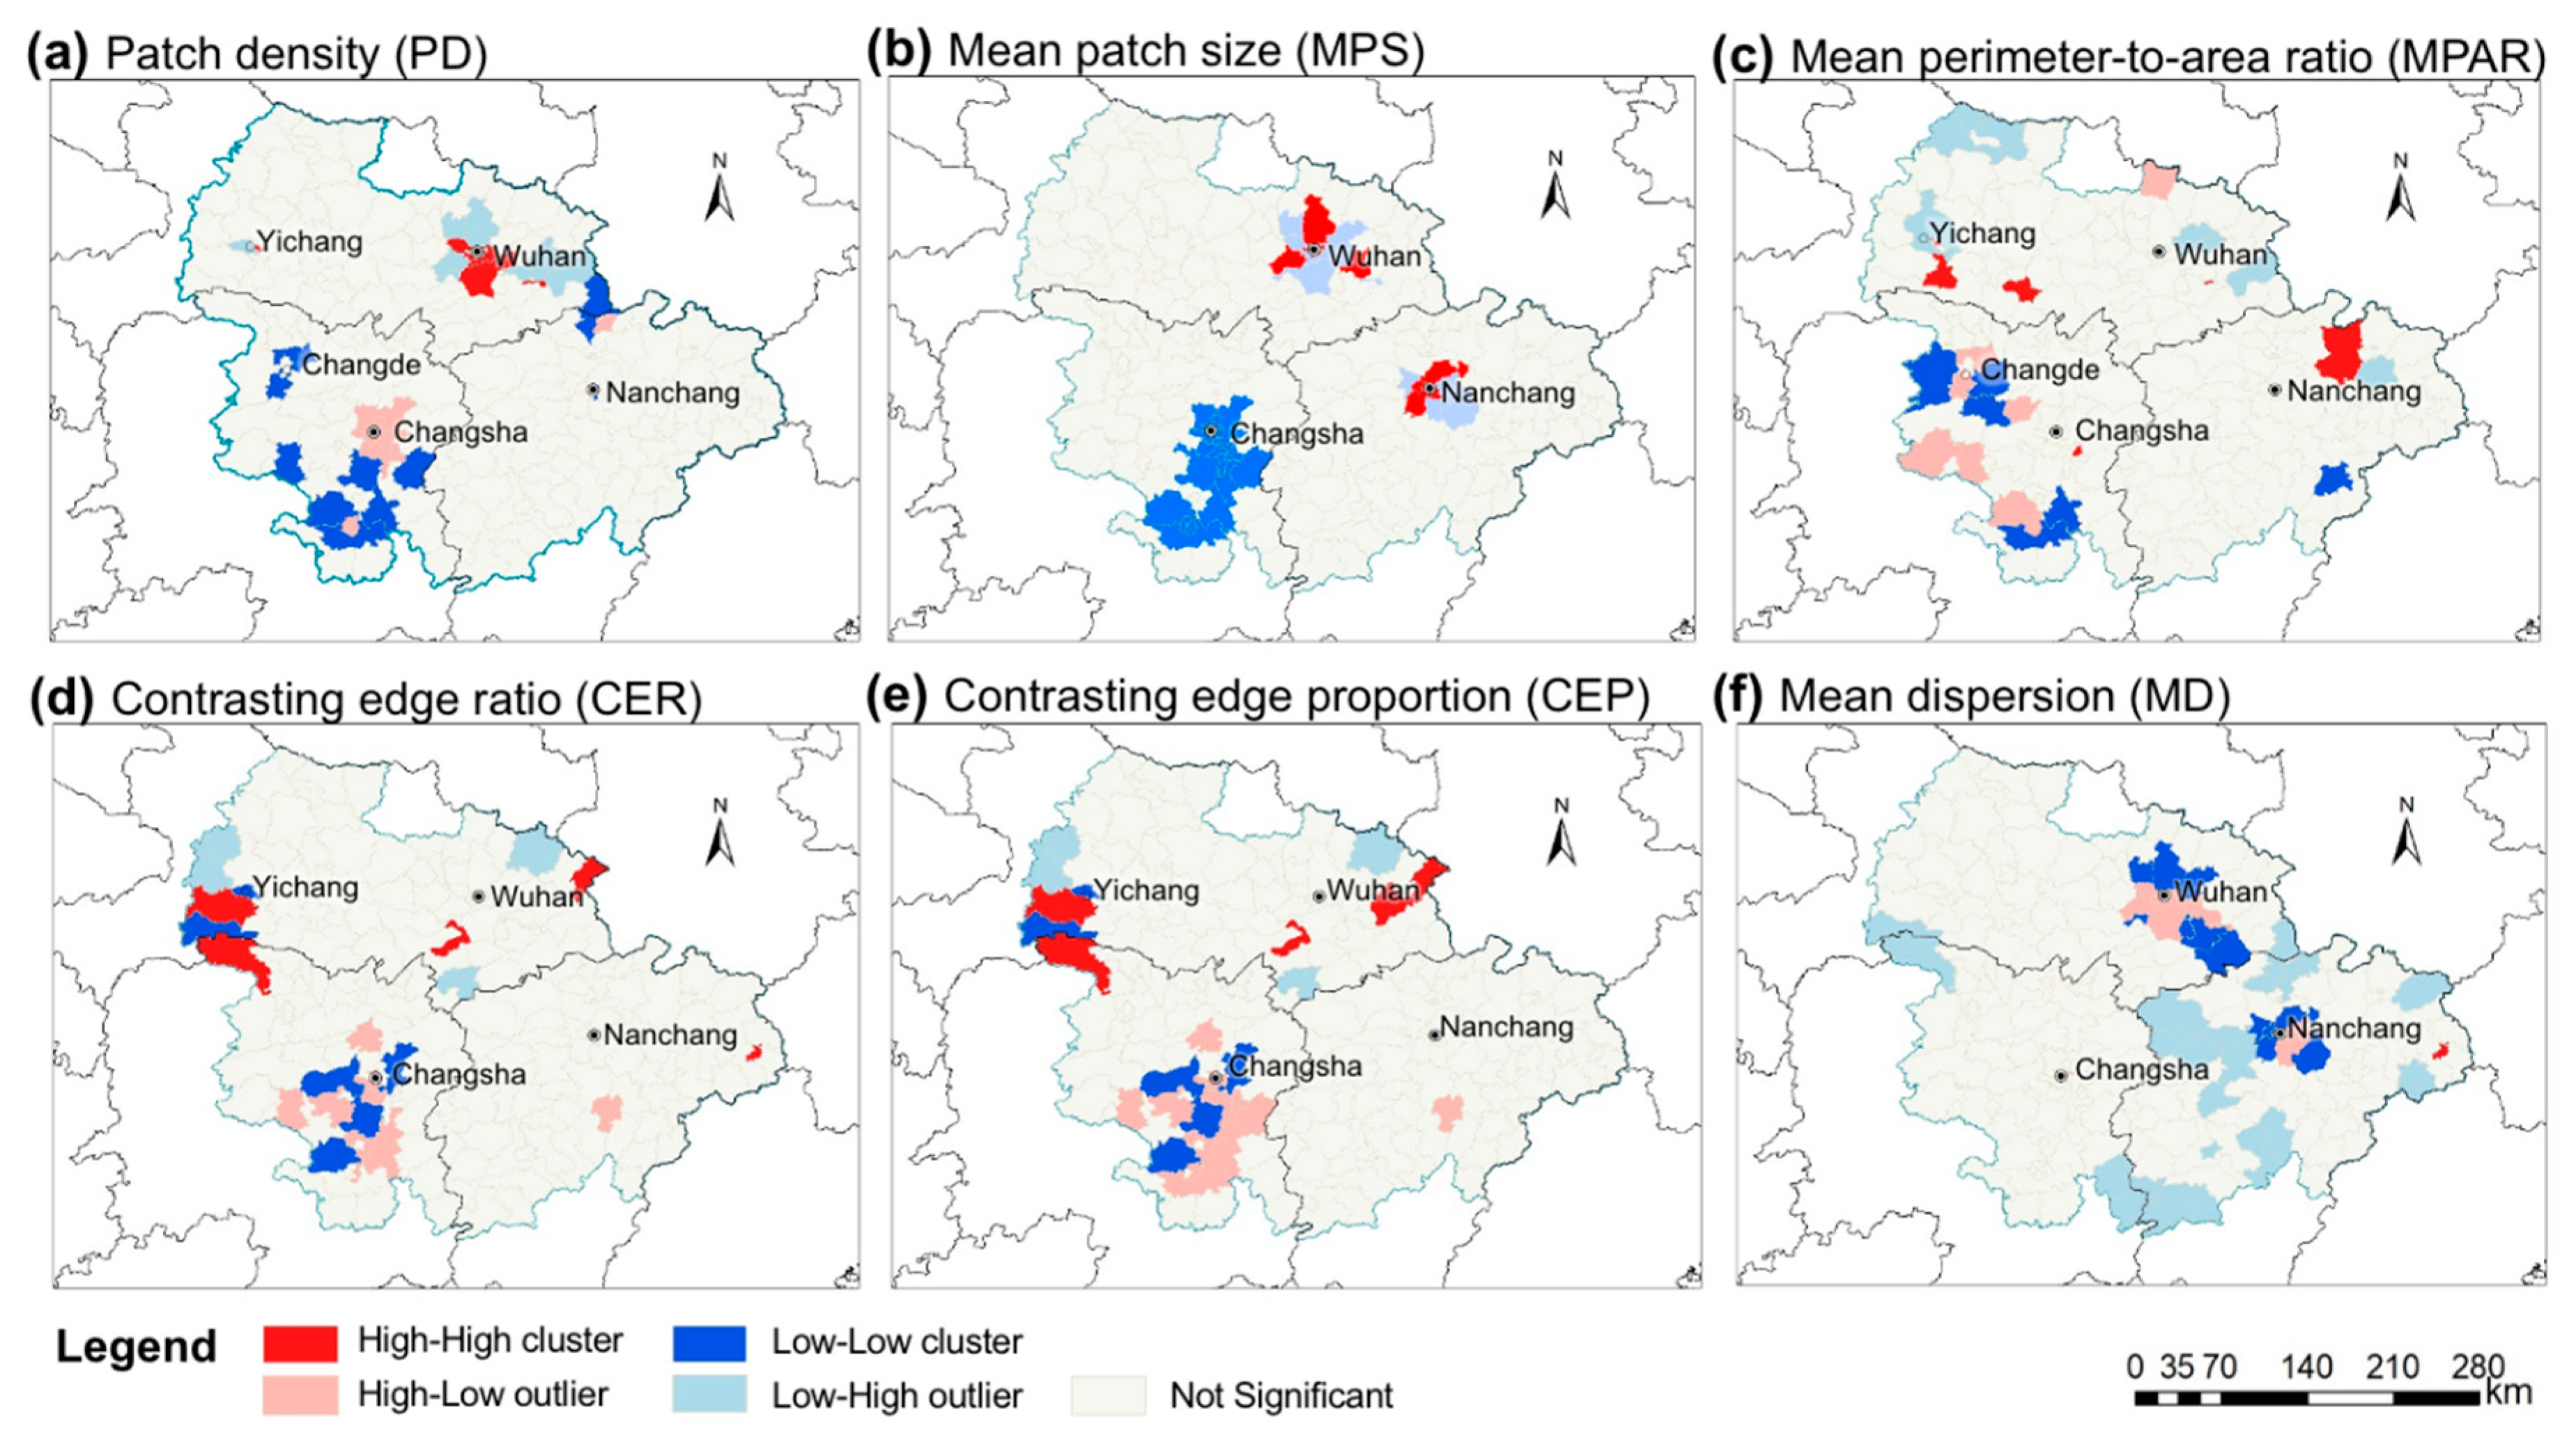
We identified strong local dependence on changes in the local spatial features of urban morphology (Figure 5):
- (i)
- Fragmentation: In Wuhan, the local “High-High cluster” of PD was observed in the southern area together with the “Low-High outlier” of MPS, suggesting fragmentation occurred locally and was negatively associated with the ongoing spatial integration in the neighbouring divisions and over the WHM region. While the CTZ region tended to develop in an integrated fashion, its core city, Changsha, experienced fragmentation. Yichang, a prefectural city in west Hubei, had an unbalanced fragmentation pattern with fragmentation in the east and integration in the western divisions. Besides, spatial integration was found in several divisions in Changde, a prefectural city in north Hunan.
- (ii)
- Complexity: Local clusters/outliers of MPAR did not occur near the core cities of the three metropolitan areas. However, increased complexity was found in south Yichang and central Changde.
- (iii)
- Contiguity: It was observed in CZT that new urban patches emerged in a leapfrogging manner (increased CER and CEP) in the outskirts of Changsha, which was associated with increasing contiguity in its neighbouring cities. Besides, a local developmental pattern towards contiguity was observed in several divisions of Yichang.
- (iv)
- Dispersion: The development in the centres of WHM and PLM was highly sprawled (increased MD) while compact development was still observed in several divisions in the capital cities (Wuhan and Nanchang).
4. Discussion
4.1. Urban Development Pattern in the Yangtze River Middle Reaches Megalopolis
To provide evidence on recent spatial urban development and indicators for regional sustainability assessment in central China, we focused on the morphological changes of the urban landscape in the middle reaches of the Yangtze River between 2000 and 2015. This study attempted to compare the three metropolitan areas over the Yangtze River Middle Reaches Megalopolis (YRMRM) in a meaningful way and to introduce measures on spatial structures. We intended to help stakeholders to understand the effects of urbanisation in terms of type, extent and form.
Urban land occupied 2.73% of the YRMRM, which was less than the 8.03% in the Guangdong-Hong Kong-Macao Greater Bay Area (GBA), the most highly developed urban agglomeration in China [36,37]. The rate of urban expansion in the YRMRM was about 250 km2/a from 2000 to 2015 and slightly slower than that of the Yangtze River Delta (YRD) (260 km2/a) [38]. However, it was faster than the GBA, the Beijing-Tianjin-Hebei Urban Agglomeration (BTH) and the Chengdu-Chongqing City Cluster (CCC) [39,40]. The LUCC in the region was mainly driven by the conversion from agricultural to urban land cover. In general, agricultural land, forest and grassland decreased, while water and urban areas increased. Such a trend was found consistent with the study by Liu et al. [32,41]. Almost 70% of the BTH and GBA regions’ urban expansion originated from agricultural land conversion [39]. In YRD, such a figure reached 92% [40]. Future studies are required to analyse and compare the driving forces of urban expansion in these areas, and disclose to which extent the physical and socioeconomic characteristics could shape the different spatial patterns of urbanisation [42].
We further found differences between the local development patterns of the three local metropolitan areas in the YRMRM. The speed of urbanisation also varied in the different five-year periods, with the most recent one (2010–2015) being the fastest. WHM had the most dramatic LUCC and urban expansion while PLM had the least. Nearly 67% of the newly developed urban area in WHM was converted from agricultural land. In CZT, conversion from forest to urban area shared nearly 50% of the source of urbanisation. The agricultural land conversion was the primary source of the urban area in PLM until the 2010–2015 period when forest conversion had made a significant contribution. Such local differences added new evidence to the growing evidence on the increasingly diversified local development patterns in China [42,43,44].
4.2. Implications of Changes in Landscape Indices for Sustainable Urban Development
Urban landscape indices, as explored in this study, can be used as indicators of sustainability from various aspects. They are thus helpful for developing an improved understanding of the change in urban form, which may aid urban governance [45]. Fragmentation and complexity are widely used to reflect the discontinuity of landscape and multi-level, interactive phenomenon among urban social systems [46]. They are indicators of the ecological impact of the urban expansion process [47,48]. It was reported that urbanisation-induced landscape fragmentation could profoundly damage the provisioning of ecosystem services [19]. Urban contiguity and dispersion are metrics that can be used to measure the degree of spatial coherence and concentration during the urbanisation process [49]. They could be helpful when designing strategies for mitigating urban pollution and climatic challenges [50]. Previous empirical evidence suggested that contiguous dense and dispersed urban development could both enhance the urban heat island effect [51]. Ensuring the continuity of existing and new urban patches was considered essential to promote energy efficiency in the implementation and maintenance of infrastructure networks [52].
In this study, the spatial development of WHM tended to be continuous and less fragmented, suggesting regulated urbanisation and thus a better managed negative impact on the region’s ecosystem. Recent evidence suggested that the ecosystem services increased after the launching of China’s Ecological Control Line policy in 2011 [53]. However, the increased shape complexity and local dispersion raised challenges to some local areas to achieve efficient use of energy and mitigations of pollution and climatic problems. The spatial pattern of CZT seemed to be increasingly fragmented, complex and dispersed. Further investigations are therefore needed to explore the likely impacts of such a developmental trend on the region’s ecosystems and quality of the environment. Previous findings suggested that urban sprawl in CZT was associated with the PM10 concentration variation over the region [50]. PLM developed overall continuously, with increasingly complex shape and severe local dispersion. This was mainly due to the recent emergence of small towns over the region, which derived ecological land-cover change and was associated with small-scale ecological risks [54,55]. It thus calls for a need to assess and manage their impacts on the biophysical environment, in particular, the Poyang Lake ecosystem.
Spatial autocorrelation analysis disclosed the local spatial clustering of changes in landscape indices reflecting the fragmentation, complexity, contiguity and dispersion of urban development patterns. While the overall level of urban aggregation was found to have lowered in China [56], several intensified aggregations were identified in our study, i.e., in WHM and PLM. These two metropolitan areas showed some similarities in local spatial clustering patterns, showing increased aggregation in the core cities, which were different from CZT. Liu et al. [57] found that the local aggregation level of urban development in China’s metropolitan areas might have been influenced by a series of factors, for example, the size of the core city and the overall rate of urbanisation in the metropolitan area. The regions of WHM and PLM are monocentric and their core cities (Wuhan and Nanchang) are relatively more abundant in each metropolitan area. It is likely that these core cities had higher externalities and thus attracted more developments. The rate of urban land cover across the polycentric CZT, however, was less uneven, with Changsha (the core city), Zhuzhou and Xiangtan all having a relatively high level of urbanisation in central China [58]. More attention should be paid to the future land conversion in CZT, as the polycentric development model could be associated with high per-capita land consumption [59] and the urban land in CZT was largely converted from forests.
When introducing these results in public participation processes, it would be helpful to bridge the landscape indices with their implication on sustainability, meanwhile hiding the computational complexity. Studies have shown that introducing urban morphological parameters in urban modelling could yield more accurate projections and could facilitate stakeholder discussion on developing future urban developmental scenarios [34,60]. However, the implications of these indices might remain vague for the general public, as the scale of the current study was coarse. To further improve the usefulness of these indices in urban planning practices, future studies are necessary to quantitatively examine how the change in these indices could relate to a broader range of specific local issues. These could include residential attractiveness, agricultural land loss, environmental pollution, provisioning, trade-offs and synergies of water-related ecosystem services, etc.
In the YRMRM, recent planning foci have been put on pursuing both accelerated urbanisation (according to the YRMRM Developmental Plan, released in 2015) and restoring the hydro-ecosystem of the Yangtze River basin (according to the Yangtze River Protection Strategy, announced in 2018) [61]. This calls for a comprehensive understanding and assessment of how the past urbanisation development might have influenced the region’s environment. Our study could help to fill this gap by providing updated evidence on the changes in the spatial pattern of urban land use. We measured these spatial changes with landscape indices that have been extensively explored for their implications for environmental problems. Our results could shed light on the potential challenges to sustainability for stakeholders and planners, and pinpoint potential areas for future investigation.
4.3. Limitations and Directions for Future Research
This study employed both landscape indices and local spatial autocorrelation measures to characterise changes in landscape patterns. The landscape indices are increasing in numbers (for example Jia et al. [27] used 17 different landscape indices in a recent study) and can be regarded as “discrete” measures of landscape heterogeneity [62]. However, the presence of complex shapes of urban features has raised concerns regarding the utility of discrete abstraction in characterising urban spatial patterns. It was from this perspective that local spatial autocorrelation was used to capture the continuous characteristics of landscape heterogeneity. Readers interested in the benefits of the continuous methods and a comprehensive comparison between landscape metrics and local spatial autocorrelation measures are referred to the work by Fan and Myint [63]. In this study, the results of local Moran’s I suggested local clusters of urban development other than these three local metropolitan areas, i.e., Yichang and Changde. Their local importance might require further attention, as their development was locally associated with surrounding areas.
Landscape analysis was commonly used to study urban expansion patterns and urban morphology. A major limitation of this method is that it is prone to land-cover classification errors resulting from the coarse spatial resolution of remote sensing data, the misuse of classification methods, the ignorance of temporal variations, etc. [64,65]. The LUCC datasets used in this study were of a high resolution (30m resolution) and from a reliable source, by which classification errors were minimised. They were an outcome of a collaborative national scientific project jointly supported by the Ministry of Science and Technology (China) and the Chinese Academy of Sciences. As they have been produced by experienced scientists and cover land-use change patterns in China over the past few decades, the datasets are also the most commonly used land-use dataset products in China.
In addition to the above-mentioned research prospects, several directions for future research could be suggested. First, while this study focused on depicting recent changes in urban morphological patterns, the factors and processes underpinning these observed changes remain mostly unknown. The rapid development of transportation infrastructures such as the high-speed rail network was found to have contributed to the changing urban landscape in central China [30]. Future investigations are needed to explore whether and how other anthropogenic factors may have shaped the region’s urban spatial developments. In particular, the factors related to hydroelectricity development, which has been one of the main driving forces for the region’s economic and demographic development [66]. Second, more empirical studies are required to extend the capability of landscape indices as indicators of challenges to sustainability. Given the projected shrinking population in China and the YRMRM [67], it would be useful to examine the links between landscape indices of urban/green/water areas and residential preference [68] to aid urban designing towards a sustainable population. Moreover, studies are encouraged to explore the associations between landscape indices and hot spots of provisioning, trade-offs and synergies of water-related ecosystem services [69]. This could support decision-making on the spatial planning of local actions under the ambitious Yangtze River Protection Strategy.
5. Conclusions
There were dramatic changes in the spatial pattern of land-use and land-cover in the Yangtze River Middle Reaches Megalopolis between 2000 and 2015. The conversion of agricultural land contributed to an increasingly accelerated urban expansion. Landscape indices helped to disclose substantial differences in urban spatial development between the three key metropolitan areas. The development in the Wuhan Metropolitan Area was in a continuous and less fragmented fashion, with increased shape complexity and local dispersion. The Changsha-Zhuzhou-Xiangtan Metropolitan Area seemed to be increasingly fragmented, complex and dispersed. The Poyang Lake Metropolitan Area’s development was overall continuous, with increasingly complex shape and severe local dispersion. A local-level characterisation of landscape patterns by spatial autocorrelation analysis uncovered the unevenness and revealed new clusters of urban development. Those indices reflected the regional- and local-level urban patterns that could further serve as indicators of sustainability to infer potential ecological and climatic challenges. Future studies are encouraged to incorporate region-specific anthropogenic factors in assessing the underlying processes of the changing patterns of the urban landscape, and to quantitatively examine how landscape indices could serve as indicators of a more comprehensive set of the sustainability challenges of local concern, such as population shrinkage, provisioning, trade-offs and synergies of water-related ecosystem services.
Author Contributions
Conceptualization, D.Z. and S.L.; Methodology, D.Z. and S.L.; Software, D.Z. and G.Z.; Validation, G.Z.; Formal Analysis, D.Z.; Investigation, D.Z.; Resources, H.W.; Data Curation, D.Z., H.S. and Q.T.; Writing—Original Draft Preparation, D.Z.; Writing—Review and Editing, S.L.; Visualization, D.Z.; Supervision, S.L.; Project Administration, S.L.; Funding Acquisition, S.L. All authors have read and agreed to the published version of the manuscript.
Funding
This research has received funding from the Innovative Foundation of Huazhong University of Science and Technology under grant agreement number 2018KFYYXJJ133.
Conflicts of Interest
The authors declare no conflict of interest.
References
- Mooney, H.A.; Duraiappah, A.; Larigauderie, A. Evolution of Natural and Social Science Interactions in Global Change Research Programs. Proc. Natl. Acad. Sci. USA 2013, 110, 3665–3672. [Google Scholar] [CrossRef] [Green Version]
- Chase, T.N.; Pielke, R.A., Sr.; Kittel, T.G.F.; Nemani, R.R.; Running, S.W. Simulated Impacts of Historical Land Cover Changes on Global Climate in Northern Winter. Clim. Dyn. 2000, 16, 93–105. [Google Scholar] [CrossRef]
- Sala, O.E.; Chapin, F.S., III; Armesto, J.J.; Berlow, E.; Bloomfield, J.; Dirzo, R.; Huber-Sanwald, E.; Huenneke, L.; Jackson, R.B.; Kinzig, A.P.; et al. Global Biodiversity Scenarios for the Year 2100. Science 2000, 287, 1770–1774. [Google Scholar] [CrossRef]
- Barton, H. Land Use Planning and Health and Well-Being. Land Use Policy 2009, 26, S115–S123. [Google Scholar] [CrossRef]
- Zhang, Z.; Gao, J.; Gao, Y. The Influences of Land Use Changes on the Value of Ecosystem Services in Chaohu Lake Basin, China. Environ. Earth Sci. 2015, 74, 385–395. [Google Scholar] [CrossRef]
- Liu, J.; Liu, M.; Deng, X.; Zhuang, D.; Zhang, Z.; Luo, D. The Land Use and Land Cover Change Database and its Relative Studies in China. J. Geogr. Sci. 2002, 12, 275–282. [Google Scholar] [CrossRef]
- Fan, J.; Li, P. The Scientific Foundation of Major Function Oriented Zoning in China. J. Geogr. Sci. 2009, 19, 515–531. [Google Scholar] [CrossRef]
- Chen, M.; Liu, W.; Tao, X. Evolution and Assessment on China’s Urbanization 1960–2010: Under-Urbanization or Over-Urbanization? Habitat Int. 2013, 38, 25–33. [Google Scholar] [CrossRef]
- Smith, C.; Levermore, G. Designing Urban Spaces and Buildings to Improve Sustainability and Quality of Life in a Warmer World. Energy Policy 2008, 36, 4558–4562. [Google Scholar] [CrossRef]
- Barke, M. The Importance of Urban Form as an Object of Study. In Teaching Urban Morphology; Oliveira, V., Ed.; Springer International Publishing: Cham, Switzerland, 2018; pp. 11–30. [Google Scholar] [CrossRef]
- Hassan, M.M. Monitoring Land Use/Land Cover Change, Urban Growth Dynamics and Landscape Pattern Analysis in Five Fastest Urbanized Cities in Bangladesh. Remote Sens. Appl. Soc. Environ. 2017, 7, 69–83. [Google Scholar] [CrossRef]
- Herold, M.; Couclelis, H.; Clarke, K.C. The Role of Spatial Metrics in the Analysis and Modeling of Urban Land Use Change. Comput. Environ. Urban Syst. 2005, 29, 369–399. [Google Scholar] [CrossRef]
- Berling-Wolff, S.; Wu, J. Modeling Urban Landscape Dynamics: A Case Study in Phoenix, USA. Urban Ecosyst. 2004, 7, 215–240. [Google Scholar] [CrossRef]
- O’Neill, R.V.; Krummel, J.R.; Gardner, R.H.; Sugihara, G.; Jackson, B.; DeAngelis, D.L.; Milne, B.T.; Turner, M.G.; Zygmunt, B.; Christensen, S.W.; et al. Indices of Landscape Pattern. Landsc. Ecol. 1988, 1, 153–162. [Google Scholar] [CrossRef]
- Mcgarigal, K.; Marks, B.J. FRAGSTATS: Spatial Pattern Analysis Program for Quantifying Landscape Structure; US Department of Agriculture, Forest Service, Pacific Northwest Research Station: Portland, OR, USA, 1995; p. 122. [Google Scholar]
- Herold, M.; Scepan, J.; Clarke, K.C. The Use of Remote Sensing and Landscape Metrics to Describe Structures and Changes in Urban Land Uses. Environ. Plan. A Econ. Space 2002, 34, 1443–1458. [Google Scholar] [CrossRef] [Green Version]
- Wahyudi, A.; Liu, Y.; Corcoran, J. Combining Landsat and Landscape Metrics to Analyse Large-Scale Urban Land Cover Change: A Case Study in the Jakarta Metropolitan Area. J. Spat. Sci. 2018, 64, 515–534. [Google Scholar] [CrossRef]
- Gao, J.; Song, Y. On Landscape Ecology of Urban-rural Ecotone Based on Remote Sensing and GIS: A case study of Southwest Shanghai. Acta Ecol. Sin. 2003, 23, 805–813. [Google Scholar]
- Su, S.; Xiao, R.; Jiang, Z.; Zhang, Y. Characterizing Landscape Pattern and Ecosystem Service Value Changes for Urbanization Impacts at an Eco-Regional Scale. Appl. Geogr. 2012, 34, 295–305. [Google Scholar] [CrossRef]
- Irwin, E.G.; Bockstael, N.E. The Evolution of Urban Sprawl: Evidence of Spatial Heterogeneity and Increasing Land Fragmentation. Proc. Natl. Acad. Sci. USA 2007, 104, 20672–20677. [Google Scholar] [CrossRef] [Green Version]
- Anselin, L. Local Indicators of Spatial Association-LISA. Geogr. Anal. 2010, 27, 93–115. [Google Scholar] [CrossRef]
- Ord, J.K.; Getis, A. Local Spatial Autocorrelation Statistics: Distributional Issues and an Application. Geogr. Anal. 2010, 27, 286–306. [Google Scholar] [CrossRef]
- Wulder, M.A.; Boots, B. Local Spatial Autocorrelation Characteristics of Remotely Sensed Imagery Assessed With the Getis Statistic. Int. J. Remote Sens. 1998, 19, 2223–2231. [Google Scholar] [CrossRef]
- Shen, Y.; Zhang, L.; Fang, X.; Ji, H.; Li, X.; Zhao, Z. Spatiotemporal Patterns of Recent PM2.5 Concentrations over Typical Urban Agglomerations in China. Sci. Total. Environ. 2019, 655, 13–26. [Google Scholar] [CrossRef] [PubMed]
- Li, Q.; Hu, S.; Qu, S. Spatiotemporal Characteristics of Cultivated Land Use Transition in the Middle Yangtze River from 1990 to 2015. Geogr. Res. 2017, 36, 1489–1502. [Google Scholar]
- Renetzeder, C.; Schindler, S.; Peterseil, J.; Prinz, M.A.; Mucher, S.; Wrbka, T. Can We Measure Ecological Sustainability? Landscape Pattern as an Indicator for Naturalness and Land Use Intensity at Regional, National and European Level. Ecol. Indic. 2010, 10, 39–48. [Google Scholar] [CrossRef]
- Jia, Y.; Tang, L.; Xu, M.; Yang, X. Landscape Pattern Indices for Evaluating Urban Spatial Morphology—A Case Study of Chinese Cities. Ecol. Indic. 2019, 99, 27–37. [Google Scholar] [CrossRef]
- Niu, X.; Ding, L.; Song, X. Understanding Urban Spatial Structure of Shanghai Central City Based on Mobile Phone Data. China. City Plan. Rev. 2015, 24, 15–23. [Google Scholar]
- Hu, L.; Sun, T.; Wang, L. Evolving Urban Spatial Structure and Commuting Patterns: A Case Study of Beijing, China. Transp. Res. Part D Transp. Environ. 2018, 59, 11–22. [Google Scholar] [CrossRef]
- Zhang, G.; Zheng, D.; Wu, H.; Wang, J.; Li, S. Assessing the Role of High-Speed Rail in Shaping the Spatial Patterns of Urban and Rural Development: A Case of the Middle Reaches of the Yangtze River, China. Sci. Total. Environ. 2019, 704, 135399. [Google Scholar] [CrossRef]
- Xu, X.; Pang, Z.; Yu, X. Spatial-Temporal Pattern Analysis of Land Use/Cover; Science and Technology Academic Press: Beijing, China, 2014. [Google Scholar]
- Liu, J.; Kuang, W.; Zhang, Z.; Xu, X.; Qin, Y.; Ning, J.; Zhou, W.; Zhang, S.; Li, R.; Yan, C.; et al. Spatiotemporal Characteristics, Patterns, and Causes of Land-Use Changes in China since the Late 1980s. J. Geogr. Sci. 2014, 24, 195–210. [Google Scholar] [CrossRef]
- Liu, J.; Zhang, Z.; Xu, X.; Kuang, W.; Zhou, W.; Zhang, S.; Li, R.; Yan, C.; Yu, N.; Wu, S.; et al. Spatial Patterns and Driving Forces of Land Use Change in China During the Early 21st Century. J. Geogr. Sci. 2010, 20, 483–494. [Google Scholar] [CrossRef]
- Li, S.; Juhász-Horváth, L.; Pedde, S.; Pintér, L.; Rounsevell, M.D.A.; Harrison, P.A. Integrated Modelling of Urban Spatial Development under Uncertain Climate Futures: A Case Study in Hungary. Environ. Model. Softw. 2017, 96, 251–264. [Google Scholar] [CrossRef] [Green Version]
- Batty, M.; Longley, P.; Fotheringham, S. Urban Growth and Form: Scaling, Fractal Geometry, and Diffusion-Limited Aggregation. Environ. Plan. A: Econ. Space 1989, 21, 1447–1472. [Google Scholar] [CrossRef]
- Jiao, M.; Hu, M.; Xia, B. Spatiotemporal Dynamic Simulation of Land-Use and Landscape-Pattern in the Pearl River Delta, China. Sustain. Cities Soc. 2019, 49, 101581. [Google Scholar] [CrossRef]
- Yu, W.; Zhou, W. The Spatiotemporal Pattern of Urban Expansion in China: A Comparison Study of Three Urban Megaregions. Remote Sens. 2017, 9, 45. [Google Scholar] [CrossRef] [Green Version]
- Li, M.; Yin, P.; Duan, X.; Liu, J.; Qiu, J.; Phung, V.P. Land-Use Changes and Human Driving in and Near the Yangtze River Delta from 1995–2015. J. Ocean Univ. China 2018, 17, 1361–1368. [Google Scholar] [CrossRef]
- Li, S.; Yang, H.; Lacayo-Emery, M.; Liu, J.; Lei, G. Impacts of Land-Use and Land-Cover Changes on Water Yield: A Case Study in Jing-Jin-Ji, China. Sustainability 2018, 10, 960. [Google Scholar] [CrossRef] [Green Version]
- Zhang, S.; Fang, C.; Kuang, W.; Sun, F. Comparison of Changes in Urban Land Use/Cover and Efficiency of Megaregions in China from 1980 to 2015. Remote Sens. 2019, 11, 1834. [Google Scholar] [CrossRef] [Green Version]
- Liu, J.; Ning, J.; Kuang, W.; Xu, X.; Zhang, S.; Yan, C.; Li, R.; Wu, S.; Hu, Y.; Du, G.; et al. Spatio-Temporal Patterns and Characteristics of Land-Use Change in China During 2010-2015. J. Geogr. Sci. 2018, 73, 789–802. [Google Scholar] [CrossRef]
- Ji, C.Y.; Liu, Q.; Sun, D.; Wang, S.; Lin, P.; Li, X. Monitoring Urban Expansion With Remote Sensing in China. Int. J. Remote Sens. 2001, 22, 1441–1455. [Google Scholar] [CrossRef]
- Weng, Q. A Remote sensing? GIS Evaluation of Urban Expansion and Its Impact on Surface Temperature in the Zhujiang Delta, China. Int. J. Remote Sens. 2001, 22, 1999–2014. [Google Scholar] [CrossRef]
- Wang, L.; Li, C.; Ying, Q.; Cheng, X.; Wang, X.; Li, X.; Hu, L.; Liang, L.; Yu, L.; Huang, H.; et al. China’s Urban Expansion from 1990 to 2010 Determined With Satellite Remote Sensing. Chin. Sci. Bull. 2012, 57, 2802–2812. [Google Scholar] [CrossRef] [Green Version]
- Liu, Y.; Song, Y.; Arp, H.P.H. Examination of the Relationship Between Urban Form and Urban Eco-Efficiency in China. Habitat Int. 2012, 36, 171–177. [Google Scholar] [CrossRef]
- Goh, S.; Lee, K.; Choi, M. Emergence of Complexity in Urban Morphology. In Statistics and Analysis of Shapes; Springer Science and Business Media LLC: Berlin, Germany, 2019; pp. 291–314. [Google Scholar] [CrossRef]
- Schwarz, N. Urban Form revisited—Selecting Indicators for Characterising European Cities. Landsc. Urban Plan. 2010, 96, 29–47. [Google Scholar] [CrossRef]
- Galster, G.; Hanson, R.; Ratcliffe, M.R.; Wolman, H.; Coleman, S.; Freihage, J. Wrestling Sprawl to the Ground: Defining and Measuring an Elusive Concept. Hous. Policy Debate 2001, 12, 681–717. [Google Scholar] [CrossRef]
- Schneider, A.; Woodcock, C.E. Compact, Dispersed, Fragmented, Extensive? A Comparison of Urban Growth in Twenty-Five Global Cities Using Remotely Sensed Data, Pattern Metrics and Census Information. Urban Stud. 2008, 45, 659–692. [Google Scholar] [CrossRef]
- Zou, B.; Xu, S.; Sternberg, T.; Fang, X. Effect of Land Use and Cover Change on Air Quality in Urban Sprawl. Sustainability 2016, 8, 677. [Google Scholar] [CrossRef] [Green Version]
- Debbage, N.; Shepherd, J.M. The Urban Heat Island Effect and City Contiguity. Comput. Environ. Urban Syst. 2015, 54, 181–194. [Google Scholar] [CrossRef]
- Amado, M.; Poggi, F.; Amado, A.R. Energy Efficient City: A Model for Urban Planning. Sustain. Cities Soc. 2016, 26, 476–485. [Google Scholar] [CrossRef]
- Luo, Q.; Zhang, X.; Li, Z.; Yang, M.; Lin, Y. The Effects of China’s Ecological Control Line Policy on Ecosystem Services: The Case of Wuhan City. Ecol. Indic. 2018, 93, 292–301. [Google Scholar] [CrossRef]
- Xie, H.; Liu, Z.; Wang, P.; Liu, G.; Lu, F. Exploring the Mechanisms of Ecological Land Change Based on the Spatial Autoregressive Model: A Case Study of the Poyang Lake Eco-Economic Zone, China. Int. J. Environ. Res. Public Heal. 2013, 11, 583–599. [Google Scholar] [CrossRef]
- Zhong, Y.; Lin, A.; Zhou, Z. Evolution of the Pattern of Spatial Expansion of Urban Land Use in the Poyang Lake Ecological Economic Zone. Int. J. Environ. Res. Public Heal. 2019, 16, 117. [Google Scholar] [CrossRef] [PubMed] [Green Version]
- Song, Y.; Liu, T.; Tang, Y.; Zhu, W.; Tang, W. Quantitative Analyses of Changes in Urban Spatial Morphology under Rapid Urbanization in China. Ecol. Sci. 2015, 34, 124–128. [Google Scholar]
- Liu, T.; Cao, G. Agglomeration and Dispersion of City Sizes and the Influence of Central Cities: Based on the Multi-Scale Spatial Autocorrelation and the Case of China. Geogr. Anal. 2012, 31, 1317–1327. [Google Scholar]
- Feng, X.; Zhong, Y.; Li, J.; Huang, J. Spatial Distribution of the Comprehensive Level of County Urbanization and Its Driving Factors in Urban Agglomeration in the Middle Reaches of Yangtze River. Resour. Environ. Yangtze Basin. 2015, 24, 899–908. [Google Scholar]
- Salvati, L.; Carlucci, M. Distance Matters: Land Consumption and the Mono-Centric Model in Two Southern European Cities. Landsc. Urban Plan. 2014, 127, 41–51. [Google Scholar] [CrossRef]
- Li, S.; Juhász-Horváth, L.; Pintér, L.; Rounsevell, M.D.; Harrison, P.A. Modelling Regional Cropping Patterns under Scenarios of Climate and Socio-Economic Change in Hungary. Sci. Total. Environ. 2018, 1611–1620. [Google Scholar] [CrossRef]
- Tian, Y.; Wu, H.; Zhang, G.; Wang, L.; Zheng, D.; Li, S. Perceptions of Ecosystem Services, Disservices and Willingness-to-Pay for Urban Green Space Conservation. J. Environ. Manag. 2020, 260, 110140. [Google Scholar] [CrossRef]
- McGarigal, K.U.; Cushman, S.A. The Gradient Concept of Landscape Structure. In Issues and Perspectives in Landscape Ecology; Wiens, J.A., Moss, M.R., Eds.; Cambridge University Press: Cambridge, UK, 2005; pp. 112–119. [Google Scholar]
- Fan, C.; Myint, S. A Comparison of Spatial Autocorrelation Indices and Landscape Metrics in Measuring Urban Landscape Fragmentation. Landsc. Urban Plan. 2014, 121, 117–128. [Google Scholar] [CrossRef]
- Shao, G.; Wu, J. On the Accuracy of Landscape Pattern Analysis Using Remote Sensing Data. Landsc. Ecol. 2008, 23, 505–511. [Google Scholar] [CrossRef]
- Li, H.; Wu, J. Use and Misuse of Landscape Indices. Landsc. Ecol. 2004, 19, 389–399. [Google Scholar] [CrossRef] [Green Version]
- Wang, Y.; Zhang, N.; Wang, D.; Wu, J.; Zhang, X. Investigating the Impacts of Cascade Hydropower Development on the Natural Flow Regime in the Yangtze River, China. Sci. Total. Environ. 2018, 624, 1187–1194. [Google Scholar] [CrossRef] [PubMed]
- Long, Y.; Wu, K. Shrinking Cities in a Rapidly Urbanizing China. Environ. Plan. A: Econ. Space 2016, 48, 220–222. [Google Scholar] [CrossRef] [Green Version]
- Li, S.; Juhász-Horváth, L.; Harrison, P.A.; Pintér, L.; Rounsevell, M.D.A. Population and Age Structure in Hungary: A Residential Preference and Age Dependency Approach to Disaggregate Census Data. J. Maps 2016, 12, 560–569. [Google Scholar] [CrossRef] [Green Version]
- Frank, S.; Fürst, C.; Koschke, L.; Makeschin, F. A Contribution towards a Transfer of the Ecosystem Service Concept to Landscape Planning Using Landscape Metrics. Ecol. Indic. 2012, 21, 30–38. [Google Scholar] [CrossRef]
Figure 1.
Study area: the Yangtze River Middle Reaches Megalopolis, China.

Figure 2.
Land-use and -cover change of three key metropolitan areas in the YRMRM between 2000 and 2015.
Figure 2.
Land-use and -cover change of three key metropolitan areas in the YRMRM between 2000 and 2015.

Figure 3.
Source of land being converted to urban area in the three metropolitan areas from 2000 to 2015.
Figure 3.
Source of land being converted to urban area in the three metropolitan areas from 2000 to 2015.

Figure 4.
Changes in the urban landscape indices of the three metropolitan areas from 2000 to 2015.

Figure 5.
Local Moran’s I test of local spatial features of urban morphology.


Table 1.
Landscape indices used to depict urban morphology.
| Indices | Definition | Unit | Explanation | Dimension |
|---|---|---|---|---|
| Patch* density (PD) | 1/km2 | : number of patches of land use k; A: total area of landscape area; | Fragmentation | |
| Mean patch size (MPS) | km2 | : area of patch i of land use k; : perimeter length of patch i of land use k; | Fragmentation | |
| Mean perimeter-to-area ratio (MPAR) | m/km2 | Complexity | ||
| Contrasting edge ratio (CER) | - | : length of edge shared between cells with focal land use k and contrasting land use j; : length of edge shared between cells with the same land use k; | Contiguity | |
| Contrasting edge proportion (CEP) | - | Contiguity | ||
| Mean dispersion (MD) | - | : proportion of cells of contrasting land use j that are within 1km of cell i with focal land use k. | Dispersion |
* A patch is an area of land use (in this study, the urban land use) differing from its surroundings.
© 2020 by the authors. Licensee MDPI, Basel, Switzerland. This article is an open access article distributed under the terms and conditions of the Creative Commons Attribution (CC BY) license (http://creativecommons.org/licenses/by/4.0/).
Share and Cite
MDPI and ACS Style
Zheng, D.; Zhang, G.; Shan, H.; Tu, Q.; Wu, H.; Li, S. Spatio-Temporal Evolution of Urban Morphology in the Yangtze River Middle Reaches Megalopolis, China. Sustainability 2020, 12, 1738. https://0-doi-org.brum.beds.ac.uk/10.3390/su12051738
AMA Style
Zheng D, Zhang G, Shan H, Tu Q, Wu H, Li S. Spatio-Temporal Evolution of Urban Morphology in the Yangtze River Middle Reaches Megalopolis, China. Sustainability. 2020; 12(5):1738. https://0-doi-org.brum.beds.ac.uk/10.3390/su12051738
Chicago/Turabian StyleZheng, Duo, Guanshi Zhang, Hui Shan, Qichao Tu, Hongjuan Wu, and Sen Li. 2020. "Spatio-Temporal Evolution of Urban Morphology in the Yangtze River Middle Reaches Megalopolis, China" Sustainability 12, no. 5: 1738. https://0-doi-org.brum.beds.ac.uk/10.3390/su12051738
Note that from the first issue of 2016, this journal uses article numbers instead of page numbers. See further details here.