Effect of Street Canyon Shape and Tree Layout on Pollutant Diffusion under Real Tree Model


1
Mechanical Engineering College, Xi’an Shiyou University, Xi’an 710065, China
2
School of Human Settlement and Civil Engineering, Xi’an Jiaotong University, Xi’an 710049, China
*
Author to whom correspondence should be addressed.
Sustainability 2020, 12(5), 2105; https://0-doi-org.brum.beds.ac.uk/10.3390/su12052105
Submission received: 30 January 2020
/
Revised: 1 March 2020
/
Accepted: 2 March 2020
/
Published: 9 March 2020
(This article belongs to the Collection Urban Planning and Built Environment)
Abstract
:Trees have a significant impact on the airflow and pollutant diffusion in the street canyon and are directly related to the comfort and health of residents. In this paper, OpenFOAM is used for simulating the airflow and pollutant diffusion in the street canyon at different height–width ratios and tree layouts. Different from the drag source model in the previous numerical simulation, this study focuses on the characterization of the blocking effect of tree branches on airflow by using more precise and real tree models. It is found that the airflow is blocked by the tree branches in the canopy, resulting in slower airflow and varying velocity direction; the air flows in the pore area between trees more easily, and the vortex centers are different in cases where the street canyon shape and tree layout are different. Low-velocity airflow distributes around and between two tree canopies, especially under the influence of two trees with different spacing. At the height of the pedestrian, the tree branches change the vortex structure of airflow, and thereby high pollutant concentration distribution on both sides of the bottom of the leeward side of the street canyon changes constantly. In the street canyon, the small change in tree spacing has a very limited influence on the pollutant concentration. The street canyon has the lowest average pollutant concentration at the largest y-axis direction spacing between two trees.
1. Introduction
A street canyon is a typical micro-unit of urban architecture. The air quality of street canyons deteriorates because of pollutant emissions from automobiles. More importantly, the long-term exposure of residents to the pollutants, including volatile organic compounds, NOx, SOx, etc., in automobile exhaust will lead to various kinds of adverse health problems. The existence of trees can remove the pollutants with smaller particle sizes through dry deposition and biochemical effects to some extent. However, trees weaken the air circulation velocity and intensify the pollution in the street canyon [1,2].
The development of computer hardware promotes the numerical simulation of airflow and pollutant diffusion under the influence of trees in the street canyon. The accurate numerical simulation of pollutant diffusion under the influence of trees in the street canyon depends on the fine characterization of trees. At present, trees are characterized by two methods, including the implicit approach, in which the damping effects of trees are represented by the surface parameters, and the explicit approach, in which trees are modelled by porous media. Salim et al. [3] studied the effects of the inclusion of trees in the numerical simulation of wind flow in urban areas with different approaches. They found that the numerical results obtained by implicit and explicit approaches are obviously different. It is difficult for these models to describe the influence of the tree structures on the flow fields.
The influence of trees on the pollutant diffusion in the street canyon is a very complicated process. The wind direction perpendicular to the street canyon is the most unfavorable for pollutant diffusion. Numerical simulation and experiments have revealed that the presence of trees reduces the circulation velocity in the street canyon, increasing the pollutant concentration in the street canyon, especially on the leeward side and near the ground [4,5]. Buccolieri et al. [6] investigated the airflow field and pollutant concentration field in a street canyon with the height–width ratio of 2 by numerical simulation and wind tunnel experiment. They found that the height–width ratio of the street canyon was the critical parameter affecting the horizontal pollutant accumulation at the height of the pedestrian. Gromke and Ruck [7] investigated the trees of various tree-stand densities and crown porosities with variations in the aspect ratio and wind direction. Sun and Zhang [8] studied the effects of avenue trees in urban street canyons on traffic pollutant dispersion. They found that a terraced building raises pollutant concentration at the windward wall and reduces concentration at the leeward wall at the pedestrian level. Huang et al. [9] argued that two factors (including tree layout and the height of tree trunk) impact the flow field and pollutant dispersion in a street canyon. Wang et al. [10] proposed a coupled large-eddy simulation–Lagrangian stochastic model to study the pollutant dispersion in urban canopy layers under the influence of trees. These studies further confirm that street canyon geometry and trees jointly affect the pollutant diffusion and airflow in the street canyon.
In recent years, the research on pollutant diffusion in the street canyon under the influence of trees has been extended to the complicated structures of urban buildings [11], dry deposition [12], tree-planting pattern and trunk height [9], air stability [13], etc. There are more and more research methods, including the Monte Carlo method [14] and the Lattice Boltzmann method [15], etc. However, the most basic research methods for trees in the street canyon could still possibly be further optimized, especially in the modeling of tree branches in the street canyon. Most of the existing studies on trees have focused on the canopies, and the primary characterization method is porous media model or drag source model, which is unable to simulate the tree’s blocking effect on the airflow. Most researchers deemed that low walls, noise barriers and balconies in the street canyon decrease the airflow velocity [16,17,18]. The same phenomenon may also occur in the street canyon under the influence of tree branches. Hong et al. [19] believed that through the numerical simulation of airflow around three-dimensional real trees, more accurate and realistic simulation results could be obtained.
Although the existing research has revealed the diffusion and transfer mechanism of pollutants under the influence of trees, the drag source model, which is used to characterize trees during research, is unable to describe the blocking effect of tree branches on the airflow, especially the influence of tree branches on the airflow in the street canyon after the leaves fall off in winter. The influence of street canyon shape factors on the pollutant diffusion is seldom systematically expounded. In this paper, the pollutant diffusion behavior at different shape factors (height–width ratio) and tree layouts was studied by the real tree trunk model. This study reflects the influence of trees on the pollutant diffusion in the street canyon more truly and is of considerable significance to the planning of the street canyon shape and arrangement of trees.
2. Model
2.1. Mathematical Model
The below dynamic mathematical model has been widely used to simulate the airflow and pollutant diffusion in the street canyon without the thermal effect [20]. In this paper, the dynamic behavior of airflow is modeled by Navier–Stokes equation, and the transfer model of pollutants is described by the convection-diffusion equation in the Euler–Euler framework. Assuming that the air is incompressible, the mass equation of describing the airflow is as follows, if the working conditions of vehicles are not taken into account:
where means the time-averaged velocity component in the i direction, and xi is the spatial coordinate in the i direction.
The momentum equation is as follows:
where is the kinematic viscosity, is the pressure, is the air density, and is fluctuation velocity in the i direction.
At present, there are many turbulence models used to simulate the turbulence in the street canyon. Although the LES model is more accurate than other models, it has some shortcomings, such as requiring more computing resources, defining appropriate sub-grid scale models and difficulty in setting the inlet boundary conditions [19]. The standard k-ɛ equation, which was used in this paper, is widely used to simulate the airflow in the street canyon with tress [8,21,22].
where k is the turbulent kinetic energy, ɛ is the turbulent energy dissipation rate, and is the turbulent kinetic energy viscosity. Pk is the generation of turbulence kinetic energy due to the mean velocity gradients. Gb represents the generation of turbulence kinetic energy due to buoyancy. The model constants, , are 0.09, 1.44, 1.92, respectively. and are the turbulent Prandtl numbers for k and ɛ, respectively.
The pollutant convection–diffusion equation is adopted to simulate the pollutant transport in the street canyon [20].
This study focuses on the influence of tree branches on airflow and pollutants after the leaves fall off in winter, so the damping effect of the leaves on airflow is not considered. The above equations are discretized based on the finite volume method using the OpenFOAM (open source fluid dynamics software [23]). By implanting the pollutant transfer and diffusion equation in the simpleFoam solver, a new solver is established for calculation of the above mathematical model.
2.2. Physical Model
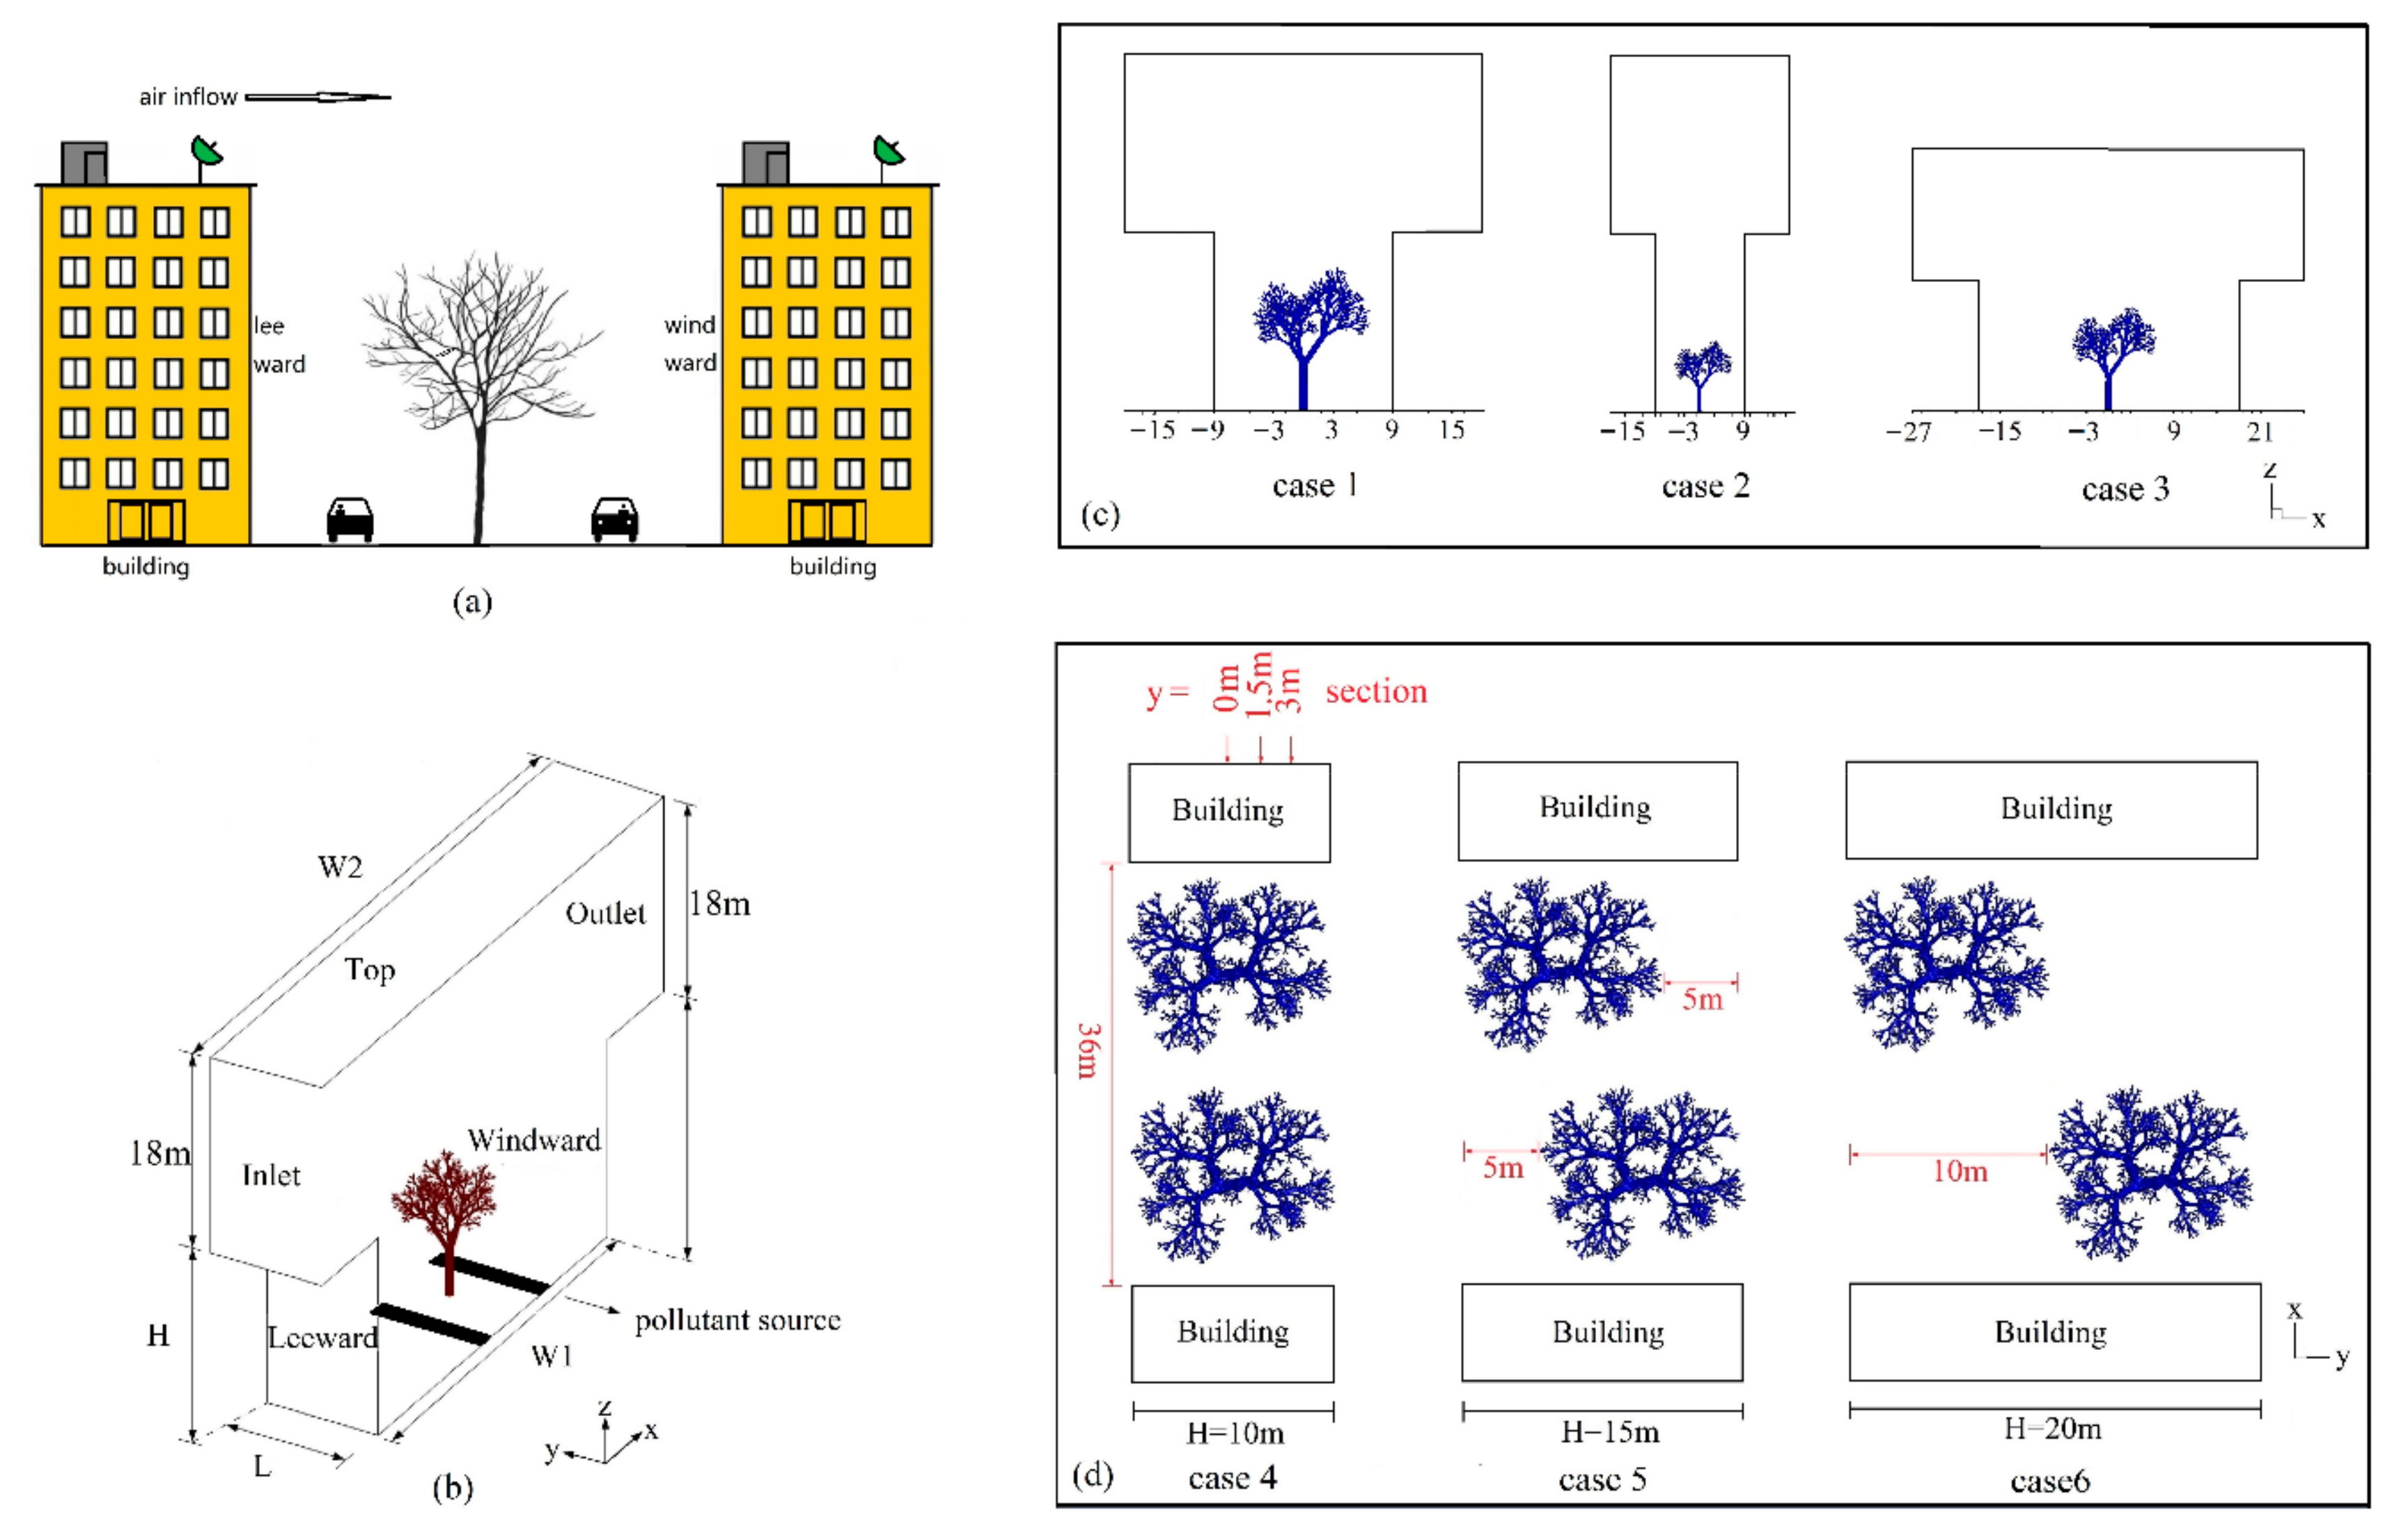
As shown in Figure 1, a physical model of street canyon different morphologies under the presence of trees is given. The tree model is 10 m in y-direction, 11.8 m in x-direction and 14.4 m in z-direction. Figure 1a is a schematic diagram under the presence of trees in the street canyon. Figure 1b gives the physical model, with the ward side height, H, of the street canyon, the height, 18 m, from the top of the building at the windward side to the top of the computational domain, the width, W1, of the street canyon, the length, L, of the street canyon, and the width, W2, of the computational domain. Figure 1c gives the x-z section of street canyons with one tree at different height–width ratios (1, 2, 0.5 from left to right). Figure 1d shows the x-y sections of symmetrical street canyons with the height–width ratio of 0.5 at different layouts of two trees. The widths of the street canyons from left to right are 10, 15, and 20 m, respectively. Additionally, it is convenient to find the position of the sections (y = 0, 1.5, 3 m) more clearly as mentioned in Section 4. We mark them in the Figure 1d.
3. CFD Methodology
3.1. Mesh
The following steps were used for mesh generation of the above physical models: (1) a structured mesh of tree-free street canyon was generated, as shown in Figure 2a, with the mesh scale of 0.3 m in different directions; (2) The tree model geometry file in STL format is shown in Figure 2b. The mesh generated was firstly split, and the mesh points were aligned according to the tree surface geometry information using snappyHexMesh function. A serial of operations was iteratively performed with mesh quality control. Finally, the unstructured mesh of the street canyon with a fine tree model was obtained [24]. Figure 2c is the generated tree surface mesh, Figure 2d is the partially enlarged tree surface mesh, and Figure 2e is the surface mesh of the street canyon containing trees. The computational domain was generated by mesh generation of different physical models in Table 1 by the above steps.
3.2. Algorithm and Boundary Condition
The residual of different physical quantities was set to 10−5. The linear scheme was used for the diffusion term, and the Gamma scheme was used for convection [25,26]. The velocity and pressure in steady-state flow were coupled by SIMPLE algorithm (Semi-Implicit Method for Pressure Linked Equations) [27,28,29]. The velocity at the inlet was described by U = U0 (z/z0)α, where U0 is 4.7 m/s, z0 is 18 m, and α is 0.23 [30]. The two pollutant line sources were located on both sides of the trees at the bottom of the street canyon, with −2.7 m > x > −4.8 m and 2.7 m < x < 4.8 m in the x-direction. We assumed that trees and trees are closely connected. For the velocity, we adopted the Dirichlet boundary condition at the inlet and the Neumann boundary condition at the outlet and the top, and the slip boundary condition at both sides of the street canyon. More details regarding the boundary condition settings of different physical quantities can be found in the reference [24]. The physical quantities near the wall were solved by wall functions.
3.3. Case Setting
The case settings are shown in Table 1 below. There are six different cases in total. Case 1, Cases 2 and 3 are the parameters of the street canyon with different height–width ratios of the street canyon with trees, and Cases 4–6 are the parameters of the street canyon with different tree layouts in a wide street canyon.
4. Verification
4.1. Mesh Independence Verification
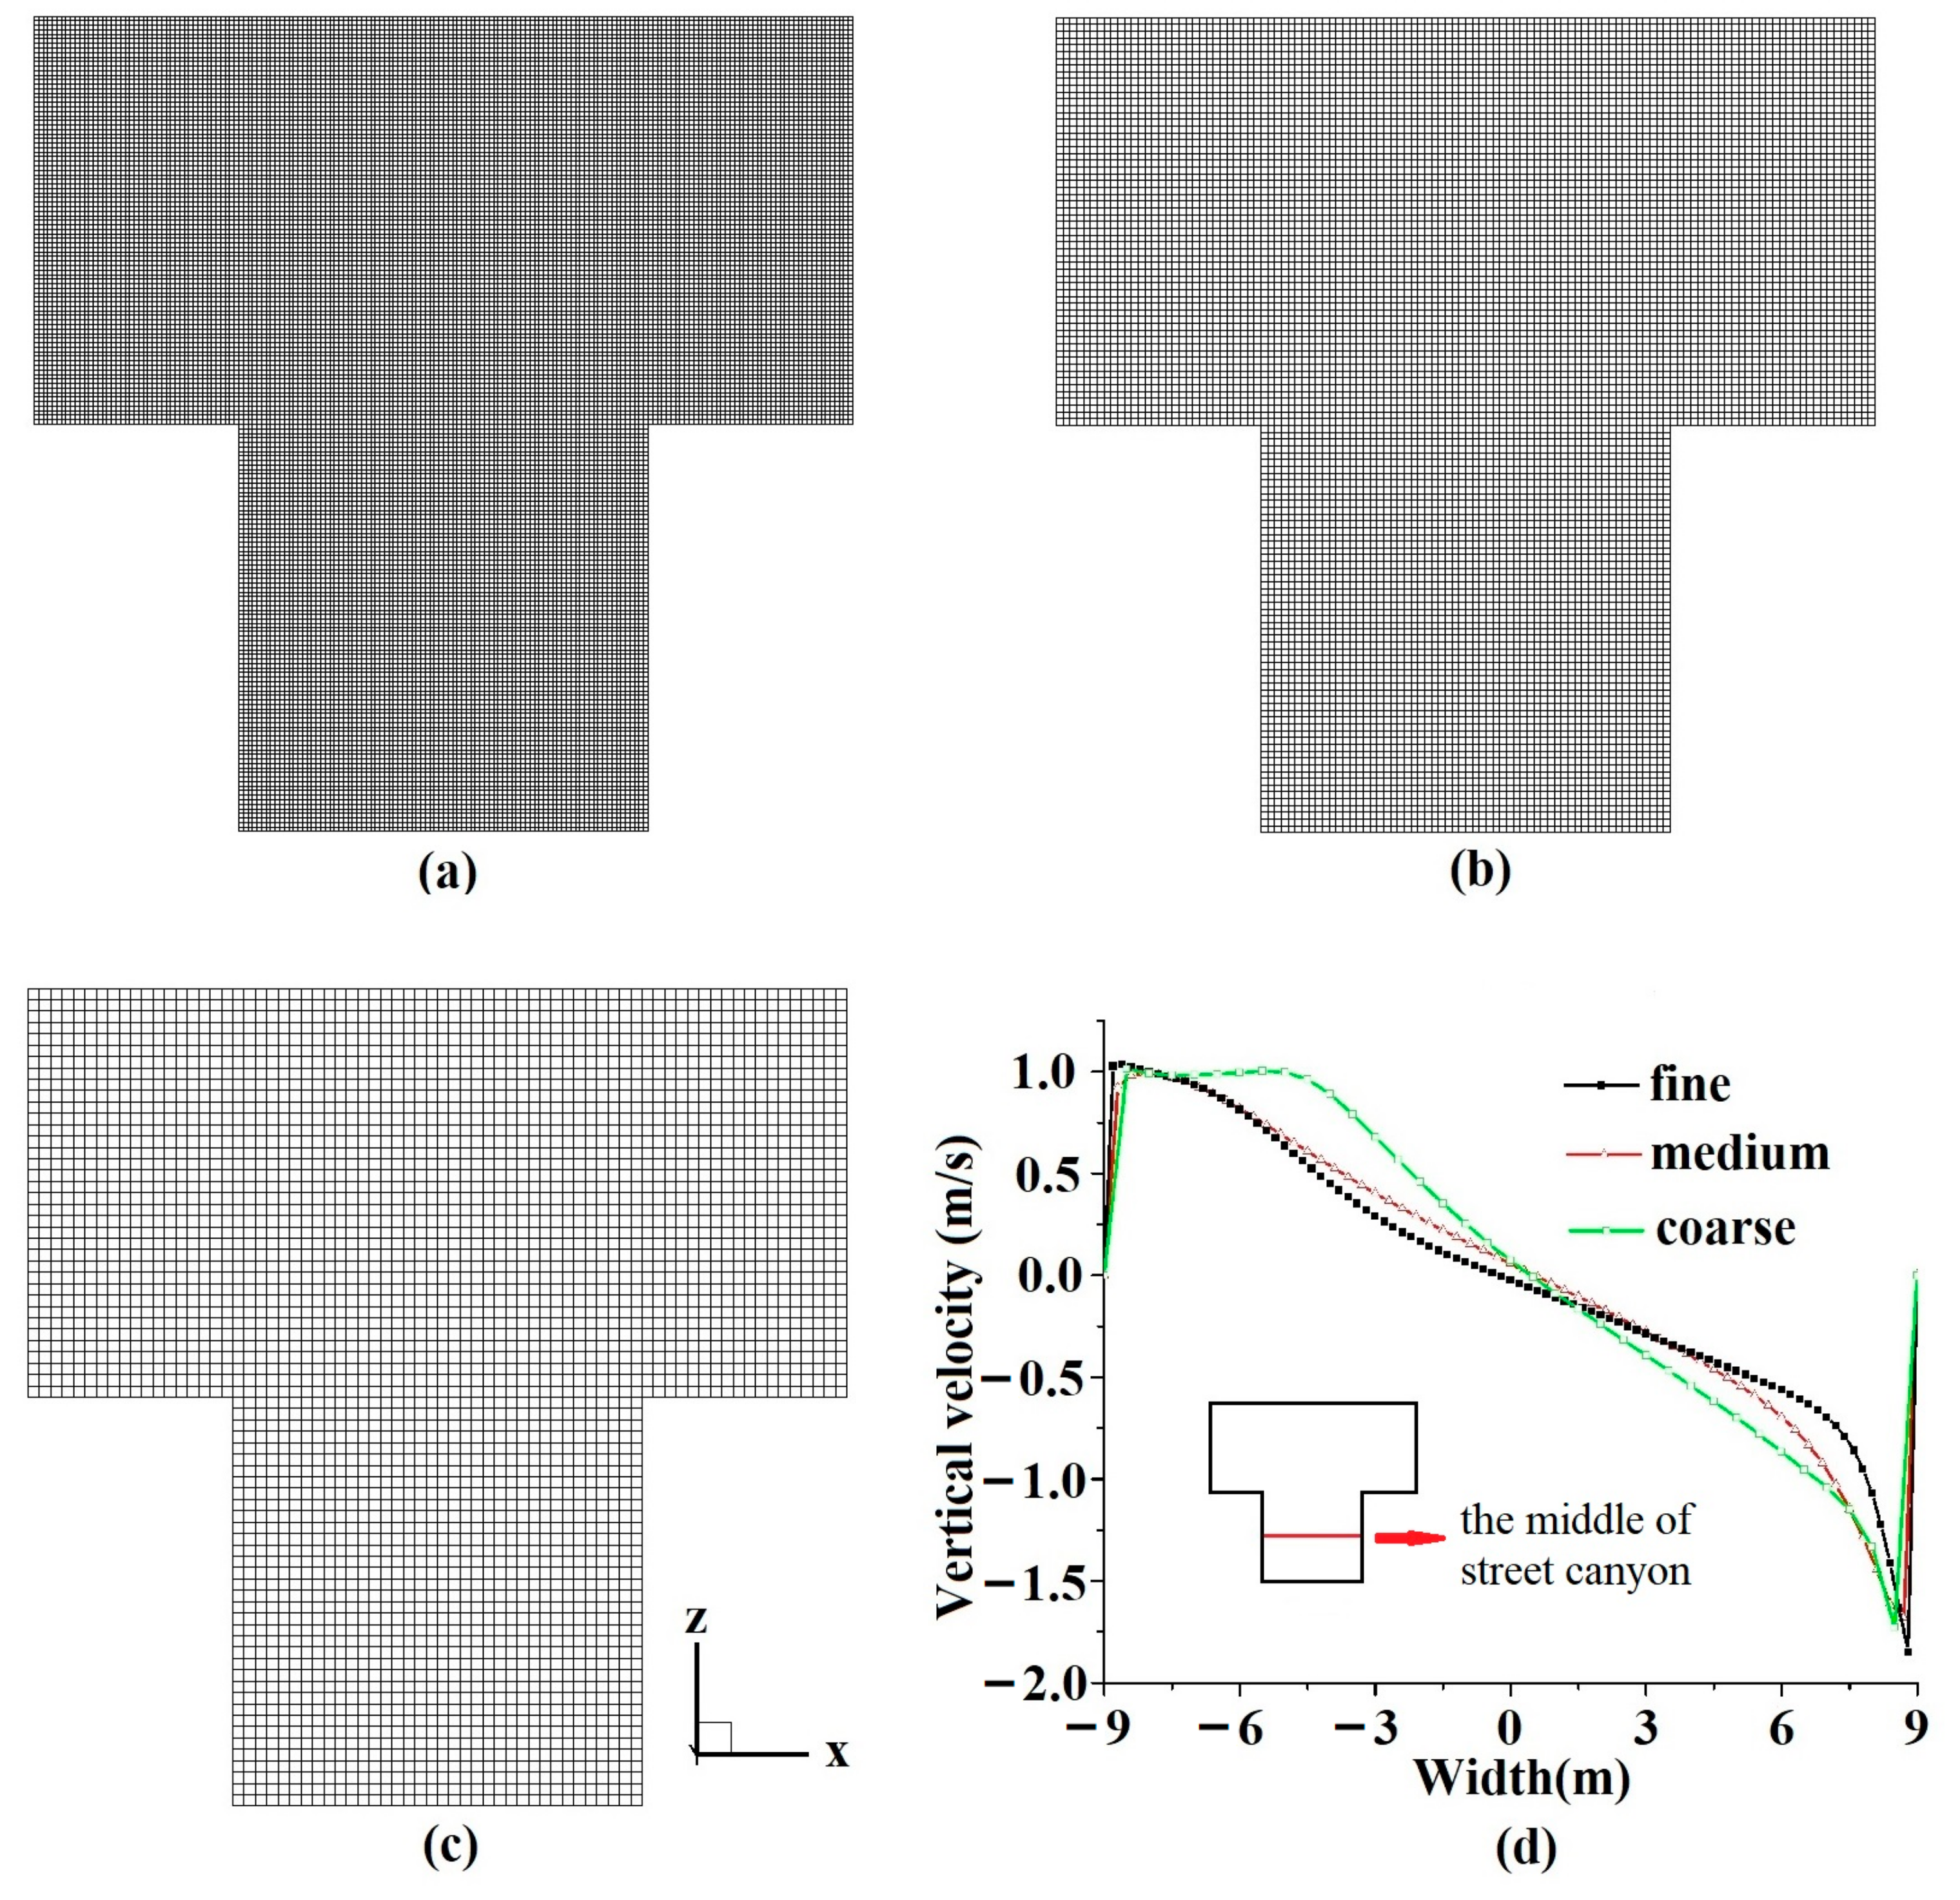
The computational domain of Case 1 in Table 1 was carried out by different mesh division scales in order to explore the appropriate mesh division in numerical calculation. Figure 3a–c show the mesh division in the street canyon at the y = 0 m section with the mesh scale of 0.2 m, 0.3 m, and 0.5 m, and the total mesh number of 1,215,000 (fine), 356,400 (medium) and 77,760 (coarse), respectively. Figure 3d gives the vertical velocity distribution at the y = 0 m section in the middle of the street canyon obtained by the calculation model and method in this paper and shows the very similar calculation results obtained at the mesh scale of 0.2 and 0.3 m and better calculation results at 0.2 and 0.3 m than at 0.5 m. Considering the calculation resources and accuracy, the mesh scale of 0.3 m was selected for mesh division.
4.2. Velocity Verification
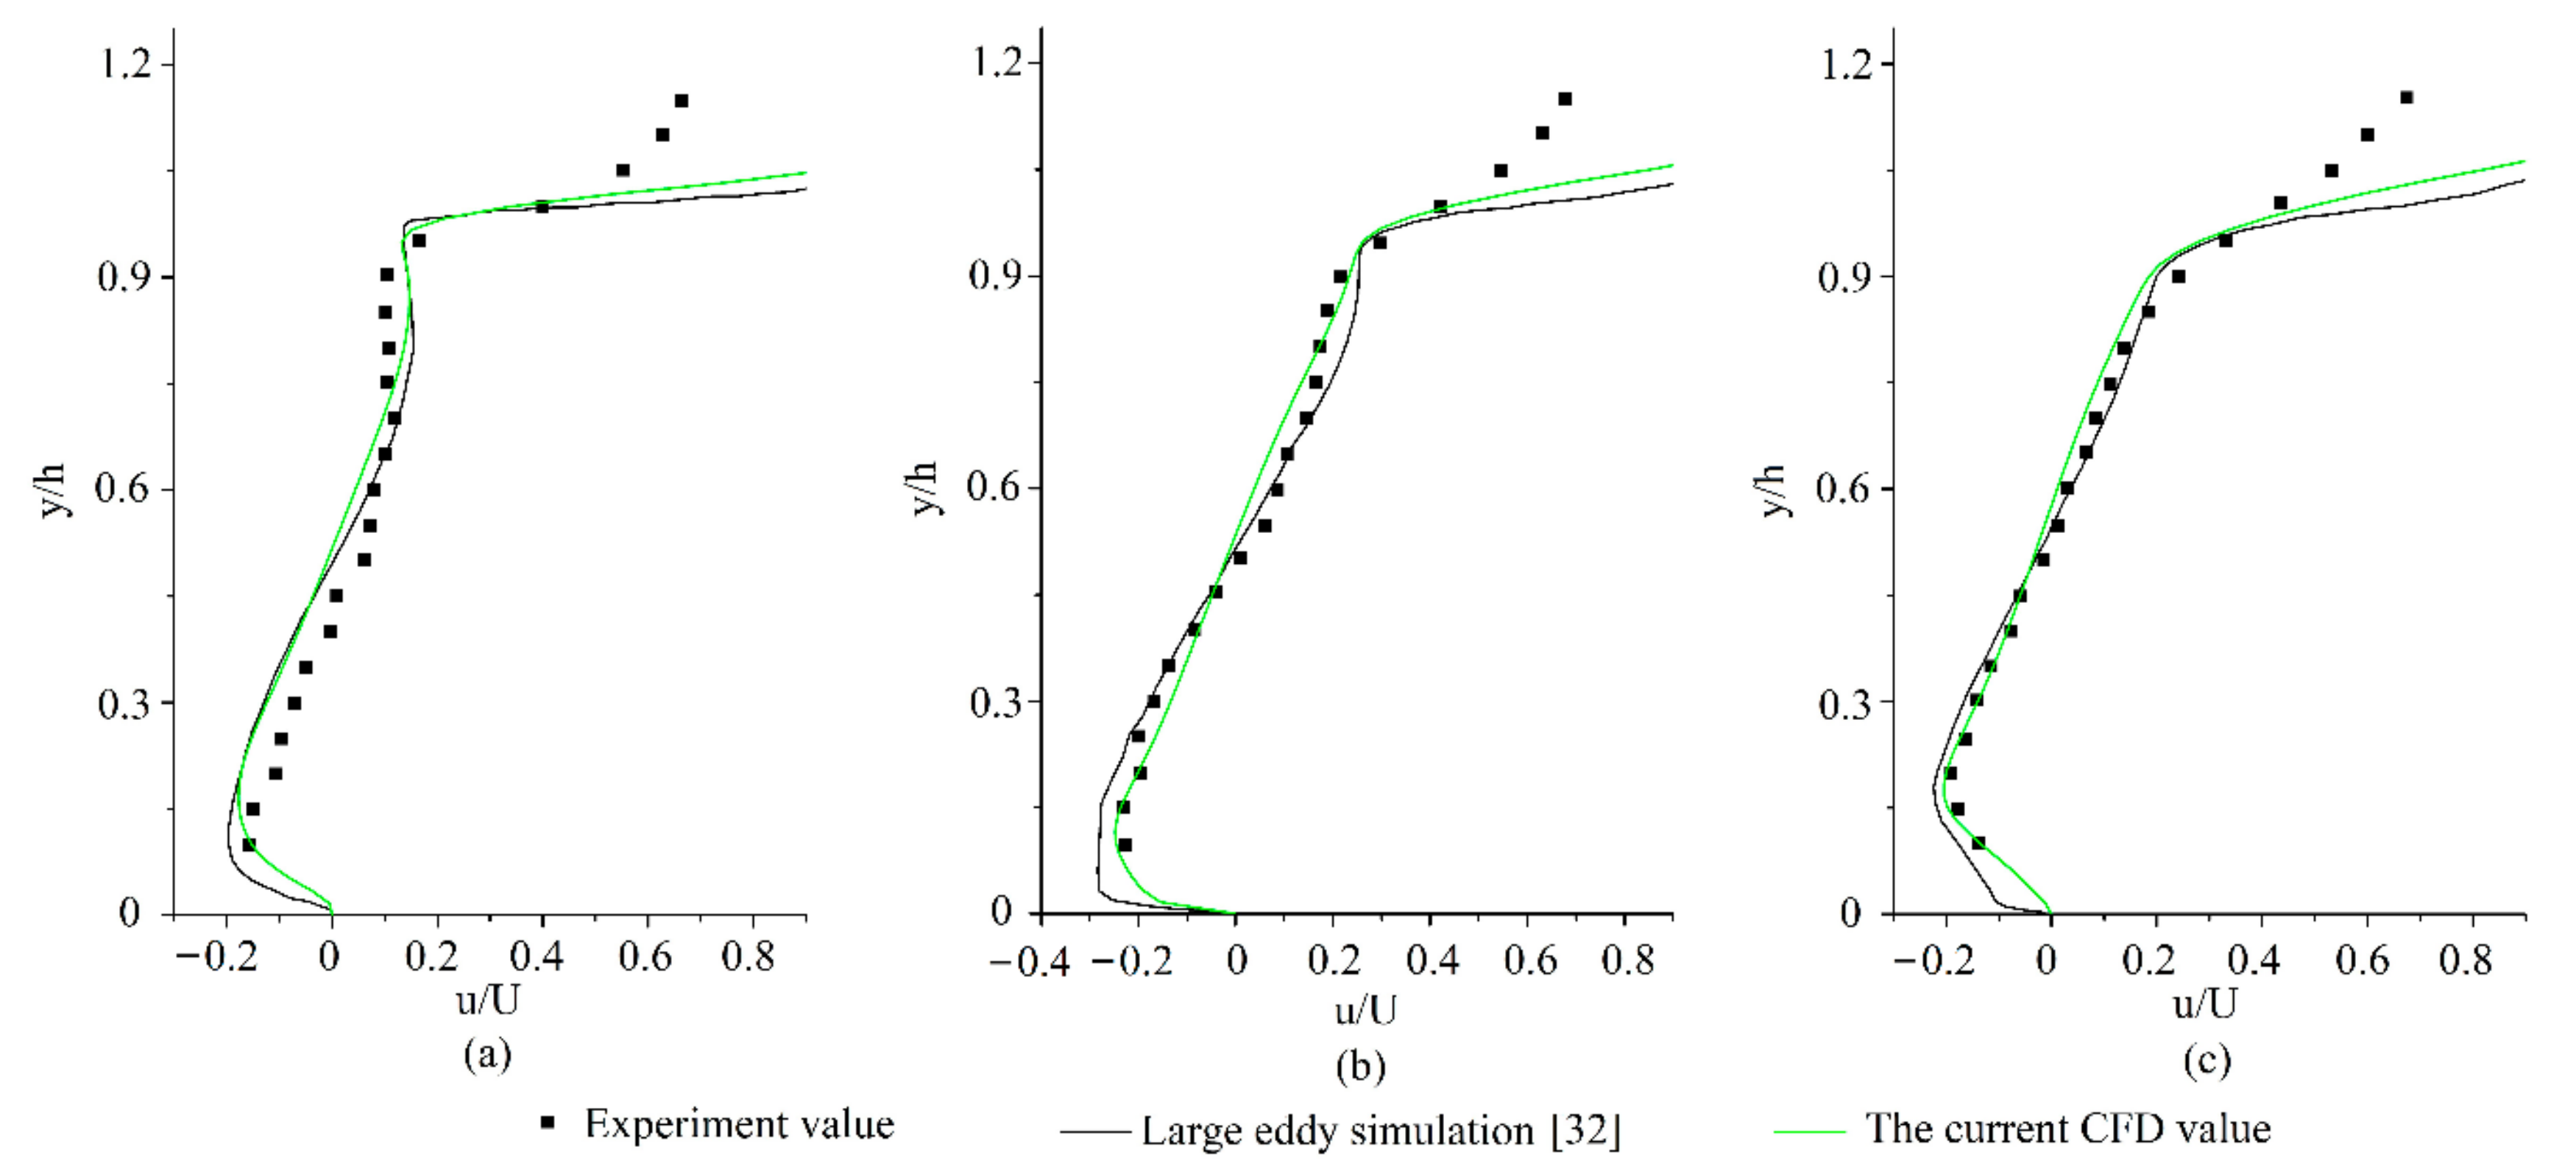
The numerical algorithm and turbulence model used are the same as those used in our previous research. As shown in Figure 4, we used the water-channel experiments used by Li et al. [31] to simulate the velocity in the street canyon in order to study the accuracy of the numerical algorithm at steady-state. At different locations of the computational model (x = 0.25 H, 0.5 H, 0.75 H), the numerical simulation results are in good agreement with the experimental results [31] and numerical simulation results using large eddy simulation [32], meaning that the algorithm in this paper can be used for the numerical simulation research of pollutant diffusion and airflow in the street canyon under the influence of trees. Only the urban street canyon was used to simulate the air flow to lower the computational loads. So, there are different normalized velocities above the street canyon when comparing experimental data [20].
5. Result and Discussion
5.1. Flow Field
The structure of the flow field in the street canyon is affected by three factors, including street canyon morphology, number of trees in the street canyon, and tree spacing. Figure 5a shows the structure of the flow field in the street canyon with a height–width ratio of 1:1 in the existence of a tree. The air sheared by the windward building in the street canyon flows along the surfaces of the windward buildings. Due to the block effect of the tree branches in the middle of the street canyon, the flow field is complex. Figure 5b shows the streamline in the deep street canyon (with a height–width ratio of 2) with a tree and reveals that a large vortex exists in the street canyon. This is mainly because the tree trunks and branches block the airflow and the flow direction and intensity changed synchronously. As shown in Figure 5c, there is also a vortex in the street canyon. This means that the height–width ratio does not affect the number of vortices in the street canyon with a tree. Figure 5d–f show that the tree spacing affects the airflow in the wide street canyon (with a height-width-ratio of 1:2) in the presence of two trees. Although the flow field in the street canyon is more complicated in different cases, a flat vortex is formed. However, such a vortex is different in shape and center in different cases, possibly due to the fact that the air easily flows to the area without tree branches (with smaller blocking effect) because of the arrangement of the two trees.
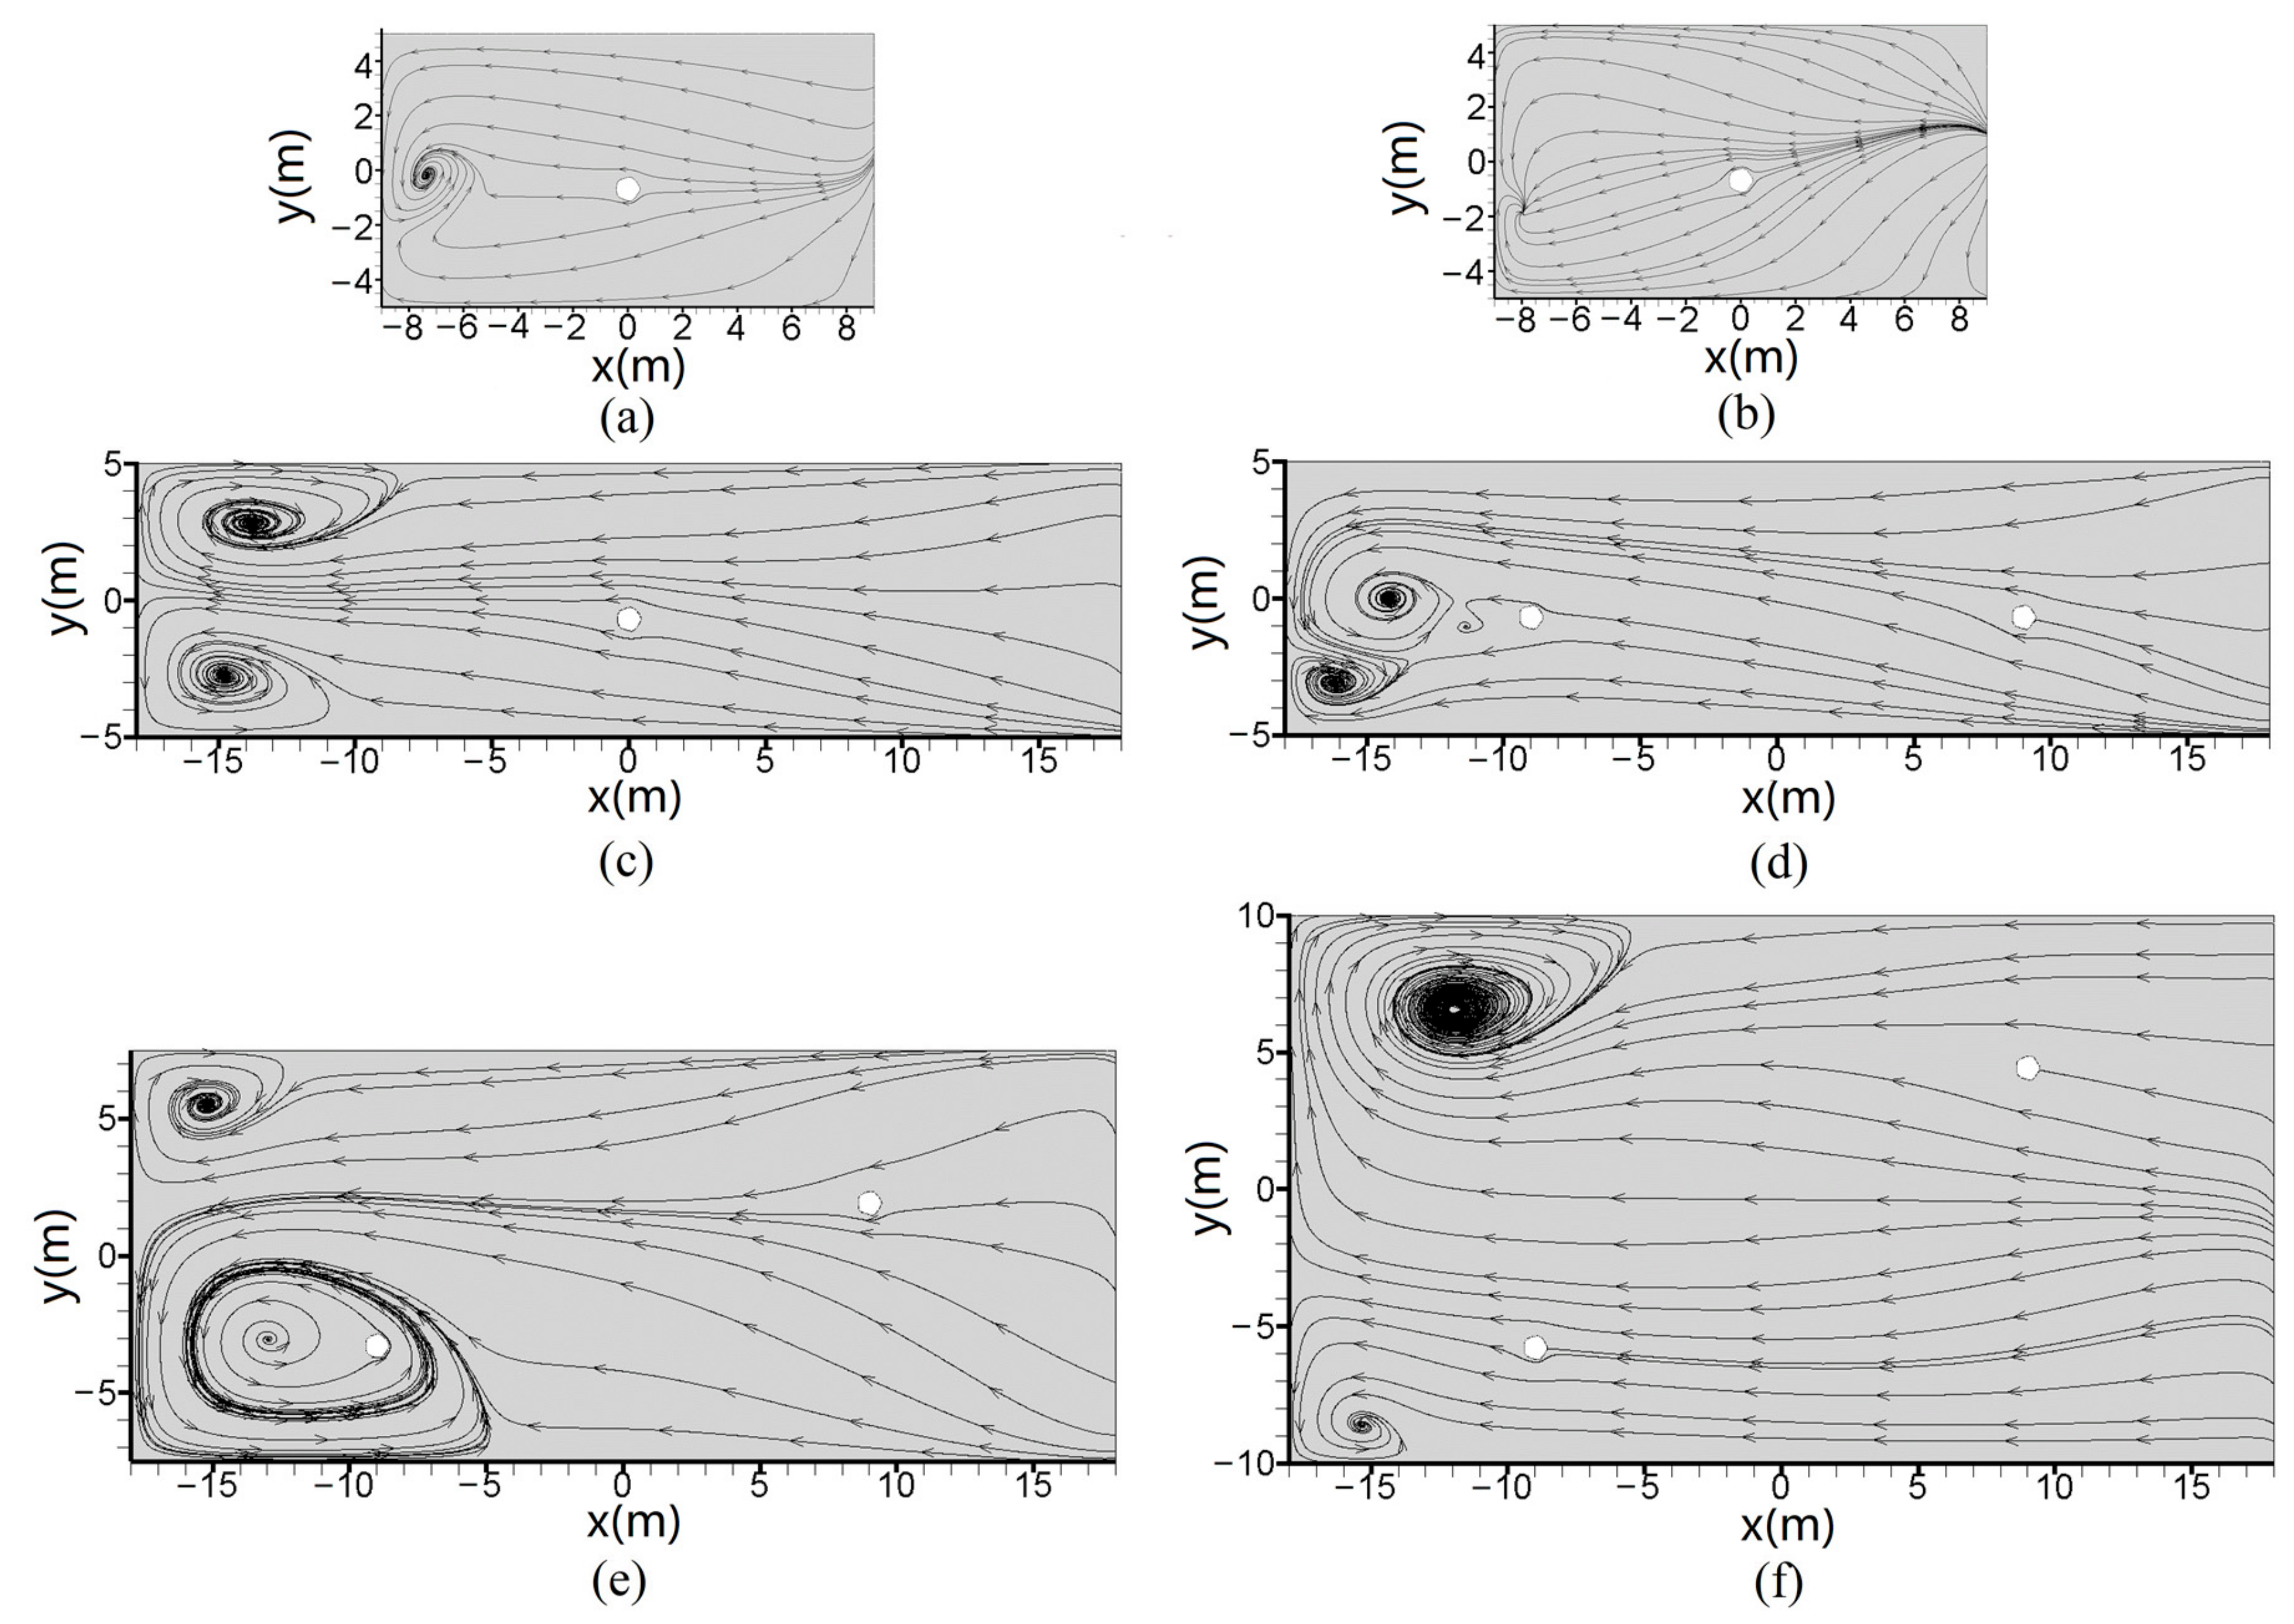
Figure 6 gives the flow field in a horizontal section of the canyon at z = −16.5 m. In Figure 6a, the air consistently flows from the windward side to the leeward side of the street canyon with a tree. In Figure 6b, the air flows around the tree trunks in the middle of the street canyon first and then along both sides of the street canyon to the leeward side under the influence of a single tree in the deep street canyon. In Figure 6c, the air also goes around the tree trunk and forms two approximately symmetrical vortices on the leeward side of the street canyon under the influence of a single tree in the wide street canyon. It is worth mentioning that the shape of the tree canopy in this paper is not completely symmetrical, but a self-similar structure; that is to say, the incomplete symmetry of the canopy structure does not significantly affect the approximate symmetry of the airflow field structure in the lower part of the street canyon. In Figure 6d–f, the airflow deflects under the influence of the tree trunks close to the windward side during the flow from the leeward side to the windward side due to the blocking effect of the trunks’ distance in the y-direction between two trees. In addition, different distances in the y-direction between two trees may cause a more complicated flow field. Moreover, one stream of air flows along the walls of the street canyon on both sides and the other stream flows between the two tree trunks at the leeward side of the street canyon and forms the vortices with different sizes. Especially in Figure 6f, the airflow direction changes significantly during the flow from the windward to the leeward side due to the largest gap between the two trees. For the same reason, there is no significant difference in the flow direction between the middle and the windward side of the street canyon. It should be noted that the boundary conditions on both lateral sides of the street canyon influence the air flow.
5.2. Velocity
As shown in Figure 7, the velocity distribution at y = 0, 1.5 and 3 m in the street canyon in different cases is given. In Figure 7a, the distribution area of low velocity is in the middle at different y-axis sections. As can be seen from Figure 7b, the low-velocity areas in the deep street canyon at different sections distribute in the middle of the street canyon in a vertical stripe in the presence of a single tree, and shrink and move up because the influence of the trunk on the air velocity weakens with increasing distance from the tree trunk at the y-axis direction. In Figure 7c, the low-velocity areas in the wide street canyon at different sections mainly distribute in the right area of the tree canopy, and a step change of the velocity distribution occurs at the bottom of the y = 0 m section due to the blocking effect of the nearby tree trunk. In Figure 7d–f, the tree-planting patterns affect the velocity distribution in the street canyon in the presence of two trees in the wide street canyon. As shown in Figure 7d, when the two trees are arranged in parallel without spacing between them, the low-velocity areas at different sections mainly distribute in the canopy and its surrounding areas between two trees and have a much bigger distribution area than that in Figure 7c. The low-velocity areas scatter outside the two tree canopies in the overlapping area of two trees (at y = 0 and 1.5 m), as shown in Figure 7e. The reason is that the air may flow through the area between the two trees. The airflow field structure shown in Figure 6e can also prove this phenomenon. In addition, the low-velocity area distributes around the canopy near the windward side at y = 3 m, mainly because of the high velocity without trees on the leeward side. In Figure 7f, at the maximum spacing between two trees in the street canyon, the low-velocity area distributes only around the canopy due to no overlapping area between the two trees. It should be noted that the air blocking and flow-around effects of tree branches affect the velocity distribution, and the structural complexity of tree branches and tree layout aggravates the complexity of velocity distribution, so the predicted velocity distribution may differ due to ignorance of the influence of tree branches.
5.3. Pollutant
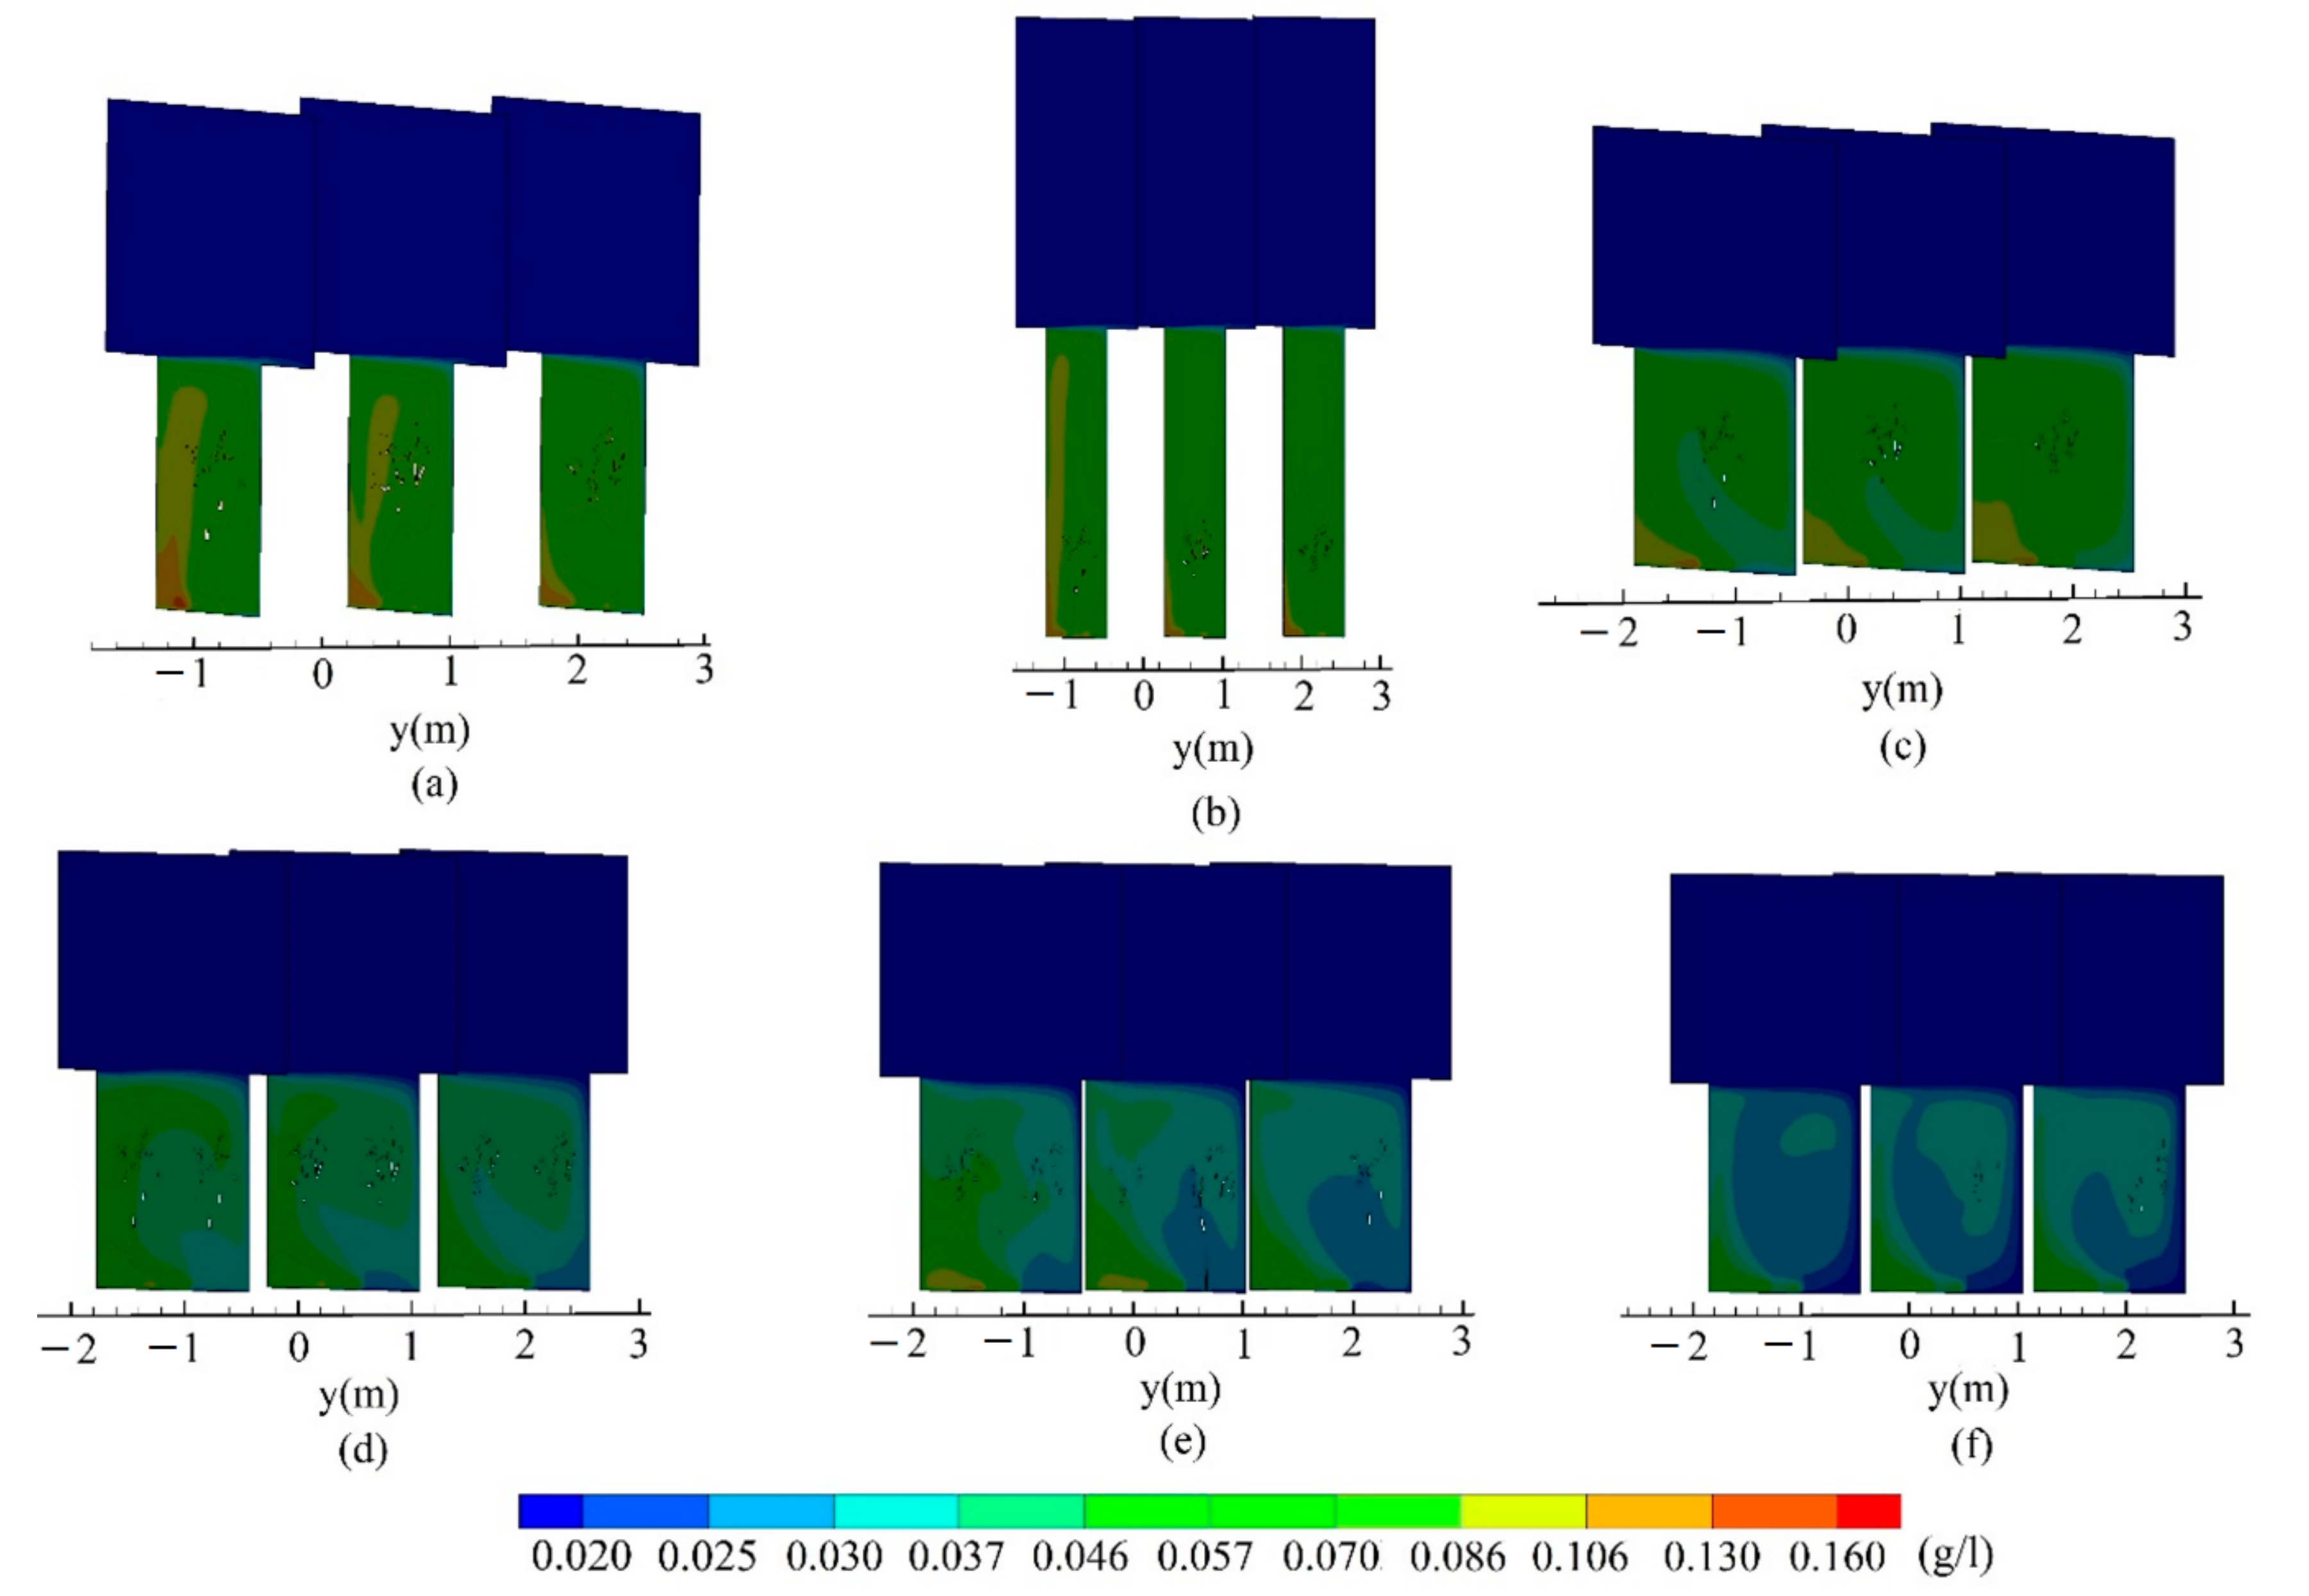
Figure 8 gives the pollutant concentration distribution at y = 0, 1.5, and 3 m in different cases. In Figure 8a, with a tree in the street canyon, the maximum pollutant concentration in the street canyon occurs at the bottom of the leeward side at y = 0 m due to being near the trunk in the y-axis direction, decreasing with increasing height. This is because the trunk blocks and weakens the air flow speed, and thus the transport of pollutants is more difficult. Figure 8b shows that the pollutant concentration on the leeward side of the deep street canyon is much higher at y = 0 m than that at other sections, maybe due to the fact that the pollutant has difficulty flowing from the bottom to the middle and outside of the street canyon because of the weakened air velocity at the bottom around trunk. As can be seen from Figure 8c, when only one tree exists in the wide street canyon, the high pollutant concentration areas exist from the bottom to the leeward side of the street canyon, with a small difference in pollutant concentration distribution between different sections. Figure 8d shows the difference in pollutant concentration distribution between different sections in the wide street canyon in the presence of two trees in parallel. The pollutant concentration on the windward side is significantly less at y = 3 m than at y = 1.5 and 0 m, possibly due to the fact that the branches occupy such a small space that the air easily flows and thereby the pollutant concentration reduces. Figure 8e shows that at a bigger spacing between two trees, the pollutant concentration is smaller at y = 3 m than at y = 1.5 and 0 m, especially in the windward area. The reason for this may be that some pollutants flow out of the street canyon because of higher air velocity at y = 3 m, where there are only trees near the windward area, than at y = 1.5 and 0 m, where two trees overlap. At y = 0 m, the air flows slowly and the pollutants difficultly diffuse due to two trees overlap. Figure 8f shows lower pollutant concentration in different sections than Figure 8d,e mainly because the air flows faster under the small blocking effect of the branches at y = 0 and 1.5 m, where the canopy edge areas are located.
The pollutant concentration distribution at pedestrian height is closely related to the health of urban residents in the street canyon. Figure 9 shows the pollutant concentration distribution in different cases at pedestrian height. As shown in Figure 9a–f, high pollutant concentration distributions are complicated and significantly different on the leeward side in the street canyon in different cases. In Figure 9a,b, high pollutant concentrations mainly distribute in the negative y-direction of the leeward side in the deep street canyon under the influence of a single tree in the middle. Figure 9c shows that the high pollutant concentrations mainly distribute in the positive y-direction of the leeward side in the wide street canyon, contrary to Figure 9b. As can be seen from Figure 9d–f, in the presence of two trees, the high pollutant concentration distribution constantly changes on both sides of the bottom of the street canyon, possibly due to the fact that the pollutants accumulate on the left or right side of the leeward side because the air laterally flows under the influence of trees in the street canyon. It can be found by comparing Figure 6d vs. Figure 9d, Figure 6e vs. Figure 9e, Figure 6f vs. Figure 9f that under the influence of trees, the high pollutant concentration distribution is related to the flow field and the high pollutant concentration usually distributes in the master vortex control area with a large leeward side.
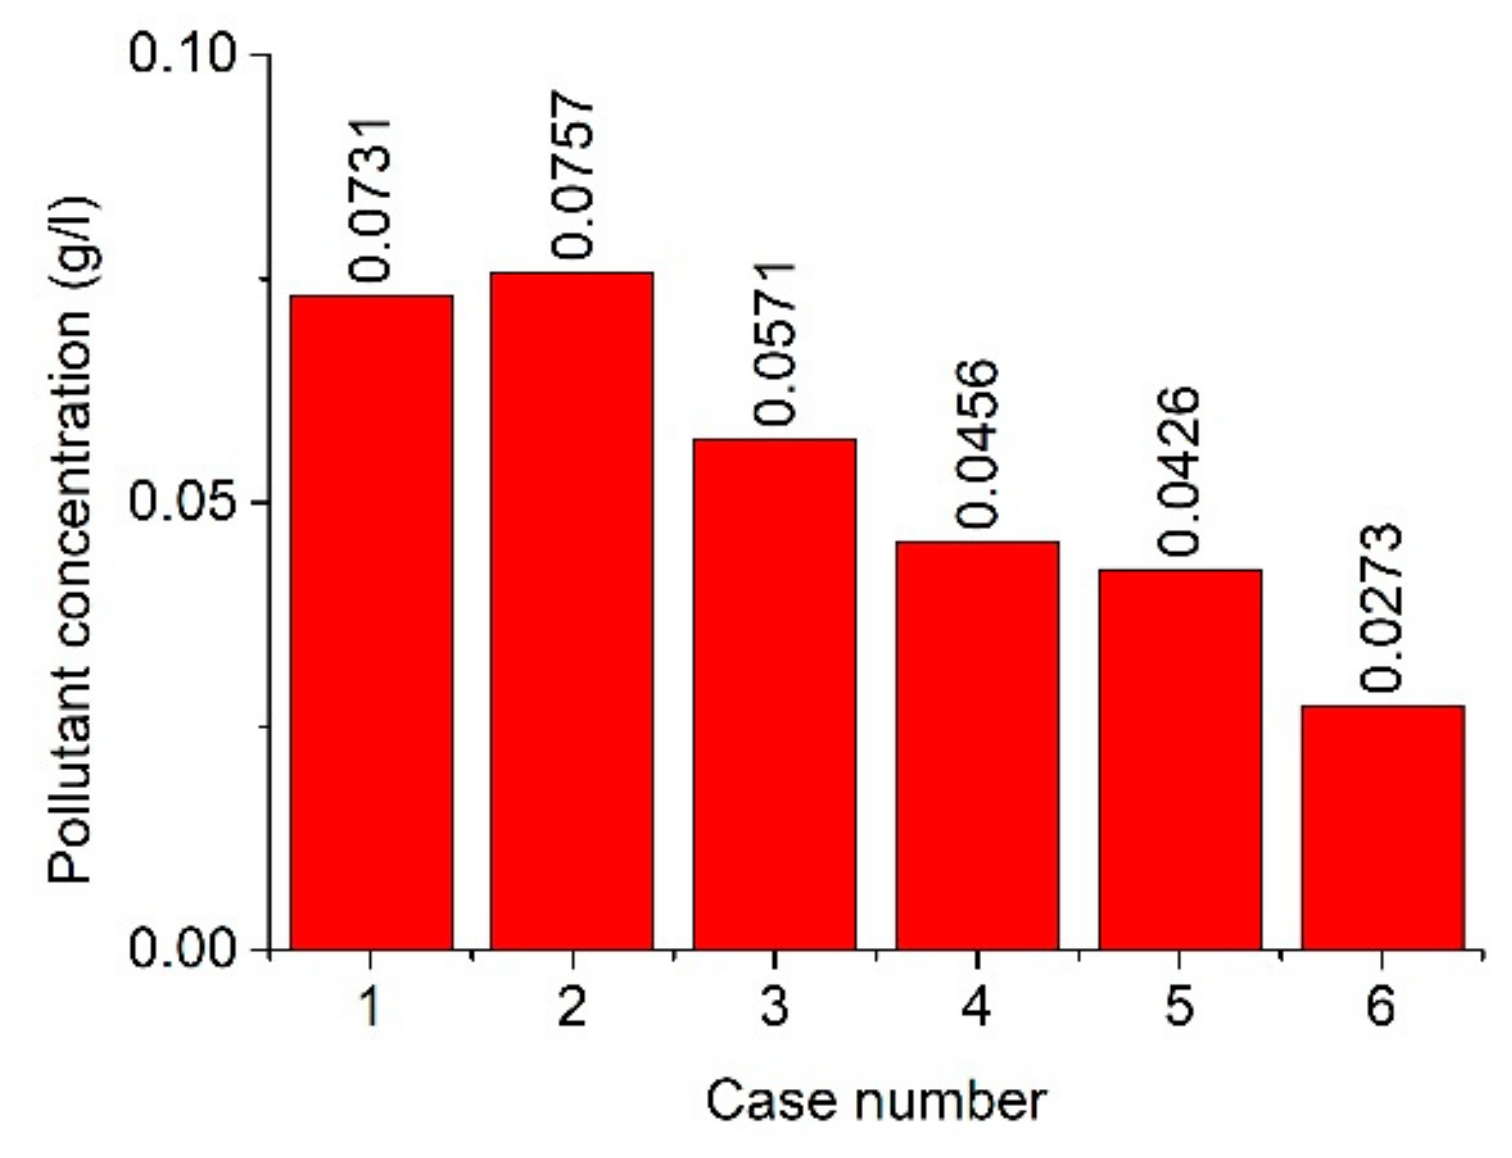
The spatial average pollutant concentrations in the street canyon in different cases are given in Figure 10. Among them, Case 2 (deep street canyon with single tree) has the highest average concentration value, 0.0757 g/L, 3.5% higher than that in Case 1. Generally speaking, the pollutant concentration is significantly higher in the deep street canyon than in the street canyon with a height–width ratio of 1:1, mainly because the pollutants have difficulty flowing outside the street canyon due to the weak circulation intensity in the deep street canyon. This means that pollutants accumulate in the deep street canyon. In this study, the deep street canyon has high inlet velocity and thereby a lower increase in pollutant concentration than the street canyon with a height–width ratio of 1:1. In addition, although Case 3 has only one tree, it has much higher pollutant concentration than Cases 4–6. This is caused by the fact that the tree, located in the middle of the street canyon in Case 3, weakens the air velocity in the street canyon. As a result, it is difficult for the pollutants to move out of the street canyon. In Cases 4–6, the spacing between trees increases, so the circulation intensity in the street canyon improves and the pollutant concentration decreases. It is worth mentioning that Cases 4 and 5 have similar pollutant concentrations, 0.0456 and 0.0426 g/L, respectively, in the street canyon, but Case 6 has the pollutant concentration of 0.0273 g/L, meaning that smaller tree spacing leads to smaller decrease in average pollutant concentration in the street canyon. What is more, when the inflow speed becomes larger or the wind direction is parallel to the street canyon, the pollutant is easier to transport.
6. Conclusions
- (1)
- Due to the blocking effect of the tree, the flow field structure is relatively complicated in the street canyon. The height–width ratio of the street canyon does not affect the number of vortices in the street canyon, and the street canyon is controlled by a vortex. The air easily flows from the pore area between the two trees due to difference in tree spacing.
- (2)
- The discontinuous low-velocity area appears around the tree canopy and the trunk at the bottom of the street canyon. The low-velocity area in the deep street canyon is thin and long, and the low-velocity area in the wide street canyon is like the windward side. Influenced by the spacing between two trees, the velocity is lower around and between two tree canopies.
- (3)
- The tree canopy and trunk are anisotropic, such that the pollutants distribute unevenly in the y-axis direction in the street canyon. At pedestrian height, the high pollutant concentration distribution constantly changes on both sides of the leeward side of the street canyon due to the height–width ratio of the street canyon and the layout of trees. The street canyon has a low average pollutant concentration at large y-axis direction spacing between two trees.
Although this study reveals the influence of tree layout and street canyon shape factors on pollutant diffusion and air flow, there are still many scientific factors to be investigate in future research, including the reasonable setting of boundary conditions, wind direction, branch movement, different tree species, etc.
Author Contributions
L.W. and J.S. proposed the main framework of the paper. L.W. and J.S. mainly wrote the paper. Z.G. and Q.S. proofread the paper. All authors have read and agreed to the published version of the manuscript.
Funding
This work was supported by the National Science and Technology Major Project (No. 2016ZX05011001), the Natural Science Basic Research Plan in Shaanxi Province of China (2019-JQ335), and the National Natural Science Foundation of China (Nos. 11572242, 41861144021, 11872295).
Conflicts of Interest
The authors declare no conflict of interest.
References
- Buccolieri, R.; Santiago, J.L.; Rivas, E.; Sanchez, B. Review on urban tree modelling in CFD simulations: Aerodynamic, deposition and thermal effects. Urban For. Urban Gree. 2018, 31, 212–220. [Google Scholar] [CrossRef]
- Chen, L.; Liu, C.; Zhang, L.; Zou, R.; Zhang, Z. Variation in Tree Species Ability to Capture and Retain Airborne Fine Particulate Matter (PM2.5). Sci. Rep. UK 2017, 7, 3206. [Google Scholar] [CrossRef] [PubMed]
- Hefny Salim, M.; Heinke Schlünzen, K.; Grawe, D. Including trees in the numerical simulations of the wind flow in urban areas: Should we care? J. Wind Eng. Ind. Aerod. 2015, 144, 84–95. [Google Scholar] [CrossRef] [Green Version]
- Gromke, C.; Ruck, B. Influence of trees on the dispersion of pollutants in an urban street canyon—Experimental investigation of the flow and concentration field. Atmos. Environ. 2007, 41, 3287–3302. [Google Scholar] [CrossRef] [Green Version]
- Gromke, C.; Buccolieri, R.; Sabatino, S.D.; Ruck, B. Dispersion study in a street canyon with tree planting by means of wind tunnel and numerical investigations evaluation of CFD data with experimental data. Atmos. Environ. 2008, 42, 8640–8650. [Google Scholar] [CrossRef]
- Buccolieri, R.; Gromke, C.; Sabatino, S.D.; Ruck, B. Aerodynamic effects of trees on pollutant concentration in street canyons. Sci. Total Environ. 2009, 407, 5247–5256. [Google Scholar] [CrossRef]
- Gromke, C.; Ruck, B. Pollutant concentrations in street canyons of different aspect ratio with avenues of trees for various wind directions. Bound-Lay. Meteorol. 2012, 144, 41–64. [Google Scholar] [CrossRef] [Green Version]
- Sun, D.; Zhang, Y. Influence of avenue trees on traffic pollutant dispersion in asymmetric street canyons: Numerical modeling with empirical analysis. Transport Res. D-Transp. Environ. 2018, 65, 784–795. [Google Scholar] [CrossRef]
- Huang, Y.D.; Li, M.Z.; Ren, S.Q.; Wang, M.J.; Cui, P.Y. Impacts of tree-Planting pattern and trunk height on the airflow and pollutant dispersion inside a street canyon. Build. Environ. 2019, 165, 106385. [Google Scholar] [CrossRef]
- Wang, C.H.; Li, Q.; Wang, Z.H. Quantifying the impact of urban trees on passive pollutant dispersion using a coupled large-Eddy simulation–Lagrangian stochastic model. Build. Environ. 2018, 145, 33–49. [Google Scholar] [CrossRef]
- Jeanjean, A.P.R.; Buccolieri, R.; Eddy, J.; Monks, P.; Leigh, R.J. Air quality affected by trees in real street canyons: The case of Marylebone neighbourhood in central London. Urban For. Urban Gree. 2017, 22, 41–53. [Google Scholar] [CrossRef]
- Hong, B.; Qin, H.; Lin, B. Prediction of wind environment and indoor/outdoor relationships for PM2.5 in different building-Tree grouping patterns. Atmos.-Basel 2018, 9, 39. [Google Scholar] [CrossRef] [Green Version]
- Gu, Z.L.; Zhang, Y.W.; Lei, K.B. Large eddy simulation of flow in a street canyon with tree planting under various atmospheric instability conditions. Sci. China Technol. Sci. 2010, 53, 1928–1937. [Google Scholar] [CrossRef]
- Wang, Z.H. Monte Carlo simulations of radiative heat exchange in a street canyon with trees. Sol. Energy 2014, 110, 704–713. [Google Scholar] [CrossRef] [Green Version]
- Merlier, L.; Jacob, J.; Sagaut, P. Lattice-Boltzmann Large-Eddy Simulation of pollutant dispersion in street canyons including tree planting effects. Atmos. Environ. 2018, 195, 89–103. [Google Scholar] [CrossRef] [Green Version]
- Mcnabola, A.; Broderick, B.M.; Gill, L.W. A numerical investigation of the impact of low boundary walls on pedestrian exposure to air pollutants in urban street canyons. Sci. Total Environ. 2009, 407, 760–769. [Google Scholar] [CrossRef]
- Hao, C.R.; Xie, X.M.; Huang, Y.; Zhen, H. Study on influence of viaduct and noise barriers on the particulate matter dispersion in street canyons by CFD modeling. Atmos. Pollut. Res. 2019, 10, 1723–1735. [Google Scholar] [CrossRef]
- Murena, F.; Mele, B. Effect of balconies on air quality in deep street canyons. Atmos. Pollut. Res. 2016, 7, 1004–1012. [Google Scholar] [CrossRef] [Green Version]
- Hong, S.W.; Zhao, L.; Zhu, H. CFD simulation of airflow inside tree canopies discharged from air-Assisted sprayers. Comput. Electron. Agric. 2018, 149, 121–132. [Google Scholar] [CrossRef]
- Zhang, K.; Chen, G.; Wang, X.; Liu, S.; Mak, C.M.; Fan, Y.; Hang, J. Numerical evaluations of urban design technique to reduce vehicular personal intake fraction in deep street canyons. Sci. Total Environ. 2019, 653, 968–994. [Google Scholar] [CrossRef]
- Amorim, J.H.; Rodrigues, V.; Tavares, R.; Valente, J.; Borrego, C. CFD modelling of the aerodynamic effect of trees on urban air pollution dispersion. Sci. Total Environ. 2013, 461–462, 541–551. [Google Scholar] [CrossRef] [PubMed]
- Su, J.W.; Wang, L.; Gu, Z.L.; Song, M.M.; Cao, Z.R. Effects of real trees and their structure on pollutant dispersion and flow field in an idealized street canyon. Atmos. Pollut. Res. 2019, 10, 1699–1710. [Google Scholar] [CrossRef]
- OpenCFD. OpenFOAM. 2011. Available online: www.openfoam.com (accessed on 8 June 2019).
- Wang, L.; Su, J.W.; Gu, Z.L.; Tang, L.Y. Numerical Study on Flow Field and Pollutant Dispersion in an Ideal Street Canyon within a Real Tree Model at Different Wind Velocities. Comput. Math. Appl. 2020. [Google Scholar] [CrossRef]
- Crank, J.; Phyllis, N. A practical method for numerical evaluation of solutions of partial differential equations of the heat-Conduction type. Math. Proc. Camb. Philos. Soc. 1947, 43, 50–67. [Google Scholar] [CrossRef]
- Jasak, H. Error Analysis and Estimation for the Finite Volume Method with Application to Fluid Flow; Imperial College London: London, UK, 1996. [Google Scholar]
- Patankar, S.V.; Spalding, D.B. A calculation procedure for heat, mass and momentum transfer in three-Dimensional parabolic flows. Int. J. Heat Mass Tran. 1972, 15, 1787–1806. [Google Scholar] [CrossRef]
- Patankar, S. Numerical Heat Transfer and Fluid Flow; Hemisohere Publishing Corporation: Washington, DC, USA, 1980; pp. 131–134. [Google Scholar]
- Li, W.; He, Y.; Zhang, Y.; Su, J.W.; Chen, C.G.; Chuck, W.Y.; Zhang, R.J.; Gu, Z.L. LES simulation of flow field and pollutant dispersion in a street canyon under time-varying inflows with TimeVarying-SIMPLE approach. Build. Environ. 2019, 157, 185–196. [Google Scholar] [CrossRef]
- Kastner-Klein, P.; Plate, E.J. Wind-Tunnel study of concentration fields in street canyons. Atmos. Environ. 1999, 33, 3973–3979. [Google Scholar] [CrossRef]
- Li, X.X.; Leung, D.Y.C.; Liu, C.H.; Lam, K.M. Physical modeling of flow field inside urban street canyons. J. Appl. Meteorol. Clim. 2008, 47, 2058–2067. [Google Scholar] [CrossRef]
- Liu, C.H.; Barth, M.C.; Leung, D.Y.C. Large-eddy simulation of flow and pollutant transport in street canyons of different building-height-to-street width ratios. J. Appl. Meteorol. Clim. 2004, 43, 1410–1424. [Google Scholar] [CrossRef]
Figure 1.
Physical models of street canyons with different morphologies in the presence of trees. (a) Diagram of street canyon; (b) Physical model of a single tree; (c) Different shape; (d) Tree layout.
Figure 1.
Physical models of street canyons with different morphologies in the presence of trees. (a) Diagram of street canyon; (b) Physical model of a single tree; (c) Different shape; (d) Tree layout.

Figure 2.
Mesh. (a) Mesh of street canyon without tree; (b) Real tree model; (c) Tree surface mesh (d) Local surface mesh of tree; (e) Mesh of street canyon with trees.
Figure 2.
Mesh. (a) Mesh of street canyon without tree; (b) Real tree model; (c) Tree surface mesh (d) Local surface mesh of tree; (e) Mesh of street canyon with trees.

Figure 3.
Mesh and independence test. (a) fine mesh; (b) medium mesh; (c) coarse mesh; (d) comparison.
Figure 3.
Mesh and independence test. (a) fine mesh; (b) medium mesh; (c) coarse mesh; (d) comparison.

Figure 4.
Comparison of normalized velocities at different locations in the street canyon. (a) x = 0.25 H; (b) x = 0.5 H; (c) x = 0.75 H.
Figure 4.
Comparison of normalized velocities at different locations in the street canyon. (a) x = 0.25 H; (b) x = 0.5 H; (c) x = 0.75 H.

Figure 5.
Flow field in different three-dimensional cases. (a) Case 1; (b) Case 2; (c) Case 3; (d) Case 4; (e) Case 5; (f) Case 6.
Figure 5.
Flow field in different three-dimensional cases. (a) Case 1; (b) Case 2; (c) Case 3; (d) Case 4; (e) Case 5; (f) Case 6.

Figure 6.
Flow field in the street canyon in different cases at z = −16.5 m. (a) Case 1; (b) Case 2; (c) Case 3; (d) Case 4; (e) Case 5; (f) Case 6.
Figure 6.
Flow field in the street canyon in different cases at z = −16.5 m. (a) Case 1; (b) Case 2; (c) Case 3; (d) Case 4; (e) Case 5; (f) Case 6.

Figure 7.
Velocity distribution at different sections in different cases. (a) Case 1; (b) Case 2; (c) Case 3; (d) Case 4; (e) Case 5; (f) Case 6.
Figure 7.
Velocity distribution at different sections in different cases. (a) Case 1; (b) Case 2; (c) Case 3; (d) Case 4; (e) Case 5; (f) Case 6.

Figure 8.
Pollutant concentration distribution at different sections in different Cases. (a) Case 1; (b) Case 2; (c) Case 3; (d) Case 4; (e) Case 5; (f) Case 6.
Figure 8.
Pollutant concentration distribution at different sections in different Cases. (a) Case 1; (b) Case 2; (c) Case 3; (d) Case 4; (e) Case 5; (f) Case 6.

Figure 9.
Pollutant concentration distribution at pedestrian height. (a) Case 1; (b) Case 2; (c) Case 3; (d) Case 4; (e) Case 5; (f) Case 6.
Figure 9.
Pollutant concentration distribution at pedestrian height. (a) Case 1; (b) Case 2; (c) Case 3; (d) Case 4; (e) Case 5; (f) Case 6.

Figure 10.
Average pollutant concentration in street canyon in different cases.


Table 1.
Case Settings.
| Tree Number | H (m) | W1 (m) | W2 (m) | L (m) | H/W1 | Aim | |
|---|---|---|---|---|---|---|---|
| Case 1 | 1 | 18 | 18 | 36 | 10 | 1 | Height-width-ratio |
| Case2 | 1 | 36 | 18 | 36 | 10 | 2 | |
| Case3 | 1 | 18 | 36 | 54 | 10 | 0.5 | |
| Case 4 | 2 | 18 | 36 | 54 | 10 | 0.5 | Tree layout |
| Case 5 | 2 (distance 5 m) | 18 | 36 | 54 | 15 | 0.5 | |
| Case 6 | 2 (distance 10 m) | 18 | 36 | 54 | 20 | 0.5 |
© 2020 by the authors. Licensee MDPI, Basel, Switzerland. This article is an open access article distributed under the terms and conditions of the Creative Commons Attribution (CC BY) license (http://creativecommons.org/licenses/by/4.0/).
Share and Cite
MDPI and ACS Style
Wang, L.; Su, J.; Gu, Z.; Shui, Q. Effect of Street Canyon Shape and Tree Layout on Pollutant Diffusion under Real Tree Model. Sustainability 2020, 12, 2105. https://0-doi-org.brum.beds.ac.uk/10.3390/su12052105
AMA Style
Wang L, Su J, Gu Z, Shui Q. Effect of Street Canyon Shape and Tree Layout on Pollutant Diffusion under Real Tree Model. Sustainability. 2020; 12(5):2105. https://0-doi-org.brum.beds.ac.uk/10.3390/su12052105
Chicago/Turabian StyleWang, Le, Junwei Su, Zhaolin Gu, and Qingxiang Shui. 2020. "Effect of Street Canyon Shape and Tree Layout on Pollutant Diffusion under Real Tree Model" Sustainability 12, no. 5: 2105. https://0-doi-org.brum.beds.ac.uk/10.3390/su12052105
Note that from the first issue of 2016, this journal uses article numbers instead of page numbers. See further details here.