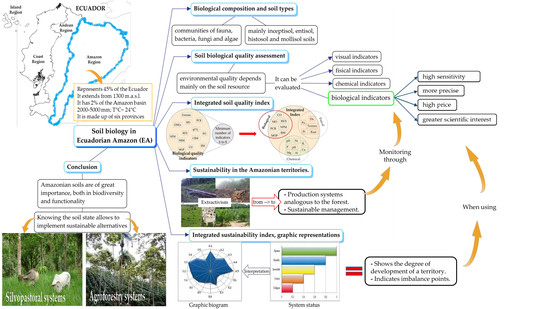
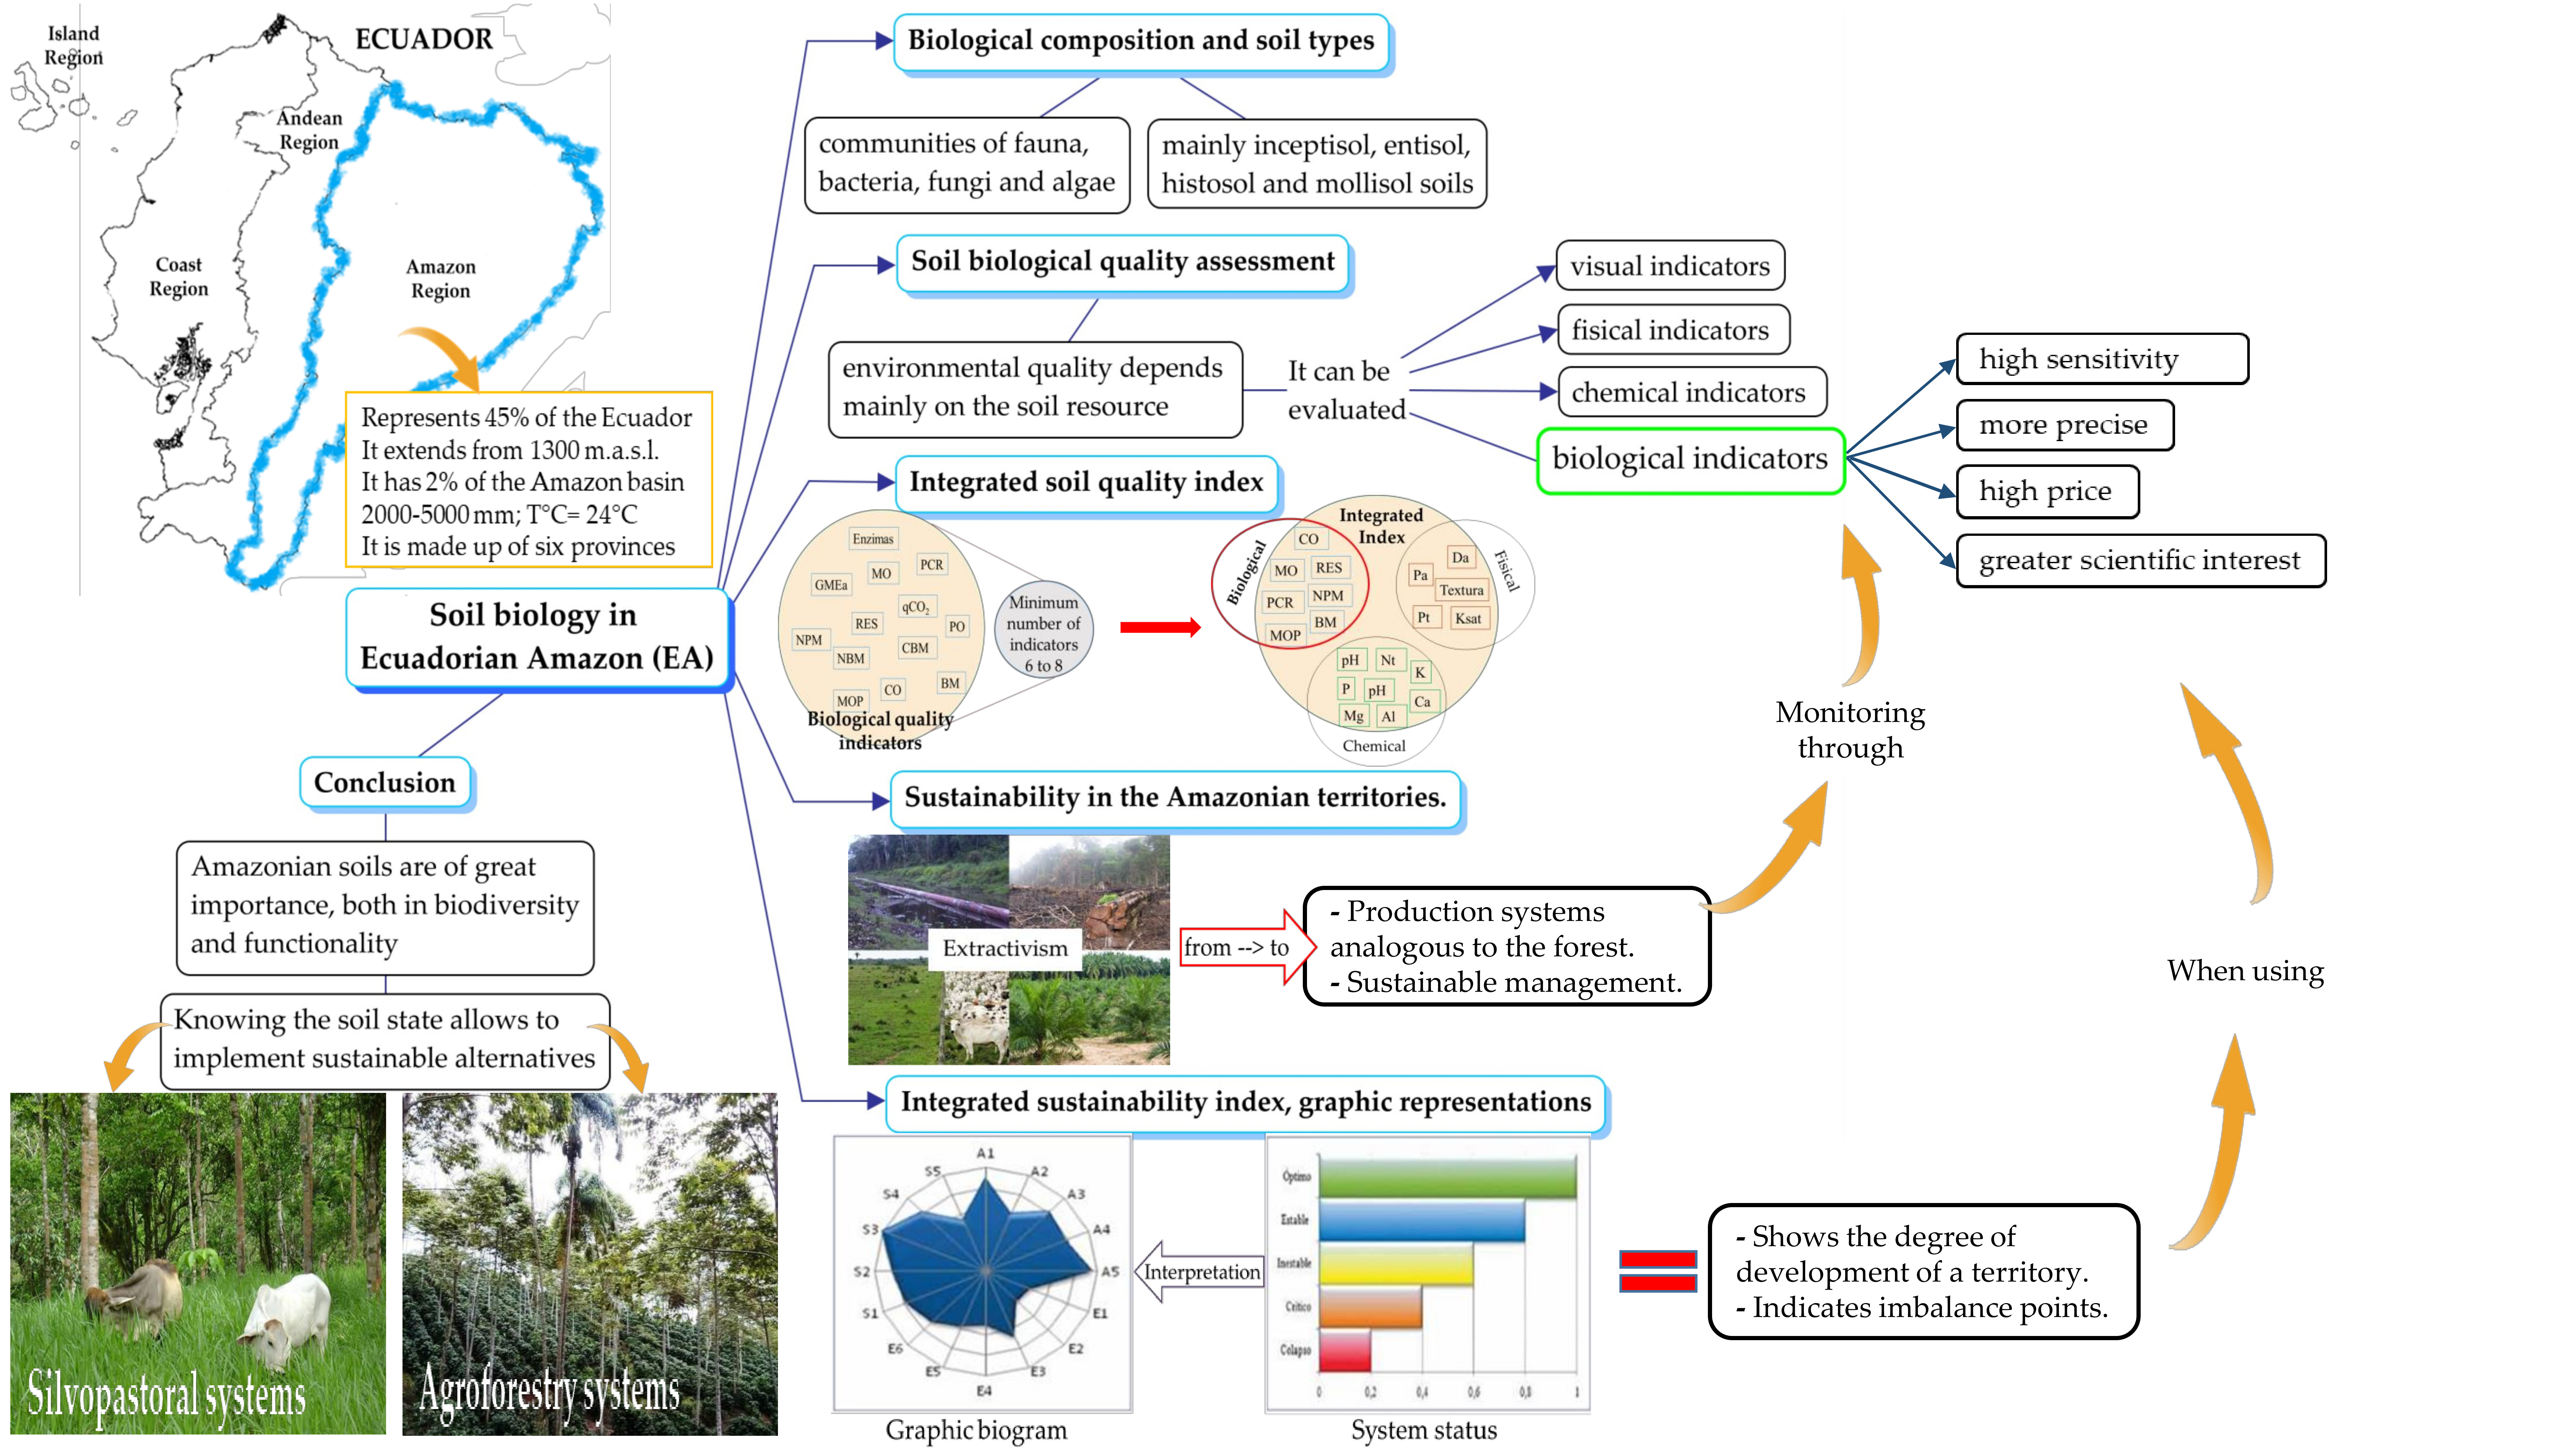
A Framework to Incorporate Biological Soil Quality Indicators into Assessing the Sustainability of Territories in the Ecuadorian Amazon


Abstract
:
1. Introduction
2. Methodology
3. Soil Biology in the Ecuadorian Amazon
3.1. Biological Composition of Soils
3.2. Contextualization of Ecuadorian Amazon Soil Types, Management, Uses, and Problems
4. Biological Quality of Soils for the Case of the Ecuadorian Amazon
4.1. Quality Concept
4.2. Indicators
4.2.1. Biological Indicators (Bioindicators)
4.2.2. Biological Quality Indicators
4.3. Minimum Number of Indicators
4.4. Field Indicators
4.5. Relational Indicators Integrated Index
4.6. Integrated Soil Quality Index
5. Sustainability of Territories in the Ecuadorian Amazon
5.1. From Environmental Indicators to Sustainability Indicators
5.1.1. Environmental Indicators
5.1.2. Sustainability Indicators
Monetary Indicators of Territorial Sustainability or Weak Indicators
- The gross domestic product (GDP) green, which indicates economic growth, taking into account environmental consequences;
- The GDP ecologically corrected, which takes into account the valuation of non-renewable reserves. In the case of an exhaustion of the resource, there is a replacement of the natural capital;
- The Sustainable Economic Welfare Index (IBES), which corrects conventional measures of private final consumption (expenditure), considering social and environmental factors;
- The Patrimonial Accounts, which exist in order to include environmental variables in the production matrix.
Biophysical Sustainability Indicators or Strong Indicators
- Ecological backpack, which indicates efficiency in the use of matter and energy per unit of product. Its purpose is to assess whether there is a dematerialization of the economy over time;
- The ecological footprint, which allows the estimation of the environmental deficit of a given territory, highlighting the impact that a human group has on ecosystems in relation to resource consumption and waste generation. This measure reports the dependence of a community on the functioning (productivity) of ecosystems, regardless of whether it is outside their domain. It allows the monitoring of the impact of human actions, and it should be noted that the agglomeration (cities) demonstrates the dependence on ecosystems and the environment [77];
- The environmental space, which refers to the quantity and availability of renewable and non-renewable natural resources in relation to the levels of contamination allowed without harming future generations’ use of natural resources.
5.2. Territorial Sustainability Indicators: Participatory Selection
- -
- Political relevance, indicating aspects of collective interest and that are easily executed as concrete public actions;
- -
- Feasibility that the analysis, collection, and processing is within reach of the community;
- -
- Ease of interpretation; previous knowledge on the part of the actors to be understood and direct; the greater the value, the greater the sustainability;
- -
- Validity; effectiveness of the purposes;
- -
- Consistency with direct or indirect measurement (reality), without variations in time and space;
- -
- Comparability; allowing decisions, differentiating situations, and establishing typologies;
- -
- Synthetic, robust, or integrative; holistic as a parameter, inclusive in a small number of 59 reasonably added variables, with the possibility of disaggregation at local levels;
- -
- Systemic; capable of integrating into a social monitoring system;
- -
- Participatory; the allowance of the indicator to be involved in its own definition, analysis, and interpretation;
- -
- Visionary or predictive; able to relate what is measured with community values, about a desirable future.
5.3. Accessible Space–Time Representations. Biography and Integrated Sustainable Development Index
6. Conclusions
Supplementary Materials
Author Contributions
Funding
Acknowledgments
Conflicts of Interest
Appendix A

| Indicators Applied to the Production Units (UP) with Their Respective Score Level, in the Province of Napo, Ecuador | ||
|---|---|---|
| Dimension | Indicators | Optimum Level |
| Environmental | Number of agroecological practices used | At least five must be agroecological, with ecological principles, such as association of crops, polycultures, cover, silvopastoral, and agroforestry systems |
| Crop diversification | At least four types of crops | |
| Productive diversification | At least four productive activities | |
| Integral fertility: | ||
| - Texture | Franco, clay loam | |
| - Soil structure | Granular | |
| - Soil color | Dark brown or black | |
| - Apparent density | Less than 1.2 Mg·m−3 | |
| - Total porosity | Greater than 50% | |
| - pH | 5.5 to 7 | |
| - Organic material (%) | Greater than 3% | |
| - Nutrient availability (N, P, K, Ca, Mg) | Medium to high content | |
| - Biological activity | Abundant (wildlife is displayed on the ground) | |
| - Presence of erosion | Protected soil, without cracking | |
| Socio-cultural | Number of people incorporated to the UP | All family members have active participation |
| Workforce | At least 60% are familiar | |
| Task Distribution | Agreements are distributed equally | |
| Organization and management capacity | The UP is able to solve internal problems, keeps track of expenses, production and sales | |
| UP external administrative unit | Low, based on self-management | |
| Sense of belonging to the UP | High | |
| Acceptance of new practices | Willing to agroecological practices | |
| Waste disposal, recycling | Focusses on a specific area, apply recycling | |
| Time of dedication to the UP | More than 60% | |
| Economic | UP production level | Self-supply and sale of surplus |
| Acceptance of products (quality, price) | High | |
| Monthly net income in the UP | More than four minimum wages | |
| Agricultural input costs | 70% of inputs are produced in the UP | |
| Labor costs | 70% are members of the UP | |
| Marketing strategies | It has at least two strategies that give added value to the product | |
| Savings strategy | At least one strategy for eventualities | |
| Production financing | The unit is self-financing | |
| Politics | State programs related to the UP (Chakra, livestock) | More than three programs associated with the UP |
| Acceptance level of state programs | At least apply two programs or benefit from one | |
| Institutional support to the UP | At least three institutions supporting the UP | |
| Development of new skills and knowledge for productive work in the UP | All members have acquired new skills and knowledge, through courses and practical process workshops | |
| Level of participation or governance and associativity | UP members attend calls, technical tables, workshops, there is a predisposition | |
References
- Bravo, C.; Torres, B.; Alemán, R.; Marín, H.; Durazno, G.; Navarrete, H.; Gutiérrez, E.T.; Tapia, A. Indicadores morfológicos y estructurales de calidad y potencial de erosión del suelo bajo diferentes usos de la tierra en la Amazonía ecuatoriana. An. Geogr. Univ. Complut. 2017, 37, 247–264. [Google Scholar] [CrossRef] [Green Version]
- Pfenning, L.H.; Abreu, L.M. Hongos del suelo saprófitos y patógenos de plantas. In Manual de Biología de Suelos Tropicales; Instituto Nacional de Ecologiía: México city, Mexico, 2000; pp. 243–280. ISBN 978-607-790-831-9. [Google Scholar]
- Cherubin, M.R.; Karlen, D.L.; Franco, A.L.C.; Cerri, C.E.P.; Tormena, C.A.; Cerri, C.C. A Soil Management Assessment Framework (SMAF) evaluation of Brazilian sugarcane expansion on soil quality. Soil Sci. Soc. Am. J. 2016, 80, 215–226. [Google Scholar] [CrossRef]
- Moreira, F.M.S.; Huising, J.E.; Bignell, D.E. Manual de Biologia de Suelos Tropicales: Muestreo y Caracterizacion de la Biodiversidad Bajo Suelo; Instituto Nacional de Ecologiía: México city, Mexico, 2012; ISBN 9786077908319.
- Moldenke, A.R. Arthropods. Methods of soil analysis. Soil Sci. Soc. Am. J. 1994, 42, 517. [Google Scholar]
- Cabrera, G. La macrofauna edáfica como indicador biológico del estado de conservación/perturbación del suelo. Resultados obtenidos en Cuba. Pastos Y Forrajes 2012, 35, 349–363. [Google Scholar]
- Socarrás, A. Mesofauna edáfica: Indicador biológico de la calidad del suelo. Pastos Y Forrajes 2013, 36, 5–13. [Google Scholar]
- Cabrera, G.; Robaina, N.; Ponce de Leon, D. Composicion funcional de la macrofauna edafica en cuatro usos de la tierra en las provincias de Artemisa y Mayabeque, Cuba. Pastos Y Forrajes 2011, 34, 313–330. [Google Scholar]
- Bonilla, C.; Gómez, E.; Sánchez, M. El Suelo: Los Organismos Que lo Habitan; Universidad Nacional de Colombia: Palmira, Colombia, 2002; Volume 5. [Google Scholar]
- Coyne, M. Microbiología del Suelo: Un Enfoque Exploratorio; Paraninfo: Madrid, Spain, 2000; ISBN 84-283-2648-7. [Google Scholar]
- Chamorro, W.R.; Gallo, F.O.; Delgado, S.; Enríquez, S.I.; Guasumba, V.; López-Iborra, G. Los escarabajos estercoleros (Coleoptera: Scarabaeidae: Scarabaeinae) del Bosque Protector Oglán Alto, Pastaza, Ecuador. Biota Colomb. 2019, 20, 34–49. [Google Scholar] [CrossRef]
- Jones, D.T.; Eggleton, P. Sampling termite assemblages in tropical forests: Testing a rapid biodiversity assessment protocol. J. Appl. Ecol. 2000, 37, 191–203. [Google Scholar] [CrossRef]
- González, G.; Zou, X.; Borges, S. Earthworm abundance and species composition in abandoned tropical croplands: Comparisons of tree plantations and secondary forests. Pedobiologia (Jena) 1996, 40, 385–391. [Google Scholar]
- García-Álvarez, A.; Bello, A. Diversidad de los organismos de suelo y transformaciones de la materia orgánica. In Proceedings of the International Conference Soil Compost Eco-Biology, León, España, 15–17 September 2004; pp. 211–212. [Google Scholar]
- Cares, J.E.; Huang, S.P. Nematodos del Suelo. Man. Biol. Suelos Trop. 2012, 5, 163–176. [Google Scholar]
- Traunspurger, W.; Reiff, N.; Krashevska, V.; Majdi, N.; Scheu, S. Diversity and distribution of soil micro-invertebrates across an altitudinal gradient in a tropical montane rainforest of Ecuador, with focus on free- living nematodes. Pedobiol. J. Soil Ecol. 2017, 62, 28–35. [Google Scholar] [CrossRef]
- Ruiz, P.; Rojas, K.; Sieverding, E. La distribución geográfica de los hongos de micorriza arbuscular: Una prioridad de investigación en la Amazonía peruana. Espac. Y Desarro. 2011, 23, 47–63. [Google Scholar]
- Alemán, R.; Reyes, H.; Bravo, C. Libro de Memorias: Simposio Internacional Sobre Manejo Sostenible de Tierras y Seguridad Alimentaria—Ecuador 2017; Alemán-Pérez, R., Reyes-Morán, H., Bravo-Medina, C., Eds.; Universidad Estatal Amazónica: Puyo, Pastaza-Ecuador, 2017; ISBN 978-9942-932-22-8. [Google Scholar]
- Bagyaraj, J.D.; Stürmer, S.L. Hongos micorrizógenos arbusculares (HMA). In Manual de Biología de Suelos Tropicales; Instituto Nacional de Ecología: México city, Mexico, 2012; pp. 217–242. [Google Scholar]
- Carey, J.C.; Fulweiler, R.W. The terrestrial silica pump. PLoS ONE 2012, 7, e52. [Google Scholar] [CrossRef] [PubMed] [Green Version]
- Stanek-Tarkowska, J.; Noga, T. Diversity of diatoms (Bacillariophyceae) in the soil. Inż. Ekol. 2012, 30, 287–296. [Google Scholar]
- Hallmann, C. Biodiversity of Terrestrial Algal Communities from Soil and Air-Exposed Substrates Using a Molecular Approach. Ph.D. Thesis, Georg-August-University School of Science, Gottinghem, Germany, 2015. [Google Scholar]
- Maistro, S.; Broady, P.; Andreoli, C.; Negrisolo, E. Xanthophyceae. In Handbook of the Protists: Second Edition; Springer International Publishing: Berlin/Heidelberg, Germany, 2017; pp. 407–434. ISBN 9783319281490. [Google Scholar]
- Bérard, A.; Dorigo, U.; Humbert, J.F.; Martin-Laurent, F. Microalgae community structure analysis based on 18S rDNA amplification from DNA extracted directly from soil as a potential soil bioindicator. Agronomie 2005, 25, 285–291. [Google Scholar] [CrossRef] [Green Version]
- Moreira, F.M.S. Bacterias formadoras de nódulos en leguminosas. In Manual de Biología de Suelos Tropicales: Muestro y Caracterización de la Biodiversidad Bajo Suelo; Instituto Nacional de Ecologiía: México city, Mexico, 2012; pp. 177–216. [Google Scholar]
- Corrales Morales, M.; Villalobos, K.; Rodríguez Rodríguez, A.; Muñoz Simón, N.; Umaña-Castro, R. Identificación y caracterización molecular de cianobacterias tropicales de los géneros Nostoc, Calothrix, Tolypothrix y Scytonema (Nostocales: Nostocaceae), con posible potencial biotecnológico. UNED Res. J. 2017, 9, 280–288. [Google Scholar] [CrossRef] [Green Version]
- Bravo, C.; Benítez, D.; Vargas Burgos, J.; Alemán, R.; Torres, B.; Marín, H. Caracterización socio-ambiental de unidades de producción agropecuaria en la Región Amazónica Ecuatoriana: Caso Pastaza y Napo. Rev. Amaz. Cienc. Y Tecnol. 2015, 4, 3–31. [Google Scholar]
- Bravo-Velásquez, E. Apuntes Sobre la Biodiversidad del Ecuador; Abya-Yala, Editorial Universitaria: Cuenca, Ecuador, 2013; ISBN 978-9978-10-153-7. [Google Scholar]
- López, V.; Espíndola, F.; Callles, J.; Ulloa, J. Amazonía Ecuatoriana Bajo Presión; Eco Ciencia: Quito, Ecuador, 2013. [Google Scholar]
- Izquierdo, I.; Caravaca, F.; Alguacil, M.M.; Roldan, A. Changes in physical and biological soil quality indicators in a tropical crop system (Havana, Cuba) in response to different agroecological management practices. Environ. Manag. 2003, 32, 639–645. [Google Scholar] [CrossRef]
- Diaz, A. Caracterización de los suelos de la Amazonía ecuatoriana. In Agroforestería Sostenible en la Amazonía Ecuatoriana, N° 2, Fragilidad de los Suelos en la Amazonía Ecuatoriana y Potenciales Alternativas Agroforestales Para el Manejo Sostenible; INIAP-Estación Experimental Central Amazónica: Joya de los Sachas, Ecuador, 2018; pp. 33–40. ISBN 978-9942-36-039-7. [Google Scholar]
- Rodríguez-Achung, F.; Bendayán-Acosta, L.; Rojas-Rodríguez, C.; Calle-Barco, C. Los suelos de la región del Amazonas segun unidades fisiográficas. Folia Amaz. 2006, 3, 7–20. [Google Scholar] [CrossRef]
- MAG, (Ministerio de Agricultura y Ganadería) Memoria Explicativa del Mapa de Órdenes de Suelos del Ecuador. Available online: http://metadatos.sigtierras.gob.ec/pdf/MEMORIA_MAPA_DE_ORDENES_DE_SUELOS_MAG_SIGTIERRAS.pdf (accessed on 16 February 2020).
- Vargas, Y.; Nicolalde, J.; Calero, A.; Vizuete, O. ¿Por qué son frágiles los suelos de la Amazonía ecuatoriana? In Agroforestería Sostenible en la Amazonía Ecuatoriana, N° 2, Fragilidad de los Suelos en la Amazonía Ecuatoriana y Potenciales Alternativas Agroforestales Para el Manejo Sostenible; INIAP-Estación Experimental Central Amazónica: Joya de los Sachas, Ecuador, 2018; pp. 61–68. ISBN 978-9942-36-039-7. [Google Scholar]
- Nieto, C.; Caicedo, C. Análisis reflexivo sobre el desarrollo agropecuario sostenible en la Amazonía Ecuatoriana, INIAP—EECA. Iniap 2012, 102, 24–50. [Google Scholar]
- Bravo, C.; Ramírez, A.; Marín, H.; Torres, B.; Alemán, R.; Torres, R.; Navarrete, H.; Changoluisa, D. Factores asociados a la fertilidad del suelo en diferentes usos de la tierra de la Región Amazónica Ecuatoriana. Rev. Electron. Vet. 2017, 18, 1–16. [Google Scholar]
- Torres, B.; Starnfeld, F.; Vargas, J.C.; Ramm, G.; Chapalbay, R.; Rios, M.; Gómez, A.; Torricelli, Y.; Jurrius, I.; Tapia, A.; et al. Gobernanza Participativa en la Amazonía del Ecuador: Recursos Naturales y Desarrollo Sostenible; Manthra: Quito, Ecuador, 2014. [Google Scholar]
- Vallejo Quintero, V.E. Importancia y utilidad de la evaluación de la calidad de suelos a través del componente microbiano: Experiencias en sistemas silvopastoriles. Colomb. For. 2013, 16, 83–99. [Google Scholar] [CrossRef]
- Tapia-Báez, R.G. Diversidad de Escarabajos Copronecrófagos y Estado de Consevación de la Microcuenca del Río Pindo; Universisdad Tecnológica Equinoccial: Quito, Ecuador, 2015. [Google Scholar]
- Bravo, C.; Torres, B.; Alemán, R.; Changoluisa, D.; Marín, H.; Reyes, H.; Navarrete, H. Soil structure and carbon sequestration as ecosystem services under different land uses in the Ecuadorian Amazon Region. MOL2NET 2017, 3, 1–8. [Google Scholar]
- Palacios, W.; Malessa, U. Situación de las Comunidades Productoras Forestales de la Amazonía Ecuatoriana: Obstáculos y Oportunidades Para Comercializar Madera Legal; TRAFFIC, Oficina regional America del Sur: Quito, Ecuador, 2010. [Google Scholar]
- Camacho, D.C. Esquemas de pagos por servicios ambientales para la conservación de cuencas hidrográficas en el Ecuador. Investig. Agrar. Sist. Y Recur. For. 2008, 17, 1354–1366. [Google Scholar]
- Bünemann, E.K.; Bongiorno, G.; Bai, Z.; Creamer, R.E.; De Deyn, G.; De Goede, R.; Fleskens, L.; Geissen, V.; Kuyper, T.W.; Mäder, P.; et al. Soil quality—A critical review. Soil Biol. Biochem. 2018, 120, 105–125. [Google Scholar] [CrossRef]
- Leite Chaves, H.M.; Concha Lozada, C.M.; Gaspar, R.O. Soil quality index of an Oxisol under different land uses in the Brazilian savannah. Geoderma Reg. 2017, 10, 183–190. [Google Scholar] [CrossRef]
- Andrews, S.S.; Karlen, D.L.; Mitchell, J.P. A comparison of soil quality indexing methods for vegetable production systems in Northern California. Agric. Ecosyst. Environ. 2002, 90, 25–45. [Google Scholar] [CrossRef]
- Doran, J.W.; Parkin, T.B. Defining Soil Quality for Sustainable Environment; Soil Science Society of America: Madison, WI, USA, 1994; ISBN 0-89118-807-X. [Google Scholar]
- Cañizares-Gonzales, R. Potencial para el Secuestro de Carbono y la protección de la biodiversidad bacteriana de prácticas agrícolas sostenibles en suelos de Olivar. In Diseño y Aplicación de Tecnologías “Ómicas”; Universidad de Granada: Granada, España, 2011. [Google Scholar]
- Custode, E.; Sourdat, M. Paisajes y suelos de la Amazonia ecuatoriana: Entre la conservaci6n y la explotaci6n. Cultura 1986, 24, 325–339. [Google Scholar]
- Gardi, C.; Angelini, M.; Barceló, S.; Comerma, J.; Cruz-Gaistardo, C.; Encina-Rojas, A.; Jones, A.; Krasilnikov, P.; Mendonça-Santos, M.L.; Montanarella, L.; et al. Atlas de Suelos de América Latina y el Caribe, Comisión Europea-Oficina de Publicaciones de la Union Europea, L2995; Comisión Europea: Luxembourg, 2014; ISBN 978-92-79-25599-1. [Google Scholar]
- Simpson, R.J.; Stefanski, A.; Marshall, D.J.; Moore, A.D.; Richardson, A.E. Management of soil phosphorus fertility determines the phosphorus budget of a temperate grazing system and is the key to improving phosphorus efficiency. Agric. Ecosyst. Environ. 2015, 212, 263–277. [Google Scholar] [CrossRef]
- Navarrete Segueda, A.; Vela Correa, G.; Lopez, J.; Rodriguez, M.D.L. Naturaleza y utilidad de los indicadores de calidad del suelo. Contactos 2011, 80, 29–37. [Google Scholar]
- Pulido Moncada, M.; Gabriels, D.; Lobo, D.; Rey, J.C.; Cornelis, W.M. Visual field assessment of soil structural quality in tropical soils. Soil Tillage Res. 2014, 139, 8–18. [Google Scholar] [CrossRef]
- Toledo, D.M.; Arzuaga, S.A.; Galantini, J.A.; Vazquez, S. Indicadores e Índices biológicos de calidad de suelo en sistemas forestales. Cienc. del Suelo 2018, 36, 1–12. [Google Scholar]
- Hinojosa, M.B.; García-Ruíz, R.; Benjamín, V.; Carreira, J.A. Microbiological rates and enzyme activities as indicators of functionality ´ llar toxic spill in soils affected by the Aznalco. Soil Biol. Biochem. 2004, 36, 1637–1644. [Google Scholar] [CrossRef]
- Lavelle, P.; Dangerfield, M.; Fragoso, C.; Eschenbrenner, V.; Lopez-Hernandez, D.; Pashanasi, B.; Brussaard, L. The relationship between soil macrofauna and tropical soil fertility. In The Biological Management of Tropical Soil Fertility; Woomer, P.L., Swift, M.J., Eds.; Wiley: Chichester, UK, 1994; pp. 137–169. [Google Scholar]
- Enagbonma, B.J.; Babalola, O.O. Environmental sustainability: A review of termite mound soil material and its bacteria. Sustainability 2019, 11, 3847. [Google Scholar] [CrossRef] [Green Version]
- Cole, L.; Bradford, M.A.; Shaw, P.J.A.; Bardgett, R.D. The abundance, richness and functional role of soil meso- and macrofauna in temperate grassland-A case study. Appl. Soil Ecol. 2006, 33, 186–198. [Google Scholar] [CrossRef]
- Ahmad-Wani, S.; Ahmad-Wani, M.; Ahmad-Sheikh, A.; Chand, S. Microbiological-Indicators with potential for evaluating soil quality. Int. J. Curr. Microbiol. Appl. Sci. 2017, 6, 831–839. [Google Scholar] [CrossRef] [Green Version]
- Delgado-Baquerizo, M.; Oliverio, A.M.; Brewer, T.E.; Benavent-González, A.; Eldridge, D.J.; Bardgett, R.D.; Maestre, F.T.; Singh, B.K.; Fierer, N. A global atlas of the dominant bacteria found in soil. Science 2018, 359, 320–325. [Google Scholar] [CrossRef] [Green Version]
- Raiesi, F.; Beheshti, A. Microbiological indicators of soil quality and degradation following conversion of native forests to continuous croplands. Ecol. Indic. 2015, 50, 173–185. [Google Scholar] [CrossRef]
- Vance, E.D.; Brookes, P.C.; Jenkinson, D.S. An extraction method for measuring soil microbial biomass carbon. Soil Biol. Biochem. 1987, 19, 703–707. [Google Scholar] [CrossRef]
- Maharjan, M.; Sanaullah, M.; Razavi, B.S.; Kuzyakov, Y. Effect of land use and management practices on microbial biomass and enzyme activities in subtropical top-and sub-soils. Appl. Soil Ecol. 2017, 113, 22–28. [Google Scholar] [CrossRef]
- Paz-Ferreiro, J.; Gascó, G.; Gutiérrez, B.; Méndez, A. Soil biochemical activities and the geometric mean of enzyme activities after application of sewage sludge and sewage sludge biochar to soil. Biol. Fertil. Soils 2012, 48, 511–517. [Google Scholar] [CrossRef]
- Anderson, T.-H.; Domsch, K.H. The metabolic quotient for CO2 (qCO2) as a specific activity parameter to assess the effects of environmental conditions, such as ph, on the microbial biomass of forest soils. Soil Biol. Biochem. 1993, 25, 393–395. [Google Scholar] [CrossRef]
- Ramírez, M.; López-Piñeiro, A.; Peña, D.; Nunes, J.R.; Albarrán, Á.; Muñoz, A.; Gama, J.; Loures, L. Seasonal and interannual fluctuation of the microbial soil community in a maize field under long-term conservation agriculture management. Sustainability 2017, 9, 778. [Google Scholar] [CrossRef] [Green Version]
- GROW Observatory GROW Food. GROW Soil. GROW Science. Available online: https://growobservatory.org/ (accessed on 31 October 2019).
- Power, A.G. Ecosystem services and agriculture: Tradeoffs and synergies. Philos. Trans. R. Soc. B Biol. Sci. 2010, 365, 2959–2971. [Google Scholar] [CrossRef]
- Viana, R.M.; Ferraz, J.B.S.; Neves, A.F.; Vieira, G.; Pereira, B.F.F. Soil quality indicators for different restoration stages on Amazon rainforest. Soil Tillage Res. 2014, 140, 1–7. [Google Scholar] [CrossRef]
- Bravo, C.; Marín, H.; Marrero, P.; Ruiz, M.; Torres, B.; Navarrete, H.; Durazno, G.; Changoluisa, D. Evaluación de la sustentabilidad mediante indicadores en unidades de producción de la provincia de Napo, Amazonia Ecuatoriana. Bioagro 2017, 29, 23–36. [Google Scholar]
- Vargas-Burgos, J.C.; Benítez, D.; Ríos, S.; Torres, A.; Navarrete, H.; Andino, M.; Quinteros, R. Ordenamiento de razas bovinas en los ecosistemas amazónicos. Estudio de caso provincia Pastaza. Rev. Amaz. Cienc. Y Tecnol. 2013, 2, 133–146. [Google Scholar]
- Ramachandran-Nair, P.K.; Mohan-Kumar, B.; Nair, V.D. Agroforestry as a strategy for carbon sequestration. J. Plant Nutr. Soil Sci. 2009, 172, 10–23. [Google Scholar] [CrossRef]
- Altieri, M.A.; Nicholls, C.I. Agroecología y resiliencia al cambio climatico: Principios y consideraciones metodológicas. Agroecología 2013, 8, 7–20. [Google Scholar]
- Sepúlveda, S.; Chavarría, H.; Rojas, P. Metodología Para Estimar el Nivel de Dsarrollo Sostenible en Los Territorios Rurales (El Biograma); Costa Rica: San José, CA, USA, 2008; ISBN 978-92-9039-872-1.
- Sejenovich, H. Manual de Cuentas Patrimoniales; Programa de las Naciones Unidas para el Medio Ambiente: Nairobi, Kenya, 1996; p. 234. [Google Scholar]
- Sancho-Perez, A.; Garcia-Mesanat, G. What does an indicator indicate? Comparative analysis in tourist destinations. Tour. Anal. Mag. 2006, 2, 69–85. [Google Scholar]
- SENPLADES. Plan Nacional de Desarrollo 2017–2021-Toda una Vida; SENPLADES: Quito, Ecuador, 2017.
- Martínez-Alier, J. Los conflictos ecológicos-distributivos y los indicadores de Sustentabilidad. Polis Rev. Latinoam. 2006, 13, 21–30. [Google Scholar]
- Guimarães, R. Tierra de sombras: Desafíos de la sustentabilidad y del desarrollo territorial y local ante la globalización corporativa. Ser. Medio Ambient. Y Desarro. 2003, 67, 62. [Google Scholar]
- Rueda, S. Metabolismo y Complejidad del Sistema Urbano a la Luz de la Ecologia; Ciudades Para un Futuro Mas Sostenible: Madrid, Spain, 1997. [Google Scholar]
- Achkar, M. Indicadores de Sustentabilidad [Sustainability Indexes]; Ordenamiento Ambiental del Territorial [Environmental Planning Territorial]: México city, Mexico, 2005; pp. 55–70. [Google Scholar]
- Rossi, E. Indicadores Territoriales de Sustentabilidad Socio-Ambiental Aplicados al Turismo, Tesis de Maestría; Universidad Nacional de Mar del Plata: Mar del Plata, Argentina, 2015. [Google Scholar]
- Hernández-Hernández, M.R.; Morros, M.E.; Bravo-Medina, C.A.; Pérez, Z.; Herrera-Díaz, P.E.; Ojeda-Hernández, A.; Morales, J.; Birbe-Fernández, B.O. La integración del conocimiento local y científico en el manejo sostenible de suelos en agroecosistemas de sabanas. Interciencia 2011, 36, 104–112. [Google Scholar]
- Sarandón, S.J. El desarrollo y uso de indicadores para evaluar la sustentabilidad de los agroecosistemas. Agroecol. El Camino Para Agric. Sustentable 2002, 20, 393–414. [Google Scholar]
- Reardón, J.A.; Alemán-Perez, R. Agroecology and the development of indicators of food sovereignty in Cuban food systems. Sustain. Agric. 2010, 34, 907–922. [Google Scholar] [CrossRef]
- Astier-Calderón, M.; Maass-Moreno, M.; Etchevers-Barra, J. Derivación de indicadores de calidad de suelos en el contexto de la agricultura sustentable derivation of soil quality indicators in the context of sustainable agriculture. Agrociencia 2002, 36, 605–620. [Google Scholar]
- Casanova, E. Introducción a la Ciencia del Suelo; Universidad Central de Venezuela: Caracas, Venezuela, 2005. [Google Scholar]


| Living Organisms That Make up the Soil Biota | ||
|---|---|---|
| Group | Organism | Function |
| Macrofauna >2 mm | Earthworms | They form a network of tunnels, mixing and digging the soil, producing excreta below and above the ground, modifying the water and chemical properties [4]. They transform the physical properties of the soil, benefiting the formation of aggregates, the movement and retention of water, as well as the gas exchange [8]. They act as ecosystem engineers in pore formation, water infiltration and OM humification and mineralization [6,10]. |
| Beetles | They participate in litter fractionation and in OM decomposition and mineralization processes [6]. The conservation of the coleoptera family can be a support for possible evaluations of the environmental quality [11]. | |
| Ants | Their mounds are rich in nutrients such as N, P, K, Ca, Mg, and Fe, favoring the proliferation of microflora and micromesofauna [12]. They affect the soil structure, mixing the horizons of the profile and recycling part of the elements that leach from the surface [13]. They modify the physical and chemical properties of the soil [10], and contribute to the formation of aggregates, water filtration, and aeration [8]. | |
| Termites | They contribute to bioturbation processes [4], and intervene in the crushing of plant remains and in the decomposition of woody material [6]. | |
| Snails and slugs | They participate in litter fractionation and in OM decomposition and mineralization processes [6], and the fragmentation of leaf litter, when they mobilize they secrete mucus, increasing area for microflora activity [4,8]. Their mucus helps aggregate formation, improving soil structure and properties [10]. | |
| Centipedes and Millipedes | They live among the leaf litter or under the bark of trees and rocks, they play an important role as predators, and others participate in leaf litter fragmentation, speeding up the OM decomposition process [8,10]. | |
| Enquitraeid worms | They participate in leaf litter maceration and plant remains, facilitating the transport of excavators, and they can also act as predators [10]. | |
| Mesofauna 1–2 mm | Collembola | They are decisive in the recycling of organic waste, dividing and crushing them, their excreta benefits the roots by the continuous release of nutrients. They participate as predators of nematodes and fungi [7]. They are considered a decisive element in the recycling of organic remains, and contribute to the structure of the soil [10]. |
| Mites | Their role is to fragment leaves and dead wood, disperse microbial and fungal spores in the soil. Some species are predators of other microarthropods, nematodes, and mites [10]. Moreover, they contribute to the soil stability and fertility [7], and in OM decomposition [14]. | |
| Nematodes | They are concentrated in the roots, serve as food for plants, do not participate in OM decomposition [10], reflect the OM availability in different ecosystems, are the link in the food chain between microorganisms and complex organisms [7]. Some can resist soil disturbances and chemical pollutants [15], others are parasites. There are mycophagus, bacteriophages participate in the regulation of available nitrogen and phosphorus and influence the Rhizobium nodulation [10,14]. They are important agents of the nutrient cycle and regulators of soil fertility, and they work as biological control agents [15,16]. | |
| Protura, diplura, and pauropoda | They inhabit deep strata, under trunks or stones, they are detritivorous and depend on moderate and constant humidity, they consume microorganisms and fungal hyphae, which is why they are considered to be involved in decomposition, some of their representatives are predators and phytophagous [7,10]. | |
| Microfauna <2 mm | Protozoa | They are considered the most important predators of bacteria and fungi. Moreover, they regulate microbial communities, and as pathogenic insects, represent an important biological control [4,10]. |
| Fungi | They are involved in processes of decomposition, mineralization, and cycling of nutrients [2,17]. By forming symbiotic associations, they increase the efficiency of plants to absorb nutrients [4], increase soil aggregation and participate in the carbon cycle [17], and allow plants to survive and efficiently absorb phosphorus from the soil [18]. They improve the soil health and plant species growth, provide greater absorption of nutrients, uptake of immobile ions, tolerance to toxic metals, root pathogens, and unfavorable conditions for plants in tropical ecosystems [2,10,19]. | |
| Algae | They are photosynthesizing organisms involved in primary production, organic carbon (OC) compounds, and soil structure [10], and are colonizers. In association with fungi, they form lichens and contribute to soil formation, degrading minerals or rocks by excreting organic acids [20]. From the production of carbohydrates, they form soil aggregates and stop their erosion [21]. Given the variable and morphologically similar nature of the majority, today, they are identified using molecular techniques [22,23,24]. | |
| Bacteria | They rarely contribute to biological activity. They can be considered bags full of enzymes [10]. In the soil they are very numerous and genetically different. Some degrade chemical compounds and others form nodules in the roots of legumes, with the function of fixing atmospheric nitrogen through heterocysts. Cases such as Pseudomonas can be pathogenic [10,25]. There are cyanobacteria (photosynthesizers and autotrophs) [26]; Actinobacteria are colonies similar to fungal mycelia, like Actinomycetes that degrade OM to form humus and participate in the mineralization process, others can fix N or regulate the composition of the microbial community in the soil. They secrete enzymes that serve for the biological control of nematodes, insects, and other soil organisms. Their number on agricultural land is high [2]. | |
| Taxonomic Description of the Soils of the Ecuadorian Amazon | |
|---|---|
| Order | Suborder |
| Alfisol: Mineral soils developed in stable reliefs of erosive tectonic origin, with clays in the surface horizon, and with more than 35% base saturation; because of the natural reserve of nutrients, they are considered good for short-cycle farms and forages. | |
| Entisol: Soils with the scarce formation of horizons, either due to susceptibility to erosion and flooding, or due to the short evolution time; of variable fertility, due to the original material dragged by alluviums or rivers; present agricultural vocation, but the excess of humidity is their main limitation. | Typic Udifluvents |
| Histosol: Organic soils that are formed when the OM exceeds its mineralization, that are without Indian origins, and are limited in swampy areas that are poorly drained under conditions of continuous saturation that prevents the circulation of oxygen. In this type of soil, sustainable use is limited to forested formations, grasslands, and in some cases, intensive crops. Their ecological importance is because they act as carbon sinks due to the speed of OM contributions they receive. | Aquept Fibrist |
| Inceptisol: Soils with a lack of edaphological maturity, whose genesis is of rapid formation. They occupy areas of irregular topography, with both humid and subhumid climates, and have variable chemical and physical properties, from acid to alkaline, sandy to clay. They have—more or less—a base saturation of 60%, and have been used by the agricultural sector for key crops for the economy. They are represented by a forest cover, pastures, and representative crops. | Andept Tropept |
| Mollisol: Very fertile soils, with a surface horizon rich in OM and more than 50% of base saturation; occupy structural reliefs, with slight slopes towards the coast and sedimentary valleys of volcanic origin; develop in a variety of climatic regimes, mostly grassland vegetation, with high agricultural yield, sometimes the highest in the world. | Udoll |
| Oxisol: Mineral soils with low fertility, from marginal slopes of the Real and Cutucú mountain range; occupy tropical areas that have gone through prolonged processes of weathering and washing due to heavy rainfall; have red, yellowish colors due to iron accumulation, oxides, and hydroxides of aluminum. Their main use is for livestock, followed by forest areas, but they are not suitable for agricultural activities. | Ortox |
| Ultisol: Acidic soils, which are products of chemical weathering, from eastern and western Andean hills, present in any humidity regime, with a base saturation of less than 35% providing acidity. These soils are characteristic of humid forests that are part of conservation areas. | |
| Organisms of Soil Biota Considered Edaphic Bioindicators | |||
|---|---|---|---|
| Organism | Indicator | Author | |
| Earthworms | They are recognized for presenting sensitivity to anthropogenic disturbance, proposing them as indicators of soil degradation [4,13]. Several authors propose them as a biological indicator of the state of conservation/alteration of the soil according to the composition and abundance [6]. Their presence indicates preserved habitats [55]. | ||
| Beetles | They are considered excellent bioindicators to evaluate anthropogenic intervention due to the high sensitivity to environmental variations and deterioration of ecosystems [6,40]. According to the ecological niche they occupy, they are considered as indicators of the conservation status of the ecosystem [39]. | ||
| Termites | The presence of termites indicates less conserved habitats or habitats with a certain level of degradation, considered opportunistic organisms due to resistance to induced disturbances [6]. On the other hand, they are potentially the most important taxa as ecological indicators, because they are at the ecological center of many tropical ecosystems [12], and moreover, for their sensitivity to environmental or anthropogenic disturbances in biotic systems [56]. | ||
| Snails and Slugs | Used to indicate the state of disturbance in the edaphic environment, they are very sensitive to sudden changes in humidity and temperature, associated with vegetation cover and the entry of residues [6]. For this reason, they are considered indicators of humidity and temperature changes. | ||
| Centipedes and Millipedes | Used to indicate the state of disturbance in the edaphic environment, they are very sensitive to sudden changes in humidity and temperature, associated with vegetation cover and the entry of residues [6], and because these changes can influence its functions and abundance [8]. | ||
| Enquitraeid worms | They are drought-sensitive organisms [10]; for this reason they are considered drought indicators. They can be considered bioindicators of soil stability and fertility [7]. | ||
| Collembola | Due to their action of reducing fungal concentrations, in crops they are used as bioindicators of soil contamination, since they have whitish and soft bodies, they are considered an indicator group of fertility and stability of the edaphic environment due to their sensitivity to chemical products and environmental disturbances [7]. For the changes in their composition, they are considered indicators of ecological variations, due to the influence of agricultural practices, making the presence of taxa effective as bioindicators of herbicide treatment [57]. | ||
| Mites | Oribatida | Due to their morphological and bioecological characteristics, they are very demanding in terms of habitat quality, suggesting them as potential bioindicators of disturbance, as they are sensitive to OM content, humidity, pH, agricultural practices, use of insecticides, and environmental changes. They respond positively to good soil aeration conditions, considering them indicators of stable and productive soils, and in soils not intervened as bioindicators of low heavy metal values [7]. | |
| Uropodinos | |||
| Astigmata | Surviving unfavorable environmental conditions, they are proposed as good indicators of disturbed soils [7]. | ||
| Gamasinos | Biological indicators of soil stability and fertility; due to their susceptibility to environmental disturbances and the fragility of their whitish bodies, these characteristics also make them a good indicator of soil quality, since they are abundant in the least disturbed [7]. | ||
| Prostigmata | When they have high dominance, it is considered as an indicator group of the aridity and the imbalance of the edaphic communities is irreversible, because they have a high reproductive potential, which allows them to adapt to the disturbance and for this reason they are considered disturbance indicators [7]. | ||
| Nematodes | They act as biological control agents for pests and insects, qualifying them as powerful bioindicators of ecological conditions [15]. Through appropriate analysis of the nematode community, the level of contaminant disturbance and changes in land use can be estimated [43], therefore, they are considered indicators of sensitivity and stability [16]. | ||
| Protura, Diplura and Pauropoda | Due to their morphology and trophic functions, they are considered indicators, they are very sensitive to agricultural practices, thereby reducing their population [7]. | ||
| Arbuscular mycorrhizal fungi | The mycorrhizal association has recently been seen as an important indicator to assess soil quality. They also represent a key group of organisms in the soil that can affect plant productivity, biodiversity, and characteristics related to ecosystem sustainability [17]. Moreover, they are considered bioindicators of soils contaminated by heavy metals [58]. | ||
| Algae | Excretions of fatty acids and carbohydrates, they stop erosion-forming aggregates [10]. Due to their nature and similar morphology, molecular techniques are used for better identification [22,24]. | ||
| Bacteria | The actinomycetes in tropical soils are one of the most important bacterial groups [2], as indicated by a recent review of soil bacteria worldwide [59]. Their systematic classification is based on molecular techniques (16S rRNA sequencing) of soil microorganisms [26,59]. | ||
| Indicators | Methodology | What Do They Indicate | Author |
|---|---|---|---|
| Organic matter | Wet oxidation method with modified Walkley–Black dichromate | OM is considered an important indicator of soil quality and productivity [30], because it influences a wide range of soil properties. On the other hand, it is the most important component of soils, since it plays a key role in determining physical, chemical, and biological processes, exercising crop production [47]. OM is a globally recognized variable as the universal indicator of soil quality [53]. It is considered a sensitive indicator to changes due to soil management [58,60]. | |
| Particulate organic matter | Modification of physical fractionation | Both are positioned within the most sensitive indicators, helping to identify changes manifested at different depths and in the face of management practices [53]. Organic phosphorus allows the prediction of nutrient availability in the short term [19]. | |
| Organic phosphorus | 1970 Dewis and Freitas Method | ||
| Potentially mineralizable nitrogen | Method outlined (Keeney and Nelson 1982) Modified Waring and Bremner Method (Keeney 1982) | It is a necessary indicator for a complete evaluation of the soil, it is associated with the quality of the OM. On the other hand, it corresponds to the amount of organic soil nitrogen that can be converted by microbial activity to soluble inorganic forms and due to its sensitivity it can be used as an indicator of the production capacity of the soil or as an indicator of the nitrogen contribution of the soil to support recommendations for the application of N [53]. Moreover, it is an indicator highly sensitive to changes in use in subtropical soils. | |
| Microbial biomass | Fumigation-extraction method with chloroform (Jenkinson and Powlson 1976) Substrate-induced breathing method (Anderson and Domsch 1978) | Microbial biomass is considered an indicator of soil fertility and quality, and is negatively affected by changes in land use and agricultural practices [60]. Furthermore, they are used as indicators of the first environmental changes by deforestation. Microbiological parameters that have been used as indicators of the effect of agricultural practices and pollutants on soil quality [47], and as indicators of the relationship between biota and the restoration of degraded systems, allowing us to know the abundance and population structure of microorganisms [58,61]. They have been proposed as indicators of soil quality in natural and agricultural systems, due to the role of microorganisms in the C, N cycle [62], and their sensitivity [30]. In subtropical soils they can serve as potential biological indicators of ecological changes resulting from land use and management practices [62]. | |
| Carbon of microbial biomass | |||
| Nitrogen from microbial biomass | |||
| Soil respiration | Static incubation, Alkali-trap method (Anderson 1982) | It is carried out by microorganisms under aerobic conditions, it is a useful index to know the amount of easily mineralizable substrate, by determining the amount of CO2 released by the action of biological activity and the easily mineralizable OC [47,54], allowing to evaluate the type of management to which a soil is subjected [47]. Indicator highly sensitive to changes in the use of subtropical soils [53]. Used as an indicator of soil quality and microbial activity, it can also indicate the amount of easily mineralizable substrates [63]. | |
| Metabolic or microbial ratio | The metabolic processes that occur in the soil can serve as early and sensitive indicators against the changes caused by different soil management [53]. This quotient is a useful indicator to monitor changes in OM and is often used as a sensitive index to measure changes in soil OC. Its increase is considered as an indicator of environmental stress after the conversion of forests to farmland [60]. Indicator of availability and quality of microbes, it is also sensitive to other factors, such as the proportion of fungal and bacterial biomass [63]. The stress of the microbial communities can be quantified by means of this parameter that reflects the energy requirement or indicates a change in the bacterial-fungal ratio. At the same time, it could be a useful parameter in the study of bioenergetic changes in developing ecosystems [64]. | ||
| Geometric measurement of enzymatic activity (GMEa) | GMEa = (enzyme x enzyme x n…) 1/#enzymes It consists of multiplying the values of each enzymatic activity to know GMEa. | It is a measure of enzyme activity that is proposed as an indicator of recovery in the presence of bioavailable heavy metals [54]. It is an indicator of changes in soil quality under different agricultural management practices and is used to assess the effects of cultivation on soil quality [60]. It has been shown to be a good index (condensing the set of enzyme values) to estimate the quality of the soil, since it is related to other physicochemical or biological properties of the soil. Furthermore, it is an early indicator of change in soil quality and is sensitive to metal contamination [63]. | |
| Molecular markers, quantitative and real-time PCR (polymerase chain reaction) | Bead-beating method | The estimation by direct or indirect extraction of nucleic acids (DNA and RNA) from the soil and their subsequent study through molecular biology techniques, such as PCR, has been used successfully, and they have been proposed as indicators of microbial biomass activity [47]. This technique is capable of discriminating between bacterial and fungal biomass. They are the preferred way to assess the structure and dynamics of the soil microbiological community, since microbiological life is a favorable indicator of adequate soil characteristics [65]. | |
| Enzymatic activity | Fluorogenically labeled substrates, (Tabatabai 1982) | They are considered as sensitive indicators between reforestation methods and changes produced by agricultural activity [30]. Due to their sensitivity, relationship with biological activity, and rapid response to changes that occur in the soil (use and management), they have been proposed as potential indicators of soil quality [47,62]. Phosphatase activity is a soil indicator to estimate the potential mineralization of organic phosphate [47]. They are used as indicators of changes in soil microbial activity, in response to heavy metals and corrective measures [54], and they show sensitivity to changes in land use and pollution. They have been used as indicators of soil fertility and quality, but while being negatively affected by changes in land use and agricultural practices are proposed as indicators of soil degradation [60,63]. They can also indicate accelerated decomposition [63]. | |
| Enzyme | Substratum | Description | Author |
|---|---|---|---|
| Dehydrogenase | 2-p-iodophenyl-3 p-nitrophenyl-5 tetrazolium chloride | Measures total oxidative activity of the microflora and estimates the microbial activity. Indicates the redox potential and oxidative capacity of the soil. It is proposed as an indicator of microbial activity. Its decrease may indicate the presence of herbicides. | [30,47] |
| O-diphenoloxidase | Catalyzes oxidation of phenolic compounds and participates in the formation of humic substances. Degrades recalcitrant organic compounds. | [47] | |
| B-glucosidase | p-nitrophenyl B-D-glucosidase | Catalyzes hydrolytic processes during the decomposition of OM, the soil predominates, so it is used to study the C cycle, as it degrades cellulose. Indicates presence or absence of herbicides due to their sensitivity. | [30,47,54] |
| Acid and alkaline phosphatase | p-nitrophenyl phosphate | Catalyzes the hydrolysis of organic esters, releasing phosphate and phosphoric acid anhydrides, and is considered an indicator of organic phosphate mineralization. Related to the amount of available OM. | [30,47,54,60,63] |
| Arylsulfatase | p-nitrophenyl sulfate | Catalyzes hydrolysis of aromatic sulfate esters in phenols and sulfate, is related to the amount of OM, with greater activity in surface layers under natural conditions. | [30,47,54,60,63] |
| Ureasa | urea use | Catalyzes the hydrolysis of non-peptide bonds, mineralizes N to CO2 and NH3, indicates losses of N in the form of ammonia. | [47,54] |
| Nitrogenase | Participates in the reduction of nitrogen gas to ammonia and acetylene to ethylene (rapid sensitivity), measures nitrogenase activity, detects N fixatives (new symbiosis). | [25] |
| Level | Indicator | Methodology | Principal Functions |
|---|---|---|---|
| Population and community | Presence, richness, and abundance of individual soil organisms | Traditional methods, microscopic, molecular techniques. | Cycle of OM and water, soil structure, regulation of microorganisms |
| Microbial and fungal biomass | Plate count, fumigation, and extraction with chloroform | Cycling of OM and elements, soil structure, decomposition | |
| Indices based on soil biota communities | Identification and counting of the groups of organisms | Cycle of OM and elements, regulation of biological population, decomposition | |
| Community composition | Taxonomic identification and counting manual | Cycle of OM and elements, regulation of biological population, decomposition | |
| Ecosystem | Soil respiration, nitrification, and denitrification | Evolution of CO2, emission of N2O, and production of NO3 | OM and water cycling, decomposition, habitat provision |
| Potentially mineralizable nitrogen | Anaerobic incubation | Natural fertilization | |
| Metabolic or microbial ratio | |||
| DNA and protein synthesis | Incorporation of thymine and leucine into DNA | ||
| Enzymatic activity | Extraction and incubation of soil enzymes in various substrates | OM cycling, biological population regulation, decomposition | |
| Metabolomics and metaproteomics | Evaluation and quantification of metabolites and proteins in the soil | OM cycling, regulation of the biological population, soil structure, decomposition. |
| Relational Indicators (Ratio) | Description | Author |
|---|---|---|
| Oribatidos/Astigmados | Allows the prediction and evaluation of the degree of disturbance caused by the change of use in the ground. Based on densities (population), it expresses the ecological state of the edaphic environment and allows for the inference of the integral functioning of the ecosystem. Domination of astigmados indicates that the medium is altered and unstable. | [7] |
| Oribatidos/Prostigmados | Allow the evaluation of disturbances and state of the edaphic environment, like the previous relationship. If there is a dominance of prostitutes (indicator of aridity), the imbalance of soil communities is irreversible. | [7] |
| Mite/Collembola | Useful for determining the degree of disturbance. If the density of collembola is greater, it indicates fertility and stability of the soil (conserved ecosystem), whereas if there are mites, it would be necessary to identify the dominant group and the function in the ground. This relationship expresses the ecological state of the edaphic environment. | [7] |
| Earthworms/Termites | Earthworm dominance means conserved habitats, and termite prevalence means less conserved habitats, as they are considered opportunistic and resistant to induced disturbances. | [6] |
| CMB and NMB/COT and NT | Reflect that the MB is determined by the quantity and quality of the OM. An increase or decrease in the content of microbial C and N, will depend specifically on soil management. | [62] |
| MB/Enzymatic activities | In wooded soils, they indicate inactivity of microorganisms due to limited availability of C and N. This is with the exception of acid phosphatase. | [62] |
| Soil respiration/CMB | Indicates the proportion of turnover and importance of OC in the soil for a general improvement. | [58] |
| GMEa/nematode functionality ratio | Is a clear indicator of changes in soil quality, demonstrating sensitivity to heavy metals. | [63] |
| C/N | Low values of N indicate low quality humus. The presence of lignins and phenols may decrease the amount of C. | [53] |
| Particulate OM/OM | If it is positive, it is considered an important indicator of the rate of decomposition. | [53] |
| Particulate OM/soil respiration | Related to OM cycling and nutrient availability. It shows the relationship between N mineralization capacity, quality of plant residues, and soil respiration. | [53] |
| Potentially mineralizable N/soil respiration | Is related to disturbance and acidity of the soil that favors fungal growth. It shows the relationship between OM, N mineralizable potential, and edaphic respiration. | [53] |
© 2020 by the authors. Licensee MDPI, Basel, Switzerland. This article is an open access article distributed under the terms and conditions of the Creative Commons Attribution (CC BY) license (http://creativecommons.org/licenses/by/4.0/).
Share and Cite
Huera-Lucero, T.; Labrador-Moreno, J.; Blanco-Salas, J.; Ruiz-Téllez, T. A Framework to Incorporate Biological Soil Quality Indicators into Assessing the Sustainability of Territories in the Ecuadorian Amazon. Sustainability 2020, 12, 3007. https://0-doi-org.brum.beds.ac.uk/10.3390/su12073007
Huera-Lucero T, Labrador-Moreno J, Blanco-Salas J, Ruiz-Téllez T. A Framework to Incorporate Biological Soil Quality Indicators into Assessing the Sustainability of Territories in the Ecuadorian Amazon. Sustainability. 2020; 12(7):3007. https://0-doi-org.brum.beds.ac.uk/10.3390/su12073007
Chicago/Turabian StyleHuera-Lucero, Thony, Juana Labrador-Moreno, José Blanco-Salas, and Trinidad Ruiz-Téllez. 2020. "A Framework to Incorporate Biological Soil Quality Indicators into Assessing the Sustainability of Territories in the Ecuadorian Amazon" Sustainability 12, no. 7: 3007. https://0-doi-org.brum.beds.ac.uk/10.3390/su12073007