Using a Text Mining Approach to Hear Voices of Customers from Social Media toward the Fast-Food Restaurant Industry


1
Department of Marketing and Logistics Management, Chaoyang University of Technology, Taichung 413310, Taiwan
2
Department of Business Administration, Chaoyang University of Technology, Taichung 413310, Taiwan
3
College of Management, Dayeh University, Changhua 515006, Taiwan
4
Department of Information Management, Chaoyang University of Technology, Taichung 413310, Taiwan
*
Author to whom correspondence should be addressed.
Sustainability 2021, 13(1), 268; https://0-doi-org.brum.beds.ac.uk/10.3390/su13010268
Submission received: 30 November 2020
/
Revised: 22 December 2020
/
Accepted: 24 December 2020
/
Published: 30 December 2020
(This article belongs to the Special Issue Social Media Usage in Consumer Behavior Evaluation)
Abstract
:Due to the COVID-19 pandemic, the sales of fast-food businesses have dropped sharply. Customer satisfaction has always been one of the key factors for the sustainable development of enterprises. However, in the fast-food restaurant business, gaining the knowledge of customer satisfaction is one of the critical tasks. Moreover, text reviews in social media have become one of important reference sources for customers’ decisions in buying services and products. Therefore, the main purpose of this study is to explore whether customer voices from social media reviews are different during the COVID-19 outbreak and to propose a new method to reduce interpersonal contact when collecting data. A text mining scheme which includes least absolute shrinkage and selection operator (LASSO) and decision trees (DT) are presented to discover the essential factors for customers to increase their satisfaction from unstructured online customer reviews. Finally, three real world review sets were employed to validate the effectiveness of the presented text mining scheme. Experimental results can help companies to properly adapt to similar epidemic situations in the future and facilitate their sustainable development.
1. Introduction
Due to the COVID-19 pandemic, the McDonald’s Corp in 2020 reported that global sales decreased 23.9% in the 2nd quarter [1]. Many more fast-food restaurants (e.g., Dunkin, Wendy’s, Denny’s, Burger King) have been affected hard by COVID-19 outbreak [2]. COVID-19 has led to a dramatic shift in consumer behavior demand away from restaurants, food service, and others towards food consumed at home, requiring some critical changes for restaurants [3,4,5]. Consequently, restaurants are required to provide different food services to make their customers satisfied during the COVID-19 outbreak so that when this outbreak is over, those customers will become loyal to the fast-food restaurant due to their previous satisfaction of the service.
Customer satisfaction has always been one of the key factors for the sustainable development of enterprises. However, in the fast-food restaurant business, to gaining knowledge of customer satisfaction is one of the critical tasks. In fact, customer satisfaction maybe considered as the precondition for loyal customers in the fast-food restaurant industry [6,7]. It is important to satisfy customers, since they will order more from the fast-food restaurant, and they will order more after the COVID-19 era.
Regarding customer satisfaction surveys in the catering industry, previous related studies have used interviews or questionnaire surveys to obtain consumers’ opinions and responses. This type of approach, in addition to consuming a lot of labor power and material resources, cannot obtain a large amount of information and reflect consumer opinions in a timely manner, and sampling is also prone to bias [8]. During the COVID-19 period, interviews or questionnaire surveys may hasten the speed of infection. Moreover, electronic word-of-mouth (e-WOM) is becoming more and more important [9], but we seldom understand the opinions of community users in time.
Customers often express their personal opinions regarding service experiences. In social media, consumer text comments (e-WOM) can reflect customers’ true feelings, and they also refer to customers’ satisfaction with products, which is of great significance to online marketing [10]. These e-WOM will affect other social media users purchase intention, and have become one of the important reference sources for customers’ decisions in buying services, accommodations, and shopping.
Although online evaluation systems provide users with feedback mechanisms on purchased products and services, such as star ratings, reviews, and so on, compared to star ratings or sharing, the content of reviews has more valuable information [11,12]. Vásquez [13] indicated that negative comments include some verbal behaviors of consumers towards the industry, which include positive discussions, expectations, suggestions, content improvements, and warnings. Since customers in the catering industry often read other customers’ reviews, they are more likely to view other customers’ reviews as providing more reliable and relevant information, and they are more likely to be highly influenced by these review [14]. Customers’ positive reviews motivate others to increase their willingness to purchase products [15], which is also actively pursued by e-commerce vendors. The main reason is that the communication behavior of e-WOM affects the decisions of other consumers [16], which in turn affect market competition trends [17].
Additionally, users’ comments in social media have the features of communication and impact. Generally speaking, these unstructured comments represent the aggressive evaluation of customer reception. Other consumers’ decision-making behaviors are influenced by e-WOM. Textual reviews can be viewed as one of the important sources of customer voices.
To sum up, online reviews offer opportunities to examine customer satisfaction [18]. Online reviews reflect customer satisfaction or dissatisfaction regarding customers’ experiences toward purchased products and services [19]. Information gathering websites (e.g., Trustpilot) allow customer not only to write a review but also to give rating stars to score satisfaction. Customers’ ratings indicate their overall satisfaction [20,21,22]. Knowledge of the factors that influence customer satisfaction should be useful to restaurants to design and deliver the right offerings [19]. The perceptions include customer satisfaction and dissatisfaction [23] based on the assumptions that positive reviews indicate satisfaction and negative reviews indicate dissatisfaction. Online reviews also tend to offer an important source of information for enterprises to gain a better understanding of their product/service and market conditions [24]. Reviews are linked with the condition of the COVID-19 outbreak that we are facing now, so that fast-food restaurants can know clearly what the most crucial attributes of customer’s satisfaction are during COVID-19. Social distance will greatly influence the receiver’s perceptions regarding the review when browsing a customer’s comment [25]. It is important for managers to start caring about customer perceptions to their company in online reviews, since social distancing is required of almost people globally.
In today’s business world, consumers usually attempt to view online reviews before purchasing services and products [26,27,28]. In social media, their users can discuss and share restaurant-related information, and others can easily access their opinions [29]. According to a survey reported by ReportLinker in 2017, almost all (98%) customers trust online reviews and consider them as one of the most reliable information sources. Online comments have also given consumers more autonomy for their decision-making [30,31].
This study looks from the customer side about their perceptions of the service of restaurants during the COVID-19 outbreak. Particularly, this study tries to discover the most important attributes for the customer to gain satisfaction, since their satisfaction influences their loyalty to the company. Customer satisfaction also is crucial for restaurants in order to gain positive customer reviews and avoid negative reviews. It is quite important to know their voices, because they can impact prospective customers if they read online reviews from previous customers and remember these reviews as basic information to make decision about which restaurant they are going to choose after the COVID-19 pandemic era. An increased level of satisfaction leads to customer loyalty and, eventually, intentions to purchase more. Consequently, fast-food restaurants can have higher margins and positive word of mouth and decrease marketing and promotional activities [6,7].
To identify important satisfaction factors, feature selection approaches that aim to select crucial input variables have been employed in this study. Many feature selection methods have been well-developed. Among them, least absolute shrinkage and selection operator (LASSO) has been widely and successfully applied in many domains, such as un-revisit intension factors discovery [32], fraud risk detection [33], bankruptcy prediction [34], power prediction [35], and financial ratio selection [36]. Moreover, LASSO can improve prediction accuracy. Furthermore, LASSO is computationally efficient [34]. LASSO is powerful and helpful to this study, as it selects a few keywords that are more representative to the model, so we can easily label the words, and it is also facilitated by five-fold cross validation experiments to rank those words. In previous studies, Huang et al. [36] found that better results could be accomplished by including fewer but relatively more crucial features in a model. LASSO is useful for selecting the most fitted coefficients in the linear regression [37]. Consequently, LASSO has been utilized to find keywords in our presented scheme.
To sum up, this study aims to explore whether customer voices are different during the COVID-19 outbreak and propose a new data collection method to reduce interpersonal contact, which is the main route of infection. In order to replace the traditional questionnaire survey method, this study uses text comments from social media websites as our experimental data. A text mining scheme, which includes LASSO and decision trees (DT), is presented to discover the most essential factors for customers to increase their satisfaction from unstructured online customer reviews. Finally, three real-world review sets, including those of Domino’s, KFC, and McDonald’s, were employed to validate the effectiveness of the presented text mining model. Experimental results can help companies to properly adapt to similar epidemic situations in the future and facilitate their sustainable development.
2. Literature Review
2.1. Online Reviews in Social Media Websites
Online customer comments are one of important sources of customer information. These online reviews have great power to influence decision-making and purchasing behaviors [38]. Customer comments have the features of real-time and global influence [39]. Text reviews are informative, reflecting customer satisfaction or dissatisfaction and affect other consumer behaviors [15,40,41]. Compared with traditional questionnaire-style satisfaction surveys, the text in comments can more positively show consumers’ future intentions [42], and the difference between text comment analysis and past questionnaire surveys is that questionnaire surveys cannot obtain customer responses in real time, more labor power and time costs need to be considered, and there may be defects such as problems in question recognition [32].
Customer comments are powerful because they are written from a customer’s perspective and are indirect information sources [43]. Online restaurant reviews play an important role in e-WOM and help companies to attract new customers [44]. Additionally, consumers may perceive such comments as more credible information compared that direct information provided by enterprises [45].
In recent years, scholars have also put forward different views on online comments. For example, Cenni and Goethals [9] believe that although positive reviews affect other consumer decisions, negative reviews have more reference value for improving the quality of products or services, and when there are more negative reviews in the reviews, they are more important to other consumers after reading. The negative impact of repurchase may eventually lead to their decreased repurchase rate. Sánchez-García and Currás-Pérez [46] believe that dissatisfaction with consumer service experience will lead to negative e-WOM, and consumers who regret their experience are more likely to spread negative e-WOM, which greatly reduces future consumption willingness or repurchase intentions.
Some researchers have applied online reviews to gain knowledge of customer perceptions of products and services. Li et al. [27] investigated the effects of restaurant consumer experience and disconfirmation on the timing of online reviews. Wang, Tang, and Kim [47] used online reviews to examine the influential factors on review helpfulness for restaurants. The authors in [48] set up a model for competitiveness analysis by identifying comparative relations from online reviews about restaurants.
Traditional qualitative, quantitative, or mixed methods (e.g., questionnaire surveys, focus groups, or a combination of both) are time consuming and often inaccurate [49]. For example, it may result in biased conclusions from limited sample sizes or inconsistent measurement items and question items [50]. Not all consumers respond to questionnaires carefully, and many respondents fill them out randomly, introducing more noise for further analyses [49]. Furthermore, question items are normally set based on previously related studies [51]. Lucini et al. [52] believe online customer reviews that can decrease the biases of artificial responses compared to conventional tools including questionnaire surveys. Consequently, this study will use online reviews to be our experimental data instead of using questionnaire survey methods to collect data.
2.2. Leveraging Customer Satisfaction through Online Reviews
Customers’ comments can provide rich information which reflects the customers’ features and perceptions of service satisfaction [53]. Ratings and textual reviews are two ways to give an additional channel to know consumers’ concerns [54]. Ratings can give a quantitative measure of customers’ satisfaction. Customers also tend to express their feelings on the received services via textual comments [38]. Consequently, ratings can be considered as one of the best possible quantitative measures of customer satisfaction. Ensuring a good meal experience along with providing a high quality of service will lead to positive reviews and high satisfaction rating in forums and social media websites where one can post reviews [19].
Some researchers have used online reviews in many fields to know what makes customers satisfied with products and services. Rajaguru and Hassanli [55] used online reviews and ratings to know travelers’ purposes of travel and how hotel star ratings influenced the effects of the value for money perceived at hotels and service quality on customers’ satisfaction and word of mouth. Padma and Ahn [56] used reviews and ratings to examine the antecedents and outcomes of hotel guests’ satisfaction and dissatisfaction. Tao and Kim [57] used online cruise ship customer comments and ratings to gain knowledge of customer experience and its correlation with customer satisfaction with the cruise. Li et al. [58] used customer online reviews, including satisfaction ratings, to comprehend customer satisfaction with hotels. Cheng and Jin [59] studied the factors which influence Airbnb users’ experiences through online unstructured reviews.
Traditionally customer satisfaction is evaluated through consumer questionnaire surveys [60,61,62]. However, this kind of survey requires a lot of time and money [63]. Furthermore, from such surveys, the obtained data may quickly become outdated [64]. Consequently, it is worthwhile to consider other alternative data sources to measure customer satisfaction [63]. Compared to surveys, text comments are easily collected and have a low cost. Moreover, they are simpler for companies to manage [65,66,67,68]. Moreover, the amount of customer comments is very large, and the comments are contributed by a huge number of customers and can be viewed as “wisdom of crowds” [69]. Therefore, customer comments can be viewed as a promising data source to evaluate customer satisfaction [63]. To sum up, discovering knowledge from online reviews is one of the effective methods to gain knowledge of customer needs and to recognize crucial factors of customer satisfaction [70]. Therefore, this study employs text mining methods with natural language processing techniques to analyze online reviews.
2.3. Data Mining
Data mining helps researchers to investigate unsuspected relationships in the data and to provide useful insights to the data owners [71], so that when data mining techniques are used, they can give some new and essential insights that never been discovered before by the researchers and practitioners. Data mining has been applied for different tasks, especially for analyzing text, including online review comments. In recent years, major statistical software and data mining programs, such as text mining functions, have been developed to speed up the analysis process for unstructured data, including email, text comments, web documents, pictures, and images [72]. Analyzing data from online customer reviews by using data mining methods can provide meaningful insights into service performance [19]. Data mining approaches can deal with big data, while the traditional statistics techniques cannot easily handle large databases efficiently [73]. Cho et al. [74] discovered association rules of medicinal herb and skin-related keywords in a classical text by using data mining methods. In the work of Guo et al. [51], the authors analyzed 266,544 online reviews extracted from 25,670 hotels to recognize crucial dimensions of customer services based on data mining methods. Lim and Lee [75] used data mining methods to analyze passengers’ online comments regarding airline services. Thus, we know that using data mining to analyze customer satisfaction from online reviews is effective. In this research, data mining methods, feature selection, and decision trees were utilized to identify key features of customer satisfaction for fast-food restaurant businesses.
2.3.1. Feature Selection with LASSO
Nowadays, data can significantly increase the computational cost for data analytics. Furthermore, feature selection offers an effective method for removing unimportant attributes. High feature dimensionality may increase computational burden, have a negative influence on training models, and also reduce the readability and interpretability of feature space [76]. The major purpose of feature selection is to search for the most discriminative attributes from high-dimensional data to improve the performance of classifiers [77]. Then, the questions of primary interest are which variables are to be included in the model (variable/feature selection), and which feature selection algorithms are going to be used [78]. This study required a powerful algorithm to obtain the best features (words) to gain knowledge of restaurant customer voices through online reviews about the restaurant.
Feature selection approaches can be categorized into three groups, namely wrappers, filters, and embedded approaches [77]. Wrapper methods perform better than filter methods, but wrapper methods are more complex than filter methods. On the other hand, embedded methods can automatically select useful attributes during the learning process. As a result, embedded methods are more effective than both filter methods and wrapper methods [79]. Accordingly, embedded methods usually outperform other feature selection methods [80]. Among the embedded approaches, LASSO is a typical method [81].
Previous researchers have used LASSO with many successful applications for feature selection. Rahrovi Dastjerdi, Foroghi, and Kiani [33] employed LASSO detect manager’s fraud risk, and they found LASSO was more precise than CVX. Choudhury et al. [82] applied LASSO to predict cracks in a beam-like structure. Tian et al. [34] utilized LASSO and the discrete hazard model to predict bankruptcy. Sermpinis et al. [35] found that LASSO can significantly improve prediction performance. Huang et al. [36] employed LASSO to select financial ratios and build parsimonious models based on these ratios to increase interpretability of a model. Chang et al. [32] used LASSO to discover the un-revisit intension factors of hotels.
From the above-mentioned studies, we can conclude that LASSO is quite stable. Additionally, LASSO indeed can improve prediction accuracy for dealing with high dimensional data. Additionally, LASSO is computationally efficient [34]. Based on these reasons, this study used LASSO to obtain the most important variables (words) about restaurants.
2.3.2. Decision Trees
A decision tree developed by Quinlan [83] was utilized to evaluate the effectiveness of feature selection results. A decision tree is one of the most widely used classifiers [32]. Generally speaking, a decision tree is a tree-based method. Each path from the root represents a series of data segmentations until the result is reached at the leaf node. Yang [84] considered that the decision tree is the first choice of classification methods due to its clarity and understandability.
There have been many algorithms proposed to build decision trees, such as ID3 [83] and C4.5 algorithms, which are primary foci of research in the field of decision tree methods. C5.0 is the commercial version of C4.5. C5.0 offers a number of improvements on C4.5, including speed, memory usage, boosting support, weighting, and winnowing. Therefore, this study utilized the C5.0 algorithm to evaluate the performances of feature sets extracted by LASSO.
2.4. Text Mining
Text mining can be considered as a process of editing, organizing, and analyzing a large number of documents to provide specific information and discover the correlation between certain characteristics [85]. Unlike traditional data mining methods, it primarily transforms text into numerical data for further analysis. In other words, text mining aims to recognize the important information of the collected document and to discover hidden useful knowledge from documents. Because of the rapid increase in the number of online reviews in social media, those unstructured or semi-structured text data need to be processed by using text mining technology [86].
Recently, research related to the service industry has also used text mining for data analysis. For examples, Godnov and Redek [87] conducted sentiment analysis on 87 restaurant reviews in Croatia to confirm consumer demand. Hu et al. [88] grouped hotel review text information into groups to find more comprehensive information about the hotel to improve service quality. Wong and Qi [89] analyzed Macau’s traveler reviews on TripAdvisor from 2005 to 2013 and investigated the evolution of Macau over the years. Schuckert et al. [90] believed that traditional questionnaire surveys have experimental effects. Online reviews are objective, massive, and sample-bias-free. Moreover, text reviews can bring more information than questionnaires. Therefore, this study replaced questionnaire surveys and qualitative methods with text mining and reviews for data analysis and collection.
3. Presented Text Mining Scheme
This section introduces the presented text mining-based method, which includes LASSO and decision trees (DTs), to discover the most essential factors for customers’ satisfaction from unstructured online customer reviews. Three real world review sets of Domino’s, KFC, and McDonald’s were employed to validate the effectiveness of the presented text mining model. Specifically, the implemental procedure contained 5 steps, which are described in Section 3.1, Section 3.2, Section 3.3, Section 3.4 and Section 3.5, including data collection, data processing, feature selection, performance evaluation, and the defining of key factors.
3.1. Data Collection
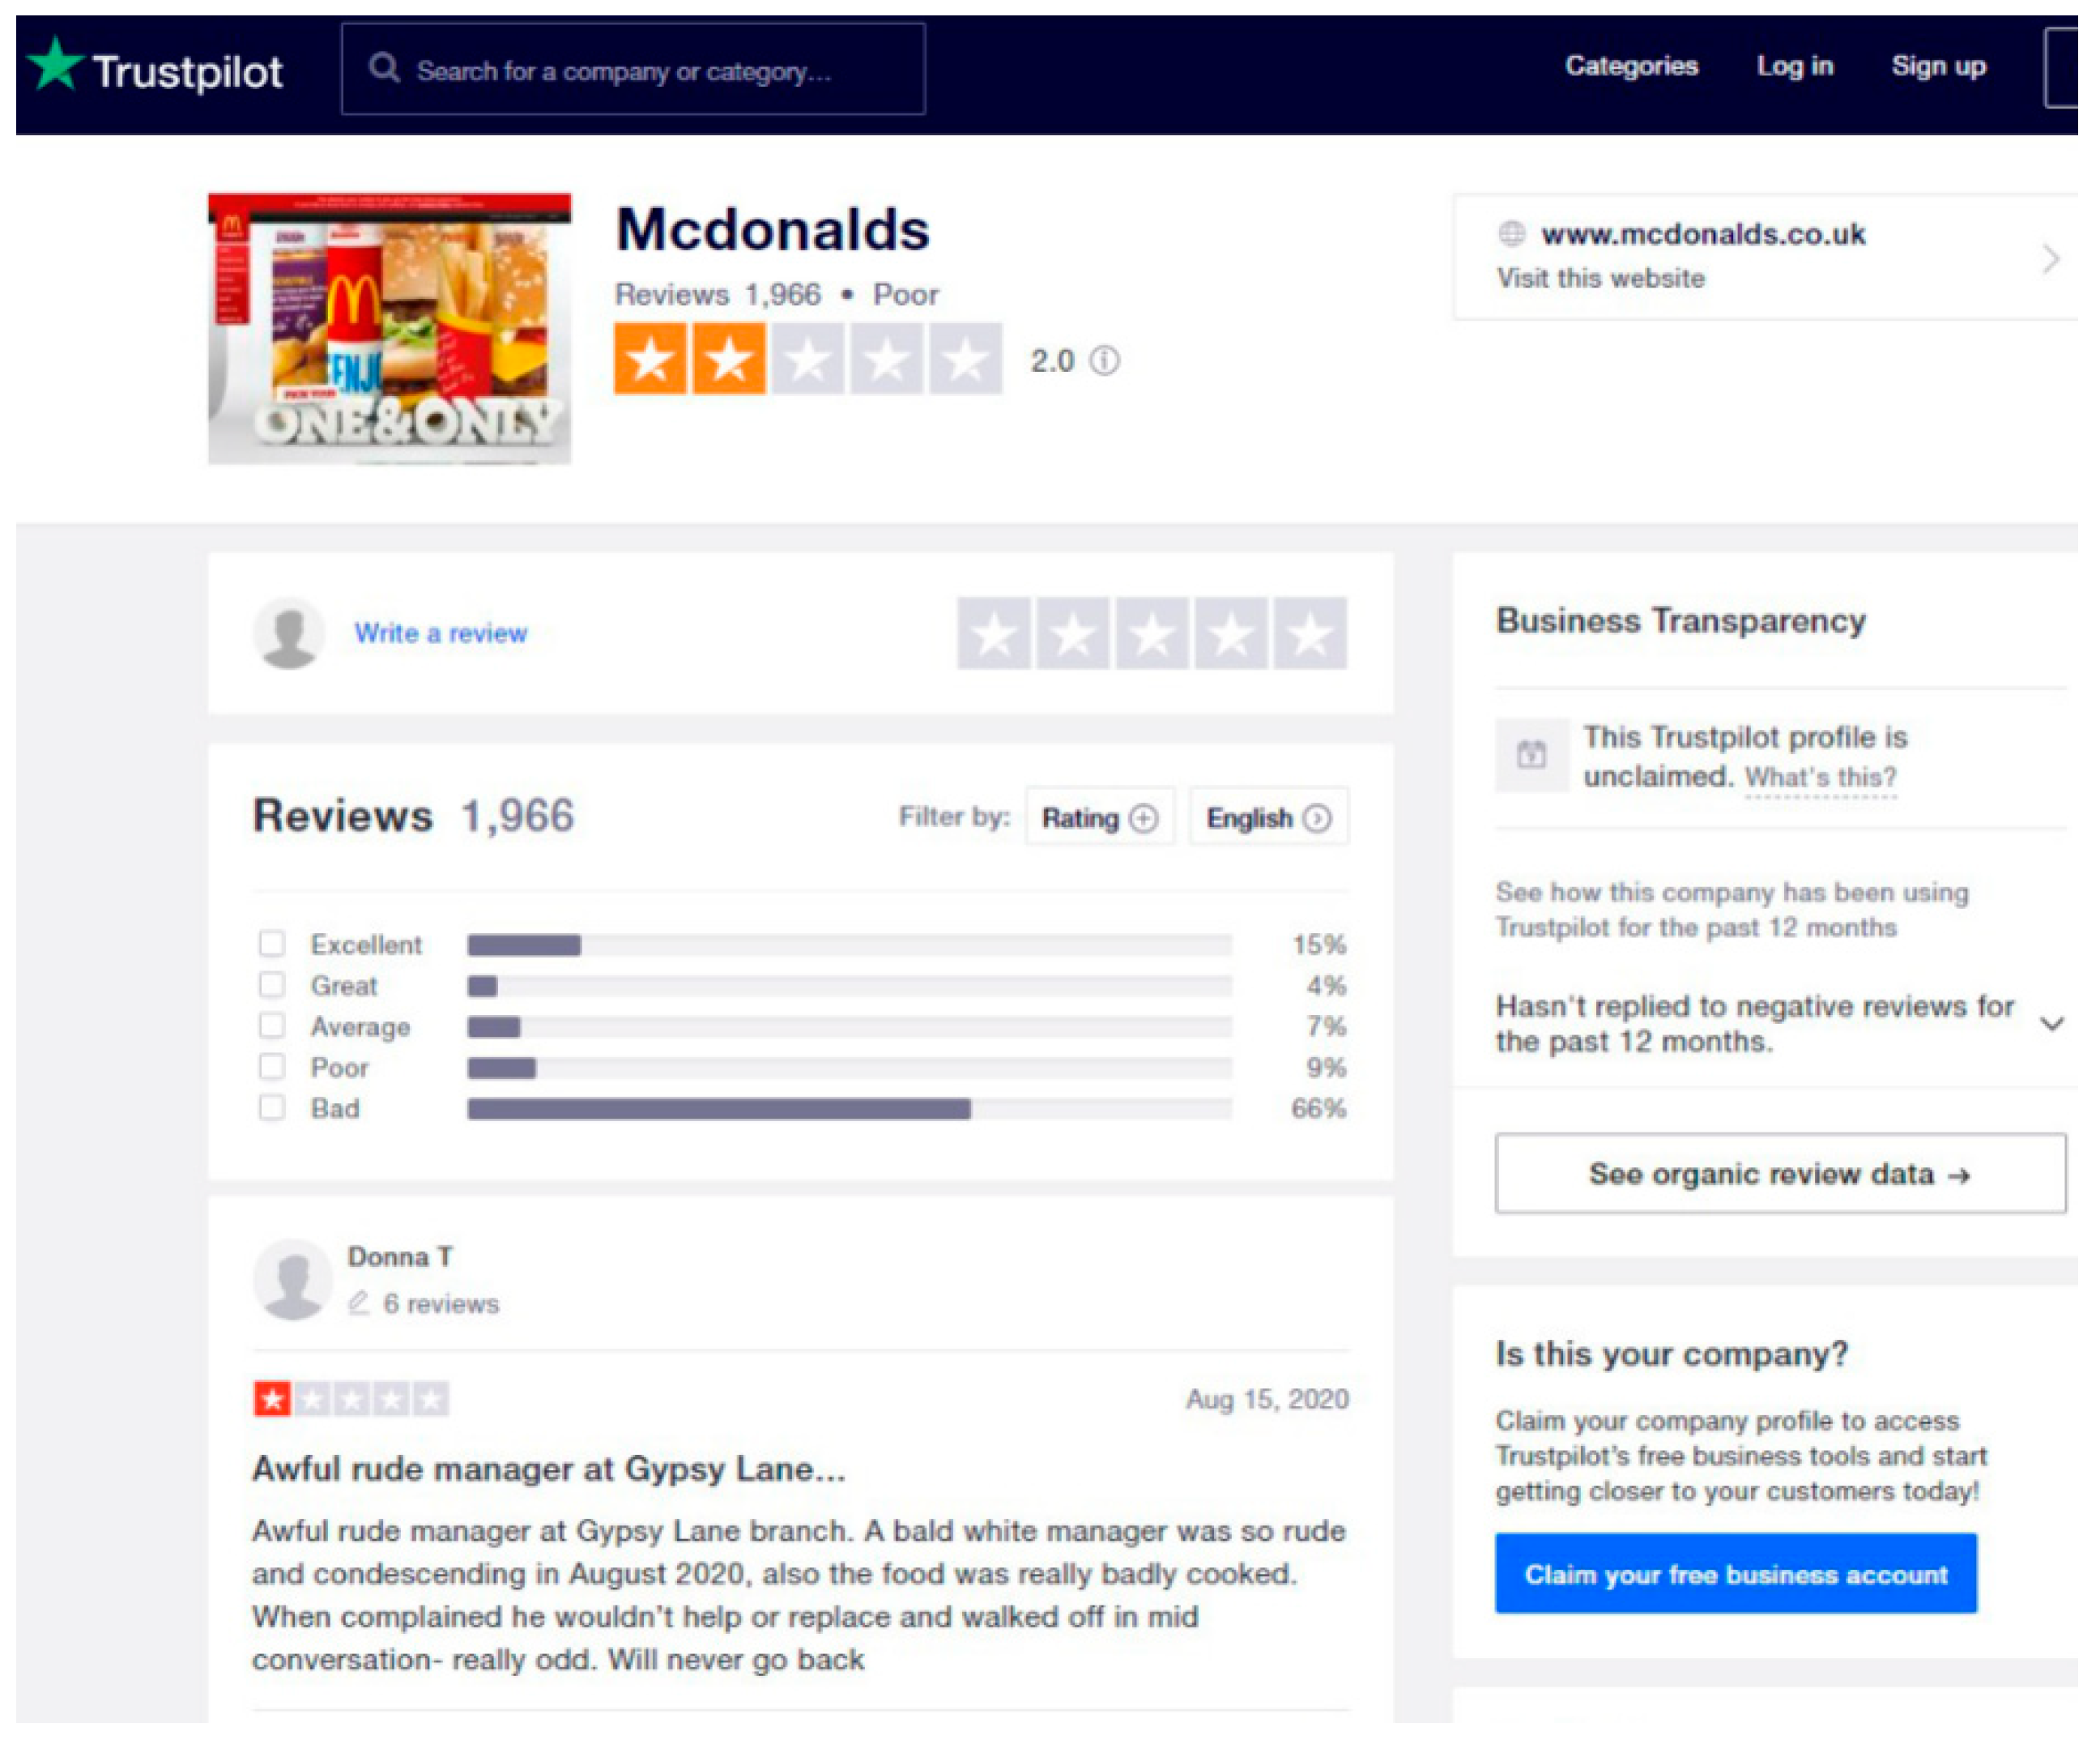
We collected reviews from Trustpilot.com, which is a Danish consumer review website. Trustpilot.com hosts business related reviews worldwide. Almost 1 million new reviews are posted monthly. An example can be found in Figure 1. Truspilot.com also allows users to rate their level of overall satisfaction about the service or products based on their experiences using a five-star rating system. Since this study focuses on customer satisfaction during the COVID-19 outbreak, we took the review’s overall rating and date, so that we could clearly make sure that the reviews were written during the COVID-19 outbreak. The United Kingdom (UK) government announced 1 March 2020 that the total number of COVID-19 confirmed cases in the UK was 35 [91], and as of 01 September 2020, 335,873 cases have been reported in the EU/EEA and the UK [92]. A total of 770 reviews were collected, 300 from Domino’s, 201 from KFC, and 269 from McDonald’s, from 1 March to 15 August 2020. After removing meaningless, too short, and no text content reviews, we obtained a total of 734 reviews for companies that were used for analysis, as shown in Table 1.
Customer online review websites allow users to both rate their experience and provide specific experiences about customer service to demonstrate their satisfaction level on a five-point scale [93]. Customer online review websites provide customer’s self-reported overall customer satisfaction [60,94]. The ratings were simplified to a binary scale. The overall scores of 1, 2, and 3 were labeled “−1” (unsatisfied), and scores of 4 and 5 were labeled as “+1” (satisfied). This technique converts the 5-point scale into a binary scale representing bad versus good customer satisfaction (−1 = unsatisfied and +1 = satisfied). Bilgihan et al. [19] also confirmed that the reviews with high ratings (4 and 5 out of a 5-point scale) can reflect customer satisfaction. Consequently, this study used overall customer rating scales that mirror customer satisfaction in the online reviews that were provided by information gathering websites.
3.2. Data Preprocessing
This part of the analysis used Rapidminer Studio 9.4 for certain data preprocessing steps. The tokenization function was used to transform the reviews into lowercase letters, and another function used a non-letter separator to separate the reviews into small pieces. The tokenize function has also been employed to ignore fewer than two letters, since those words do not provide important information. After tokenization, this step removes characters that are not needed, such as stop words, symbols, emoticons, and any useless characters from the review datasets, and only words with more than two letters are kept to be analyzed; stemming techniques are applied with functions to amalgamate different types of words. For examples, “safety”, “safeness”, and “safely” are cut short into the single token word “safe”, with the purpose being to bring single word concepts together [93]. Segment corpuses use bigram, in which two terms are often found together throughout the data, such as “delicious_food” and “fried_chicken, and a prune method is applied (Sezgen et al. [93]) by which any terms occurring less than five times in the dataset are removed. Finally, term frequency-inverse document frequency (TF-IDF) was built. TF-IDF can be defined as follows:
In Equation (1), TF represents term frequency. Furthermore, IDF indicates the general importance of a term in an entire set of documents, and a term’s IDF can be calculated as follows:
Therefore, when a word’s score of TF-IDF is high, it indicates that the word occurs frequently in the part of the documents. In this work, we used the TF-IDF to count the weights of a feature in a document. Finally, an initial 734 × 1977 term-by-document matrix (TDM) was constructed as the final result of the preprocessing process.
3.3. Feature Selection by Using LASSO
We built TDM with TF-IDF weights, and then this study attempted to employ MATLAB R2017a to run the LASSO algorithm in order to conduct regression and feature selection simultaneously to obtain the most important words to the model from the fast-food restaurant customer reviews.
Based on the above Equation (3), regression parameter value is limited by a particular penalty selection criterion. Given a k-explained transformation, the parameter estimate is selected for the important attributes. The parameter estimate is affected by the value of λ. There is one exception: when the k value approaches infinity, the parameter estimate is not limited, and then the estimate will be the value determined by the least-squares method. Nevertheless, the opposite situation is that when k is adjusted to 0 for all parameter estimates will be 0. Accordingly, it provides a feature subset according to which the coefficient is 0, which is not the criterion variables that we are looking for selecting keywords.
3.4. Performance Evaluation of Selected Features
In this step, we evaluated the performance of selected sub-feature sets by LASSO. DT was used to validate the selected features. The C5.0 algorithm was employed to build decision trees. Because it mainly uses the boosting method for training before each decision tree is constructed, the residual obtained from the previous tree was set as the learning coefficient. In the subsequent training, the prediction error was reduced to improve the accuracy of the model, and it took up fewer system resources and memory. Therefore, the speed of the calculation process was increased, and the training time was reduced. The training steps are as follows.
- Step 1. Defined input and output variables.
- Step 2. Separate training and test data sets.
- Step 3. Use the C5.0 algorithm to establish a decision tree.
- Step 4. Establish the initial rule tree.
- Step 5. Prune this rule tree to make it more readable.
- Step 6. Choose the best performing rule tree.
Moreover, we evaluated the performance of feature selection by using the measurement metrics, overall accuracy (OA), and F-measure (F1), which can be shown in Equations (4) and (7). In these equations, TP (true positive), FP (false positive), TN (true negative), and FN (false negative) represent “the number of satisfied reviews were correctly classified”, “the number of satisfied reviews were misclassified into un-satisfied”, “the number of un-satisfied reviews were correctly classified”, and “the number of un-satisfied reviews were misclassified into satisfied reviews”, respectively.
3.5. Defining the Key Factors
After the important words were found by LASSO, this step used those results to label them using a five-fold cross validation experiment which demonstrated the importance of each factor according to occurrence frequency. The whole data set was split into five equal parts. Each part was used as a testing test, and another four parts were used as training tests, and each took a turn, so five times experiments had to be done in this part in order to rank the important words based on their occurrence frequencies in five-fold, which was taken 5, 4, 3 times appearances, and so on. In terms of word frequency, we assumed that a topic was mentioned more frequently in the five-fold cross validation experiment when it was more significant to the model. The more occurrence frequency that words have, the more significant they are; and the more those words are contained in a particular topic, the more significant the topic is [75]. The increased occurrence of words mean they are more representative of the model [95]. Finally, for the selected features, we grouped the same keywords and defined the important factors.
4. Results
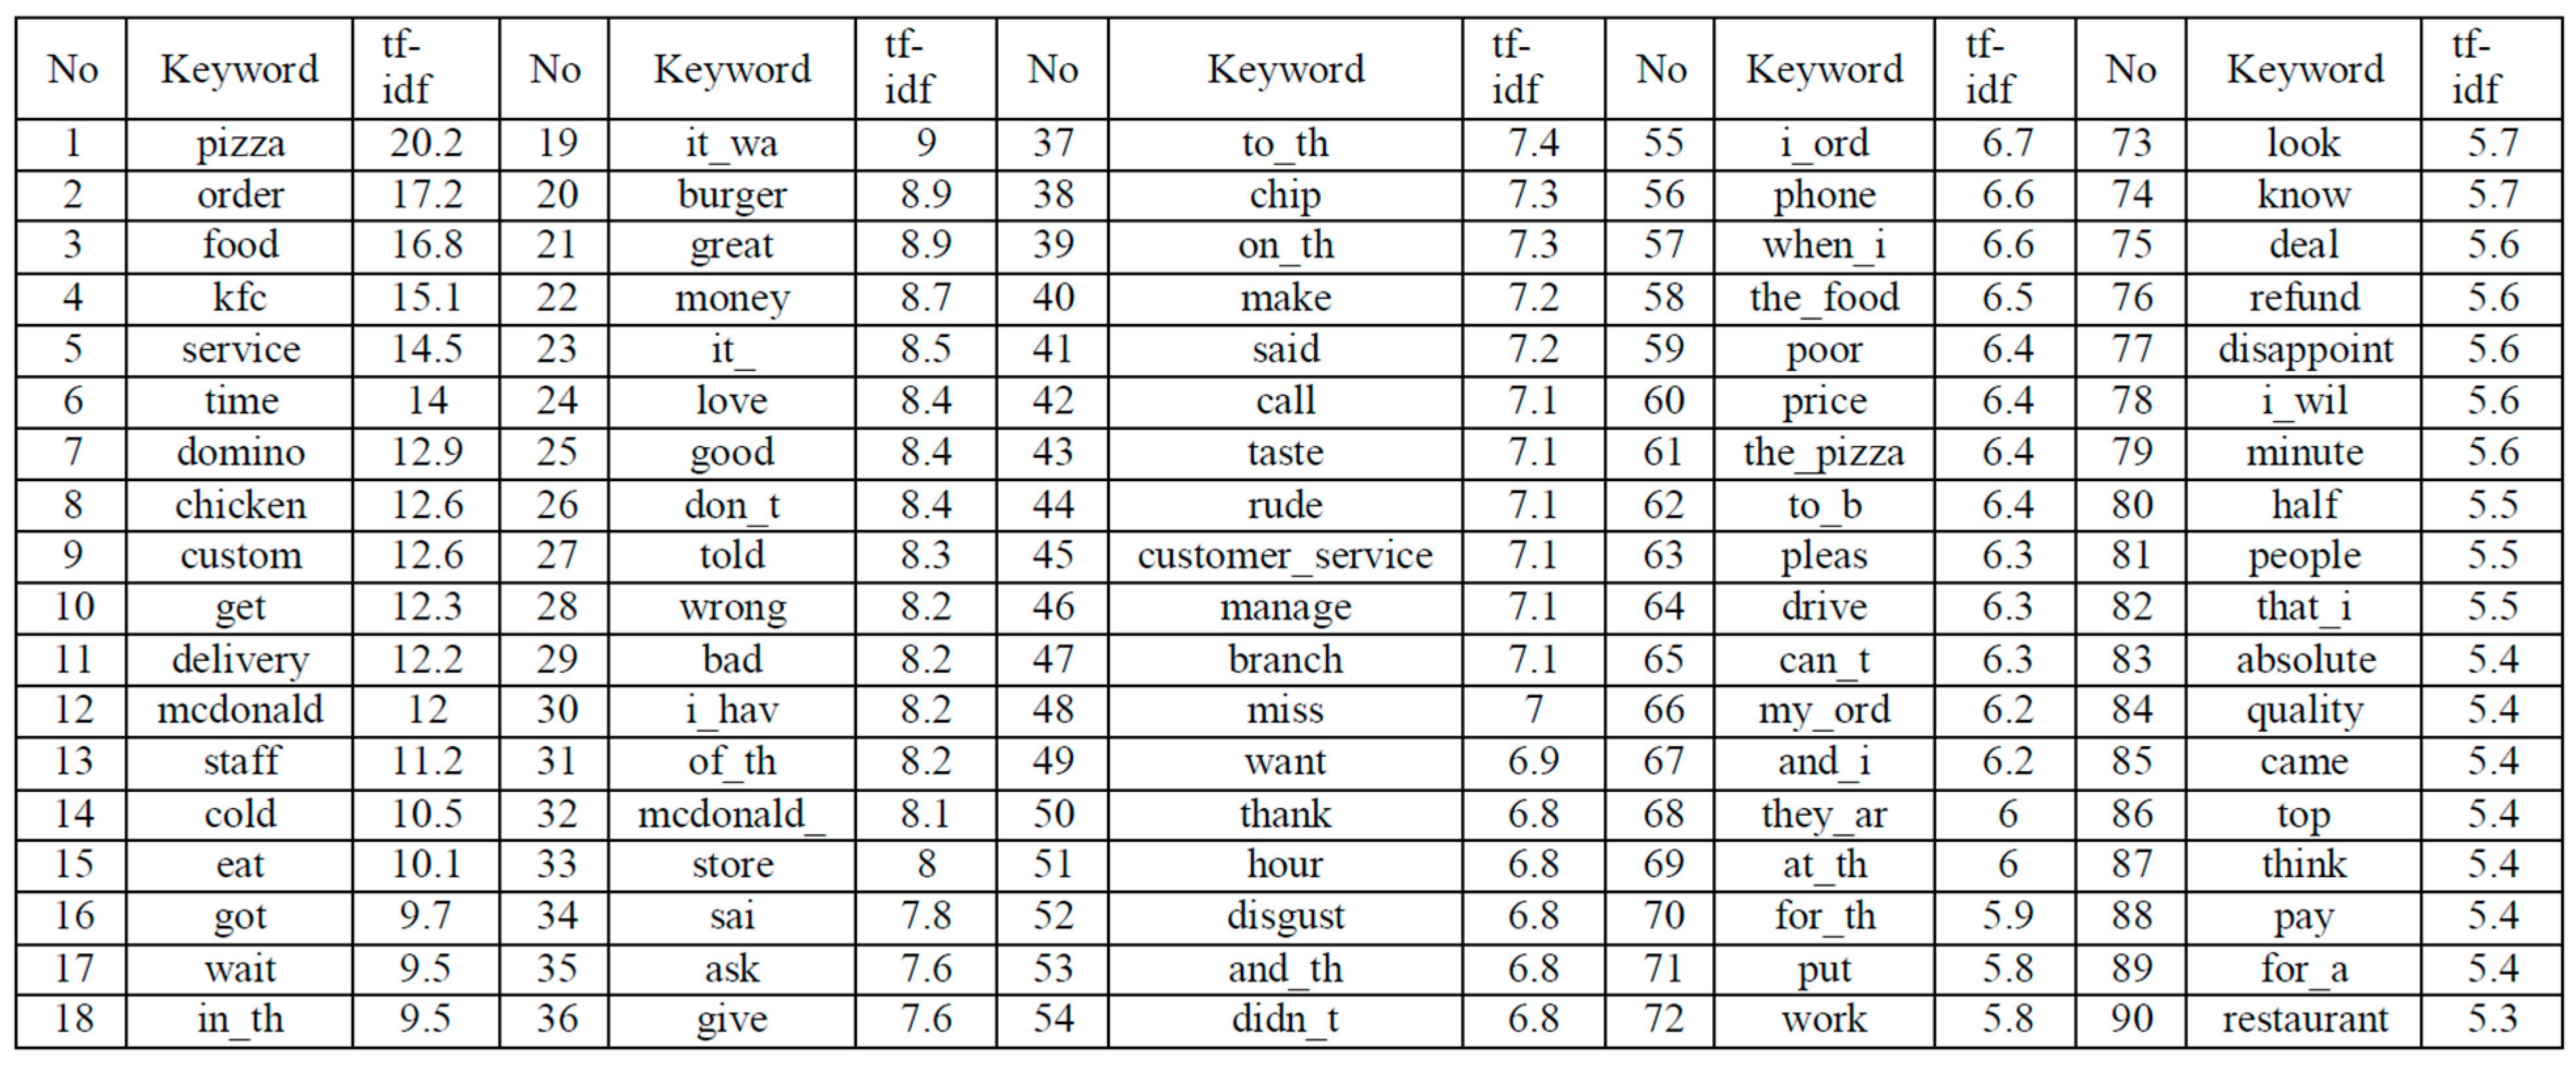
Before implementing LASSO, we ranked words in the collected data based on the sum of TF-IDF weights. Top ranked keywords in the collected reviews are shown in Figure 2. Then, we manually grouped those ranked words. Table 2 lists these groups. As seen in this table, there were mainly 6 groups. First, they talked about food, such as pizza, chicken, chip, and so on. Food quality was still the most mentioned in reviews. Furthermore, service quality included staff attitudes, and the delivery time of the meal was the second mentioned group. Next, customers cared about tangible equipment and promotion activities. Some reviews talked about COVID-19. For example, in addition to strongly related words such as COVID, corona, coronavirus, and mask, customers also expressed “missing conventional way of enjoying food” and “order meal by phone”, which could reflect the special situations during theCOVID-19 pandemic. The final group was about the sentiment of reviews. However, for the results shown in Table 2, we could not find a relationship between these words and customer satisfaction/dissatisfaction. Consequently, we further implemented LASSO.
This study used the five-fold cross-validation method. We first divided all the collected data into five equal parts and then used any one equal part as the test subset, in turn, and the other four equal parts as the training subset, in turn. Then, we picked out the important words based on the frequency in the results of the five-fold experiments. Then, we could construct feature subsets. In parameter setting of LASSO, we used built-in functions in MATLAB to filter out the important feature subsets. The estimated value is the value calculated by the least square method, with alpha set to 1 and λ set to 5, and the other arguments are those whose default value of is 1.
Table 3 summarizes the results of LASSO. According to the occurrence frequency, we could build two feature subsets, feature subset #1 and feature subset #2. In feature subset #1 (F#1), we picked up words the frequency of which was 5. Sixteen key words were included in this subset. In feature subset #2 (F#2), the words whose frequencies were larger than 3 (and equal to 3) were be selected. Therefore, there were 19 key words included in this subset. Next, we used these two feature subsets to build decision tree classifiers. Furthermore, the classification performances were compared to the decision tree, which was constructed by the original feature set (1977 words).
Table 4 summarizes the evaluation results between selected feature subsets and original features. Considering OA, F1, and computational time, we could find that both selected feature subsets outperformed the original feature set. Feature subset #1 had as good performance as feature subset #2. However, feature subset #1 contained fewer keywords (16) than feature subset #2 (19). Consequently, feature subset #1 (16 key words) was considered as important factors that affected customer satisfaction. Compared to the results of the original feature set, we could find that OA slightly increased by1.79%, and computational time decreases from 3.7 s to 0.02 s (it improved almost 99.45% in computational time), while the F1 was kept almost the same. Furthermore, the number of input variables used dramatically decreased from 1977 to 16 keywords. This meant that 16 significant keywords could have the same amount of information as1977 keywords.
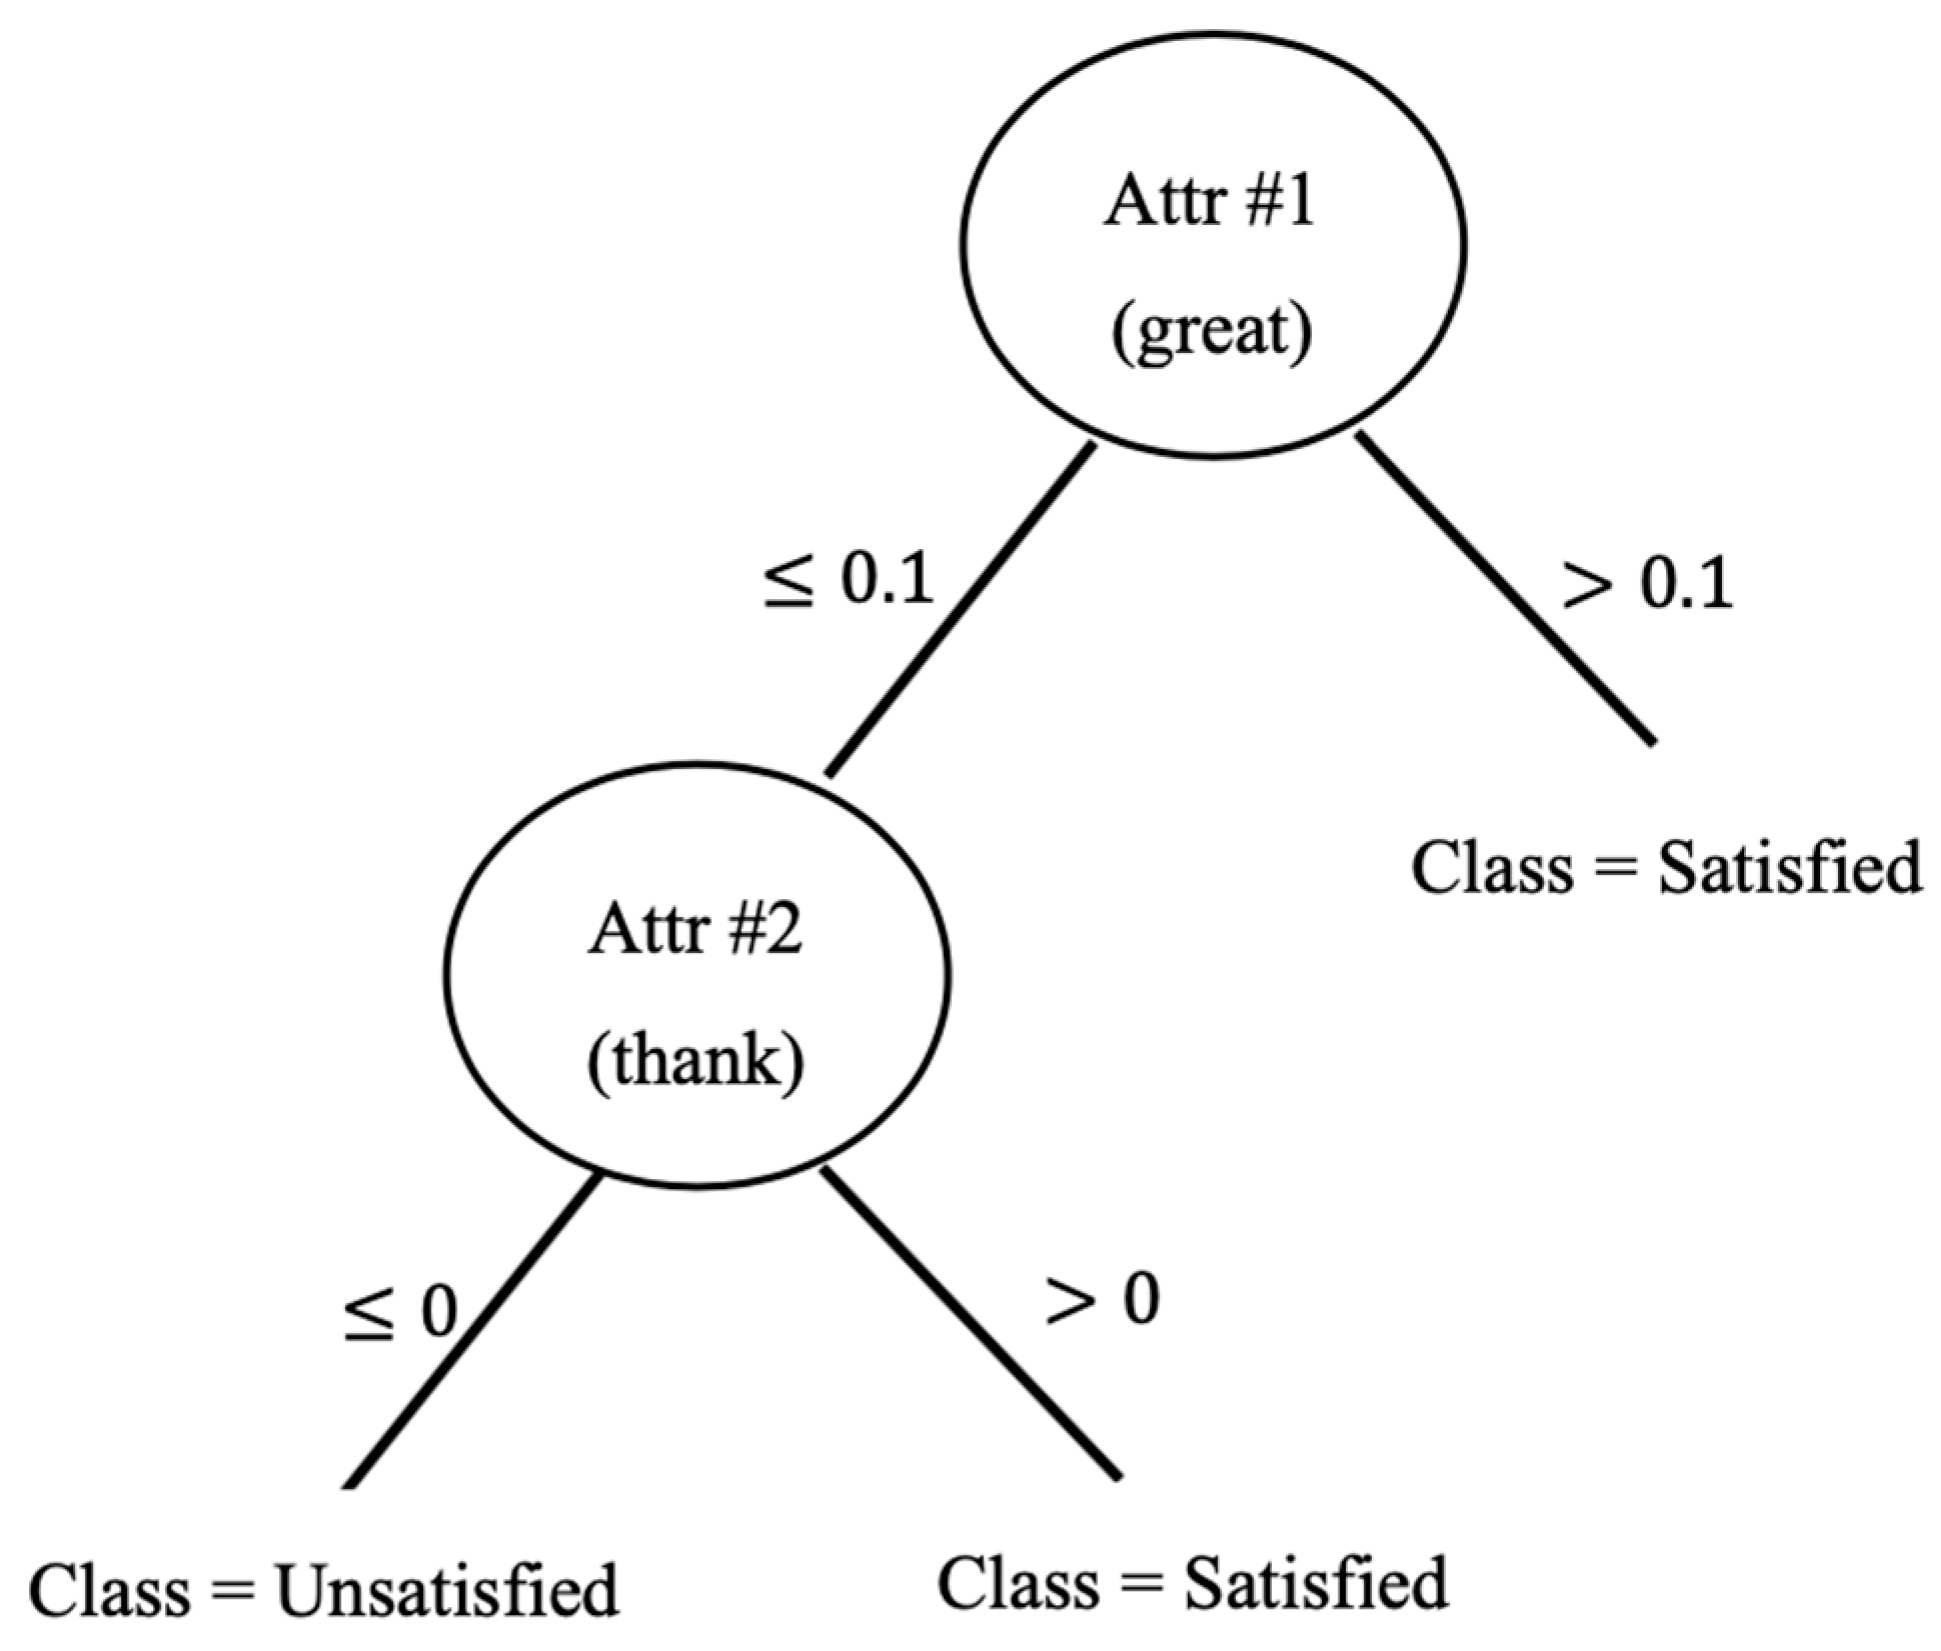
Since we implemented five-fold cross validation, we could build five decision trees. Figure 3 shows the decision tree with the highest classification accuracy in feature subset#1. In this tree, we could find that the keywords “great” and “thank” could heavily influence customer satisfaction. However, only two keywords were picked in this constructed tree. They were not explainable. Consequently, we attempted to organize the selected 16 keywords.
Next, we attempted to group these selected keywords manually. Table 5 lists the selected keywords. Feature subset #1 (F#1) was confirmed as crucial to customer satisfaction. In this table, we could discover that “food quality” and “service quality” were always the essentially important factors. The third factors were “sentiment”, which could express the positive or negative feeling of reviews. The sentiments of reviews can help fast-food companies to carefully respond the posted comments, which spread very fast, and negative comments can bring great damage to enterprises. They were also confirmed by DT results.
Moreover, although other factors were not confirmed as the important factors, they still could provide some useful information to hear the voices of customers. In collected reviews, factors such as “promptness”, “politeness”, and “staff policy” were also mentioned. If fast-food companies have enough resource, they can pay attention on them.
5. Discussion and Conclusions
In this study, we proposed a text mining scheme to discover customer satisfaction from text comments from social media. During the COVID-19 outbreak, the proposed scheme indeed can collect data without interpersonal contact, which is the main method of infection. Moreover, we also discovered customer voices for the fast-food industry.
From collected reviews, the results reveal that fast-food restaurant customers are the most concerned with food quality in increasing their satisfaction, which was also shown by Namin [6]. In addition, service quality was also confirmed as an essential factor for customer satisfaction. Therefore, we can conclude that food quality and service quality are still some of the most important factors of fast-food restaurant customer satisfaction, either in the normal situation or during the COVID-19 outbreak situation. In the face of a severe epidemic, we still have to maintain good service quality under safety protections.
In addition, promptness is also one of the most important factors of their satisfaction. When it is fulfilled, they turn to shift their attention to politeness of fast-food restaurant staff. During the COVID-19 outbreak, they put staff policy as the least important attribute to increase their customer satisfaction, since the policy was new for them because restaurant changed some policies to prevent and protect their staff from corona virus. The UK government made guidance for restaurants about how to service their customer, such as providing takeaway and food delivery and focuses on the hygiene processes and requirements during theCOVID-19 outbreak.
This study collected reviews during the outbreak period to discover the key factors affecting customer satisfaction. We can see from the frequency of keywords mentioned in Table 2. Compared with the normal period, during the epidemic period, customers obviously pay more attention to safety protections. This can be seen from the increase in the frequency of certain words, such as COVID, mask, corona, and so on. However, as in the normal period, customers still care about basic satisfaction factors, such as the food and service quality. In addition, from the decision tree diagram shown in Figure 3, sentiment of a review obviously has a significant impact on customer satisfaction. Due to the remarkable influence of e-WOM on social media, in addition to taking into account the quality of basic products and services, fast-food businesses still need to be more careful in handling negative sentimental comments in the community.
To sum up, in the fast-food restaurant business, gaining knowledge of customer satisfaction is one of the critical tasks. However, traditionally, we use questionnaire surveys to collected customer responses. This survey method is a time-consuming investigation, it difficult to obtain instant customer feedback using this method, and it is easy to have sampling bias. In the outbreak period, this method may not avoid interpersonal contact, which may hasten the speed of infection. Text reviews in social media have recently been shown to be influential to customers’ attitudes and purchasing behaviors. Therefore, this study presented a text mining scheme that finds crucial customer satisfaction factors from text comments in social media websites. In this text mining scheme, natural language processing techniques and data mining approaches, which include LASSO and decision trees, discover the most essential factors for customers to increase their satisfaction from unstructured online customer reviews.
Three real world review sets of Domino’s, KFC, and McDonald’s were utilized to demonstrate the effectiveness of the presented text mining scheme. In our results, food quality and service quality, following promptness, are still leading as essential factors of fast-food customer satisfaction during the COVID-19 outbreak. The results can help managers to act properly in terms of those factors. This study also can help companies to properly adapt to similar epidemic situations in the future and facilitate their sustainable development.
In addition, this study also offers managers and researchers a new way to gain knowledge of customers’ voices of the products and services. Through online customer reviews, we can obtain new and important insights, since the reviews are written by customers based on their willingness and not by questions asked, so it may be more honest than traditional surveys (e.g., questionnaire surveys, focus groups, or a combination of both). Instead of using conventional questionnaire survey methods to collect data, we utilize online customer reviews to be our data source. This way can save some labor power.
In practice, this study can quickly find out the important factors affecting customer satisfaction in the catering industry from the text comments on social media, which can provide the industry with improved product quality, appropriately adapt to the large number of customer reviews in social media, and provide industry improvement suggestions in terms of service quality. In terms of academic contributions, in order to improve the shortcomings of questionnaires and interviews, this study proposed a text mining scheme, which not only can improve the sampling errors generated by questionnaire surveys but also discover the key factors affecting satisfaction in real time.
Fast-food restaurant managers can pay attention to online customer reviews since their customers often write their thoughts and opinions of the products and services, and prospective customers will read those thoughts and opinions, so it is so crucial in order to survive and win in the market. Hospitality business customers are becoming increasingly dependent on online reviews; therefore, it is critical for hospitality businesses to monitor and manage online reviews.
For potential directions of future works, different feature selection methods can be employed. Moreover, other industries, which have been heavily affected by customer reviews in social media websites, such as travel and accommodation reservation websites, can be the research targets to hear the voice of customers. Online shopping websites also can use our presented text mining scheme to evaluate customer satisfaction.
Author Contributions
Conceptualization, D.R. and L.-S.C.; methodology, W.-K.C.; software, D.R.; validation, W.-K.C. and L.-S.C.; formal analysis, D.R.; investigation, D.R.; resources, D.R.; data curation, D.R.; writing—original draft preparation, D.R.; writing—review and editing, W.-K.C. and L.-S.C.; visualization, W.-K.C.; supervision, L.-S.C.; project administration, L.-S.C.; funding acquisition, L.-S.C. All authors have read and agreed to the published version of the manuscript.
Funding
This work was supported in part by Ministry of Science and Technology, Taiwan (Grant No. MOST 108-2410-H-324-009).
Institutional Review Board Statement
Not applicable.
Informed Consent Statement
Not applicable.
Data Availability Statement
Data is contained within the article.
Conflicts of Interest
All authors declare no conflict of interest in this paper.
References
- Reuters. McDonald’s Global Sales Suffer as COVID-19 Lockdowns Limit Operations. 2020. Available online: https://www.reuters.com/article/us-mcdonald-s-corp-results/mcdonalds-global-sales-suffer-as-covid-19-lockdowns-limit-operations-idUSKCN24T1FO (accessed on 15 September 2020).
- Forbes. Fast Food Breakfast Faces a Long Recovery from the COVID-19 Crisis. 2020. Available online: https://www.forbes.com/sites/aliciakelso/2020/06/24/fast-food-breakfast-faces-a-long-recovery-from-the-covid-19-crisis/#cd75fc739d44 (accessed on 15 September 2020).
- McKinsey & Company. Delivering When It Matters: Quick-Service Restaurants in Coronavirus Times. 2020. Available online: https://www.mckinsey.com/industries/retail/our-insights/delivering-when-it-matters-quick-service-restaurants-in-coronavirus-times (accessed on 15 September 2020).
- OECD. Food Supply Chains and COVID-19: Impacts and Policy Lessons. 2020. Available online: https://0-read-oecd--ilibrary-org.brum.beds.ac.uk/view/?ref=134_134305-ybqvdf0kg9&title=Food-Supply-Chains-and-COVID-19-Impacts-and-policy-lessons (accessed on 15 September 2020).
- World Economic Forum. China Offers Insight into What Restaurants Could Look Like Post-COVID. 2020. Available online: https://www.weforum.org/agenda/2020/07/how-china-s-restaurants-are-adapting-to-a-post-coronavirus-world/ (accessed on 15 September 2020).
- Namin, A. Revisiting customers’ perception of service quality in fast food restaurants. J. Retail. Consum. Serv. 2017, 34, 70–81. [Google Scholar] [CrossRef]
- Uddin, M.B. Customer loyalty in the fast food restaurants of Bangladesh. Br. Food J. 2019, 121, 2791–2808. [Google Scholar] [CrossRef]
- Chang, J.-R.; Chen, M.-Y.; Chen, L.-S.; Chien, W.-T. Recognizing Important Factors of Influencing Trust in O2O Models: An Example of OpenTable. Soft Comput. 2020, 24, 7907–7923. [Google Scholar] [CrossRef]
- Cenni, I.; Goethals, P. Negative hotel reviews on TripAdvisor: A cross-linguistic analysis. Discourse Context Media 2017, 16, 22–30. [Google Scholar] [CrossRef]
- Chen, L.; Jiang, T.; Li, W.; Geng, S.; Hussain, S. Who should pay for online reviews? Design of an online user feedback mechanism. Electron. Commer. Res. Appl. 2017, 23, 38–44. [Google Scholar] [CrossRef]
- Sohail, S.S.; Siddiqui, J.; Ali, R. Feature extraction and analysis of online reviews for the recommendation of books using opinion mining technique. Perspect. Sci. 2016, 8, 754–756. [Google Scholar] [CrossRef] [Green Version]
- Bhole, B.; Hanna, B. The effectiveness of online reviews in the presence of self-selection bias. Simul. Model. Pract. Theory 2017, 77, 108–123. [Google Scholar] [CrossRef]
- Vásquez, C. Complaints online: The case of TripAdvisor. J. Pragmat. 2011, 43, 1707–1717. [Google Scholar] [CrossRef] [Green Version]
- Amaro, S.; Duarte, P.; Henriques, C. Travelers’ use of social media: A clustering approach. Ann. Tour. Res. 2016, 59, 1–15. [Google Scholar] [CrossRef]
- Abubakar, A.M.; Ilkan, M.; Al-Tal, R.M.; Eluwole, K.K. eWOM, revisit intention, destination trust and gender. J. Hosp. Tour. Manag. 2017, 31, 220–227. [Google Scholar] [CrossRef]
- Bronner, F.; De Hoog, R. Vacationers and eWOM: Who posts, and why, where, and what? J. Travel Res. 2011, 50, 15–26. [Google Scholar] [CrossRef]
- Erkan, I.; Evans, C. The influence of eWOM in social media on consumers’ purchase intentions: An extended approach to information adoption. Comput. Hum. Behav. 2016, 61, 47–55. [Google Scholar] [CrossRef]
- Xu, X. Does traveler satisfaction differ in various travel group compositions? Evidence from online reviews. Int. J. Contemp. Hosp. Manag. 2018, 30, 1663–1685. [Google Scholar] [CrossRef]
- Bilgihan, A.; Seo, S.; Choi, J. Identifying restaurant satisfiers and dissatisfiers: Suggestions from online reviews. J. Hosp. Mark. Manag. 2018, 27, 601–625. [Google Scholar] [CrossRef]
- Banerjee, S.; Chua, A.Y.K. In search of patterns among travellers’ hotel ratings in TripAdvisor. Tour. Manag. 2016, 53, 125–131. [Google Scholar] [CrossRef]
- Schuckert, M.; Liu, X.; Law, R. Hospitality and Tourism Online Reviews: Recent Trends and Future Directions. J. Travel Tour. Mark. 2015, 32, 608–621. [Google Scholar] [CrossRef]
- Zhao, Y.; Xu, X.; Wang, M. Predicting overall customer satisfaction: Big data evidence from hotel online textual reviews. Int. J. Hosp. Manag. 2019, 76, 111–121. [Google Scholar] [CrossRef]
- Berezina, K.; Bilgihan, A.; Cobanoglu, C.; Okumus, F. Understanding Satisfied and Dissatisfied Hotel Customers: Text Mining of Online Hotel Reviews. J. Hosp. Mark. Manag. 2016, 25, 1–24. [Google Scholar] [CrossRef]
- Korfiatis, N.; Stamolampros, P.; Kourouthanassis, P.; Sagiadinos, V. Measuring service quality from unstructured data: A topic modeling application on airline passengers’ online reviews. Expert Syst. Appl. 2019, 116, 472–486. [Google Scholar] [CrossRef] [Green Version]
- Hernández-Ortega, B. Don’t believe strangers: Online consumer reviews and the role of social psychological distance. Inf. Manag. 2018, 55, 31–50. [Google Scholar] [CrossRef]
- Li Hengyun Zhang, Z.; Meng, F.; Janakiraman, R. Is peer evaluation of consumer online reviews socially embedded?—An examination combining reviewer’s social network and social identity. Int. J. Hosp. Manag. 2017, 67, 143–153. [Google Scholar] [CrossRef]
- Li, H.; Xie, K.L.; Zhang, Z. The effects of consumer experience and disconfirmation on the timing of online review: Field evidence from the restaurant business. Int. J. Hosp. Manag. 2020, 84, 1023442. [Google Scholar] [CrossRef]
- Zhang, Z.; Li, H.; Meng, F.; Qiao, S. Gender difference in restaurant online booking timing and the moderating effects of sell-out risk and information type. J. Electron. Commer. Res. 2018, 19, 266–279. [Google Scholar]
- Khorsand, R.; Rafiee, M.; Kayvanfar, V. Insights into TripAdvisor’s online reviews: The case of Tehran’s hotels. Tour. Manag. Perspect. 2020, 34, 100673. [Google Scholar] [CrossRef]
- EHL. Online Customer Reviews: Their Impact on Restaurants. 2020. Available online: https://hospitalityinsights.ehl.edu/online-customer-reviews-restaurants (accessed on 15 September 2020).
- Šerić, M.; Praničević, D. Consumer-Generated Reviews on Social Media and Brand Relationship Outcomes in the Fast-Food Chain Industry. J. Hosp. Mark. Manag. 2018, 27, 218–238. [Google Scholar] [CrossRef]
- Chang, J.-R.; Chen, M.-Y.; Chen, L.-S.; Tseng, S.-C. Why Customers Don’t Revisit in Tourism and Hospitality Industry? IEEE Access 2019, 7, 146588–146606. [Google Scholar] [CrossRef]
- Rahrovi Dastjerdi, A.; Foroghi, D.; Kiani, G.H. Detecting manager’s fraud risk using text analysis: Evidence from Iran. J. Appl. Account. Res. 2019, 20, 154–171. [Google Scholar] [CrossRef]
- Tian, S.; Yu, Y.; Guo, H. Variable selection and corporate bankruptcy forecasts. J. Bank. Financ. 2015, 52, 89–100. [Google Scholar] [CrossRef]
- Sermpinis, G.; Tsoukas, S.; Zhang, P. Modelling market implied ratings using LASSO variable selection techniques. J. Empir. Financ. 2018, 48, 19–35. [Google Scholar] [CrossRef] [Green Version]
- Huang, J.; Wang, H.; Kochenberger, G. Distressed Chinese firm prediction with discretized data. Manag. Decis. 2017, 55, 786–807. [Google Scholar] [CrossRef]
- Sant’Anna, L.R.; Caldeira, J.F.; Filomena, T.P. LASSO-based index tracking and statistical arbitrage long-short strategies. N. Am. J. Econ. Financ. 2020, 51, 101055. [Google Scholar] [CrossRef] [Green Version]
- Chatterjee, S. Explaining customer ratings and recommendations by combining qualitative and quantitative user generated contents. Decis. Support Syst. 2019, 119, 14–22. [Google Scholar] [CrossRef]
- Liu, Z.; Park, S. What makes a useful online review? Implication for travel product websites. Tour. Manag. 2015, 47, 140–151. [Google Scholar] [CrossRef] [Green Version]
- Xu, X.; Li, Y. The antecedents of customer satisfaction and dissatisfaction toward various types of hotels: A text mining approach. Int. J. Hosp. Manag. 2016, 55, 57–69. [Google Scholar] [CrossRef]
- Ibrahim, B.; Aljarah, A. Dataset of relationships among social media marketing activities, brand loyalty, revisit intention. Evidence from the hospitality industry in Northern Cyprus. Data Brief 2018, 21, 1823–1828. [Google Scholar] [CrossRef]
- Kim, K.; Park, O.J.; Yun, S.; Yun, H. What makes tourists feel negatively about tourism destinations? Application of hybrid text mining methodology to smart destination management. Technol. Forecast. Soc. Chang. 2017, 123, 362–369. [Google Scholar] [CrossRef]
- Huifeng, P.; Ha, H.Y.; Lee, J.W. Perceived risks and restaurant visit intentions in China: Do online customer reviews matter? J. Hosp. Tour. Manag. 2020, 43, 179–189. [Google Scholar] [CrossRef]
- Nakayama, M.; Wan, Y. The cultural impact on social commerce: A sentiment analysis on Yelp ethnic restaurant reviews. Inf. Manag. 2019, 56, 271–279. [Google Scholar] [CrossRef]
- Calheiros, A.C.; Moro, S.; Rita, P. Sentiment Classification of Consumer-Generated Online Reviews Using Topic Modeling. J. Hosp. Mark. Manag. 2017, 26, 675–693. [Google Scholar] [CrossRef] [Green Version]
- Sánchez-García, I.; Currás-Pérez, R. Effects of dissatisfaction in tourist services: The role of anger and regret. Tour. Manag. 2011, 32, 1397–1406. [Google Scholar] [CrossRef]
- Wang, X.; Tang, L. (Rebecca); Kim, E. More than words: Do emotional content and linguistic style matching matter on restaurant review helpfulness? Int. J. Hosp. Manag. 2019, 77, 438–447. [Google Scholar] [CrossRef]
- Wang, H.; Gao, S.; Yin, P.; Liu, J.N.K. Competitiveness analysis through comparative relation mining Evidence from restaurants’ online reviews. Ind. Manag. Data Syst. 2017, 117, 672–687. [Google Scholar] [CrossRef]
- Wan, Y.; Gao, Q. An Ensemble Sentiment Classification System of Twitter Data for Airline Services Analysis. In Proceedings of the 15th IEEE International Conference on Data Mining Workshop, ICDMW 2015, Atlantic City, NJ, USA, 14–17 November 2015; pp. 1318–1325. [Google Scholar] [CrossRef]
- Chow, C.K.W. On-time performance, passenger expectations and satisfaction in the Chinese airline industry. J. Air Transp. Manag. 2015, 47, 39–47. [Google Scholar] [CrossRef]
- Guo, Y.; Barnes, S.J.; Jia, Q. Mining meaning from online ratings and reviews: Tourist satisfaction analysis using latent dirichlet allocation. Tour. Manag. 2017, 68, 35–47. [Google Scholar] [CrossRef] [Green Version]
- Lucini, F.R.; Tonetto, L.M.; Fogliatto, F.S.; Anzanello, M.J. Text mining approach to explore dimensions of airline customer satisfaction using online customer reviews. J. Air Transp. Manag. 2020, 83, 101760. [Google Scholar] [CrossRef]
- Gao, B.; Li, X.; Liu, S.; Fang, D. How power distance affects online hotel ratings: The positive moderating roles of hotel chain and reviewers’ travel experience. Tour. Manag. 2018, 5, 176–186. [Google Scholar] [CrossRef]
- Wang, J.-Q.; Zhang, X.; Zhang, H.-Y. Hotel recommendation approach based on the online consumer reviews using interval neutrosophic linguistic numbers. J. Intell. Fuzzy Syst. 2018, 34, 381–394. [Google Scholar] [CrossRef]
- Rajaguru, R.; Hassanli, N. The role of trip purpose and hotel star rating on guests’ satisfaction and WOM. Int. J. Contemp. Hosp. Manag. 2018, 30, 2268–2286. [Google Scholar] [CrossRef]
- Padma, P.; Ahn, J. Guest satisfaction & dissatisfaction in luxury hotels: An application of big data. Int. J. Hosp. Manag. 2020, 84, 1023182. [Google Scholar] [CrossRef]
- Tao, S.; Kim, H.S. Cruising in Asia: What can we dig from online cruiser reviews to understand their experience and satisfaction. Asia Pac. J. Tour. Res. 2019, 24, 514–528. [Google Scholar] [CrossRef]
- Li, H.; Liu, Y.; Tan, C.W.; Hu, F. Comprehending customer satisfaction with hotels: Data analysis of consumer-generated reviews. Int. J. Contemp. Hosp. Manag. 2020, 32, 1713–1735. [Google Scholar] [CrossRef]
- Cheng, M.; Jin, X. What do Airbnb users care about? An analysis of online review comments. Int. J. Hosp. Manag. 2019, 76, 58–70. [Google Scholar] [CrossRef]
- Farhadloo, M.; Patterson, R.A.; Rolland, E. Modeling customer satisfaction from unstructured data using a Bayesian approach. Decis. Support Syst. 2016, 90, 1–11. [Google Scholar] [CrossRef]
- Pournarakis, D.E.; Sotiropoulos, D.N.; Giaglis, G.M. A computational model for mining consumer perceptions in social media. Decis. Support Syst. 2017, 93, 98–110. [Google Scholar] [CrossRef]
- Qi, J.; Zhang, Z.; Jeon, S.; Zhou, Y. Mining customer requirements from online reviews: A product improvement perspective. Inf. Manag. 2016, 53, 951–963. [Google Scholar] [CrossRef]
- Bi, J.W.; Liu, Y.; Fan, Z.P.; Cambria, E. Modelling customer satisfaction from online reviews using ensemble neural network and effect-based Kano model. Int. J. Prod. Res. 2019, 57, 7068–7088. [Google Scholar] [CrossRef]
- Culotta, A.; Cutler, J. Mining brand perceptions from twitter social networks. Mark. Sci. 2016, 35, 343–362. [Google Scholar] [CrossRef]
- Arashpour, M.; Wakefield, R.; Abbasi, B.; Arashpour, M.; Hosseini, R. Optimal process integration architectures in off-site construction: Theorizing the use of multi-skilled resources. Archit. Eng. Des. Manag. 2018, 14, 46–59. [Google Scholar] [CrossRef]
- Chen, K.; Kou, G.; Shang, J.; Chen, Y. Visualizing market structure through online product reviews: Integrate topic modeling, TOPSIS, and multi-dimensional scaling approaches. Electron. Commer. Res. Appl. 2015, 14, 58–74. [Google Scholar] [CrossRef]
- Cui, R.; Gallino, S.; Moreno, A.; Zhang, D.J. The Operational Value of Social Media Information. Prod. Oper. Manag. 2018, 27, 1749–1769. [Google Scholar] [CrossRef]
- Jiang, C.; Liu, Y.; Ding, Y.; Liang, K.; Duan, R. Capturing helpful reviews from social media for product quality improvement: A multi-class classification approach. Int. J. Prod. Res. 2017, 55, 3528–3541. [Google Scholar] [CrossRef]
- Brown, A.; Reade, J.J. The wisdom of amateur crowds: Evidence from an online community of sports tipsters. Eur. J. Oper. Res. 2019, 272, 1073–1081. [Google Scholar] [CrossRef]
- Kim, Y.J.; Ban, H.-J.; Kim, D.-H.; Ban, H.J. Understanding Customer Experience of Airline Lounge Using Text Mining of Online Review. Culin. Sci. Hosp. Res. 2020, 26, 36–44. [Google Scholar] [CrossRef]
- Chamikara, M.A.P.; Bertok, P.; Liu, D.; Camtepe, S.; Khalil, I. Efficient privacy preservation of big data for accurate data mining. Inf. Sci. 2020, 527, 420–443. [Google Scholar] [CrossRef] [Green Version]
- Hong, J.W.; Park, S.B. The Identification of Marketing Performance Using Text Mining of Airline Review Data. Mob. Inf. Syst. 2019. [Google Scholar] [CrossRef]
- Križanić, S. Educational data mining using cluster analysis and decision tree technique: A case study. Int. J. Eng. Bus. Manag. 2020, 12, 1–9. [Google Scholar] [CrossRef]
- Cho, G.; Park, H.-M.; Jung, W.-M.; Cha, W.-S.; Lee, D.; Chae, Y. Identification of candidate medicinal herbs for skincare via data mining of the classic Donguibogam text on Korean medicine. Integr. Med. Res. 2020, 9, 100436. [Google Scholar] [CrossRef]
- Lim, J.; Lee, H.C. Comparisons of service quality perceptions between full service carriers and low cost carriers in airline travel. Curr. Issues Tour. 2020, 23, 1261–1276. [Google Scholar] [CrossRef]
- Tang, X.; Dai, Y.; Xiang, Y. Feature selection based on feature interactions with application to text categorization. Expert Syst. Appl. 2019, 120, 207–216. [Google Scholar] [CrossRef]
- Wang, S.; Chen, J.; Guo, W.; Liu, G. Structured learning for unsupervised feature selection with high-order matrix factorization. Expert Syst. Appl. 2020, 140, 112878. [Google Scholar] [CrossRef]
- Bommert, A.; Sun, X.; Bischl, B.; Rahnenführer, J.; Lang, M. Benchmark for filter methods for feature selection in high-dimensional classification data. Comput. Stat. Data Anal. 2020, 143, 106839. [Google Scholar] [CrossRef]
- Zheng, W.; Zhu, X.; Wen, G.; Zhu, Y.; Yu, H.; Gan, J. Unsupervised feature selection by self-paced learning regularization. Pattern Recognit. Lett. 2020, 132, 4–11. [Google Scholar] [CrossRef]
- Zhang, R.; Nie, F.; Li, X.; Wei, X. Feature selection with multi-view data: A survey. Inf. Fusion 2019, 50, 158–167. [Google Scholar] [CrossRef]
- Tibshirani, R. Regression Shrinkage and Selection Via the LASSO. J. R. Stat. Soc. Ser. B Methodol. 1996, 58, 267–288. [Google Scholar] [CrossRef]
- Choudhury, S.; Thatoi, D.N.; Hota, J.; Sau, S.; Rao, M.D. Predicting crack in a beam-like structure through an over fitting verified regression model. Multidiscip. Modeling Mater. Struct. 2019, 15, 1190–1211. [Google Scholar] [CrossRef]
- Quinlan, J.-R. C4.5: Programs for Machine Learning; Morgan-Kaufmann: San Francisco, CA, USA, 1993. [Google Scholar]
- Yang, F. An Extended Idea about Decision Trees. In Proceedings of the 2019 International Conference on Computational Science and Computational Intelligence (CSCI), Las Vegas, NV, USA, 5–7 December 2019; pp. 349–354. [Google Scholar] [CrossRef]
- Sullivan, D. Document Warehousing and Text Mining: Techniques for Improving Business Operations, Marketing, and Sales; John Wiley and Sons, Inc.: Hoboken, NJ, USA, 2001. [Google Scholar]
- Thomaz, G.M.; Biz, A.A.; Bettoni, E.M.; Mendes-Filho, L.; Buhalis, D. Content mining framework in social media: A FIFA world cup 2014 case analysis. Inf. Manag. 2017, 54, 786–801. [Google Scholar] [CrossRef]
- Godnov, U.; Redek, T. Application of text mining in tourism: Case of Croatia. Ann. Tour. Res. 2016, 58, 162–166. [Google Scholar] [CrossRef]
- Hu, Y.H.; Chen, Y.L.; Chou, H.L. Opinion mining from online hotel reviews–A text summarization approach. Inf. Process. Manag. 2017, 53, 436–449. [Google Scholar] [CrossRef]
- Wong, C.U.I.; Qi, S. Tracking the evolution of a destination’s image by text-mining online reviews-the case of Macau. Tour. Manag. Perspect. 2017, 23, 19–29. [Google Scholar] [CrossRef]
- Schuckert, M.; Liu, X.; Law, R. A segmentation of online reviews by language groups: How English and non-English speakers rate hotels differently. Int. J. Hosp. Manag. 2015, 48, 143–149. [Google Scholar] [CrossRef]
- Department of Health and Social Care. CMO for England Announces 12 New Cases of Novel Coronavirus: 1 March 2020. Available online: https://www.gov.uk/government/news/cmo-for-england-announces-12-new-cases-of-novel-coronavirus-01-march-2020 (accessed on 15 September 2020).
- European Centre for Disease Prevention and Control. COVID-19 Situation Update for the EU/EEA and the UK, as of 1 September 2020. Available online: https://www.ecdc.europa.eu/en/cases-2019-ncov-eueea (accessed on 15 September 2020).
- Sezgen, E.; Mason, K.J.; Mayer, R. Journal of Air Transport Management Voice of airline passenger: A text mining approach to understand customer satisfaction. J. Air Transp. Manag. 2019, 77, 65–74. [Google Scholar] [CrossRef]
- Atalık, Ö.; Bakır, M.; Akan, Ş. The Role of In-Flight Service Quality on Value for Money in Business Class: A Logit Model on the Airline Industry. Adm. Sci. 2019, 9, 26. [Google Scholar] [CrossRef] [Green Version]
- Lim, H.; Kim, D.W. MFC: Intialization method for multi-label feature selection based on conditional mutual information. Neurocomputing 2020, 382, 40–51. [Google Scholar] [CrossRef]
Figure 1.
An example of a review of McDonald’s in Trustpilot.com.

Figure 2.
Ranked keywords with TF-IDF weights.

Figure 3.
The constructed decision tree.


Table 1.
Data collection.
| Fast-Food Restaurant Name | Number of Reviews | Data Sources |
|---|---|---|
| Domino’s | 292 | https://www.trustpilot.com/review/www.dominos.co.uk |
| KFC | 191 | https://www.trustpilot.com/review/kfc.co.uk |
| McDonald’s | 251 | https://www.trustpilot.com/review/www.mcdonalds.co.uk |
| Total | 734 |
Table 2.
Groups of top mentioned words.
| Groups | Top Mentioned Words |
|---|---|
| Meal | Pizza, food, burger, chicken, cold, eat, chip, taste, the_food, the_pizza |
| Service | Order, service, time, delivery, staff, wait, wrong, told, ask, give, call, rude, customer_service, disgust, minute, quality |
| Tangible | Store, branch, restaurant, manage |
| Promotion/Refund | Money, price, refund, deal |
| COVID-19 | Custom, miss, want, thank, phone, ….(COVID, mask, corona, coronavirus) |
| Sentiment | Great, good, bad, love, poor, disappoint |
Table 3.
Results of feature selection using LASSO.
| Experiment Key Words | Fold #1 | Fold #2 | Fold #3 | Fold #4 | Fold #5 | Frequency |
|---|---|---|---|---|---|---|
| great | 1.637926 | 1.637926 | 1.704888 | 1.761116 | 1.849832 | 5 |
| amazing | 1.10379 | 1.10379 | 1.172616 | 1.236456 | 1.346803 | 5 |
| the_best | 0.767311 | 0.767311 | 0.886877 | 0.998493 | 1.192214 | 5 |
| excellent | 0.93885 | 0.93885 | 1.013615 | 1.078015 | 1.17427 | 5 |
| thank | 0.961416 | 0.961416 | 0.988296 | 1.017437 | 1.059731 | 5 |
| just_want | 0.295544 | 0.295544 | 0.429106 | 0.551747 | 0.766185 | 5 |
| delicious | 0.694805 | 0.694805 | 0.713538 | 0.728697 | 0.753355 | 5 |
| Love | 0.621796 | 0.621796 | 0.653782 | 0.684573 | 0.740026 | 5 |
| thank_you | 0.535389 | 0.535389 | 0.578148 | 0.607844 | 0.657612 | 5 |
| friendly | 0.438428 | 0.438428 | 0.499913 | 0.555955 | 0.651621 | 5 |
| Like | 0.159634 | 0.159634 | 0.289013 | 0.397322 | 0.556908 | 5 |
| very_good | 0.106712 | 0.106712 | 0.229401 | 0.331597 | 0.486255 | 5 |
| the_food | 0.240562 | 0.240562 | 0.315816 | 0.375267 | 0.482474 | 5 |
| Kind | 0.041245 | 0.041245 | 0.160647 | 0.273461 | 0.457214 | 5 |
| tasty | 0.078806 | 0.078806 | 0.178808 | 0.272535 | 0.411016 | 5 |
| good | 0.013915 | 0.013915 | 0.050466 | 0.076977 | 0.123939 | 5 |
| quick | 0 | 0 | 0.062702 | 0.19235 | 0.423307 | 3 |
| enjoy | 0 | 0 | 0.068385 | 0.150675 | 0.28 | 3 |
| Nice | 0 | 0 | 0.007304 | 0.071905 | 0.164957 | 3 |
| very_polite | 0 | 0 | 0 | 0.040815 | 0.176512 | 2 |
| have_done | 0 | 0 | 0 | 0 | 0.205599 | 1 |
| policy | 0 | 0 | 0 | 0 | 0.179153 | 1 |
| as_well | 0 | 0 | 0 | 0 | 0.09573 | 1 |
| wait_for | 0 | 0 | 0 | 0 | 0.076201 | 1 |
| fried_chicken | 0 | 0 | 0 | 0 | 0.067827 | 1 |
| staff_and | 0 | 0 | 0 | 0 | 0.062449 | 1 |
| hot_and | 0 | 0 | 0 | 0 | 0.029425 | 1 |
| Told | 0 | 0 | 0 | 0 | –0.09236 | 1 |
Table 4.
Evaluation of selected feature subsets.
| Feature Set | Original Feature Set (1977 Words) | Feature Subset#1 (16 Keywords) | Feature Subset#2 (19 Keywords) | |
|---|---|---|---|---|
| Metrics | Mean (Standard Deviation) | |||
| OA (%) | 85.69 (2.43) | 87.48 (2.74) | 88.70 (2.21) | |
| F1 (%) | 49.88 (10.20) | 49.23 (13.27) | 48.68 (14.11) | |
| Time (s) | 3.70 (2.55) | 0.02 (0.04) | 0.02 (0.04) | |
Table 5.
The selected keywords by LASSO.
| Frequency | Code | Factors | Extracted Key Words |
|---|---|---|---|
| 5 | F#1 | food quality | delicious, tasty, the_food, just_want |
| service quality | friendly, kind, thank_you, thank | ||
| sentiment | great, amazing, the_best, excellent, love, very_good, good, like | ||
| 3 | F#2 | promptness | Quick, enjoy |
| sentiment | nice | ||
| 2 | F#3 | politeness | very_polite |
| 1 | F#4 | staff policy | have_done, policy, as_well, wait_for, fried_chicken, staff_and, hot_and, told. |
Publisher’s Note: MDPI stays neutral with regard to jurisdictional claims in published maps and institutional affiliations. |
© 2020 by the authors. Licensee MDPI, Basel, Switzerland. This article is an open access article distributed under the terms and conditions of the Creative Commons Attribution (CC BY) license (http://creativecommons.org/licenses/by/4.0/).
Share and Cite
MDPI and ACS Style
Chen, W.-K.; Riantama, D.; Chen, L.-S. Using a Text Mining Approach to Hear Voices of Customers from Social Media toward the Fast-Food Restaurant Industry. Sustainability 2021, 13, 268. https://0-doi-org.brum.beds.ac.uk/10.3390/su13010268
AMA Style
Chen W-K, Riantama D, Chen L-S. Using a Text Mining Approach to Hear Voices of Customers from Social Media toward the Fast-Food Restaurant Industry. Sustainability. 2021; 13(1):268. https://0-doi-org.brum.beds.ac.uk/10.3390/su13010268
Chicago/Turabian StyleChen, Wen-Kuo, Dalianus Riantama, and Long-Sheng Chen. 2021. "Using a Text Mining Approach to Hear Voices of Customers from Social Media toward the Fast-Food Restaurant Industry" Sustainability 13, no. 1: 268. https://0-doi-org.brum.beds.ac.uk/10.3390/su13010268
Note that from the first issue of 2016, this journal uses article numbers instead of page numbers. See further details here.