Estimation of the Scale of Food Waste in Hotel Food Services—A Case Study
by
 , and
, and
Marzena Tomaszewska
1 ,
,
Beata Bilska
1,*,
Agnieszka Tul-Krzyszczuk
2 and
Danuta Kołożyn-Krajewska
1 1
Department of Food Gastronomy and Food Hygiene, Institute of Human Nutrition Sciences, Warsaw University of Life Sciences (SGGW-WULS), 02-776 Warsaw, Poland
2
Department of Food Market and Consumer Research, Institute of Human Nutrition Sciences, Warsaw University of Life Sciences (SGGW-WULS), 02-776 Warsaw, Poland
*
Author to whom correspondence should be addressed.
Sustainability 2021, 13(1), 421; https://0-doi-org.brum.beds.ac.uk/10.3390/su13010421
Submission received: 14 December 2020
/
Revised: 30 December 2020
/
Accepted: 31 December 2020
/
Published: 5 January 2021
(This article belongs to the Special Issue Sustainable Food Waste Management in Foodservice Establishments)
Abstract
:The problem of food waste in food services, which is global and essentially affects the entire world, is a major challenge for the hospitality industry. At the same time, it should be noted that this problem has not been sufficiently studied, which makes it difficult to reduce it effectively. The study was carried out in four hotels in late 2019 and early 2020. In order to determine the scale of food waste, the diary method was used, which consists of systematically recording, for seven days, in forms prepared for workstations, the weight of all food products and unused food, including the stage of the technological process. In the hotels under study, most food was wasted in the serving department, i.e., in the buffet in the dining room or in the form of plate waste (on average 72.55% of wasted food). After taking into account the number of hotel guests served, it was found that in the investigated facilities, an average of 0.046 kg was wasted from each serving offered to guests in the form of plate waste, which constituted 5.8% of its weight. In sum, it should be stated that in order to reduce food waste, it is necessary to educate both food services staff and consumers. Employees should be trained in the proper handling of food. Consumer education, on the other hand, should be directed toward raising awareness of the negative impact of food waste, such as that on the natural environment. In addition, it should indicate what action everyone can take to limit this negative phenomenon, whether at home, in the workplace, or in a food service establishment.
1. Introduction
A large number of publications have shown that the problem of food waste in the food service industry is global and essentially affects the whole world [1,2,3,4]. However, as Filimonau, Nghiem, and Wang emphasized [5], although the catering sector generates significant amounts of wasted food, it remains insufficiently studied, especially in the context of individual sub-sectors.
As shown by a FUSIONS (Food Use for Social Innovation by Optimising Waste Prevention Strategies) survey [6], the EU food service sector produces about 12% of the total amount of wasted food, which is third after households (53%) and the food industry (19%). It has been estimated that in 2010, the food service sector in the whole EU produced more than 12 million tonnes of food waste [7]. In the UK alone, the hospitality industry produced about 3 million tonnes of food waste (WRAP 2013). In Scandinavia, hospitality operations generated more than 0.45 million tonnes of wasted food in one year [8].
Outside Europe, the contribution of the food service sector to food waste is equally important. In the United States, each year, the food service sector—including full-service and limited-service restaurants—generates nearly 16 million tonnes, which is about 25.4% in the food supply chain [9]. In contrast, data on food waste in China indicate that the food service sector is responsible for more food waste than households [10]. Wen et al. [11] indicated that up to 50% of the food wasted in China may come from food service establishments. At the same time, as Pirani and Arafat [12] emphasized, given the increasing number of food service establishments and number of consumers who use them, it is to be expected that the volume of waste, including food waste, produced by food services will also increase. A WRAP report (Worldwide Responsible Accredited Production) [13] indicates that the level of food waste in the UK food services sector just between 2015 and 2018 grew by an estimated 7.5%, while other links in the food chain have reduced the level of food waste (e.g., households by 5.7%) over the same period. However, the document clearly states that this is a modeled result, which is based on changes in the number and types of hospitality and food service sites, and the assumption that food waste per site has remained constant since 2011. The food service market is one of the dynamically developing sectors of the economy in Poland, too. In 2019, the value of this market in Poland amounted to almost 32 billion PLN, with an average annual growth of 6% [14,15]. The good condition of the Polish food services market was influenced by positive consumer confidence and economic prosperity as well as the development of tourism, demographic changes (an increase in the number of one- and two-person households), the growth in the distance between workplaces and places of residence, generational changes, including the appearance of generation Z, for whom the use of food services is an important element of their lifestyle [14,16,17].
Despite the large scale of food waste in the food services sector, according to Filimonau and De Coteau [18], this problem still draws little and insufficient attention from researchers, which translates into a small number of publications in this area. Among other things, the collection of primary data proves problematic. Many food service operators are reluctant to cooperate with scientific bodies for fear of inappropriate use of this type of information, which is felt to be sensitive [5]. Another reason for the reluctance to cooperate are staffing problems in food services establishments, which results in any additional activity putting an extra burden for staff. According to Filimonau et al. [19], although food waste is a major challenge for the hospitality industry worldwide, it is surprising that the problem has still not been investigated adequately, which hinders effective management in this area.
In Poland as well, to date, only a few studies been conducted on this issue. They addressed such aspects as the determination of the causes of food waste [20], potential application of sous-vide in the reduction of food waste at home and in catering establishments [21], and consumer involvement in mitigating restaurant food waste [22]. Meanwhile, through scientific articles, it is possible to demonstrate to practitioners the positive impact of reducing food waste, the environment, and the image of the company. Therefore, research in this sector is necessary, owing to which it will be possible to learn about the scale and causes of food waste, to identify barriers to effective reduction of the phenomenon and take action to eliminate these.
In this work, it was decided to focus on food waste in hotel food services, which is characterized by a wide variety of services provided, e.g., serving breakfast to hotel guests, organizing group celebrations (banquets, conferences), or serving dishes à la carte in the hotel restaurant. This diversity results in different systems for serving ready-made dishes, but also, a large amount of food raw material is used, which is subject to various technological operations. These aspects all contribute to the issue of food waste in hotel food services remaining inadequately studied.
When undertaking quantitative studies on food waste, we should start by defining the concept. The terms “food losses”, “food wastage”, and “food waste” can be found in the literature. These terms can be understood and defined differently, depending on the needs, objectives, and area of application of a given definition [23]. Discrepancies are also apparent in the classification of the edible and non-edible parts of food, which translates into the possibility of identifying them as food losses and waste, and thus including or not including them in the measurement and monitoring process [24]. Pirani and Arafat [12] have defined food waste in the hospitality industry as food that is undesirable and disposed of, including both leftovers on guest plates and inedible parts produced in the production of meals. According to Wang et al. [25], when estimating food waste in the hospitality industry, inedible parts of food such as bones or peels should be excluded, while the focus should be on what can be avoided [26]. For the purpose of this study, the following definition has been adopted: “Food waste is any food, and inedible parts of food, removed from the food supply chain to be recovered or disposed” [27].
The aim of the work was to determine the level of food waste in hotel food services, taking into account the type of services they provide, i.e., a breakfast buffet for guests, services for organized groups such as conferences, banquets, and the hotel restaurant. In addition, the mass of wasted food per customer served was indicated, as well as the method of handling unused food in the hotels studied.
2. Materials and Methods
2.1. Data Collection
The study was carried out in four hotels in late 2019 and early 2020. In order to determine the level of food waste in hotel food services, the diary method was used. This technique is commonly used to assess diet and is regarded as an accurate, but it is also a very time-consuming method. In addition to quantitative data, it also provides opportunity to obtain qualitative data which, in the context of the task undertaken, were of particular importance because it was possible to obtain information on, among other things, how unused food is managed. This measurement method, which is carried out by means of a diary and defined as “regular recording of information on food waste by an individual or group of individuals”, is also recommended by the European Commission [28].
The diary method adopted in practice consisted in systematically recording the mass of all food products and unused food in forms prepared for workstations, taking into account the stage of the technological process, over seven days. The study included four Warsaw hotels that belong to one chain. Thus, the hotels had the same standards with regard to technological equipment and were managed by the same person. The research was preceded by multiple consultations by the authors with the management and operational staff working in particular facilities. During these meetings, the prepared workstation form was discussed, and the methods for weighing and indicating the mass of unused food products, taking into account the stage of the technological process, was determined. In each hotel, the workstation forms were completed on an ongoing basis for seven consecutive days by chefs. For weighing food products, the hotel food service facilities’ own scales were used. The manager of the food service division in a hotel chain, together with the authors of the study, watched over the reliability of measurements.
The facilities offered their services to both business clients and tourists visiting the capital city of Poland. The characteristics of the hotels in which the study was conducted are presented in Table 1.
The hotels studied have been in operation for over nine years. All facilities had their own kitchen where dishes were prepared for their food services. As part of their food services, only one hotel (H1) offered its guests only breakfast. The other hotels, apart from breakfast, also provided services for events such as conferences, banquets, and the use of the hotel restaurant. In all facilities, breakfasts were served in a buffet system. In the restaurants of hotels H2, H3, and H4, dishes were served by waitstaff, while organized groups were served in a mixed system (self-service and waitstaff service). The production of breakfasts and dishes in the food service facilities of all four hotels was partly based on semi-finished products, e.g., meat in the form edible cuts. Only part of the vegetables and fruits were delivered in the form of raw materials requiring a full technological process, including unit operations such as peeling or washing. The supply of food products in each hotel was provided daily in the just-in-time system, which allowed for a significant reduction of space required for food storage. Food products were delivered by regular, specialized suppliers.
2.2. Questionnaire
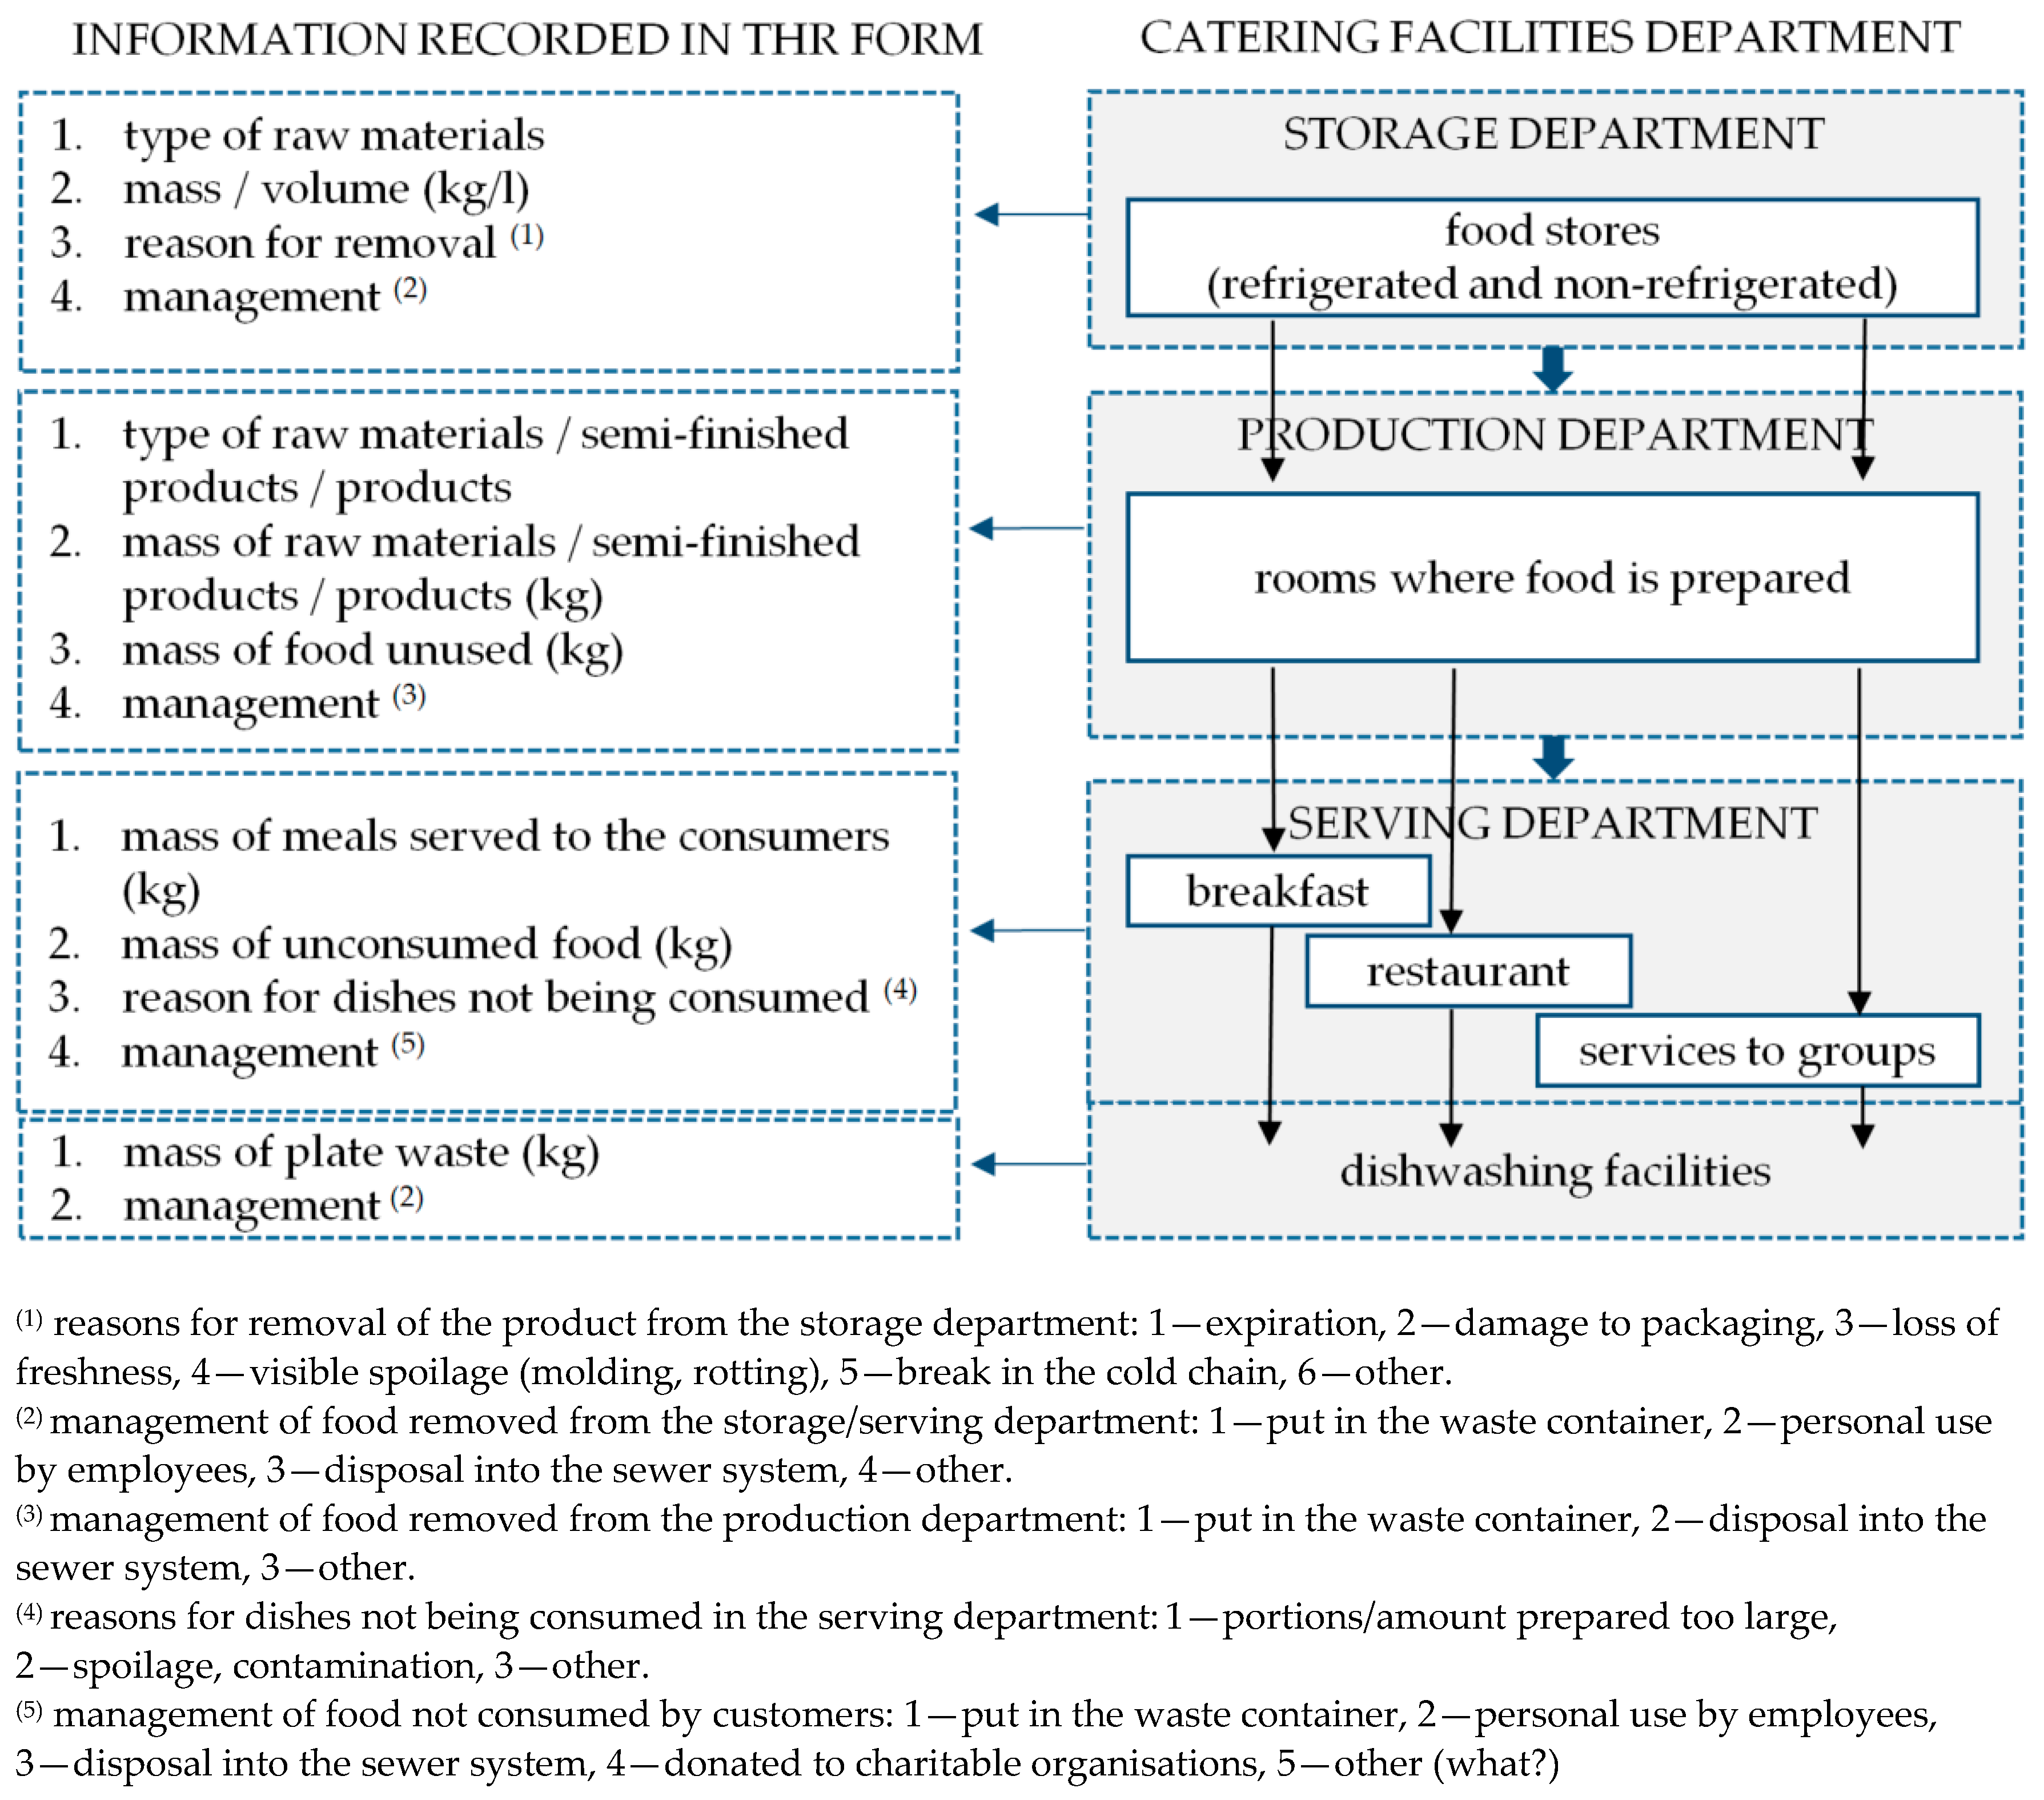
The workstation forms were constructed in tabular form. The forms were developed for the needs of the conducted research. The workstation form was discussed during consultations by the authors with the management and operational staff working in particular facilities. Each hotel received a form consisting of participant particulars and seven sets of tables (one set for each day). Each set consisted of tables concerning the (1) storage department, (2) production department, (3) breakfast buffet, (4) restaurant, (5) service for organized groups, and (6) dishwashing facilities. The persons responsible for the conduct of the study at the facility noted basic information in the tables, such as the (a) mass of raw materials used in production, (b) mass of dishes served to consumers, (c) mass of food waste resulting from the preparation of meals, taking into account the stage of the technological process, and (d) mass of food not consumed by customers. In order to facilitate the provision of information, a system of numerical values was applied which were allocated to the response options below the table. The type of information recorded in the form and the response variants adopted are presented in Figure 1. An example of one of the tables included on the form is presented in Appendix A.
2.3. Data Analysis
All quantitative data were entered on the forms to two decimal places. On the basis of the collected data, the following were calculated for each facility: (1) the total number of guests served during the week and the average daily value; (2) the weight of portions served daily and the average daily value; and (3) the weight of unused food during the week and the average daily value. All calculations were made taking into account the stage of the technological process and/or the type of services provided in the hotels, i.e., serving breakfast, services to groups, or individual customer service in the hotel restaurant. On the basis of the obtained values, the following were determined: (1) the share of unused food, taking into account the stage of the technological process (storage department, production department, serving department) (%); (2) the share of unused food as intended or thrown away in the total weight of raw material/semi-finished products used in food preparation (%), (3) weight of food unused/thrown away per portion, taking into account the stage of the technological process and the type of services provided in the hotels, i.e., serving breakfast, services to groups, or individual customer service in the hotel restaurant (kg). All analyses were performed using an Excel spreadsheet in Microsoft Office.
3. Results
3.1. Characteristics of Food Services Provided in the Hotels Studied
The hotels in which the study was conducted provided such services as breakfast (all facilities), services for organized groups (simply called groups), and service of customers in restaurants (H2, H3, H4). In the period under study, the largest number of customers was served in the H2 facility: a total of 1763 people. The least number of people (892 customers) used food services in hotel H1, which offered only breakfast (Table 2). In the hotels offering a full range of food services, i.e., H2, H3, and H4, breakfast had the largest share in the mass of meals served weekly, respectively: 70.84%, 75.41%, and 66.28%. Groups in H2, H3, and H4 hotels were served 19.30%, 1.59%, and 18.66%, respectively, while guests in restaurants were served 9.90%, 22.99%, and 15.07% respectively of the weekly total mass of dishes.
It was found that in the studied hotels, an average of 0.77 kg of finished products was served in one breakfast portion (Table 3). In the breakfast buffets, the smallest portion per consumer was provided in facility H1 (0.68 kg on average), and the largest was provided in hotel H2 (0.84 kg on average). Slightly smaller portions, as compared to breakfasts, were served to customers who were part of various types of organized groups. On average, the mass of ready-made meals served per one guest in the three hotels providing this type of services was 0.73 kg. However, the calculated standard deviation (SD) indicates a large dispersion of results around the arithmetic mean, especially in the case of H2 (SD = 0.84). On the basis of the data obtained, it was found that the most equal portions, in terms of weight per consumer, were offered to guests in hotel restaurants (SD from 0.02 to 0.12). Converted into per consumer, the most (0.42 kg on average) was served in hotel H2. In the facilities H3 and H4, the figure was 0.25 kg each.
3.2. The Mass of Unused Food in Hotels, Including the Stage of the Technological Process
When determining the mass of wasted food in the studied hotels, (1) the processes taking place at the back of the food service facilities (storage, preparation of dishes) were taken into account, (2) as well as those in the serving department (dining room, dishwashing facilities).
It was found that over seven days, the most food was not used for its intended purpose in facility H2—159.39 kg, and the figures were slightly less in facility H3—149.30 kg, in H4—96.15 kg, and H1 (offering breakfast only)—64.64 kg (Table 4). According to the declarations of the persons completing the questionnaires, no waste of food products at the storage stage was recorded in the time under investigation. According to the declarations, at the stage of food preparation, the average mass of unused food during the week was 25.24 kg. From the information entered in the questionnaire, it appears that this consisted exclusively of inedible parts of food products, such as fruit and vegetable peelings and eggshells. The highest mass of wasted food was recorded during the week studied in the case of plate waste from the breakfast buffet (average 39.41 kg/week). By comparison, over the same time, the plate waste after serving restaurant guests averaged 11.69 kg, and after serving groups, it was 16.29 kg.
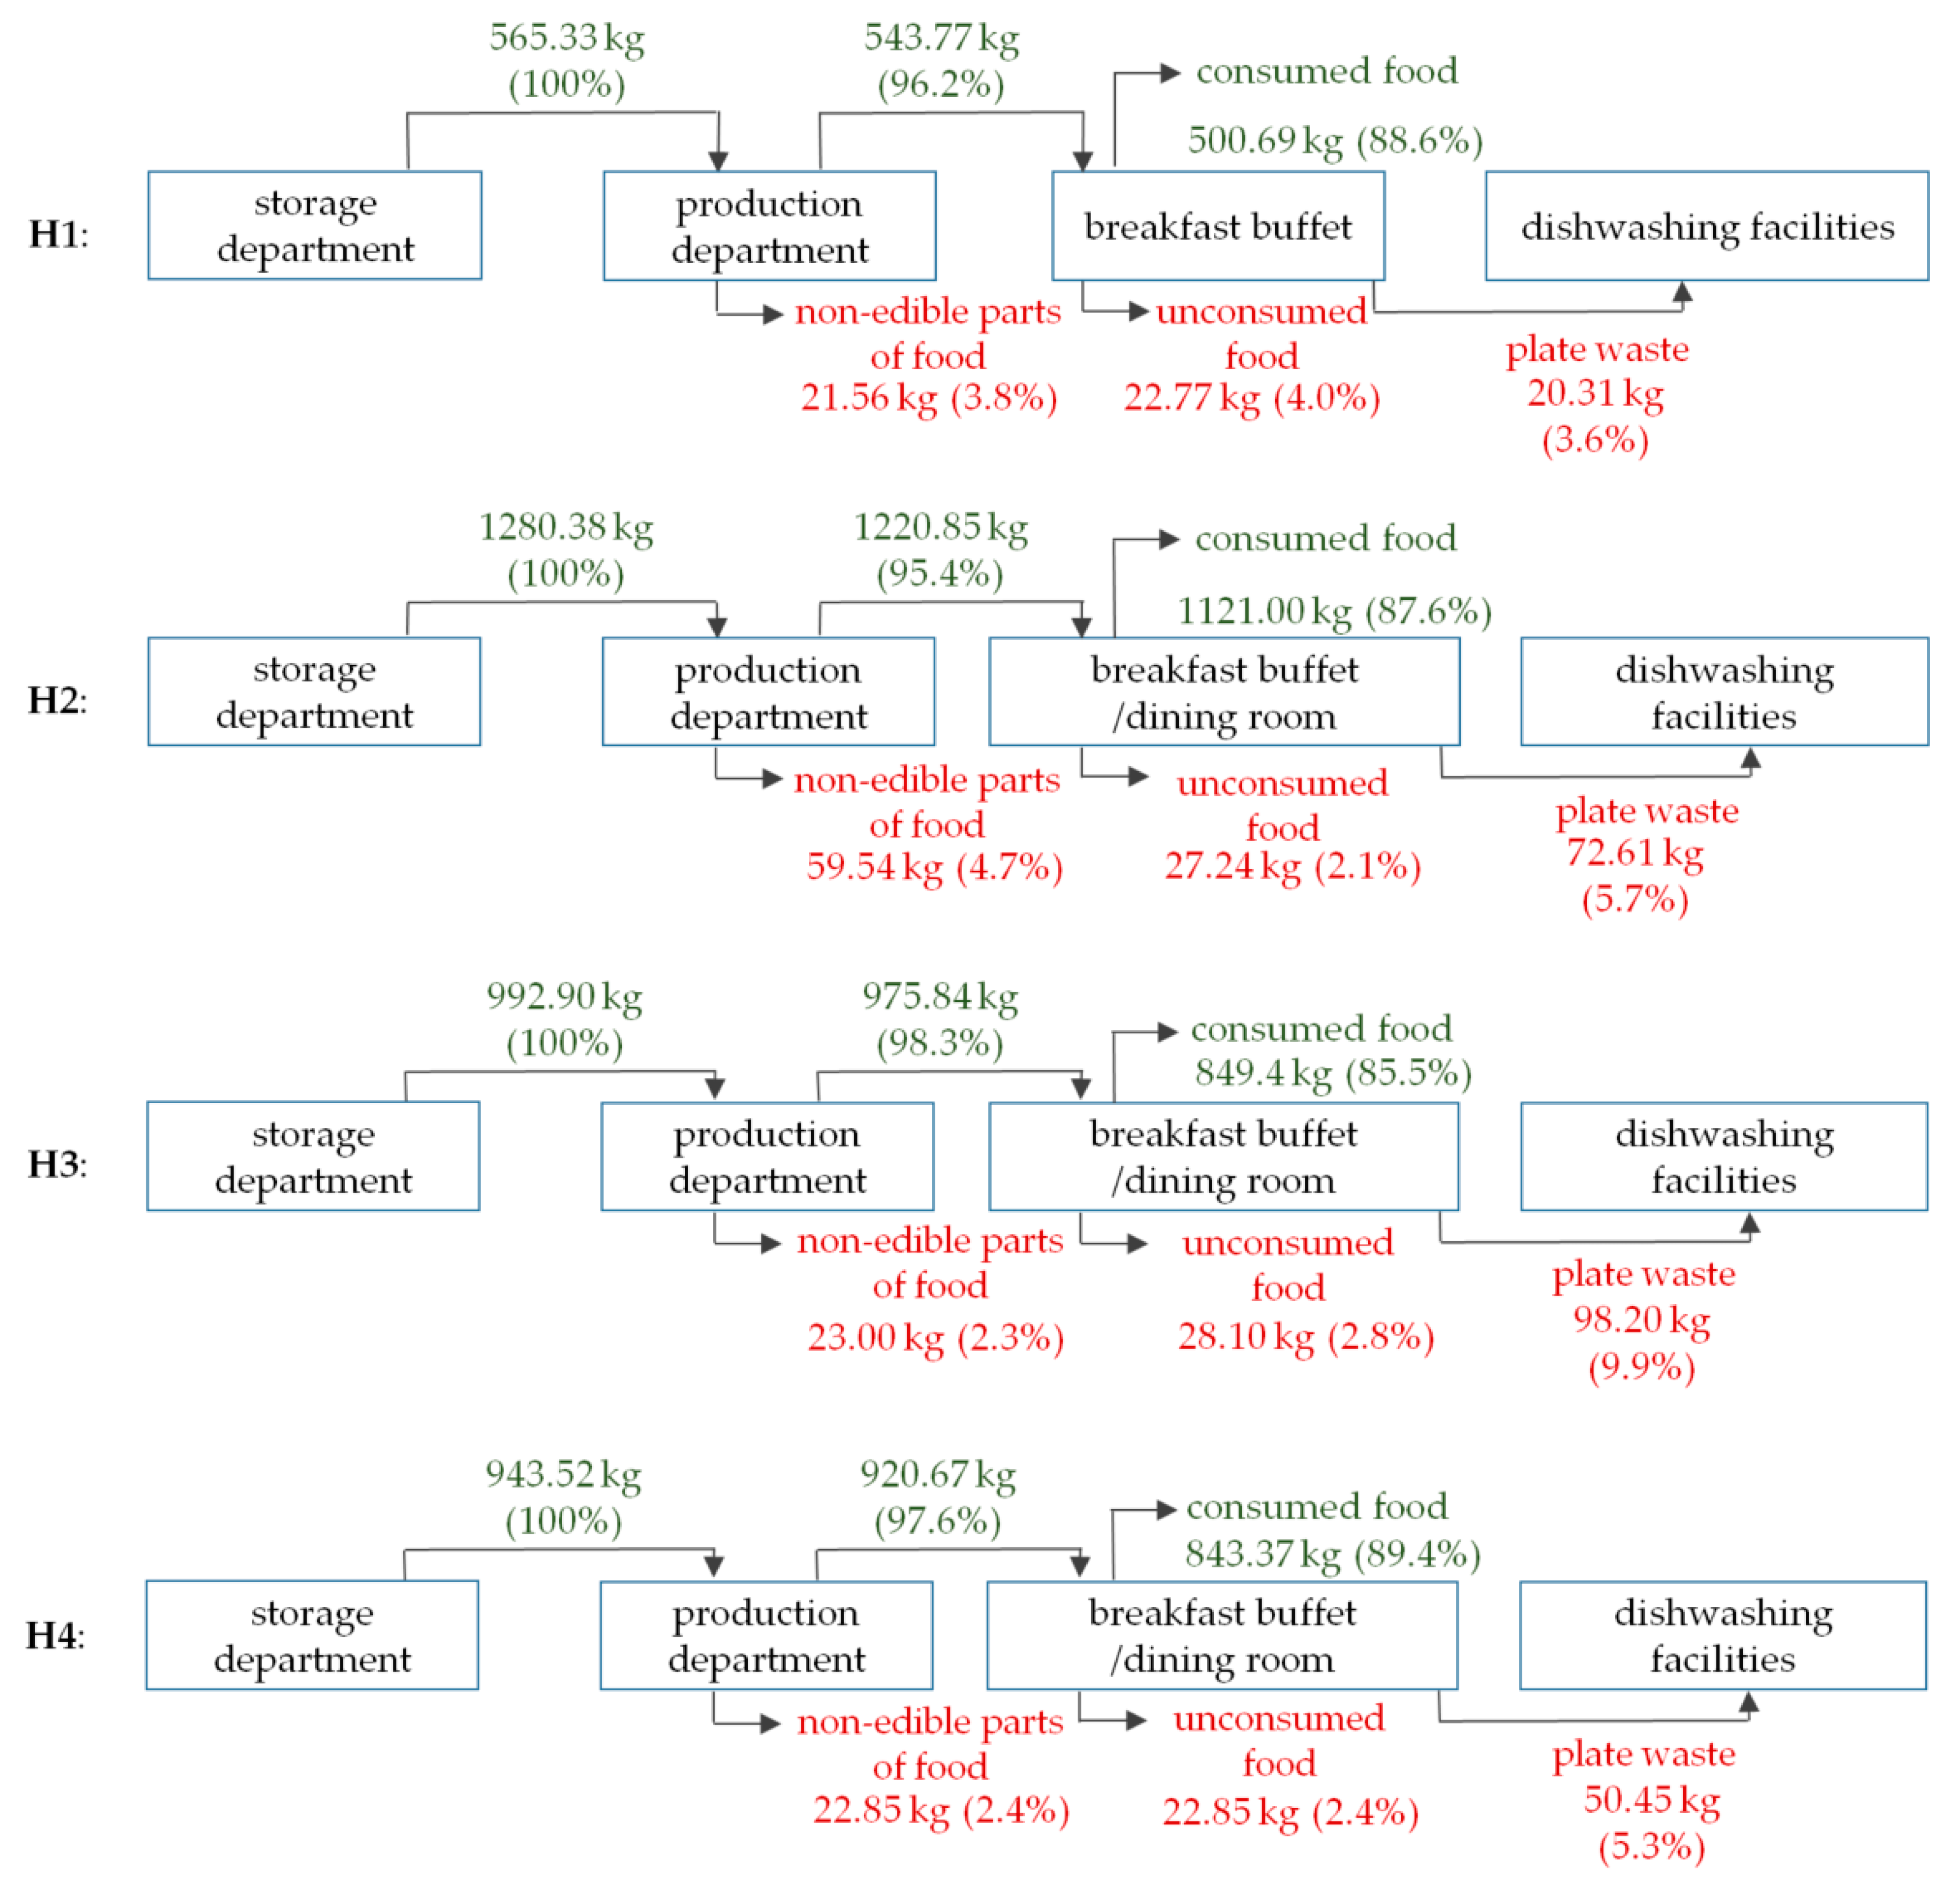
The share of food not used during the week in the total weight of raw material/semi-finished or finished products used for food preparation was for the individual hotels, i.e., H1, H2, H3, and H4 respectively: 11.4%, 12.4%, 14.5%, and 10.6% (Figure 2). The inedible parts of food in the production department accounted for from 2.3% (H3) to 4.7% (H2) of the mass of raw materials used. The share of finished products in the breakfast buffet, which were not used as originally intended (breakfast for hotel guests), ranged from 2.1% (H2) to 4.0% (H4) by mass of raw materials used. The largest percentage of wasted food constituted plate waste. Its share ranged from 3.6% (H1) to 9.9% (H3) of the mass of raw materials used.
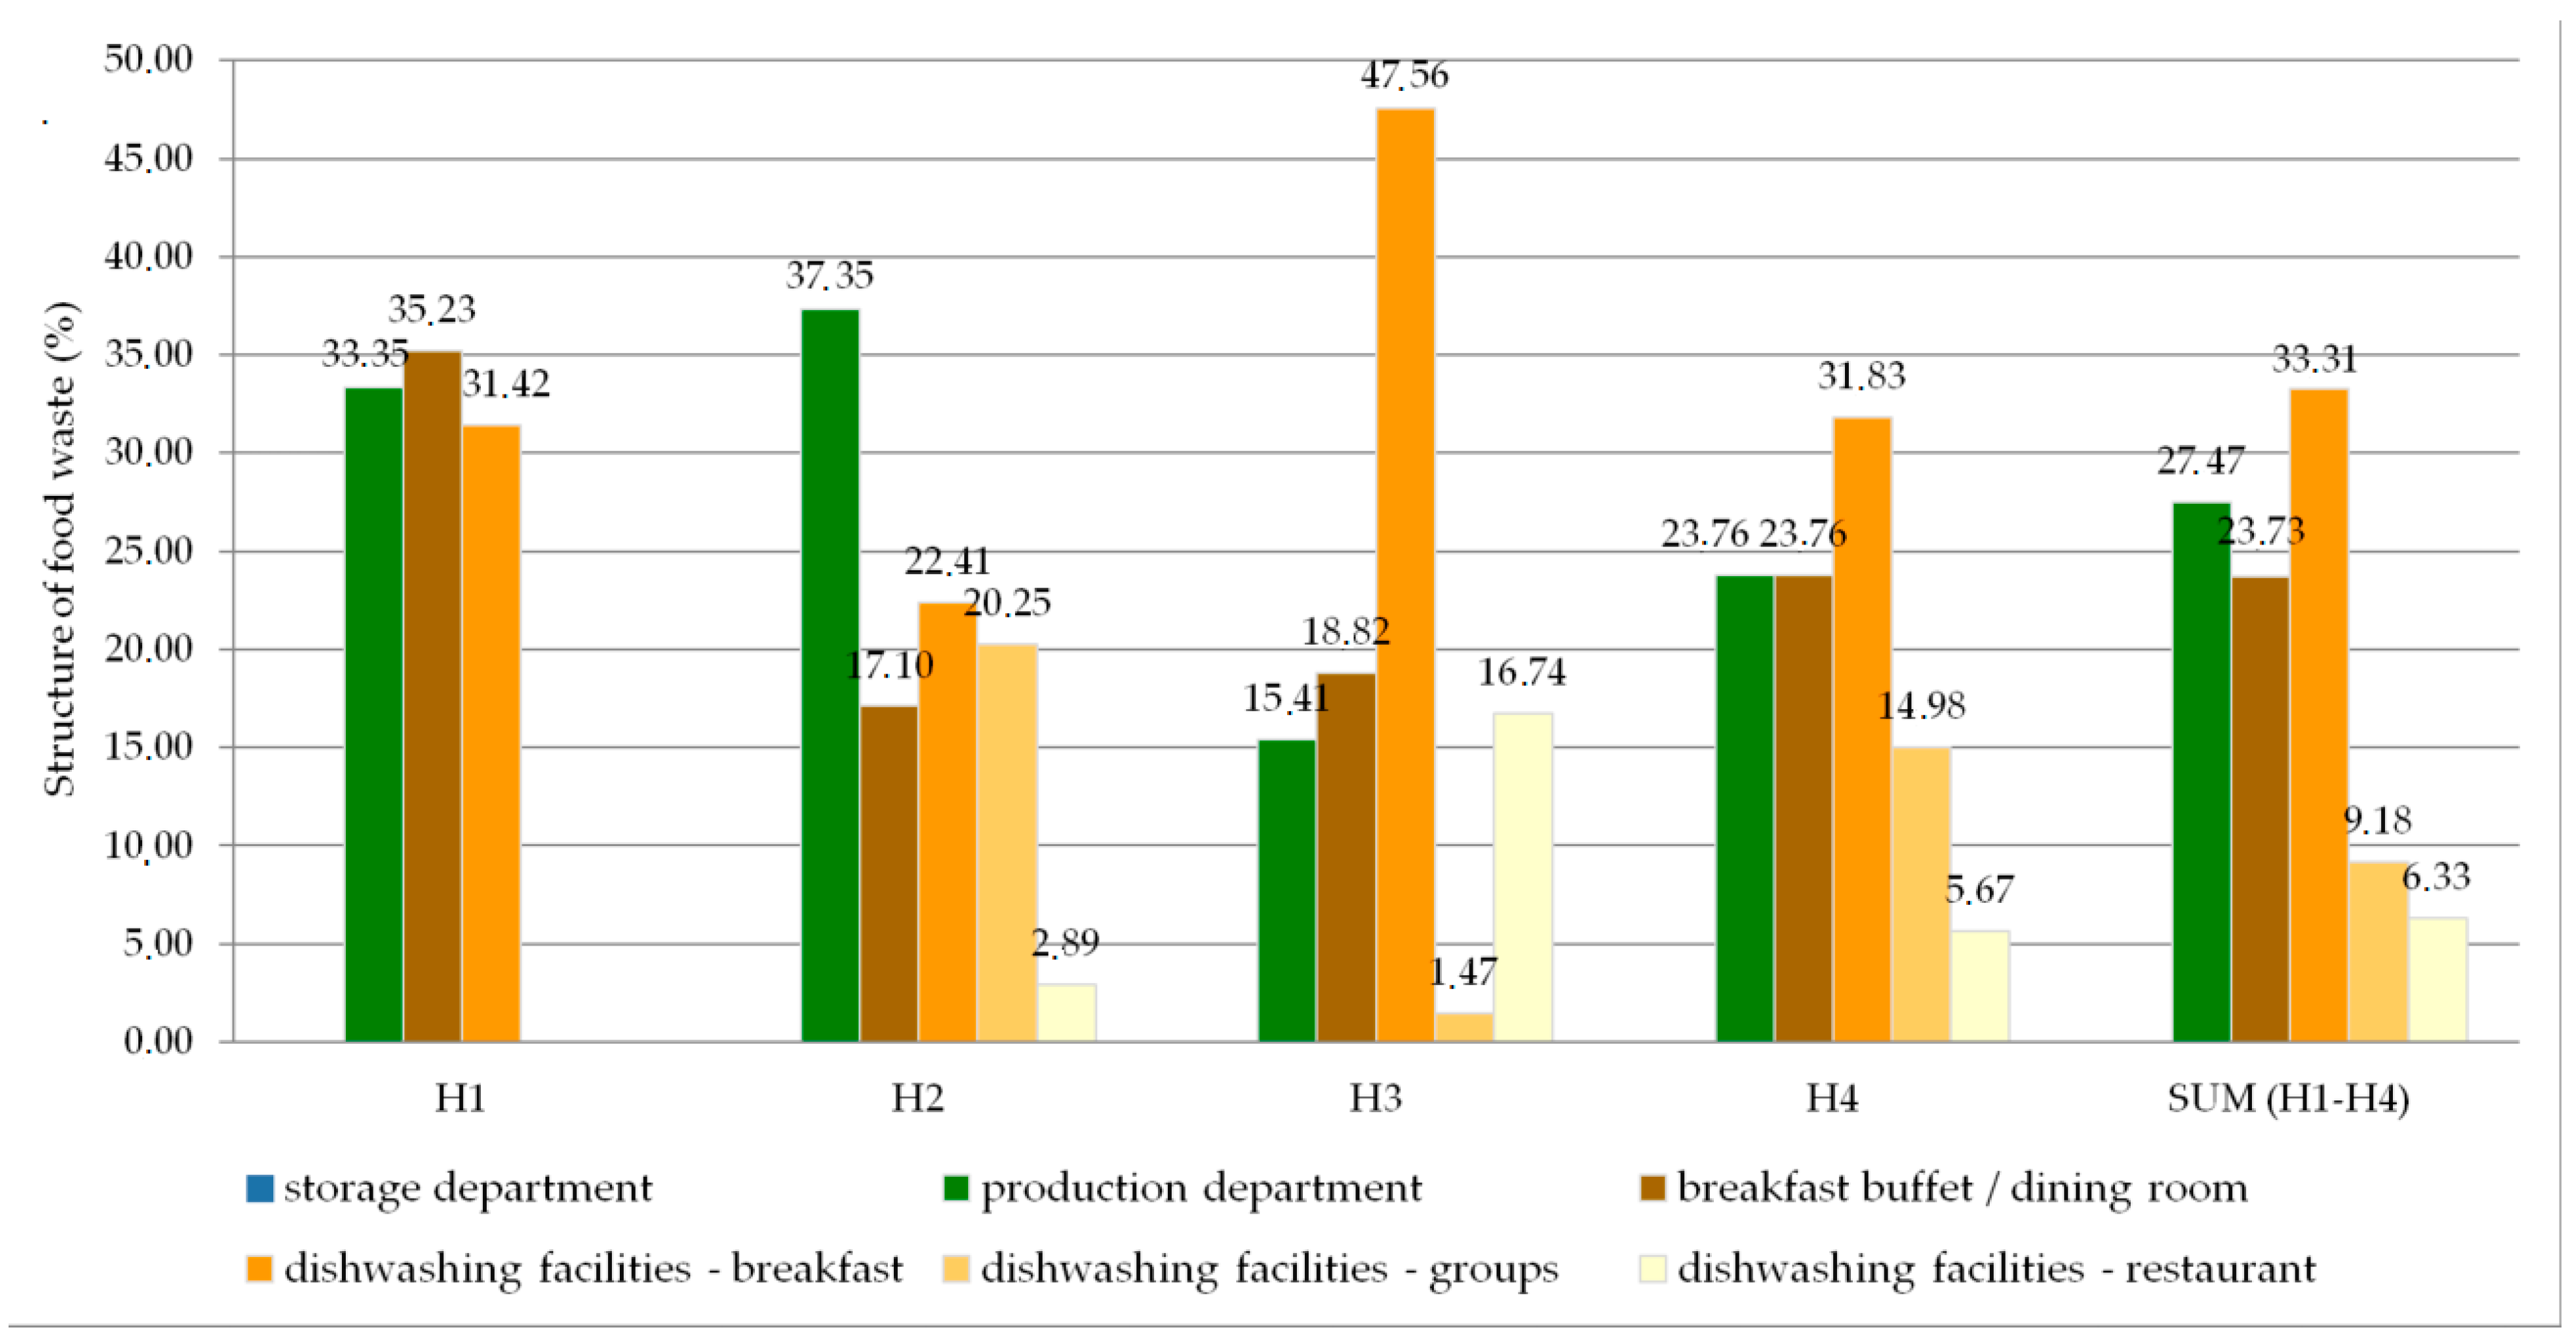
According to the data presented in Figure 3, in facility H3, as much as 84.59% of the unused food during the week came from the serving department. In hotels H1, H2, and H4, this share was 66.64%, 62.64%, and 76.23% respectively.
Analyzing the data concerning hotels offering services apart from breakfast, i.e., services for groups and individual restaurant service (H2, H3, and H4), it can be seen that plate waste is predominantly left by hotel guests after breakfast. A clear disproportion is visible especially in the case of facility H3, where an average of about 10 kg of such waste was disposed of daily.
3.3. The Size of Portions Offered to Customers and the Mass of Unused Food
To calculate the share of unused food in the mass of portions offered to customers, the data presented in Table 2 (mass of raw materials used and dishes served/number of people served) and Table 4 (mass of food not used in accordance with its intended use, taking into account the food services provided and the stage of the technological process) were used. The results are presented in Table 5.
The obtained data indicate that, per customer, the least amount of food was thrown away in the back of the food service facilities, with an average of 0.023 kg during the preparation of ready meals.
It was determined that hotel guests were unable to consume all the dishes offered on the breakfast buffet. Each day, an average of 3.6 kg of ready, unconsumed products were left on the breakfast buffet (from 3.25 to 4.01 kg). After accounting for the number of consumers served at the breakfast buffet, it was established that in the investigated facilities, on average, 0.034 kg from each offered portion was left on the buffet, which constituted 4.4% of its mass. Of each breakfast portion served for one customer, the greatest amount, i.e., 0.047 kg, was left in facility H1, which accounted for 6.9% of its mass (Table 5). In the remaining hotels (H2, H3, and H4), the share of the portions in the breakfast buffet left by the guests was 3.9%, 3.3%, and 4.0% for each hotel, respectively.
Hotel guests also left unconsumed food on plates (plate waste)—on average 5.6 kg (from 2.9 to 10.1 kg) daily. After accounting for the number of hotel guests served, it was found that in the investigated facilities, an average of 0.046 kg was wasted from each portion offered to guests in the form of plate waste, which constituted 5.8% of its mass. Of each breakfast portion offered to guests, most of the unused food in the form of plate waste was left in the facility H3 (0.067 kg), which accounted for 8.3% of its mass (Table 5). In other hotels (H1, H2, H4), the share of food left on plates was at the same level: 5.4%, 5.0%, and 4.4%.
Taking into account both the food left by customers on the breakfast buffet and the plate waste after breakfast, it was found that of each breakfast portion served per hotel guest (H1, H2, H3, H4), on average, 0.080 kg of products were not consumed, which constituted 10.4% of the breakfast portions prepared. However, plate waste had a greater share of the mass of the unconsumed breakfast portions prepared.
In hotels H2, H3, and H4, we also weighed the plate waste left by groups after various closed events and by guests in the hotel restaurant (Table 5). It was found that on customers’ plates handed over to the dishwashers, the greatest amount was left by guests participating in closed events (groups). Each participant in such an event, taking into account three hotels providing this type of service, left an average of 0.209 kg of plate waste, which constituted 24.6% of the portion mass. It was determined that the greatest amount (54.2% of the weight of the planned portion) was left on plates handed over to the dishwasher by guests served in groups in facility H2 (nearly 0.5 kg). For comparison, the ratio for guests in other facilities, i.e., H3 and H4, was 11.4% and 8.3% (0.090 and 0.038 kg, respectively).
Despite the fact that in hotels H2, H3, and H4, the average weight of dishes served per guest in hotel restaurants was lower in relation to the weight of dishes served at breakfasts or during organized events (Table 3), on average, 16.3% of its weight went in the form of plate waste to the dishwashers. Most of the plates were left on the plate by guests served in the restaurant of hotel H3 (on average 30.0% of each portion). For comparison, guests in hotels H2 and H4 left on average 8.8% and 10.0% of portions on their plate.
3.4. Management of Unused/Unconsumed Food
The questionnaire used in the study also made it possible to collect qualitative data, including data on the use of food not used for its intended purpose. In all four facilities, according to the declarations of the persons completing the questionnaires, food not used in the back of the food service facilities during the process of preparing meals consisted of the inedible parts of food. In all facilities, it was declared that the food was disposed of in a waste container. The same was done in all facilities with so-called plate waste. Regardless of the type of service provided by the hotels, all the leftovers left on the plates were disposed of in a waste container. On the other hand, it was found that dishes not consumed and left by hotel guests on the breakfast buffet were transferred to the staff buffet. Across the four facilities over the course of the week, the mass of discarded food was reduced by a total of 469.48 kg (Figure 2). In this way, the food waste was reduced in the investigated facilities, especially in hotel H1, offering only breakfast to its guests. It was calculated that in facility H1, in this way, slightly over than 35% of the finished products were saved from going to waste. In hotels H2, H3, and H4, this percentage was 17.09%, 18.82%, and 23.76% respectively.
4. Discussion
As indicated by the research Okumus et al. [29] guest behaviors, preferences, and attitudes are the causes of food waste in hotels. As Kilibarda et al. [30] notes, limiting food waste in the hospitality sector is difficult because of the uneven production of food and the specific and diverse ways of running a business in this sector. As emphasized by Filimonau and de Coteau [18], the reduction of food waste in food services should be concentrated on the three basic stages, i.e., the pre-kitchen stage (including food storage), the kitchen, and the post-kitchen stage. The first stage of food production in food services is the receipt and storage of raw materials/semi-finished products/products. As this study has shown, there was no food waste at this stage, which may be related to the fact that all four hotels took deliveries of food every day in the just-in-time system. That the investigated facilities work with regular specialized suppliers of food products is also not without significance. In addition, the elimination of food waste at the storage stage may be a result of a well-functioning system of food safety supervision in Polish food service facilities and consultations with external advisors in the implementation of supervision systems [31,32]. However, other studies have shown that in many food service establishments, food is wasted at this stage. As indicated by Bilska et al. [20], almost half of the studied establishments occasionally wasted food at the storage stage due to overlooking the expiry date and excessive purchases. On the other hand, one-third of respondents declared that they occasionally threw away food due to ill-considered purchases and improper storage conditions. Kilibarda [33] noted that the most common cause of food waste in food storage is a failure to follow good practices in production and hygiene, which in turn may be associated with shortcomings in the supervision of these processes [34]. Improper storage conditions (e.g., too high temperature in a refrigerated warehouse) or failure to apply the FIFO principle (First-In, First-Out) are important factors in the generation of food waste [35]. Although, as Pirani and Arafat [12] emphasize, many food service facilities, including hotels, have systems in place to minimize food waste resulting from the expiration of food products in the storage phase, e.g., they apply the FIFO principle. As Papargyropoulou et al. [2] pointed out, in hotel food services, the main share of food waste that, according to the authors, can be avoided is mainly fruit and vegetables, followed by cereal products, fish, and seafood as well as meat.
The data obtained indicate that in the facilities investigated in the study, in the structure of unused food, on average 27.47% consisted of inedible parts from the production department at the stage of food preparation. This value is within the range indicated by Papargyropoulou et al. [36] in their work, stating that 15 to 55% of food waste originated in the food preparation stage in the back of food service facilities. The WRAP report [37] indicates that 45% of food waste originates at the food preparation stage. Meanwhile, research conducted by The Sustainable Restaurant Association in the UK [38] has indicated that in British restaurants, most food, i.e., about 65%, is wasted during meal preparation. Taking into account the mass of raw materials used in the production of dishes in each hotel, it was determined that the inedible parts of food disposed of in the production department represented between 2.3% and 4.7% of the total. Considering the number of guests served, it was calculated that meal preparation generated in the production department on average 23 g of inedible parts of food per customer served. It was noted that of the four facilities surveyed, the largest percentage of inedible parts of food in the production department was recorded in facility H2. It had the highest number of guests served during the week, and therefore, the highest mass of raw material processed in period studied. Additionally, the hotel served the largest number of consumers during organized events, i.e., groups (banquets, conferences). It should be noted that in the hotels studied, the production of meals was based partly on semi-finished products. This likely contributed to the low proportion of food recorded as unused. At this stage of production, the inedible parts of food were disposed of, so we can speak of unavoidable hospitality food waste. According to Wang et al. [39], hospitality food waste should exclude non-edible items. Oliveira et al. [7] estimated avoidable hospitality food waste at 73–79% of the total amount of hospitality food waste.
In the investigated hotels, the most food was wasted in the serving department, i.e., in the buffet in the dining room or in the form of plate waste weighed in the dishwashing room. It was found that in the investigated facilities, on average, 72.55% of the food wasted came from this department. A significant share of this value (48.82%) was constituted by plate waste left by consumers on their plates, and 23.73% was food left/not consumed by hotel guests on the breakfast buffet in the dining room. As it turns out, a significant part of the food wasted in food services consists of ready-made food. According to Bilska et al. [20], one of the most common reasons for wasting food in the food service sector is the preparation of too much food. Optimization of the choice of the food distribution system should consider not only hygienic and economic aspects [40] but also issues regarding the minimization of plate waste.
The core element of the food services at all the facilities included in the survey was serving breakfast to hotel guests. It was determined that during the week, an average of 8.89% of the weight of breakfasts served from the kitchen was not used as intended, i.e., consumed by hotel guests at the breakfast buffet, whereby 3.47% of the breakfasts was left/unused on the buffet, and 5.43% was sent to the dishwasher as plate waste. It was found in the investigated facilities that for each breakfast portion of 0.77 kg offered for one customer, 0.034 kg was left on the buffet in the dining room on average, which constituted 4.4% of its weight. An additional 0.045 kg of the breakfast portion served for one consumer was returned to the dishwashing room in the form of plate waste without questioning the quality of meals and e.g., finding foreign objects in them [41,42]. Therefore, it was determined that an average total of 79 g of each portion of breakfast served was not used for its original purpose, which was 10.26% of the mass of the breakfast served by the kitchen. It should be noted that the dishes not used by hotel guests in the breakfast buffet were transferred to the staff buffet. This is not a common practice. As shown by Bilska et al. [18], of 130 establishments surveyed, only one in ten allowed employees to eat such dishes.
Participants in the study conducted by Okumus et al. [29], which used semi-structured face-to-face interviews in all-inclusive hotels in Turkey, indicated that it is difficult to estimate the amount of food wasted in hotel food services, but based on their experience and observations, they suggested that as much as 35% of the food served on a breakfast buffet is wasted. This is a much higher value than the one they had obtained in their own research (i.e., nearly 9% of the mass of breakfasts spent during the week). Some respondents in the cited study [29] indicated that the degree of food waste depends on the type and size of breakfast buffets and whether local food and beverages are offered. In addition, representatives of the hotels surveyed identified customers as the main source of food waste.
In our own research, analyzing the structure of food waste, the share of plate waste in the investigated facilities providing various types of services was nearly 50%. Studies by other authors indicate a much lower share of plate waste in the structure of food waste. For example, Papargyropoulou et al. [36] showed that customer plate waste constituted 23–35% of the total. In contrast, WRAP [36] estimated plate waste at 34%. Plate waste left by customers at the restaurants surveyed by Silvennoinen et al. [43] ranged from 4% to 8%. Nevertheless, it should be taken into account that the mass of plate waste generated was correlated with the type and form of food service provided. Even so, the largest share was constituted by plate waste after breakfasts served at a self-service buffet (from H2: 22.41% to H3: 47.56%). This phenomenon can be explained by the fact that hotel guests using the buffet have already paid for breakfast when paying for the night. Therefore, as part of the rate, they try to eat as much as possible, wishing to try the items available on the buffet. Unfortunately, with too many different items, they are unable to consume them all and thus leave plate waste. In addition, attention should be paid to the mass of the breakfast portion served to the customer. A particularly large amount of plate waste was found in facility H3, where a breakfast portion of 0.81 kg on average was served per customer. However, data concerning facility H2, in which the share of plate waste from the breakfast buffet was recorded at a much lower level compared to H3, indicate that the mass of the breakfast portion served to customers is not directly related to the weight of scraps left on their plates. This is because in this facility, H2, a breakfast of an average weight of 0.84 kg was served per customer. Other problems may be e.g., a poorly chosen breakfast menu, or inadequate quality of the food served. As Priefer et al. note [44], serving food on a buffet, when an unlimited amount of food is offered and the price is fixed, is a factor that stimulates customers to take more than they are able to consume. Papargyropoulou et al. [2] suggest that using à la carte service instead of buffet service can prevent food waste. These findings are confirmed by the dependence observed in the hotels surveyed that the least amount of plate waste was recorded for the service in the restaurant where the dishes were served à la carte (from 2.89% to 16.74%). It is good practice to analyze the amount and type of plate waste in order to understand which products are most often left over and take action to modify the menu on offer [45]. When it is not possible to change the way dishes are served, the introduction of smaller plates, for example, should be considered [46], as studies conducted in Poland and Lithuania have shown that portion size is not a factor influencing the choice restaurant for dining outside the home [47]. Several studies have measured the effect of changing the size of a plate on the amount of plate waste. Simulations carried out by Ravandia and Jovanovicb [48] showed that a smaller plate generates on average 13.4% less plate waste. Kallbekken and Sælen [46] demonstrated that reducing the plate size by 3 cm could reduce the amount of plate waste by about 22%. An experiment carried out by Hansen et al. [49] showed that a 3 cm reduction in the size of the plate at a lunch buffet led to a 25.8% reduction in the mass of plate waste. Pirani and Arafat [12] recommend promoting the replacement of lunches and dinners served on a buffet with choosing from a menu to limit food waste. In addition to reducing plate size, Mirosa et al. [50] emphasize that solutions worth considering in order to reduce food waste in food service establishments are ordering meals in advance, limiting the range of dishes available, and information campaigns to raise consumer awareness. Consumers should be made aware that food production is connected with a negative impact on the environment (e.g., the emission of Greenhouse Gases, utilization of natural resources such as water) [51].
The results of the study by Beretta and Hellweg [52] show that avoidable food waste was estimated at 108 g/meal. In their own research, it was determined that avoidable food waste (assuming that all dishes served to consumers contain only edible elements) amounted to 209 g/1 customer, for breakfasts of 79 g/portion, and 46 g/1 customer served in a restaurant.
Analyzing the data obtained, it was found that on average, 117.4 kg of food was wasted by one facility in seven days, most of which came from the serving department. Based on the Tourism in 2019 report [53], in mid-2019 in Poland, there were 7969 restaurants, bars, and cafés, canteens, and food service facilities in facilities offering overnight accommodation for tourists. The most numerous were restaurants—3391 (42.6%) followed by bars and cafés—2234 (28.0%). The majority of these restaurants, bars, and cafés (65.7%) were located in hotels. Taking into account the estimated amount of food wasted and the number of food service facilities in accommodation establishments in Poland, it can be assumed that the hotel food service sector is responsible for significant amounts of food waste.
Unfortunately, the rise of Severe acute respiratory syndrome coronavirus 2 (SARS-Cov-2) pandemic in Poland suddenly interrupted a good period in the market, and the hotel and food services industry, among other things due to restrictions imposed by the government (e.g., sale of meals only to take away, limits of guests, a complete ban on serving guests (from 28 December 2020)), very quickly found itself in an entirely new reality. It should be assumed that this period is temporary, and once we return to functioning as before the pandemic, the problems with food waste will be similar to those diagnosed in this work as well as in many other studies.
In conclusion, it should be stated that reducing food waste in the food services industry, including hotels, is a major challenge, linked among other things to difficulties in estimating the demand for services or adjusting the size of portions to the needs of customers, so as to reduce plate waste. For this reason, further research is needed, which will focus on these issues in order to introduce programmes to reduce food waste (e.g., change of the way of consumer service).
The key limitation to this work is the relatively small research sample based on only one type of food service, namely hotel food services. Another limitation is the short period over which it was conducted (seven days). The next limitation is the way of the selection of the sampling. The next survey should fulfill the condition of representativeness for the Polish food service sector. Further research should also be carried out in other types of food service establishments, i.e., restaurants and bars. Moreover, the research should be conducted in different seasons of the year so that the data obtained are representative for the entire calendar year.
5. Conclusions
On the basis of the conducted research, it should be concluded that most—almost three-quarters of the food—was wasted in the serving department, i.e., on the buffet in the dining room or in the form of plate waste.
The share food waste made up of food left on plates by customers was almost half. The mass of plate waste generated was correlated with the type and form of catering service provided, the largest share being plate waste after breakfasts served as a self-service buffet. The least amount of plate waste was recorded in the restaurant where dishes were served à la carte.
The dishes not consumed by hotel guests at the breakfast buffet were transferred to the staff buffet, where the employees of the food service facilities, but also other operational departments of the hotel, have their meals. Unfortunately, this is not a common practice in smaller food service establishments, but it can certainly be recommended to them.
At the same time, it is worth stressing that appropriate organization of the system for supplying food raw materials in catering establishments (daily in just in time) can completely or almost completely eliminate food waste at the storage stage
In order to reduce food waste, both food service workers and consumers must be educated. Employees should be trained in the proper handling of food, hygiene, and serving of food. However, consumer education, should be multilateral. On the one hand, it should be aimed at raising awareness of the negative impact of food waste, for example on the natural environment.
On the other hand, it should indicate what action everyone can take to limit this negative phenomenon, whether at home, in the workplace, or in a food service establishment (e.g., putting the right amount of food on the plate, which can be consumed).
Author Contributions
Conceptualization, M.T. and B.B.; methodology, M.T. and B.B.; software, M.T.; validation, M.T., B.B.; formal analysis, M.T.; investigation, M.T., B.B. and A.T.-K.; data curation, M.T.; writing—original draft preparation, M.T., B.B. and A.T.-K.; writing—review and editing, B.B., M.T. and D.K.-K.; visualization, M.T.; supervision, D.K.-K. All authors have read and agreed to the published version of the manuscript.
Funding
This publication has been developed under the contract with the National Center for Research and Development No Gospostrateg1/385753/1/NCBR/2018 for carrying out and funding of a project implemented as part of the “The social and economic development of Poland in the conditions of globalizing markets—GOSPOSTRATEG” program called “Developing a system for monitoring wasted food and an efective program to rationalize losses and reduce food wastage” (acronym PROM).
Institutional Review Board Statement
Not applicable.
Informed Consent Statement
Not applicable.
Data Availability Statement
Not applicable.
Conflicts of Interest
The authors declare no conflict of interest.
Appendix A

Table A1.
Form for measuring wasted food in the breakfast buffet.
| No. | Types of Meals | The Mass of Dishes Obtained from the Kitchen (kg) | Mass of Unconsumed Food (kg) (Without Plate) | Reason for Dishes not Being Consumed * | Management ** |
|---|---|---|---|---|---|
| 1. | |||||
| 2. | |||||
| 3. | |||||
| ... |
* 1—preparing too much food, 2—spoiled, contamination, 3—other (what?). ** 1—disposed of in a public garbage container, 2—our employees eat them, 3—drained into the sewer system, 4—donating food for social purposes, 5—other (what).
References
- Okazaki, W.; Turn, S.; Flachsbart, P. Characterization of food waste generators: A Hawaii case study. Waste Manag. 2008, 28, 2483–2494. [Google Scholar] [CrossRef] [PubMed]
- Papargyropoulou, E.; Wright, N.G.; Lozano, F.J.; Steinberger, J.K.; Padfield, R.; Ujang, Z. Conceptual framework for the study of food waste generation and prevention in the hospitality sector. Waste Manag. 2016, 49, 326–336. [Google Scholar] [CrossRef] [PubMed]
- Erdogan, N.; Baris, E. Environmental protection programs and conservation practices of hotels in Ankara, Turkey. Tour. Manag. 2007, 28, 604–614. [Google Scholar] [CrossRef]
- Grandhi, B.; Singh, J.A. What a waste! a study of food wastage behaviour in Singapore. J. Food Prod. Mark. 2016, 22, 471–485. [Google Scholar] [CrossRef]
- Filimonau, V.; Nghiem, V.N.; Wang, L. Food waste management in ethnic food restaurans. Int. J. Hosp. Manag. 2021, 92, 102731. [Google Scholar] [CrossRef]
- FUSIONS. Estimates of European Food Waste Levels; IVL Swedish Environmental Research Institute: Stockholm, Sweden, 2016. [Google Scholar]
- Oliveira, B.; de Moura, A.P.; Cuhna, L.M. Reducing food waste in the food service sector as a way to promote public health and environmental sustainability. In Climate Change and Health Book Subtitle: Improving Resilience and Reducing Risks; Filho, W.L., Azeiteiro, U.M., Alves, F., Eds.; Springer: Berlin/Heidelberg, Germany, 2016. [Google Scholar]
- Marthinsen, J.; Sundt, P.; Kaysen, O.; Kirkevaag, K. Prevention of Food Waste in Restaurants, Hotels, Canteens and Catering; Nordic Council of Ministers: Copenhagen, Denmark, 2012. [Google Scholar]
- ReFED 2018. Foodservice Food Waste Action Guide, ReFED-Rething Food Waste Through Economics and Data. 2018. Available online: https://www.refed.com/downloads/Foodservice_Guide_Web.pdf (accessed on 16 November 2020).
- Liu, G. Food losses and food waste in China: A first estimate. Agric. Fish. Pap. 2014, 66. [Google Scholar] [CrossRef]
- Wen, Z.; Huanan, Z.; De Clercq, D.; Beck, M.B.; Zhang, H.; Zhang, H.; Fei, F.; Liu, J. Design, implementation, and evaluation of an Internet of Things (IoT) network system for restaurant food waste management. Waste Manag. 2018, 73, 26–38. [Google Scholar] [CrossRef]
- Pirani, S.I.; Arafat, H.A. Reduction of food waste generation in the hospitality industry. J. Clean. Prod. 2016, 132, 129–145. [Google Scholar] [CrossRef]
- WRAP 2020. UK Progress aggainst Courtauld 2025 Targets and UN Sustainable Development Goal 12.3. January; WRAP: Oxon, UK, 2020; Available online: https://wrap.org.uk/sites/files/wrap/Progress_against_Courtauld_2025_targets_and_UN_SDG_123.pdf (accessed on 16 November 2020).
- Raport, Rynek Gastronomiczny w Polsce. 2020. Available online: http://www.horecanet.pl/rynek-gastronomiczny-w-polsce-raport/ (accessed on 30 October 2020).
- Tul-Krzyszczuk, A.; Gębski, J.; Jeznach, M.; Maciąg, A. The marketing communication innovations in relations with customers of catering enterprises—Case of Poland. Postępy Techniki Przetwórstwa Spożywczego 2020, 1, 185–194. [Google Scholar]
- Van den Bergh, J.; Konewka, M.; Kerkstoel, G.; Behrer, M. Jak Kreować Marki, Które Pokocha Pokolenie Y? Edgard: Edgard, LA, USA, 2012. [Google Scholar]
- Williams, K.C.; Page, R.A. Marketing to the generations. J. Behav. Stud. Bus. 2011, 3, 37–53. [Google Scholar]
- Filimonau, V.; De Coteau, D.A. Food waste management in hospitality operations: A critical review. Tour. Manag. 2019, 71, 234–245. [Google Scholar] [CrossRef]
- Filimonau, V.; Krivcova, M.; Pettit, F. An exploratory study of managerial approaches to food waste mitigation in coffee shops. Int. J. Hosp. Manag. 2019, 76, 48–57. [Google Scholar] [CrossRef] [Green Version]
- Bilska, B.; Tomaszewska, M.; Kołożyn-Krajewska, D. Managing the Risk of Food Waste in Foodservice Establishments. Sustainability 2020, 12, 2050. [Google Scholar] [CrossRef] [Green Version]
- Głuchowski, A.; Czarniecka-Skubina, E.; Buła, M. The Use of the Sous-Vide Method in the Preparation of Poultry at Home and in Catering—Protection of Nutrition Value Whether HighEnergy Consumption. Sustainability 2020, 12, 7606. [Google Scholar] [CrossRef]
- Filimonau, V.; Matute, J.; Kubal-Czerwińska, M.; Krzesiwo, K.; Mika, M. The determinants of consumer engagement in restaurant food waste mitigation in Poland: An exploratory study. J. Clean. Prod. 2020, 247, 119105. [Google Scholar] [CrossRef]
- Bilska, B.; Piecek, M.; Kołożyn-Krajewska, D.; Krajewski, K. Risk of food losses and potential of food recovery for social purposes. Waste Manag. 2016, 52, 269–277. [Google Scholar] [CrossRef]
- Niedek, M.; Łaba, S.; Kamińska-Dwórznicka, A.; Krajewski, K.; Szczepański, K. Definiowanie strat i marnotrawstwa żywości. Żywność. Nauka. Technologia. Jakość 2019, 4, 5–16. [Google Scholar]
- Wang, L.; Xue, L.; Li, Y.; Liu, X.; Cheng, S.; Liu, G. Horeca food waste and its ecological footprint in Lhasa, Tibet, China. Resour. Conserv. Recycl. 2018, 136, 1–8. [Google Scholar] [CrossRef]
- Parfitt, J.; Barthel, M.; Macnaughton, S. Food waste within food supply chains: Quantification and potential for change to 2050. Philos. Trans. R. Soc. B: Biol. Sci. 2010, 365, 3065–3081. [Google Scholar] [CrossRef] [Green Version]
- Östergren, K.; Gustavsson, J.; Bos-Brouwers, H.; Timmermans, T.; Hansen, O.J.; Møller, H.; Anderson, G.; O’Connor, C.; Soethoudt, H.; Quested, T.; et al. FUSIONS Definitional Framework for Food Waste; SIK—The Swedish Institute for Food and Biotechnology: Göteborg, Sweden, 2014. [Google Scholar]
- Commission Delegated Decision (EU). 2019/1597 of 3 May 2019 supplementing Directive 2008/98/EC of the European Parliament and of the Council as regards a common methodology and minimum quality requirements for the uniform measurement of levels of food waste. Off. J. Eur. Union 2019, L248/77. [Google Scholar]
- Okumus, B.; Taheri, B.; Giritlioglu, I.; Gannon, M. Tackling food waste in all-inclusive resort hotels. Int. J. Hosp. Manag. 2020, 88, 102543. [Google Scholar] [CrossRef]
- Kilibarda, N.; Djokovic, F.; Suzic, R. Food Waste Management—Reducing and Managing Food Waste in Hospitality. Meat Technol. 2019, 60, 134–142. [Google Scholar] [CrossRef]
- Trafiałek, J.; Laskowski, W.; Kolanowski, W. The use of Kohonen’s artificial neutral networks for analyzing the results of HACCP system declarative survey. Food Control 2015, 51, 263–269. [Google Scholar] [CrossRef]
- Trafiałek, J.; Domańska, A.; Kolanowski, W. Analysis of food safety compliance in Warsaw nurseries. Food Control 2019, 96, 421–431. [Google Scholar] [CrossRef]
- Kilibarda, N. Food Safety and Food Waste in Hospitality. In Encyclopedia of the UN Sustainable Development Goals; Zero Hunger: Cham, Switzerland, 2019. [Google Scholar]
- Trafiałek, J.; Kołożyn-Krajewska, D. Implementation of Safety Assurance System in Food Production in Poland. Pol. J. Food Nutr. Sci. 2011, 61, 115–124. [Google Scholar] [CrossRef] [Green Version]
- Engström, R.; Carlsson-Kanyama, A. Food losses in food service institutions Examples from Sweden. Food Policy 2004, 29, 203–213. [Google Scholar] [CrossRef]
- Papargyropoulou, E.; Steinberger, J.K.; Wright, N.G.; Lozano, F.J.; Padfield, R.; Ujang, Z. Patterns and Causes of Food Waste in the Hospitality and Food Service Sector: Food Waste Prevention Insights from Malaysia. Sustainability 2019, 11, 6016. [Google Scholar] [CrossRef] [Green Version]
- WRAP 2013. Overview of Waste in there UK Hospitality and Food Service Sector; WRAP: Oxon, UK, 2013; Available online: https://www.wrap.org.uk/sites/files/wrap/Overview%20of%20Waste%20in%20the%20UK%20Hospitality%20and%20Food%20Service%20Sector%20FINAL.pdf (accessed on 25 August 2020).
- Sustainable Restaurant Association (SRA). Too Good to Waste: Restaurant Food Waste Survey Report; SRA: London, UK, 2010. [Google Scholar]
- Wang, L.E.; Liu, G.; Xiaojie, L.; Liu, Y.; Gao, J.; Zhou, B.; Gao, S.; Cheng, S. The weight of unfinished plate: A survey based characterization of restaurant food waste in Chinese cities. Waste Manag. 2017, 66, 3–12. [Google Scholar] [CrossRef]
- Grzesińska, W.; Tomaszewska, M.; Bilska, B.; Trafiałek, J. Optymalizacja uwarunkowań wyboru systemu dystrybucji posiłków w żywieniu szpitalnym. Żywność. Nauka. Technologia. Jakość 2014, 4, 188–200. [Google Scholar]
- Trafiałek, J.; Kaczmarek, S.; Kolanowski, W. The risk analysis of metalic foreign bodies in food products. J. Food Qual. 2016, 39, 398–407. [Google Scholar] [CrossRef]
- Kolanowski, W.; Trafialek, J.; Drosinos, E.H.; Tzamalis, P. Polish and Greek young adults’ experience of low quality meals when eating out. Food Control. 2020, 109, 106901. [Google Scholar] [CrossRef]
- Silvennoinen, K.; Katajajuuri, J.M.; Hartikainen, H.; Jalkanen, L.; Koivupuro, H.K.; Reinikainen, A. Food waste volume and composition in the finnish supply chain: Special focus on food, service sector. In Proceedings of the Fourth International Symposium on Energy from Biomass and Waste, Venice, Italy, 12–15 November 2012. [Google Scholar]
- Priefer, C.; Jörissen, J.; Bräutigam, K.-R. Food waste prevention in Europe–A cause-driven approach to identify the most relevant leverage points for action. Resour. Conserv. Recycl. 2016, 109, 155–165. [Google Scholar] [CrossRef]
- WRAP 2017. Taking Action on Waste Information Sheet: Restaurants; WRAP: Oxon, UK, 2017; Available online: http://www.wrap.org.uk/sites/files/wrap/Restaurants.pdf (accessed on 13 November 2020).
- Kallbekken, S.; Saelen, H. Nudging hotel guests to reduce food waste as a win-win environmental measure. Econ. Lett. 2013, 119, 325–327. [Google Scholar] [CrossRef]
- Trafiałek, J.; Czarniecka-Skubina, E.; Kulaitiené, J.; Vaitkevičienė, N. Restaurant’s Multidimensional Evaluation Concerning Food Quality, Service, and Sustainable Practices: A Cross-National Case Study of Poland and Lithuania. Sustainability 2020, 12, 234. [Google Scholar]
- Ravandi, B.; Jovanovic, N. Impact of plate size on food waste: Agent-based simulation of food Consumption. Resour. Conserv. Recycl. 2019, 149, 550–565. [Google Scholar] [CrossRef]
- Hansen, P.G.; Jespersen, A.M.; Skov, L.R. Size matter!: A choice architectural field experiment in reducing food waste. J. Food Hosp. Res. 2015, 4, 11–15. [Google Scholar]
- Mirosa, M.; Munro, H.; Mangan-Walker, E.; Pearson, D. Reducing waste of food left on plates: Interventions based on means-end chain analysis of customers in food service sector. Brit. Food J. 2016, 118, 2326–2343. [Google Scholar] [CrossRef]
- Bilska, B.; Tomaszewska, M.; Kołożyn-Krajewska, D.; Szczepański, K.; Łaba, R.; Łaba, S. Environmental aspects of food wastage in trade–a case study. Environ. Prot. Nat. Resour. 2020, 31, 1–11. [Google Scholar]
- Beretta, C.; Hellweg, S. Potential environmental benefits from food waste prevention in the food service sector. Resour. Conserv. Recycl. 2019, 147, 169–178. [Google Scholar] [CrossRef]
- GUS. Tourism in 2019 r. Statistical Analyses; GUS Warszawa: Rzeszów, Poland, 2020.
Figure 1.
Type of information recorded in the form, including the stage of the technological process.
Figure 1.
Type of information recorded in the form, including the stage of the technological process.

Figure 2.
Mass (kg) and share (%) of food consumed and unused during the week in relation to the weight of raw material used, including the stage of the technological process.
Figure 2.
Mass (kg) and share (%) of food consumed and unused during the week in relation to the weight of raw material used, including the stage of the technological process.

Figure 3.
Structure of food waste in the total mass of unused food, including the stage of the technological process (%).
Figure 3.
Structure of food waste in the total mass of unused food, including the stage of the technological process (%).

Table 1.
Characteristics of the hotels participating in the study.
| No. | Specification | Hotel 1 (H1) | Hotel 2 (H2) | Hotel 3 (H3) | Hotel 4 (H4) |
|---|---|---|---|---|---|
| 1. | Location | Warsaw | Warsaw | Warsaw | Warsaw |
| 2. | Hotel rating (number of stars) (1) | 1 | 2 | 2 | 3 |
| 3. | Time in business | >9 years | >9 years | >9 years | >9 years |
| 4. | Catering services offer | breakfasts | breakfasts, celebrations/ events, restaurant | breakfasts, celebrations/ events, restaurant | breakfasts, celebrations/ events, restaurant |
| 5. | Number of consumers places (gastronomy) | 200 | 100 | 92 | 142 |
| 6. | Average daily number of consumers served (gastronomy) | 281 | 221 | 270 | 308 |
| 7. | Supply frequency | Every day (just in time) | Every day (just in time) | Every day (just in time) | Every day (just in time) |
| 8. | Position of the person filling the questionnaire | chef | chef | chef | chef |
| 9. | Food safety management systems in place | HACCP | HACCP | HACCP | HACCP |
| 10. | Testing time | February/March 2020 | February/March 2020 | November/ December 2019 | October 2019 |
(1) Hotel rating is based on a scale of 1–5 stars, 5 stars means the highest level of services, 1 star means the lowest/poor standard (budget/economy).
Table 2.
Weight of raw materials and meals served (kg) in H1, H2, H3, and H4 hotels taking into account the type of services provided.
Table 2.
Weight of raw materials and meals served (kg) in H1, H2, H3, and H4 hotels taking into account the type of services provided.
| Specification | H1 | H2 | H3 | H4 | |
|---|---|---|---|---|---|
| weight of raw materials used | • week (kg) | 565.33 | 1280.38 | 992.9 | 943.52 |
| • mean (kg/day) | 80.76 | 182.91 | 141.84 | 134.79 | |
| consumers served - breakfast | • week (No.) | 892 | 1166 | 1184 | 1016 |
| • mean (No./day) | 127.43 | 166.57 | 169.14 | 145.14 | |
| consumers served - groups | • week (No.) | - | 434 | 25 | 286 |
| • mean (No./day) | - | 72.33 (1) | 8.33 (2) | 57.2 (3) | |
| consumers served - restaurant | • week (No.) | - | 163 | 361 | 231 |
| • mean (No./day) | - | 23.29 | 51.57 | 33.00 | |
| weight of dishes served - breakfast | • week (kg) | 543.77 | 859.64 | 866.22 | 637.04 |
| • mean (kg/day) | 77.68 | 122.80 | 123.75 | 91.01 | |
| weight of dishes served - groups | • week (kg) | - | 299.19 (1) | 19.39 (2) | 225.06 (3) |
| • mean (kg/day) | - | 44.36 | 2.77 | 45.01 | |
| weight of dishes served - restaurant | • week (kg) | - | 62.02 | 90.23 | 58.57 |
| • mean (kg/day) | - | 8.86 | 12.89 | 8.36 | |
(1) groups were served for 6 days; (2) groups were served for 3 days; (3) groups were served for 5 days.
Table 3.
Mass of meals (kg) served per consumer in hotels H1, H2, H3, and H4, taking into account the type of food services provided.
Table 3.
Mass of meals (kg) served per consumer in hotels H1, H2, H3, and H4, taking into account the type of food services provided.
| Type of Services | Hotel | Day 1 | Day 2 | Day 3 | Day 4 | Day 5 | Day 6 | Day 7 | Mean (kg) | SD * |
|---|---|---|---|---|---|---|---|---|---|---|
| breakfast | • H1 | 1.09 | 0.52 | 0.44 | 0.83 | 0.88 | 0.63 | 0.40 | 0.68 | 0.26 |
| • H2 | 0.43 | 1.05 | 0.61 | 1.89 | 0.74 | 0.65 | 0.51 | 0.84 | 0.50 | |
| • H3 | 1.14 | 0.64 | 0.70 | 0.68 | 0.51 | 0.98 | 1.04 | 0.81 | 0.23 | |
| • H4 | 1.35 | 0.95 | 0.78 | 0.46 | 0.59 | 0.63 | 0.52 | 0.75 | 0.310 | |
| groups | • H1 | - | - | - | - | - | - | - | - | - |
| • H2 | - | 0.62 | 0.65 | 2.60 | 0.60 | 0.76 | 0.30 | 0.92 | 0.84 | |
| • H3 | - | - | - | 0.85 | 0.55 | 0.97 | - | 0.79 | 0.22 | |
| • H4 | 0.36 | 0.63 | - | 1.07 | - | 0.13 | 0.10 | 0.46 | 0.40 | |
| restaurant | • H1 | - | - | - | - | - | - | - | - | - |
| • H2 | 0.37 | 0.40 | 0.36 | 0.38 | 0.66 | - | 0.37 | 0.42 | 0.12 | |
| • H3 | 0.22 | 0.26 | 0.26 | 0.26 | 0.25 | 0.24 | 0.25 | 0.25 | 0.02 | |
| • H4 | 0.25 | 0.26 | 0.26 | 0.27 | 0.22 | 0.25 | 0.26 | 0.25 | 0.02 |
* SD—Standard Deviation.
Table 4.
Mass of food not used in accordance with its intended use in hotels H1, H2, H3, and H4 taking into account the type of food services provided and the stage of the technological process.
Table 4.
Mass of food not used in accordance with its intended use in hotels H1, H2, H3, and H4 taking into account the type of food services provided and the stage of the technological process.
| Stage of Technological Process | Hotel | ||||
|---|---|---|---|---|---|
| H1 | H2 | H3 | H4 | ||
| Catering facilities departments | |||||
| storage areas | • sum (kg/week) | 0.00 | 0.00 | 0.00 | 0.00 |
| • mean (kg/week) | 0.00 | 0.00 | 0.00 | 0.00 | |
| • SD | 0.00 | 0.00 | 0.00 | 0.00 | |
| preparation areas | • sum (kg/week) | 21.56 | 59.54 | 23.0 | 22.85 |
| • mean (kg/day) | 3.08 | 8.51 | 3.29 | 3.26 | |
| • SD | 1.08 | 7.20 | 0.99 | 1.12 | |
| buffet/dining room | |||||
| breakfast | • sum (kg/week) | 22.77 | 27.24 | 28.10 | 22.85 |
| • mean (kg/day) | 3.25 | 3.89 | 4.01 | 3.26 | |
| • SD | 1.233 | 0.89 | 1.48 | 1.00 | |
| groups/ restaurant | • sum (kg/week) | - | n/a * | n/a | n/a |
| • mean (kg/day) | - | n/a | n/a | n/a | |
| • SD | - | n/a | n/a | n/a | |
| dishwashing facilities | |||||
| breakfast | • sum (kg/week) | 20.31 | 35.72 | 71.00 | 30.60 |
| • mean (kg/day) | 2.90 | 5.10 | 10.14 | 4.37 | |
| • SD | 1.366 | 2.66 | 3.90 | 2.42 | |
| groups | • sum (kg/week) | - | 32.28 | 2.20 | 14.40 |
| • mean (kg/day) | - | 5.38 (1) | 0.73 (2) | 2.88 (3) | |
| • SD | - | 5.91 | 0.21 | 4.42 | |
| breakfast | • sum (kg/week) | - | 4.61 | 25.00 | 5.45 |
| • mean (kg/day) | - | 0.77(2) | 3.57 | 0.78 | |
| • SD | - | 0.52 | 1.17 | 0.46 | |
* n/a—not available (1) service for 6 days; (2) service for 3 days (3) service for 5 days.
Table 5.
Mass of unused food per customer.
| Stage of Technological Process | Hotel | ||||
|---|---|---|---|---|---|
| H1 | H2 | H3 | H4 | ||
| production department | • mean (kg/portion) | 0.026 | 0.032 * | 0.017 * | 0.018 * |
| • SD | 0.01 | 0.02 | 0.01 | 0.01 | |
| breakfast buffet | • mean (kg/portion) | 0.047 | 0.033 | 0.027 | 0.030 |
| • SD | 0.03 | 0.01 | 0.01 | 0.02 | |
| dishwashing facilities | |||||
| breakfast | • mean (kg/portion) | 0.037 | 0.042 | 0.067 | 0.033 |
| • SD | 0.01 | 0.03 | 0.03 | 0.02 | |
| groups | • mean (kg/portion) | - | 0.499 | 0.090 | 0.038 |
| • SD | - | 0.51 | 0.01 | 0.04 | |
| restaurant | • mean (kg/portion) | - | 0.037 | 0.075 | 0.025 |
| • SD | - | 0.03 | 0.03 | 0.01 | |
* this calculation includes the sum of breakfast portions served and those served to people in groups and in the hotel restaurant.
Publisher’s Note: MDPI stays neutral with regard to jurisdictional claims in published maps and institutional affiliations. |
© 2021 by the authors. Licensee MDPI, Basel, Switzerland. This article is an open access article distributed under the terms and conditions of the Creative Commons Attribution (CC BY) license (http://creativecommons.org/licenses/by/4.0/).
Share and Cite
MDPI and ACS Style
Tomaszewska, M.; Bilska, B.; Tul-Krzyszczuk, A.; Kołożyn-Krajewska, D. Estimation of the Scale of Food Waste in Hotel Food Services—A Case Study. Sustainability 2021, 13, 421. https://0-doi-org.brum.beds.ac.uk/10.3390/su13010421
AMA Style
Tomaszewska M, Bilska B, Tul-Krzyszczuk A, Kołożyn-Krajewska D. Estimation of the Scale of Food Waste in Hotel Food Services—A Case Study. Sustainability. 2021; 13(1):421. https://0-doi-org.brum.beds.ac.uk/10.3390/su13010421
Chicago/Turabian StyleTomaszewska, Marzena, Beata Bilska, Agnieszka Tul-Krzyszczuk, and Danuta Kołożyn-Krajewska. 2021. "Estimation of the Scale of Food Waste in Hotel Food Services—A Case Study" Sustainability 13, no. 1: 421. https://0-doi-org.brum.beds.ac.uk/10.3390/su13010421
Note that from the first issue of 2016, this journal uses article numbers instead of page numbers. See further details here.