Cultural and Creative Ecosystems in Medium-Sized Cities: Evolution in Times of Economic Crisis and Pandemic

 , , , , and
Abstract
:1. Introduction
- (1)
- How might the coronavirus pandemic and its aftermath ultimately affect the behavior of the cultural and creative ecosystems in medium-sized cities?
- (2)
- How might the pandemic alter cultural and creative specializations in their ecosystems?
- (3)
- What expectations does the pandemic raise in ecosystems in terms of functional clustering?
- (a)
- In the short term, the pandemic will have effects that are differentiated according to sectors and cities.
- (b)
- In the medium term, the cultural and creative ecosystems of medium-sized cities will maintain their characteristic specializations, which might result in risks or opportunities, depending on the particular specialization.
- (c)
- In the long term, effects will tend toward the consolidation of more structured and inclusive cultural ecosystems.
2. Theoretical Framework and Background Information
2.1. The Nature of Cultural and Creative Ecosystems in Medium-Sized Cities and Their Attributes of Specialization and Clustering
2.2. Considerations on the Impact of Crises (Financial and Health) on Cultural and Creative Ecosystems
3. Materials and Methods
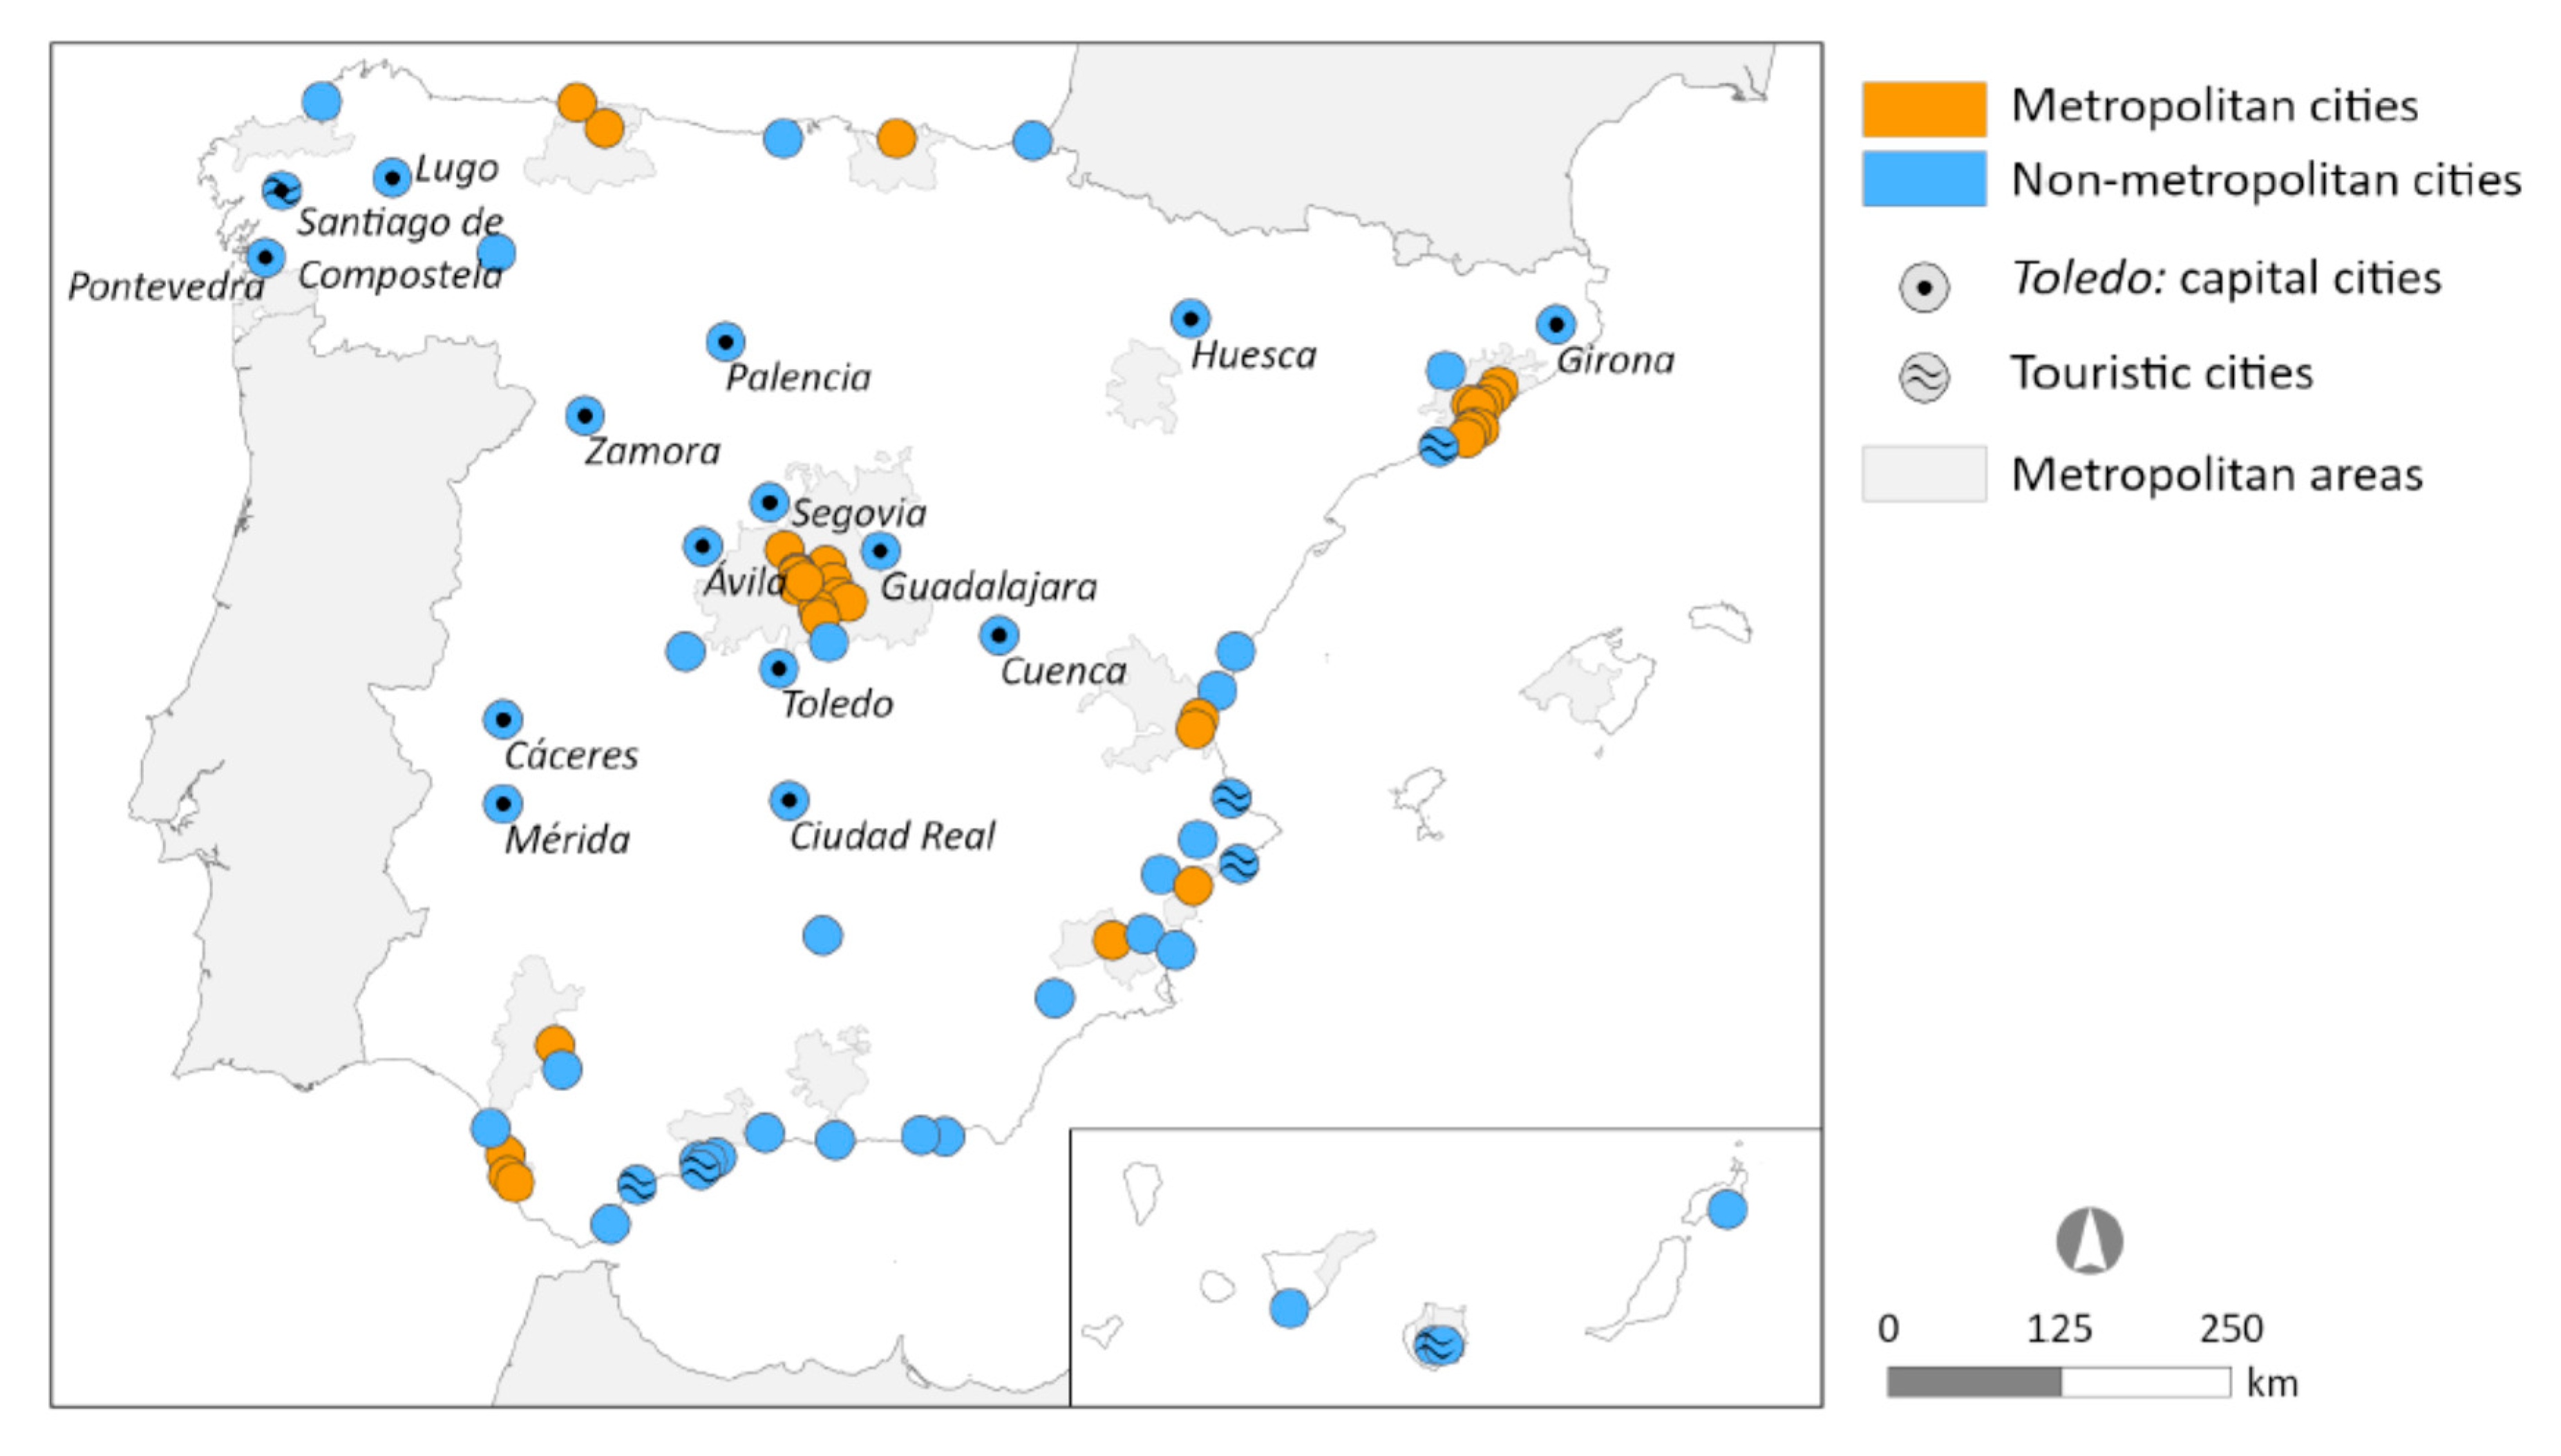
3.1. The Cultural and Creative Ecosystems: Cities, Sectors, and Data for Analysis
3.2. Methods for Analysis of the Dynamism, Specialization, and Clustering of Ecosystems during the Financial Crisis
3.3. Indexes to Establish the Exposure of Cultural Ecosystems to the Impact of the Pandemic
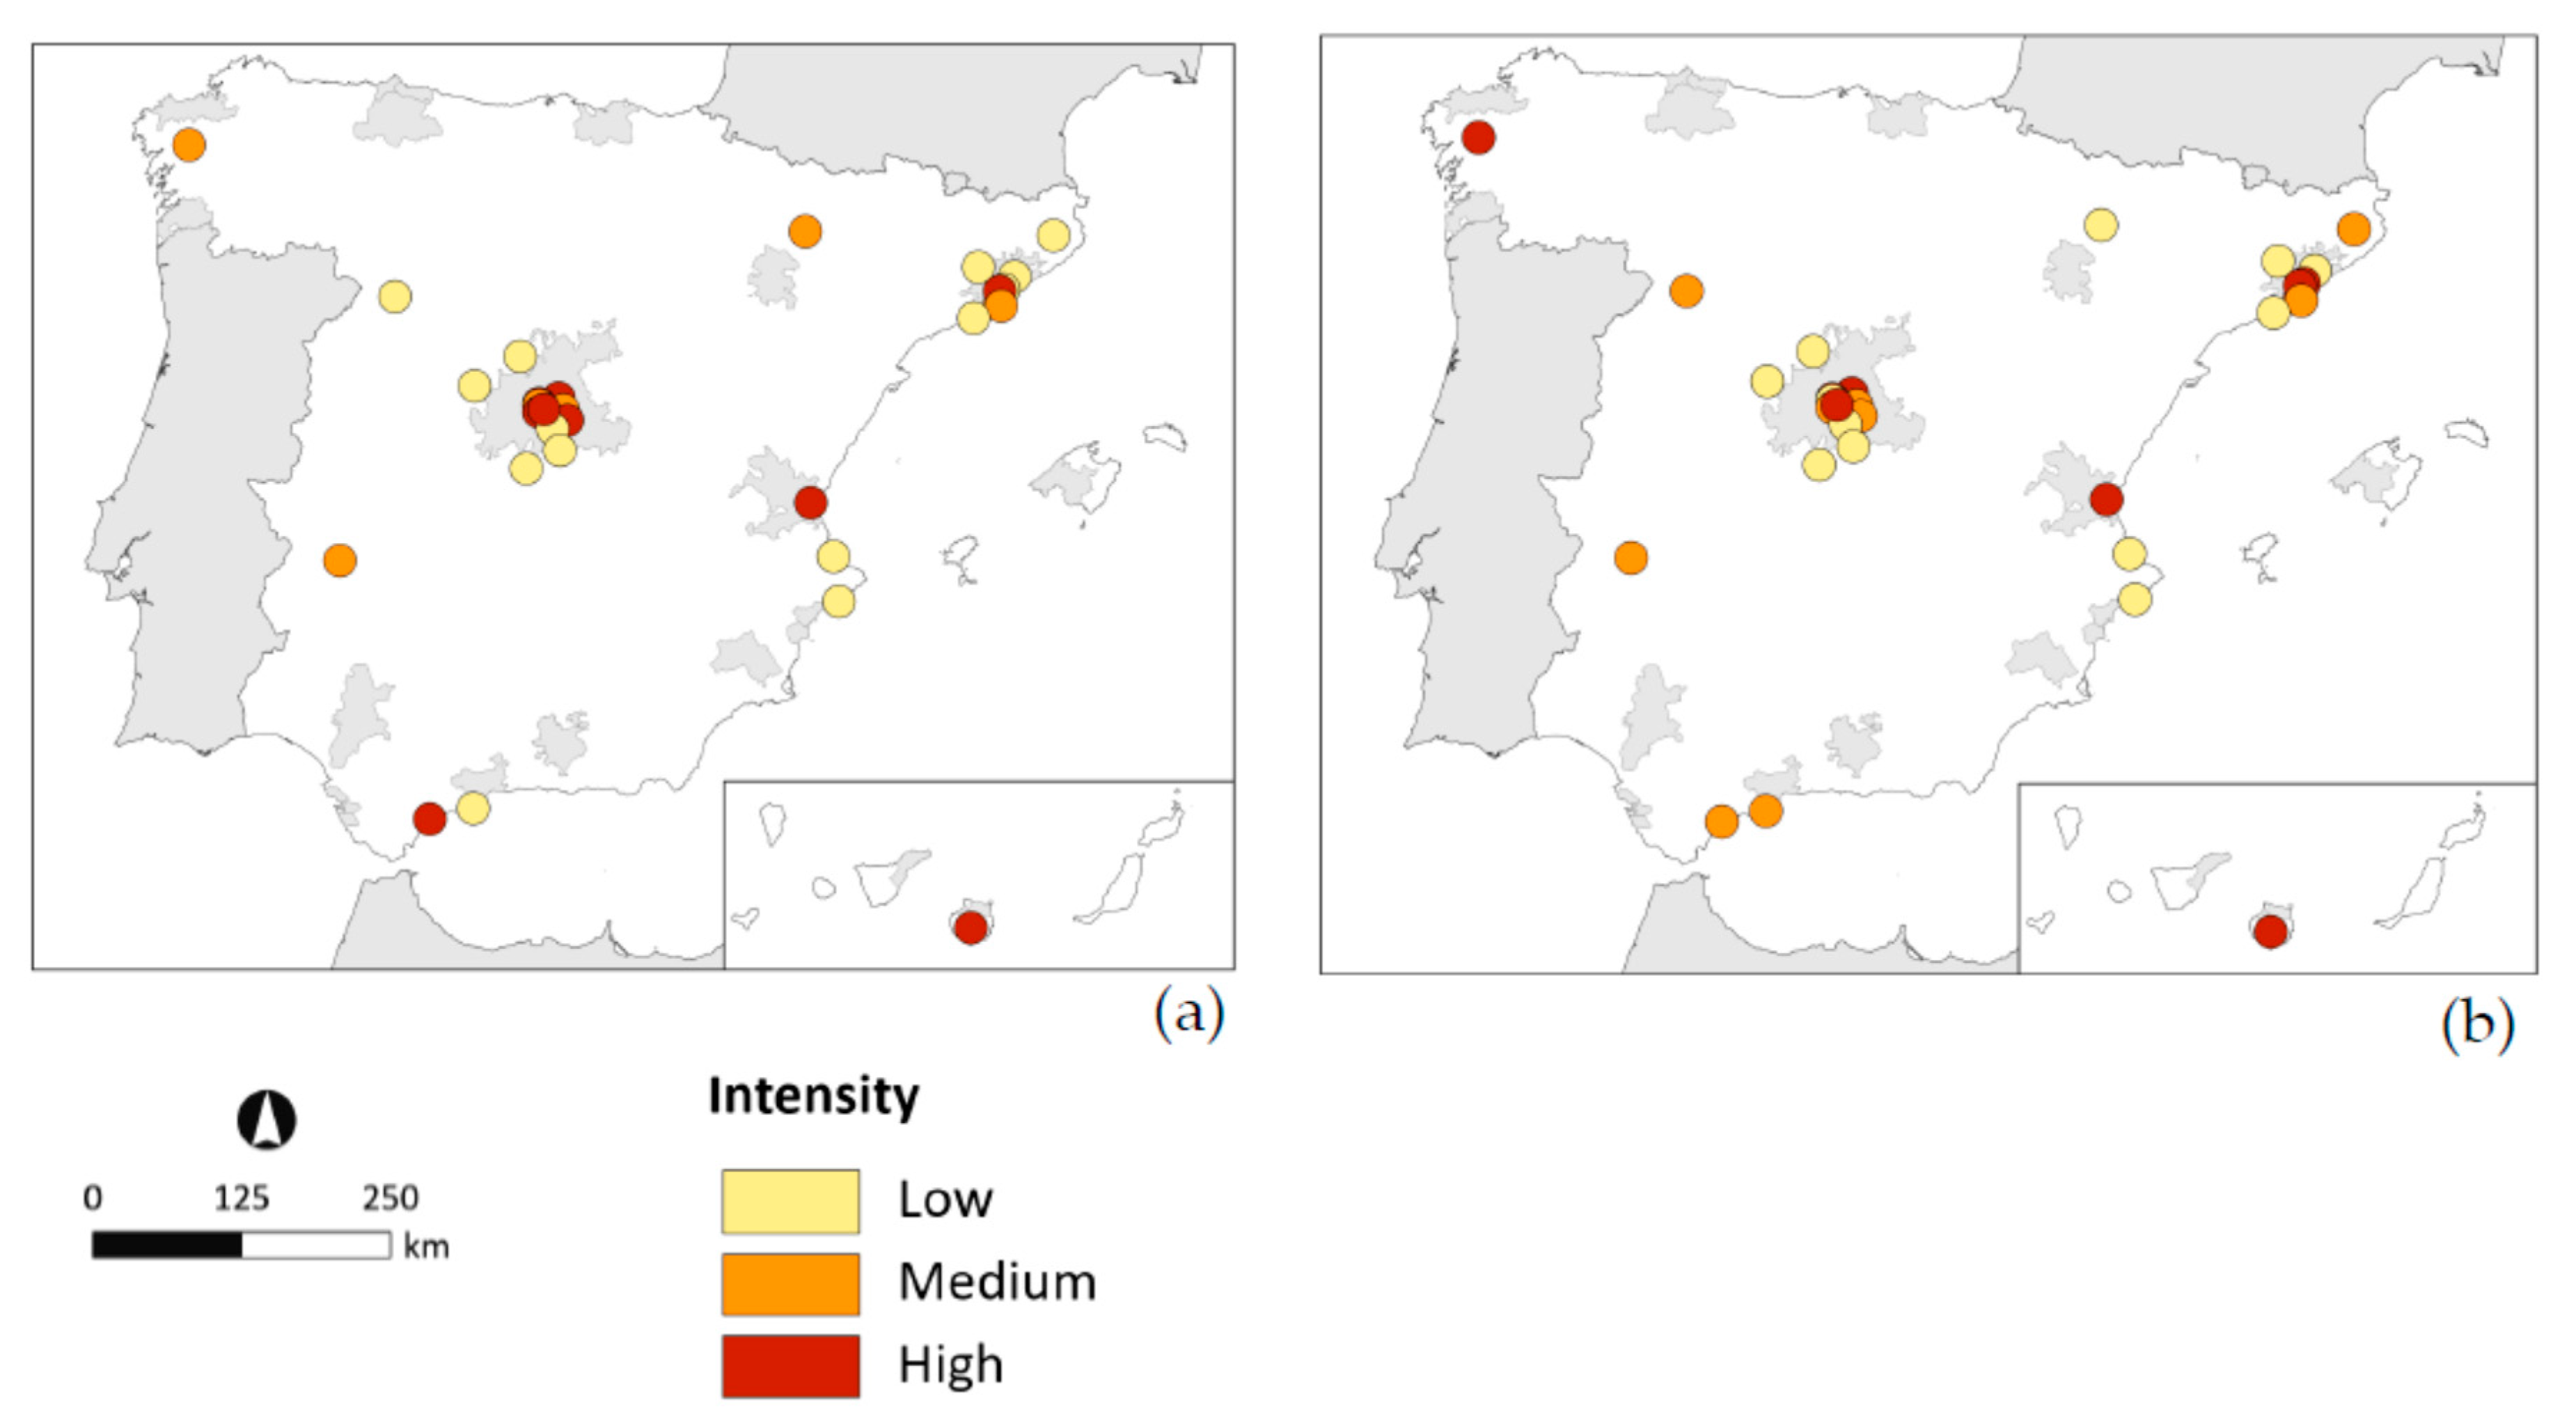
- (a)
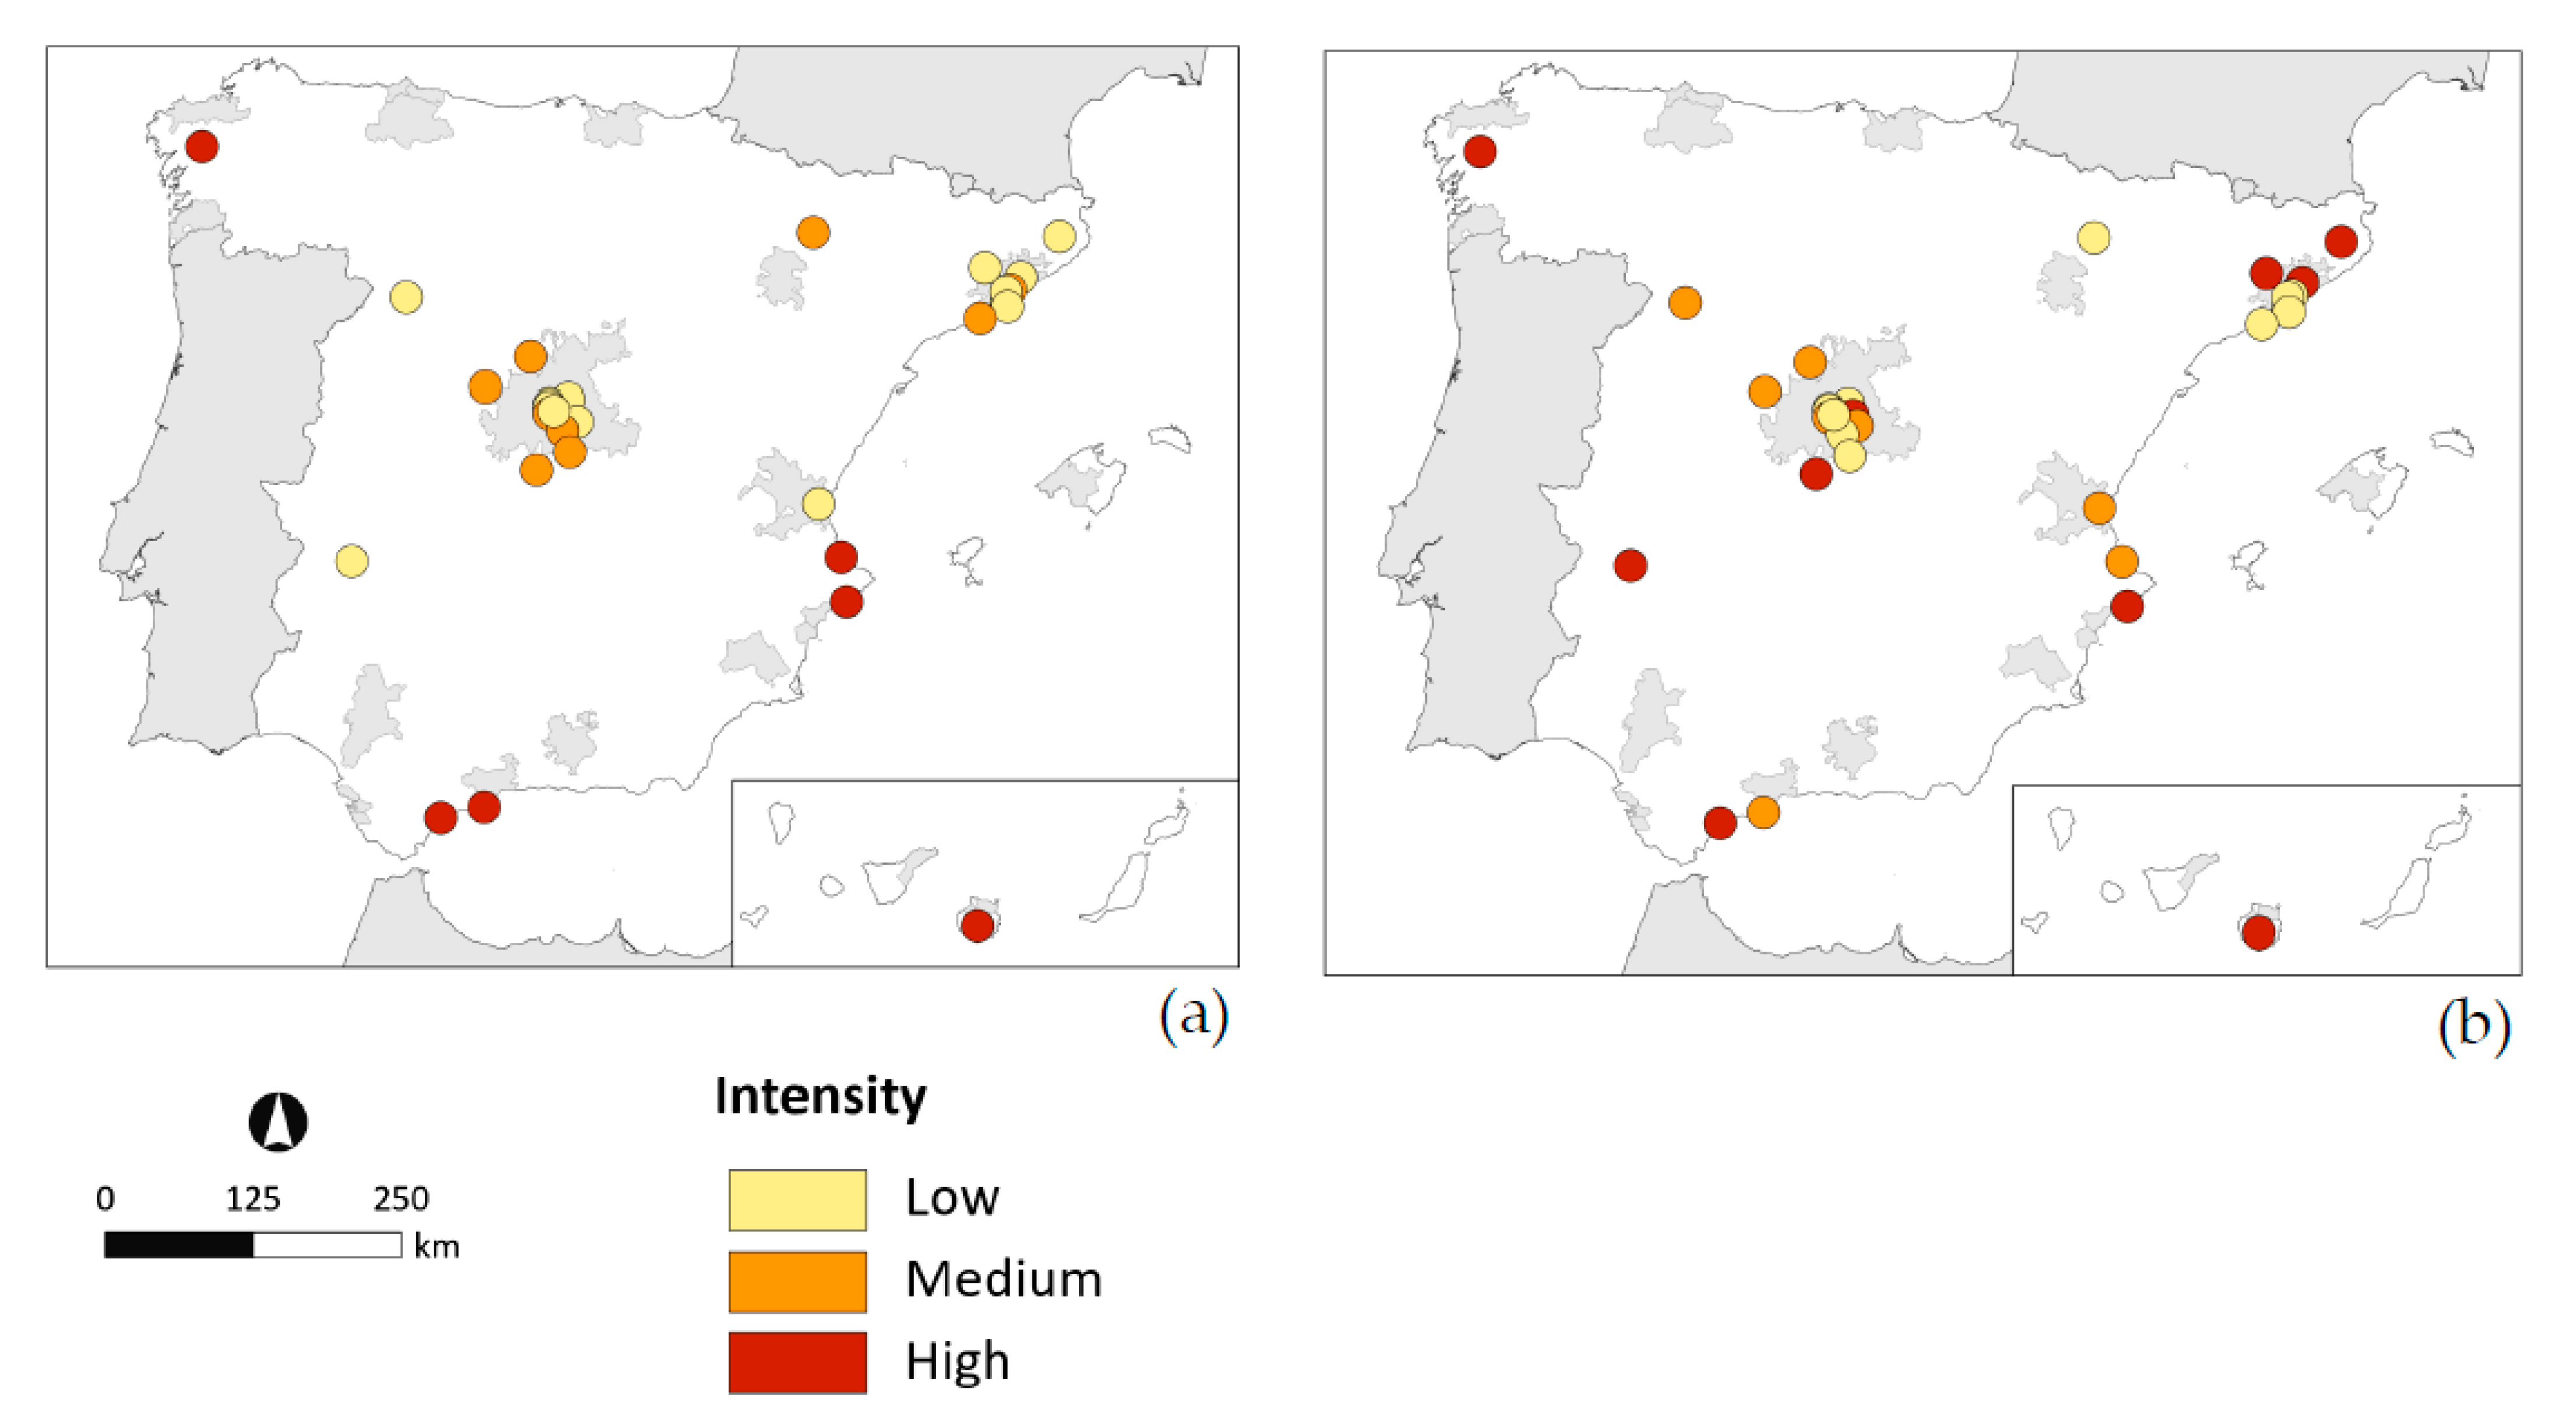
- The index of employment intensity in cultural sectors is based on the score achieved by the cities in Indicator 10 of the CCCM,“‘jobs in arts, culture, and entertainment”, obtained from the number of jobs in arts, culture, and entertainment-related activities including in performing arts, museums, and libraries (NACE Rev. 2, codes 90 and 91), divided by the total population in 2019, then multiplied by 1000. The source of statistics used is that of ‘Affiliates with employment registration’ from the Social Security Treasury (‘Afiliados en alta laboral’, Tesorería de la Seguridad Social). Next, the intensity of employment is calculated and categorized by relating the resulting scores to the mean and standard deviation of all cities, and by categorizing the resulting intensity as follows [24]: ”very high intensity” if the score of the city is above the value of the standard deviation, ”high intensity” if the score is below the value of the standard deviation but above the value of the mean, ”medium intensity” if the score is below the mean value but above the value of the standard deviation (multiplied by −1), and ”low intensity” if the score is below the value of the standard deviation (multiplied by −1).
- (b)
- For the index of overnight tourist stays, we begin with the score achieved by the cities in Indicator 6 of the CCCM, ”fourist overnight stays”, obtained from the total annual number of nights that tourists or guests spent in establishments of tourist accommodation (hotels or similar) in the city in 2018, divided by the total population in 2019. The statistical source used here is the National Statistical Institute (Instituto Nacional de Estadística, or INE). Next, the intensity of tourist activity is calculated and categorized, proceeding as indicated in the case of the intensity of cultural employment.
- (c)
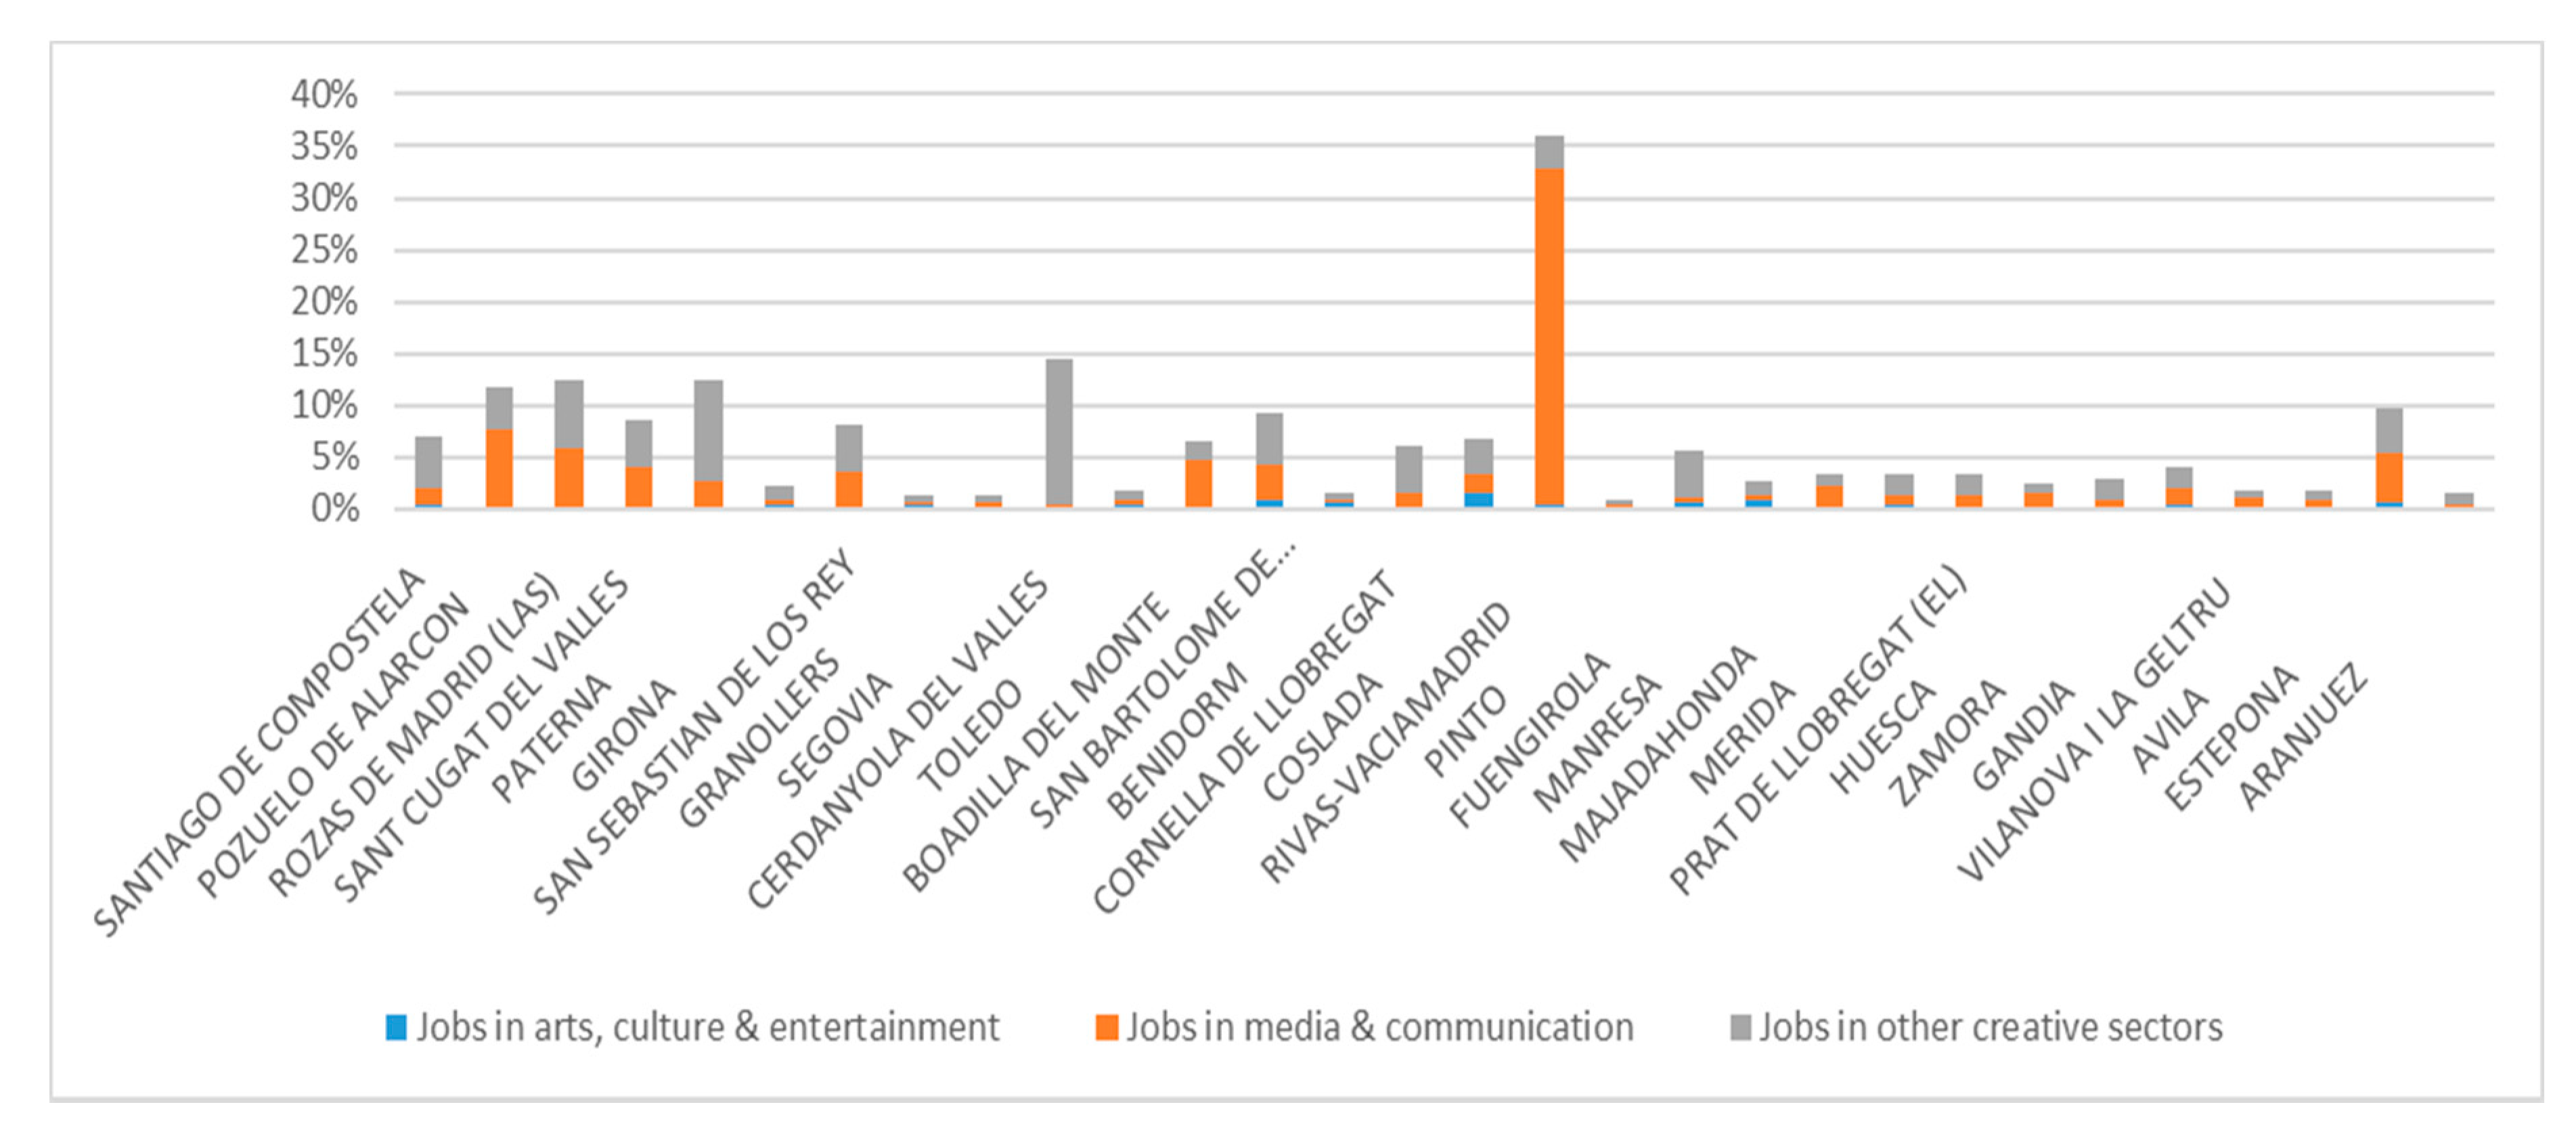
- The index of employment intensity in the media and in sectors related to communication is based on the score of the cities in CCCM Indicator 11, ”jobs in media and communication”, obtained from the number of jobs in media and communication-related activities such as book and music publishing, film and TV production (NACE Rev. 2, 58–60 and 62–63), divided by the total 2019 population, and then multiplied by 1000. The source and the categorization criteria are those indicated for the cultural employment intensity index.
- (d)
- The index of employment intensity in other creative sectors is based on the score of the cities in Indicator 12 of the CCCM, obtained from the “number of jobs in professional, scientific and technical, administrative and support service activities such as architecture, advertising, design, and photographic activities” (NACE Rev. 2, 69–74), divided by the total 2019 population, and then multiplied by 1000. The source and the categorization criteria are those already indicated for the two preceding employment intensity indicators.
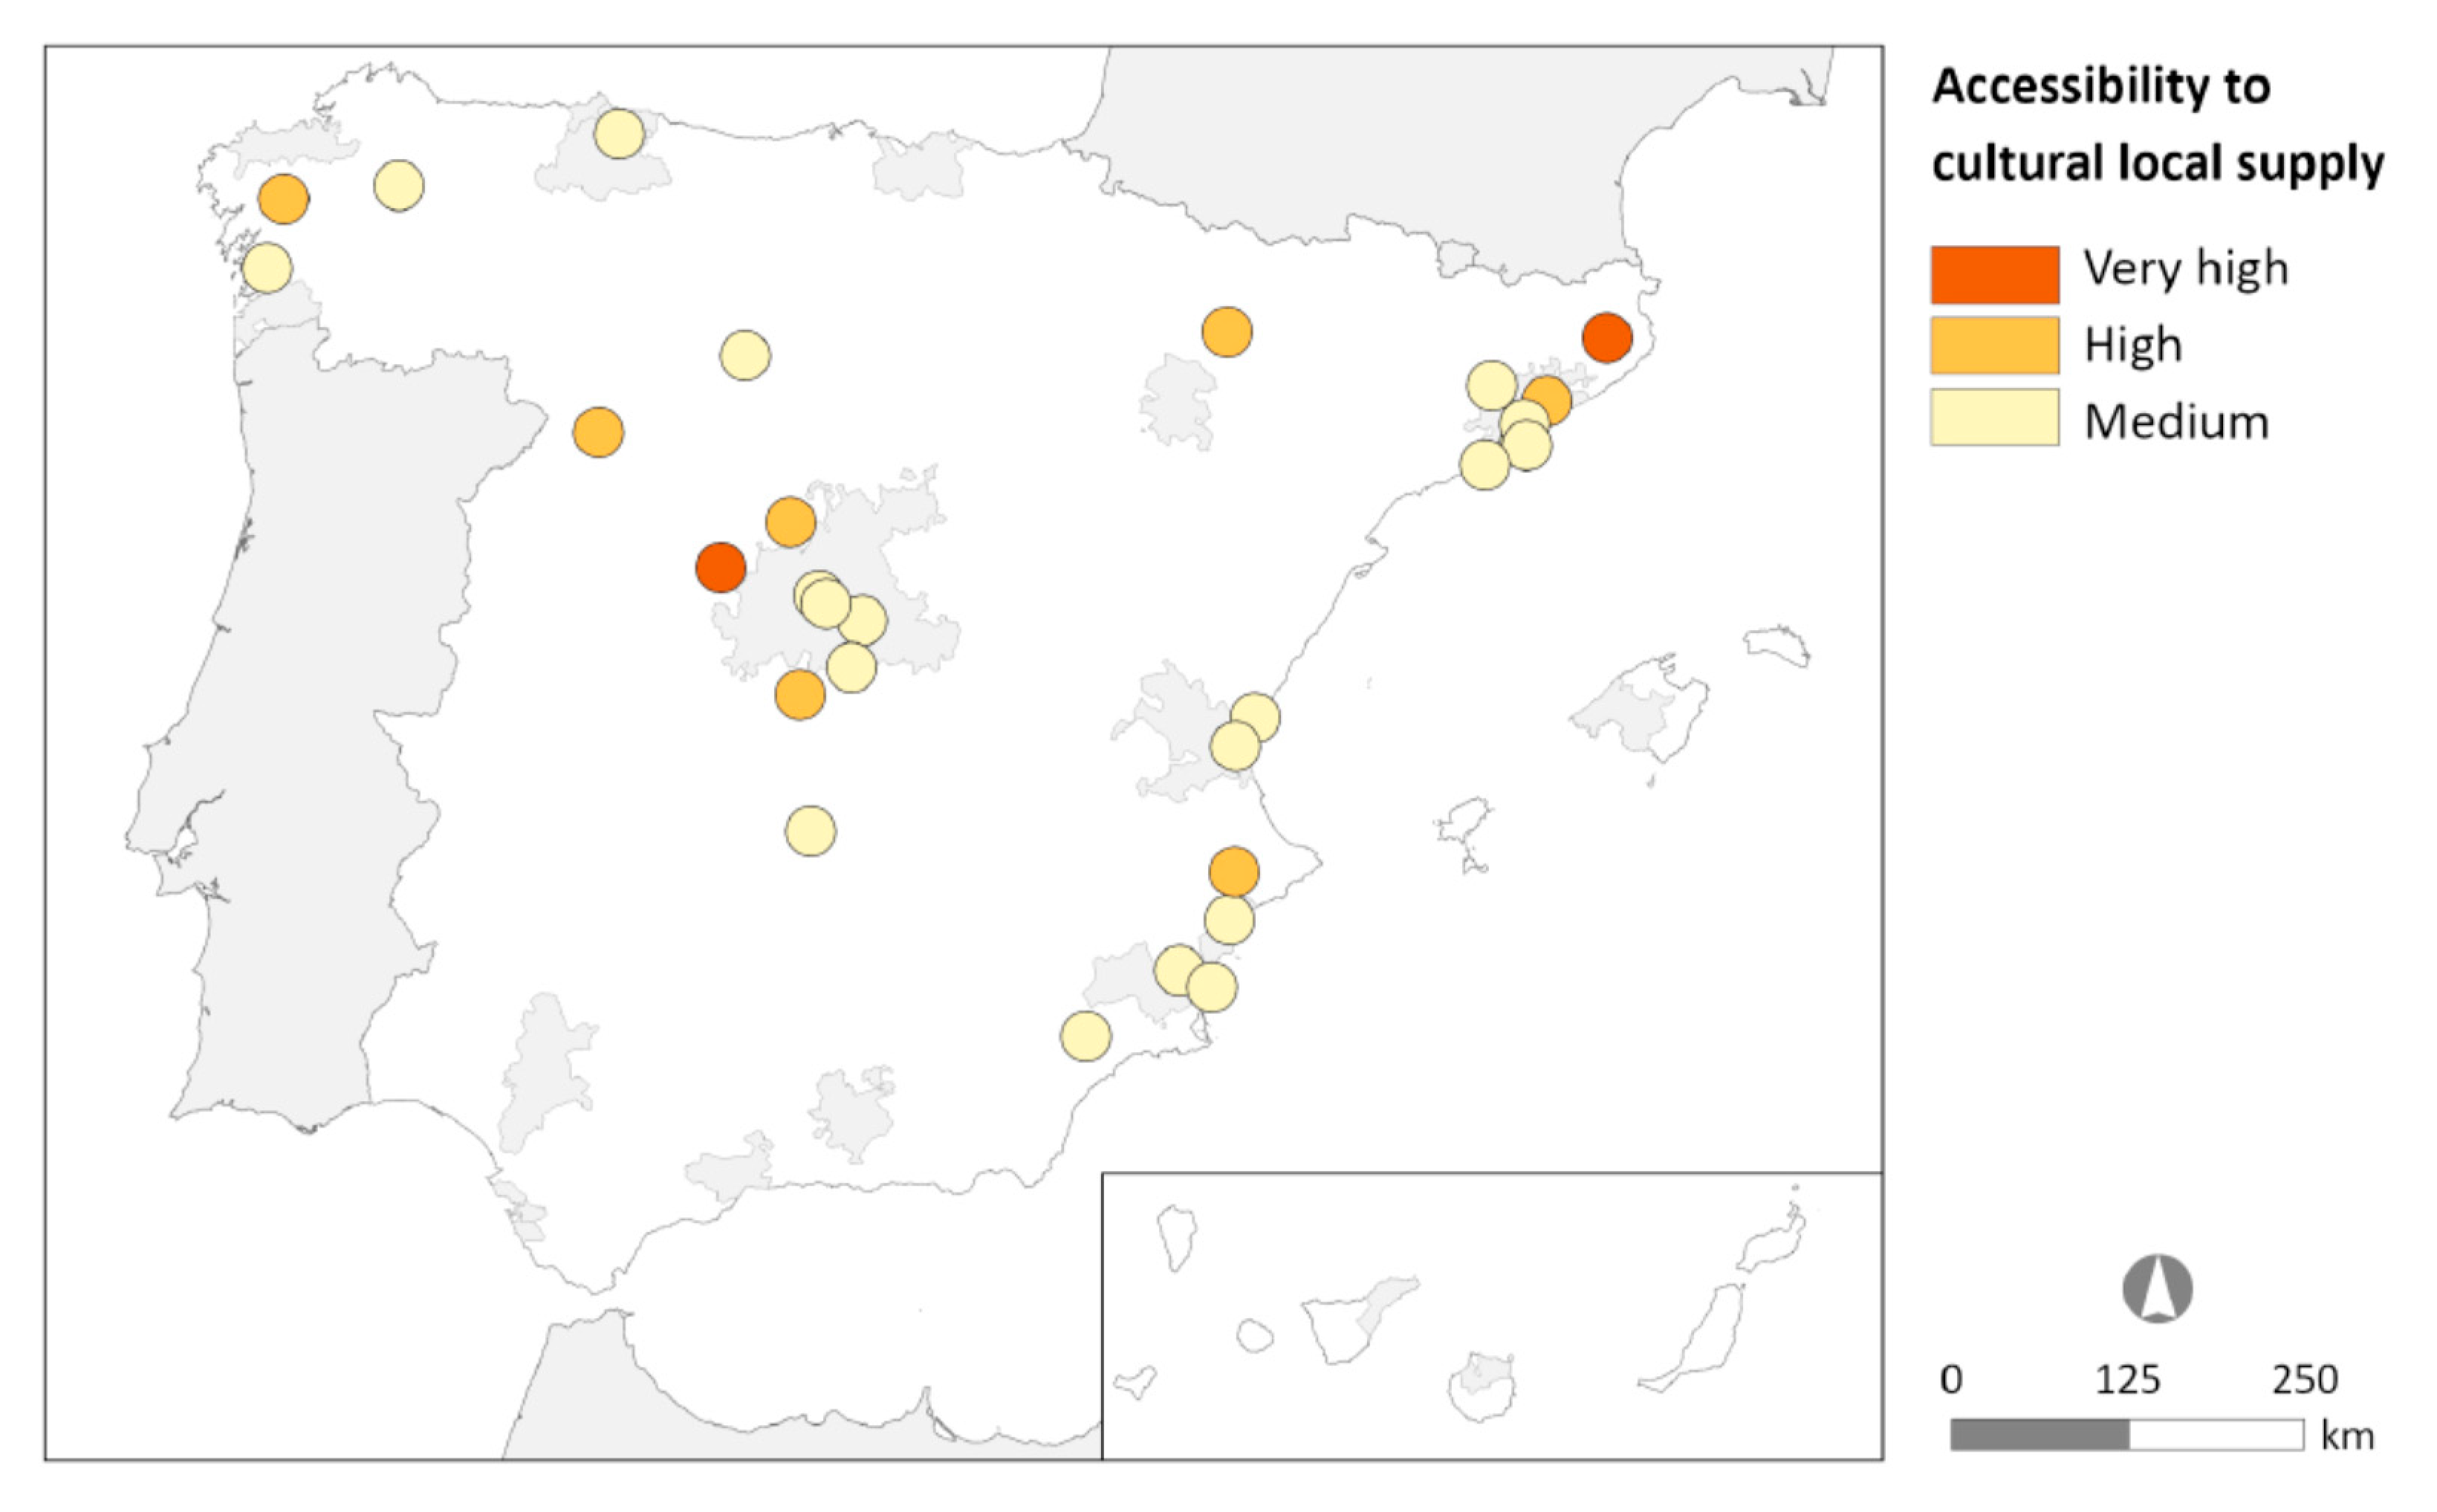
- (e)
- The index of accessibility to the local cultural supply synthesizes the score achieved by the cities in the cultural venues and facilities dimension (itself an integration of diverse expressive indicators of the cultural supply) and in Indicator 27 of the CCCM, “potential road accessibility”, which assesses the population accessible by road within 90 min travel time, as a share of the population within a 120 km radius. Each of the components of the new index has been categorized as explained for the intensity indexes (that is, by relating the individual scores of the cities with the mean and the standard deviation). In this final typology, the following three categories have been established: “very high” for cities included in the high category of cultural venues and facilities and for potential road accessibility; “high” for cities included in the high category in cultural venues and facilities, and medium in terms of potential road accessibility; and “medium high” for medium-category cities according to cultural venues and facilities with high and medium status according to road accessibility.
4. Impact of the Coronavirus Pandemic on the Dynamics, Specializations, and Clustering of the Ecosystems Studied
4.1. The Asymmetric Behavior of Ecosystems, and Its Significance
4.1.1. Diversity in Growth during the Financial Crisis
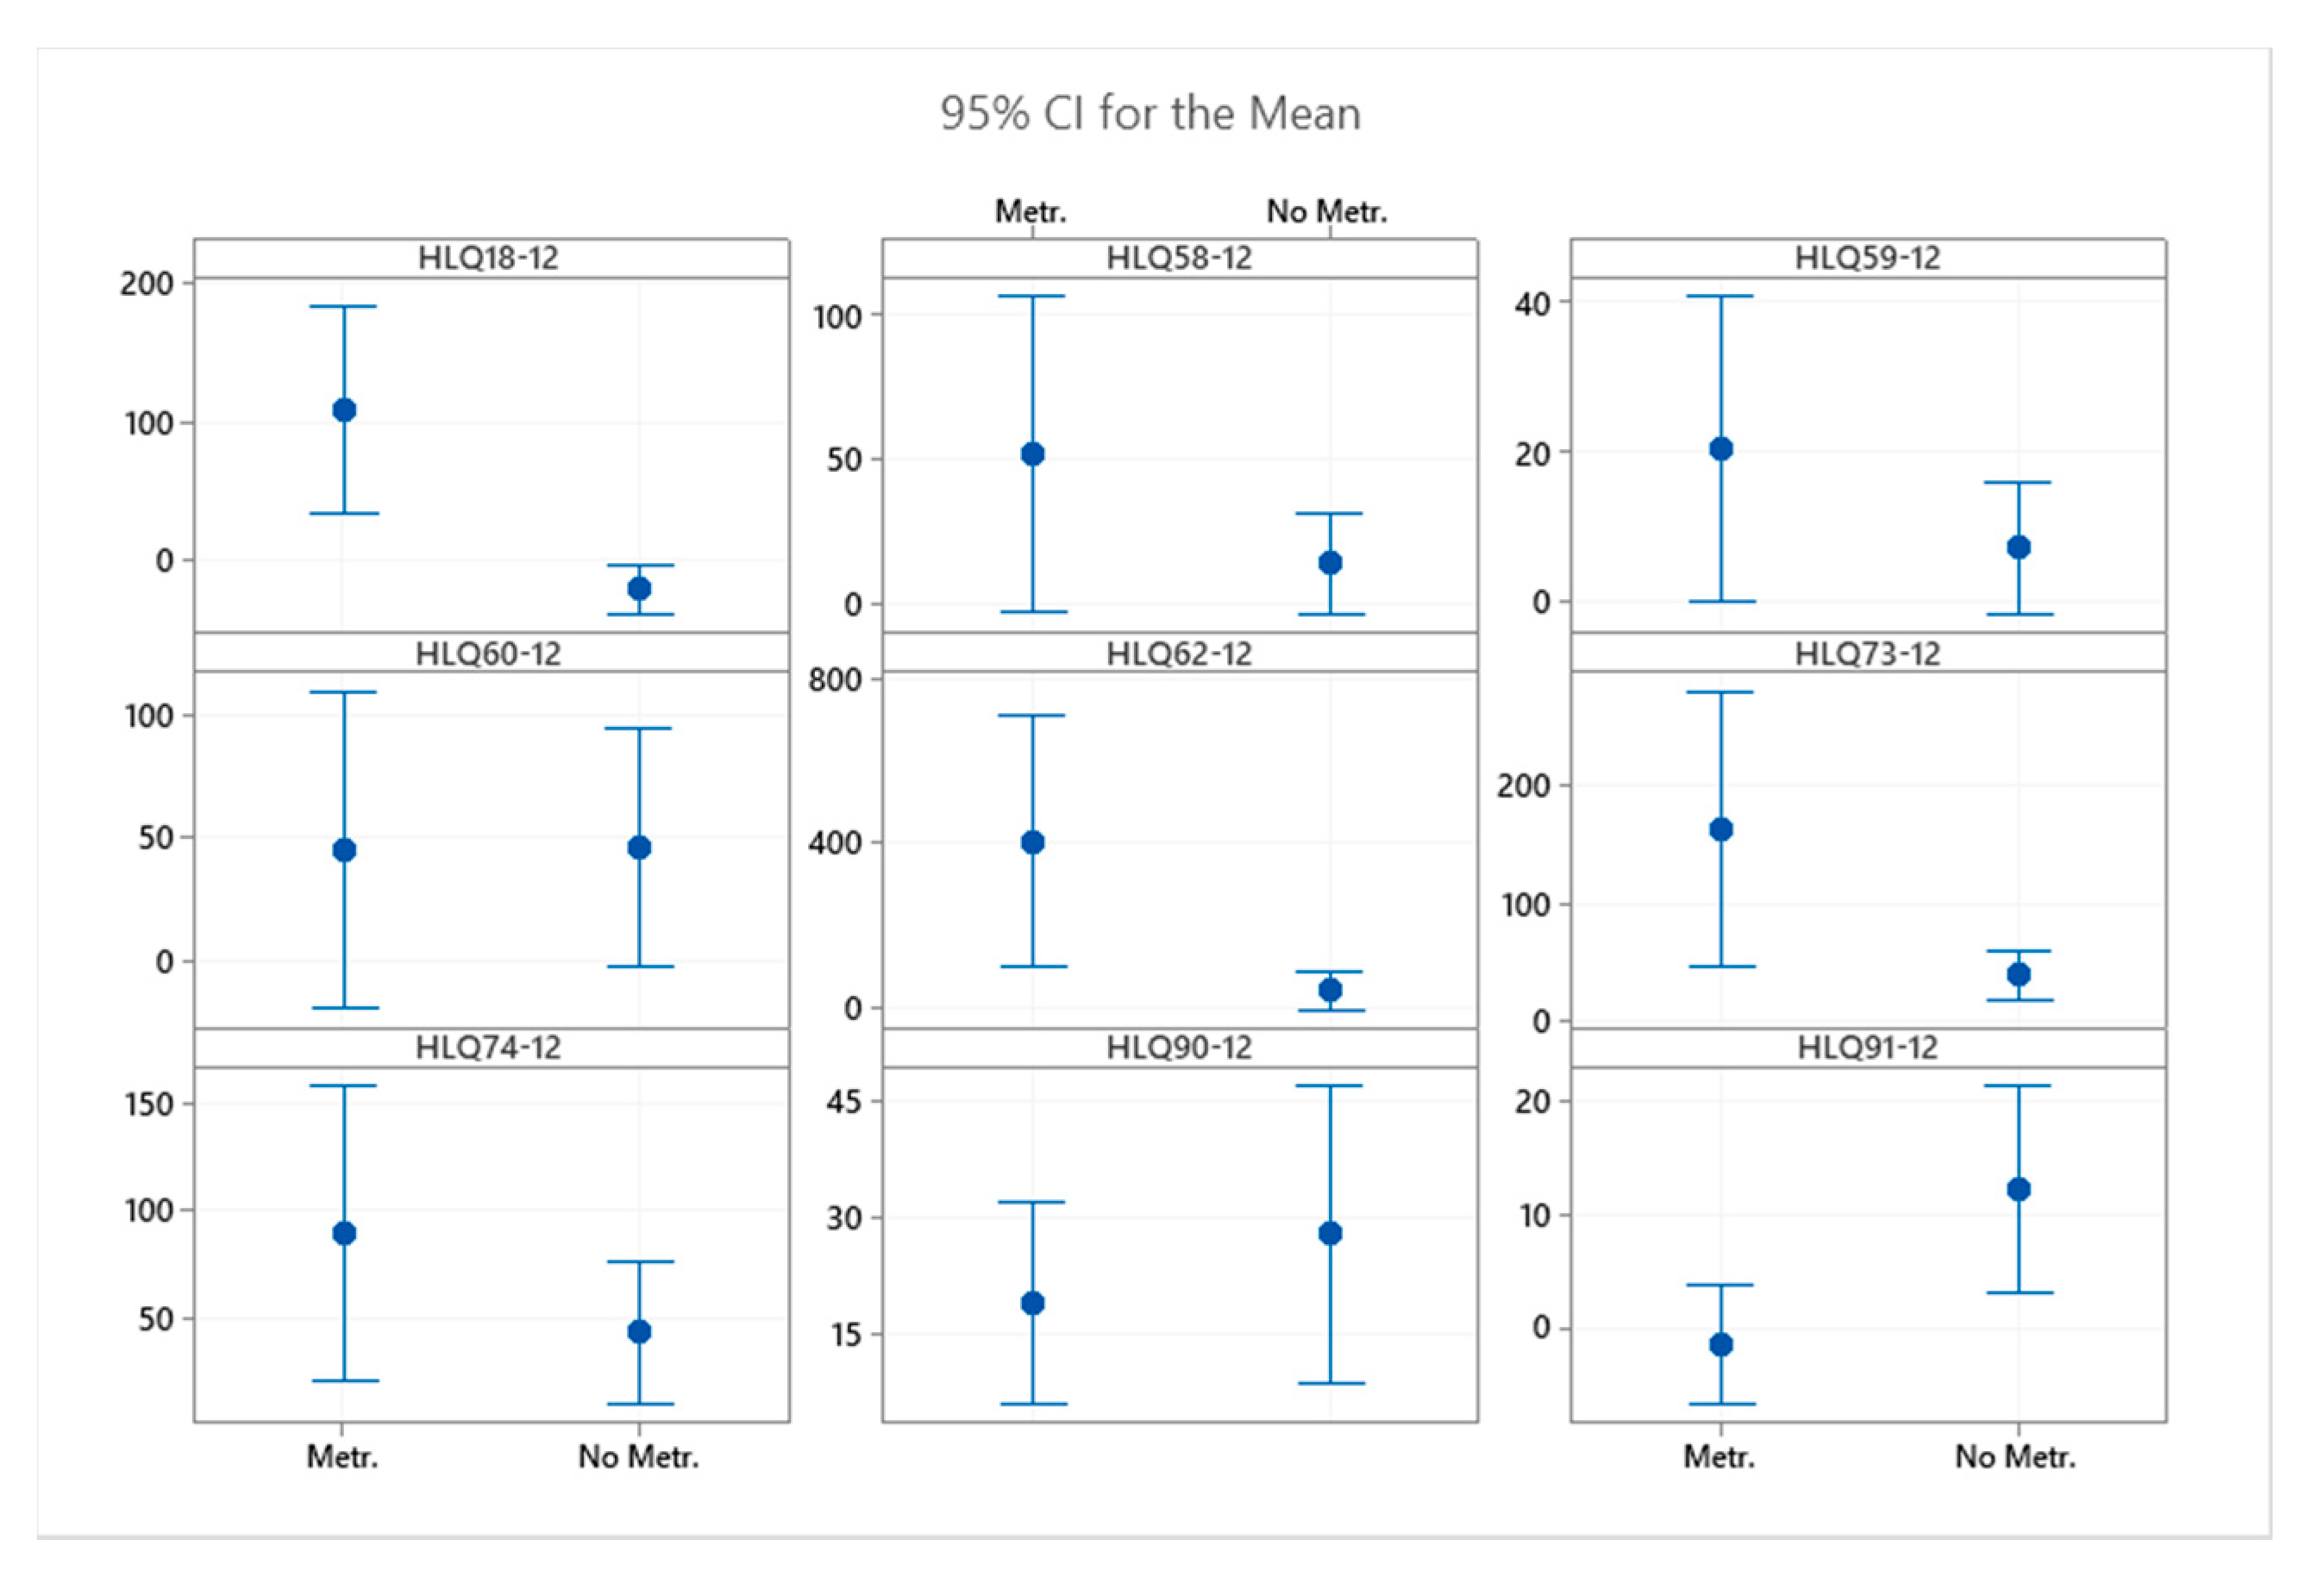
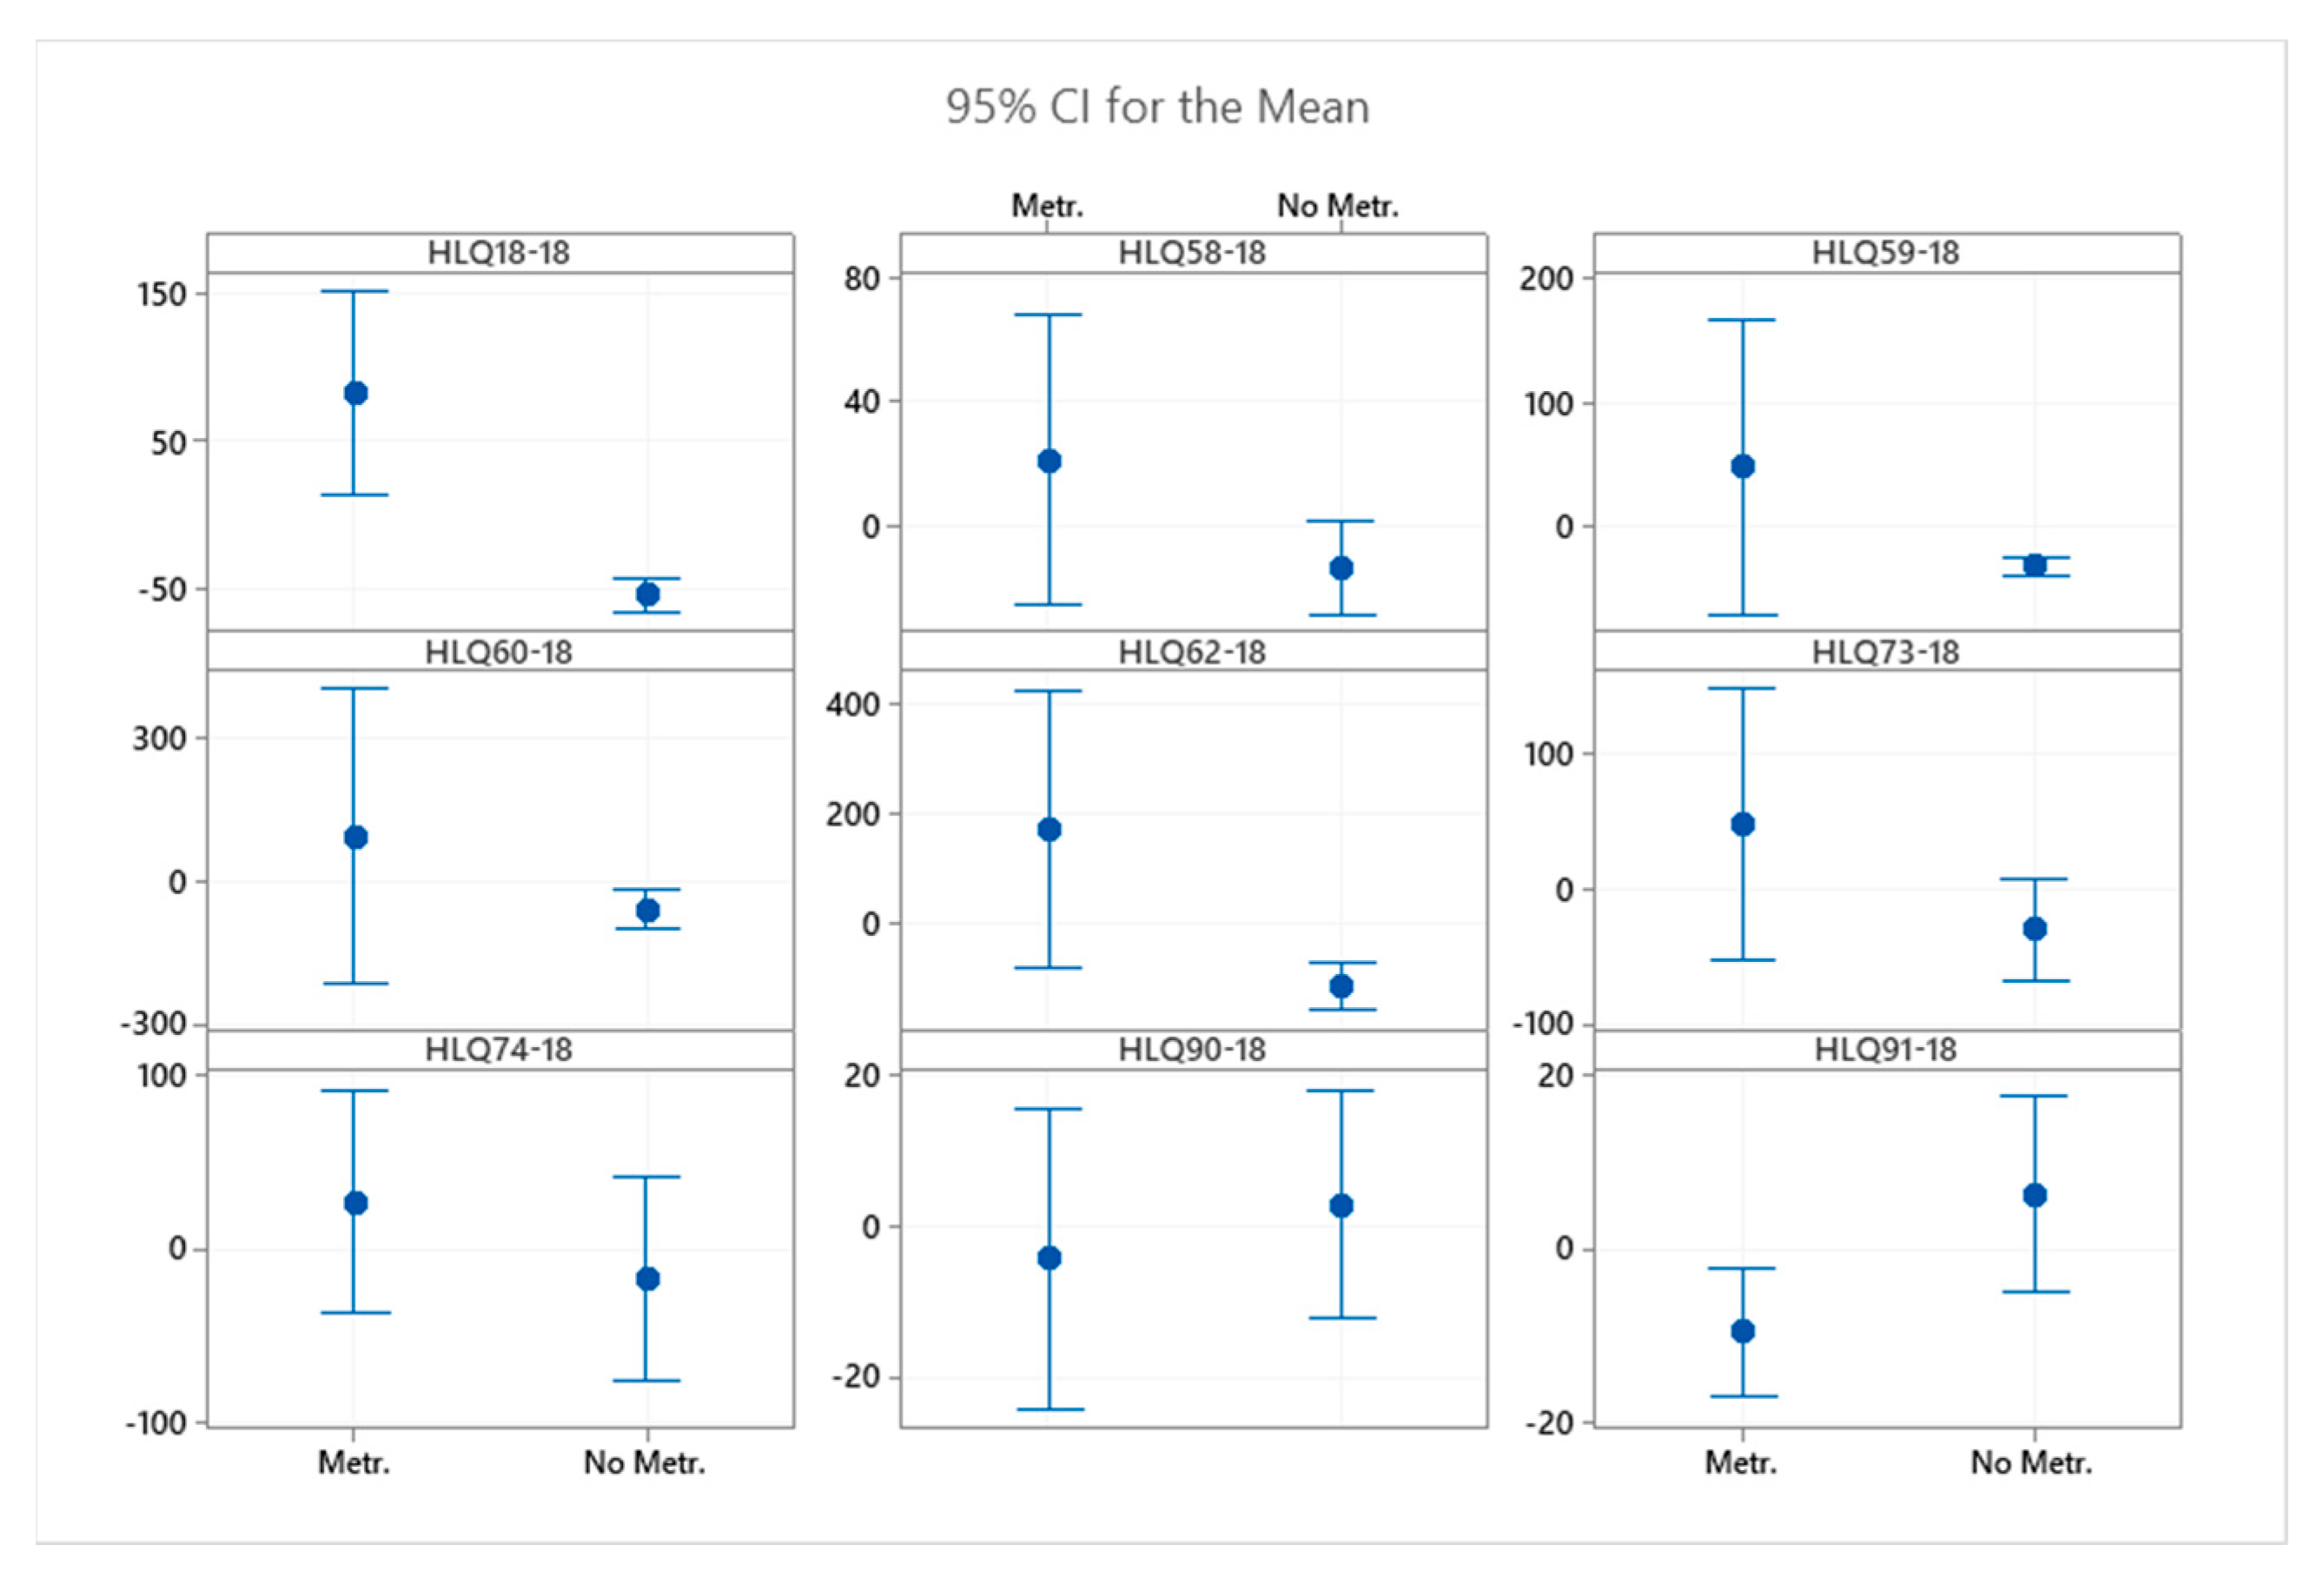
4.1.2. The Asymmetric Behavior of Ecosystems during the Pandemic
4.2. The Specializations of Ecosystems and Their Effects
4.2.1. Variations in Specialization during the Financial Crisis
4.2.2. Maintenance of the Distinctive Cultural and Creative Specializations of Ecosystems during the Post-Pandemic Scenario
4.3. Toward Structural Change in Ecosystems
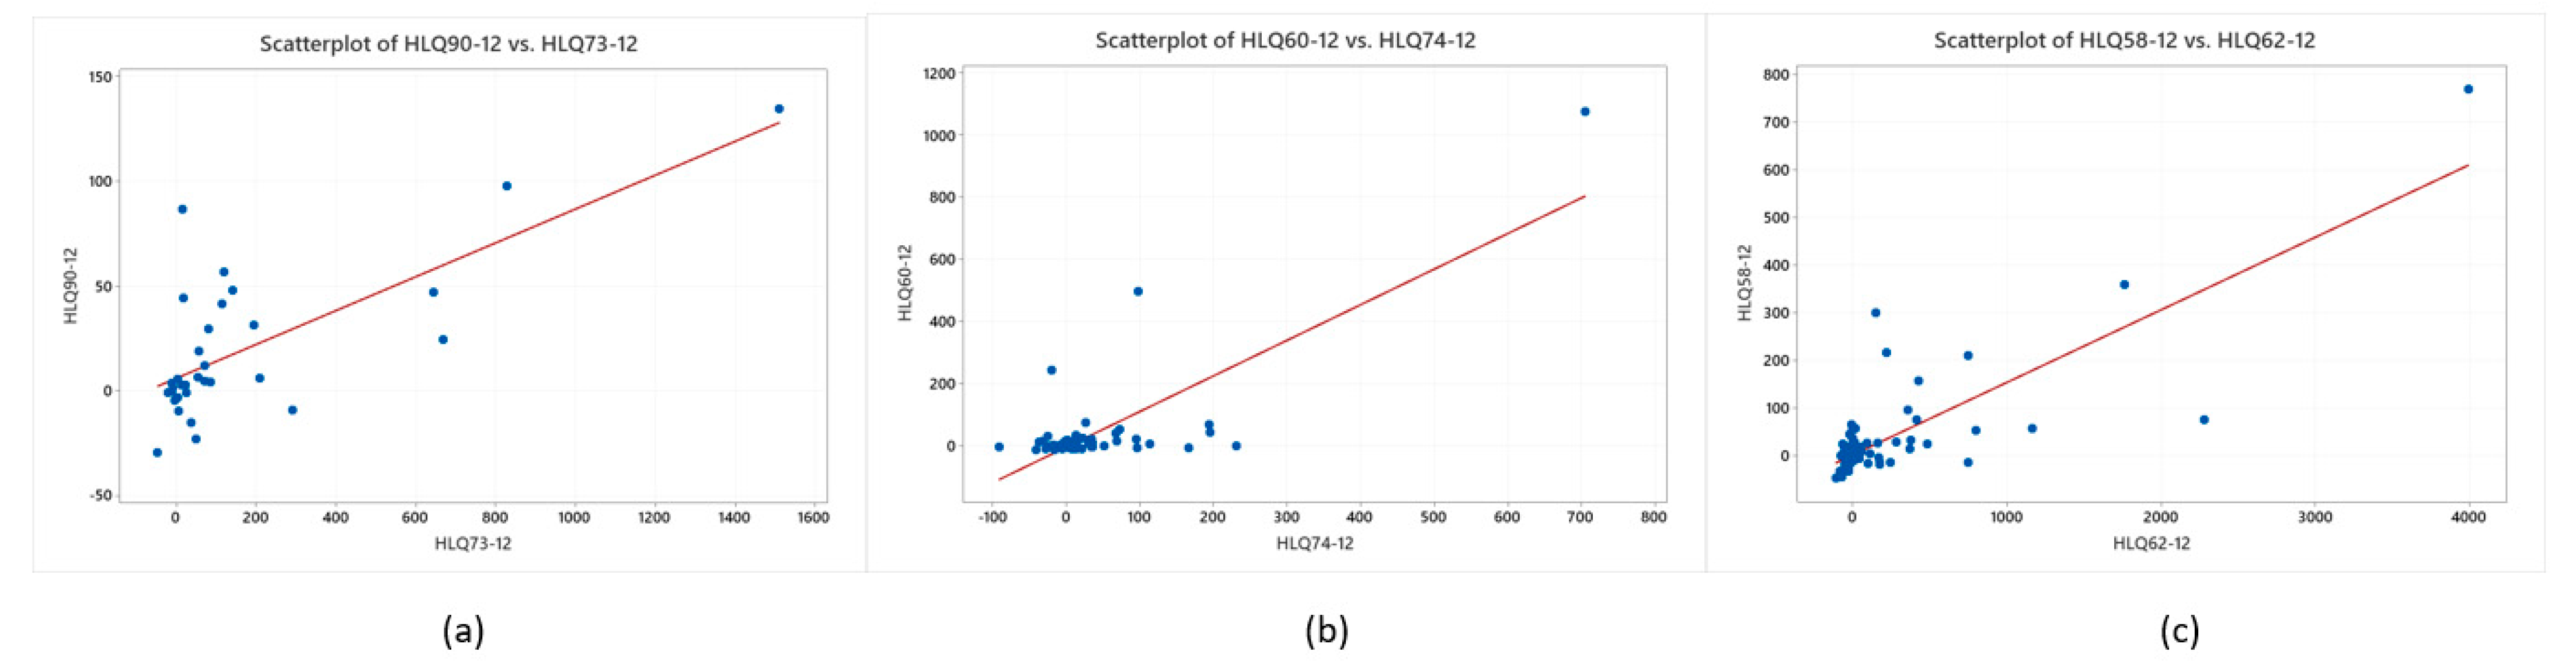
4.3.1. The Decrease in Intersectoral Co-Locations during the Financial Crisis
4.3.2. Toward More Structured, Dense, and Inclusive Ecosystems
5. Conclusions
Author Contributions
Funding
Conflicts of Interest
References
- Magnant, C. EU Cultural and Creative Sectors Policies in Crisis Times. In Presentation of JRC Report ‘European Cultural and Creative Cities in COVID-19 times, European Commission, 7 July 2020. Available online: https://ec.europa.eu/jrc/sites/jrcsh/files/1._catherine_magnant_-_jrc_-_ccis-covid_event-2-ppt-2.pdf (accessed on 22 December 2020).
- Travkina, E.; Sacco, P.L.; Morari, B. Culture Shock: COVID-19 and the Cultural and Creative Sectors, In OECD Responses to Coronavirus (COVID–19), 7 September 2020. Available online: http://www.oecd.org/coronavirus/en/ (accessed on 8 December 2020).
- Rizzo, I.; Throsby, D. Cultural heritage: Economic analysis and public policy. In Handbook of the Economics of Art and Culture, 1st ed.; Ginsburg, V., Throsby, D., Eds.; Elsevier: Amsterdam, The Netherlands, 2006; Volume 1, pp. 983–1016. [Google Scholar] [CrossRef]
- Guiso, L.; Sapienza, P.; Zingales, L. Does culture affect economic outcomes? J. Econ. Perspect. 2006, 20, 23–48. [Google Scholar] [CrossRef] [Green Version]
- Sacco, P.; Ferilli, G.; Blessi, G. Understanding culture-led local development: A critique of alternative theoretical explanations. Urban Stud. 2014, 51, 23–48. [Google Scholar] [CrossRef]
- Gong, H.; Hassink, R. Exploring the clustering of creative industries. Eur. Plan. Stud. 2017, 25, 583–600. [Google Scholar] [CrossRef]
- Lazzeretti, L.; Capone, F.; Innocenti, N.; Boix, R. Exploring the intellectual structure of creative economy research and local economic development: A co-citation analysis. Eur. Plan. Stud. 2017, 25, 1693–1713. [Google Scholar] [CrossRef]
- Stoever, J. On comprehensive wealth, institutional quality and sustainable development-quantifying the effect of institutional quality on sustainability. J. Econ. Behav. Organ. 2012, 81, 794–801. [Google Scholar] [CrossRef]
- Montalto, V.; Tacao Moura, C.J.; Alberti, V.; Panella, F.; Saisana, M. The Cultural and Creative Cities Monitor; European Commission, Joint Research Centre: Ispra, Italy, 2019; p. 114, JRC117336. [Google Scholar] [CrossRef]
- Gross, J.; Heinonen, J.; Burlina, C.; Comunian, R.; Conor, B.; Crociatta, A.; Dent, T.; Guardans, I.; Hytti, U.; Hytönen, K.; et al. Managing Creative Economies as Cultural Eco-Systems. Available online: https://disce.eu/wp-content/uploads/2020/07/DISCE-Policy-Brief-1.pdf?fbclid=IwAR2TksBnPjtTlKciwcurr2X7pyGK4o4Fc3gKVv8A9mYyBNyNyjHfhoqbbdw (accessed on 22 December 2020).
- Gross, J.; Wilson, N. Cultural Democracy: An Ecological and Capabilities Approach. Int. J. Cult. Policy 2018, 26, 328–343. [Google Scholar] [CrossRef]
- Johnson, T.; Raines, N.; Pender, J. Comprehensive wealth accounting: Bridging place-based and people-based measures of wealth. In Rural Wealth Creation, 1st ed.; Pender, J., Johnson, T., Weber, B., Fannin, J., Eds.; Routledge: New York, NY, USA, 2014; pp. 30–54. [Google Scholar]
- Barrado-Timón, D.; Palacios, A.; Hidalgo-Giralt, C. Medium and Small Cities, Culture and the Economy of Culture. A Review of the Approach to the Case of Spain in Light of International Scientific Scholarship. Sustainability 2020, 12, 7321. [Google Scholar] [CrossRef]
- Escalona, A.; Sáez, L.; Sánchez-Valverde, B. Patterns and drivers of cultural economy in Spain’s extra-metropolitan small towns. Investig. Reg. J. Reg. Res. 2017, 38, 27–45. [Google Scholar]
- Escalona, A.; Sáez, L.; Sánchez-Valverde, B. Location conditions for the clustering of creative activities in extra-metropolitan areas: Analysis and evidence from Spain. Appl. Geogr. 2018, 91, 1–9. [Google Scholar] [CrossRef]
- Barrado, D.; Escalona, A.; Escolano, S.; Sánchez, B. Creative clusters outside and within metropolitan areas: A comparative analysis. In Proceedings of the Fifth Global Conference on Economic Geography, Session 97: The Economic Geography of Creative Industries IV, Köln, Germany, 24–28 July 2018. [Google Scholar]
- Barrado, D.; Escalona, A.; Escolano, S.; Sánchez, B. Los clusters de industrias culturales en pequeñas y medianas ciudades intra y extrametropolitanas. In Un análisis comparado, Proceedings of the International Conference on Regional Science, Valencia, Spain, 4–6 July 2018; Hacia un modelo económico más social y sostenible; XLIV Reunión de Estudios Regionales: Valencia, Spain, 2018; Available online: https://www.researchgate.net/publication/330752856_Los_clusters_de_industrias_culturales_en_pequenas_y_medianas_ciudades_intra_y_extrametropolitanas_Un_analisis_comparadodoc (accessed on 22 December 2020).
- Comunian, R.; England, L. Creative and cultural work without filters: Covid-19 and exposed precarity in the creative economy. Cult. Trends 2020, 29, 1–17. [Google Scholar] [CrossRef]
- Pratt, A. A world turned upside down: The cultural economy. In Proceedings of the Cities and the New Austerity, Smart, Creative, Sustainable, Inclusive: Territorial Development Strategies in the Age of Austerity, Regional Studies Association Winter Conference, London, UK, 23 November 2012. [Google Scholar]
- Montalto, V.; Moura, C.J.T.; Langedijk, S.; Saisana, M. Culture counts: An empirical approach to measure the cultural and creative vitality of European cities. Cities 2019, 89, 167–185. [Google Scholar] [CrossRef]
- Escalona-Orcao, A.I.; Escolano-Utrilla, S.; Sánchez-Valverde, B.; Sáez-Pérez, L.; Conejos-Sevillano, A. Creative and cultural ecologies in small cities. Nature, interpretation and evaluation. In Creative Industries Research Frontiers: Seminar Series Seminar 1. Creative and Cultural Ecologies: Mapping and Understanding; King’s College: London, UK, 2020. [Google Scholar]
- Escalona-Orcao, A.I.; Escolano-Utrilla, S.; Sánchez-Valverde, B.; Sáez-Pérez, L.; Conejos-Sevillano, A. Dinamismo creativo y cultural en las pequeñas ciudades. In Proceedings of the Las Actividades Culturales en las Pequeñas y Medianas ciudades, Huesca, Spain, 30–31 January 2020. Unpublished work. [Google Scholar]
- Betzler, D.; Loots, E.; Prokůpek, M.; Marques, L.; Grafenauer, P. COVID-19 and the arts and cultural sectors: Investigating countries’ contextual factors and early policy measures. Int. J. Cult. Policy 2020. [Google Scholar] [CrossRef]
- Montalto, V.; Sacco, P.L.; Alberti, V.; Panella, F.; Saisana, M. European Cultural and Creative Cities in COVID-19 Times. Jobs at Risk and the Policy Response; Office of the European Union: Luxembourg, 2020; p. 33. [Google Scholar]
- Montalto, V.; Tacao Moura, C.J.; Langedijk, S.; Saisana, M. The Cultural and Creative Cities Monitor; European Commission, Joint Research Centre: Ispra, Italy, 2017; p. 114, JRC107331. [Google Scholar] [CrossRef]
- Jackson, M.R.; Kabwasa-Green, F.; Herranz, J. Cultural Vitality in Communities: Interpretation and Indicators, 1st ed.; Culture, Creativity and Communities Program, The Urban Institute: Washington, DC, USA, 2006; p. 99. [Google Scholar] [CrossRef] [Green Version]
- Musterd, S.; Gritsai, O. The creative knowledge city in Europe: Structural conditions and urban policy strategies for competitive cities. Eur. Urban Reg. Stud. 2013, 20, 343–359. [Google Scholar] [CrossRef]
- De Propris, L.; Chapain, C.; Cooke, P.; Macneil, S.; Mateos, M. The Geography of Creativity, 1st ed.; Nesta: London, UK, 2009; p. 80. Available online: https://core.ac.uk/download/pdf/30684522.pdf (accessed on 22 December 2020).
- Alonso, W. Urban zero population growth. Daedalus 1973, 102, 191–206. [Google Scholar]
- Meijers, E.J.; Burger, M.J. Stretching the concept of ‘borrowed size’. Urban Stud. 2017, 54, 269–291. [Google Scholar] [CrossRef]
- Escalona-Orcao, A.I.; Escolano-Utrilla, S.; Sáez-Pérez, L.A.; Sánchez-Valverde García, B. The location of creative clusters in non-metropolitan areas: A methodological proposition. J. Rural Stud. 2016, 45, 112–122. [Google Scholar] [CrossRef] [Green Version]
- Lazzeretti, L.; Boix, R.; Capone, F. Do Creative Industries Cluster? Mapping Creative Local Production Systems in Italy and Spain. Ind. Innov. 2008, 15, 549–567. [Google Scholar] [CrossRef] [Green Version]
- De Propris, L. How are creative industries weathering the crisis? Camb. J. Reg. Econ. Soc. 2012, 6, 23–35. [Google Scholar] [CrossRef]
- Lazzeretti, L.; Capone, F.; Boix, R. Reasons for Clustering of Creative Industries in Italy and Spain. Eur. Plan. Stud. 2012, 20, 1243–1262. [Google Scholar] [CrossRef]
- NESTA. Digital Culture, 1st ed.; NESTA, Arts Council England: London, UK, 2019; Available online: https://media.nesta.org.uk/documents/Digital-Culture-2019.pdf (accessed on 22 December 2020).
- Florida, R.; Seaman, M. Measuring COVID-19’s Devastating Impact on America’s Creative Economy, 1st ed.; Brookings, Metropolitan Policy Program: Washington, DC, USA, 2020; p. 30. Available online: https://www.brookings.edu/wp-content/uploads/2020/08/20200810_Brookingsmetro_Covid19-and-creative-economy_Final.pdf (accessed on 22 December 2020).
- Dubini, P. L’effetto Domino Del Covid-19 Sull’economia Delle Filiere Cultural. Available online: https://agcult.it/a/16656/2020-03-31/sviluppo-sostenibile-l-effetto-domino-del-covid-19-sull-economia-delle-filiere-culturali (accessed on 2 November 2020).
- Pratt, A.C. Beyond resilience: Learning from the cultural economy. Eur. Plan. Stud. 2017, 25, 127–139. [Google Scholar] [CrossRef] [Green Version]
- Fingleton, B.; Camargo Igliori, D.; Moore, B. Employment growth of small high-technology firms and the role of horizontal clustering: Evidence from computing services and R&D in Great Britain, 1991–2000. Urban Stud. 2004, 41, 773–799. [Google Scholar]
- KEA & PPMI. Research for CULT Committee—Culture and Creative Sectors in the European Union-Key Future Developments, Challenges and Opportunities, 1st ed.; European Parliament, Policy Department for Structural and Cohesion Policies: Brussels, Belgium, 2019; p. 101. [Google Scholar]
- Taylor, C. Between culture, policy and industry: Modalities of intermediation in the creative economy. Reg. Stud. 2015, 49, 362–373. [Google Scholar] [CrossRef]


| Characteristic (Source) | Categories | Number of Cities | % |
|---|---|---|---|
| Population (1) | <65,000 | 28 | 34.5 |
| 65,000–80,000 | 29 | 35.8 | |
| >80,000 | 24 | 29.6 | |
| Income per inhabitant (2) | <€10,000 | 33 | 40.7 |
| €10,000–€15,000 | 41 | 50.2 | |
| >€15,000 | 7 | 8.6 | |
| Unemployment level (4) | <10% | 16 | 19.7 |
| 10–20% | 37 | 45.6 | |
| >20% | 28 | 34.5 | |
| Rank (provincial capital) | NO | 66 | 81.4 |
| YES | 15 | 18.5 | |
| Metropolitan location | NO | 49 | 60.4 |
| YES | 32 | 39.5 | |
| Tourist destination | NO | 59 | 72.8 |
| YES | 22 | 22.1 |
| Code | NACE Classification Activities |
|---|---|
| 18 | Printing and reproduction of recorded media |
| 58 | Publishing activities |
| 59 | Motion picture, video and television program production, sound recording, and music publishing activities |
| 60 | Programing and broadcasting activities |
| 62 | Computer programing, consultancy and related activities |
| 73 | Advertising and market research |
| 74 | Other professional, scientific and technical activities, including photographic activities |
| 90 | Creative, arts, and entertainment activities |
| 91 | Libraries, archives, museums, and other cultural activities |
| Code | NACE Classification Activities | Average | Typical Deviation | Coefficient of Variation | |||
|---|---|---|---|---|---|---|---|
| 2012 | 2018 | 2012 | 2018 | 2012 | 2018 | ||
| 18 | Printing and reproduction of recorded media | 122.9 | 92.96 | 151.7 | 139.04 | 1.23 | 1.5 |
| 58 | Publishing activities | 66.9 | 56.88 | 116.9 | 111.79 | 1.75 | 1.97 |
| 59 | Motion picture, video and television program production, sound recording and music publishing activities | 66.9 | 56.88 | 116.9 | 111.79 | 1.75 | 1.97 |
| 60 | Programing and broadcasting activities | 40.4 | 63.22 | 47.5 | 229.41 | 1.18 | 3.63 |
| 62 | Computer programing, consultancy and related activities | 60.3 | 154.83 | 175.5 | 649.85 | 2.91 | 4.2 |
| 73 | Advertising and market research | 260.9 | 220.24 | 586.5 | 493.05 | 2.25 | 2.24 |
| 74 | Other professional, scientific, and technical activities, including photographic activities | 141.6 | 132.48 | 172.7 | 231.66 | 1.22 | 1.75 |
| 90 | Creative, arts, and entertainment activities | 60.1 | 39.26 | 61.1 | 56.16 | 1.02 | 1.43 |
| 91 | Libraries, archives, museums, and other cultural activities | 19.3 | 26.86 | 28.8 | 37.83 | 1.49 | 1.41 |
| All of the creative and cultural sectors considered | 911.2 | 853.91 | 1192 | 1350.12 | 1.3 | 1.58 | |
| All economic sectors | 23,617.1 | 28,615.62 | 11,618.3 | 14,797.48 | 0.5 | 0.52 | |
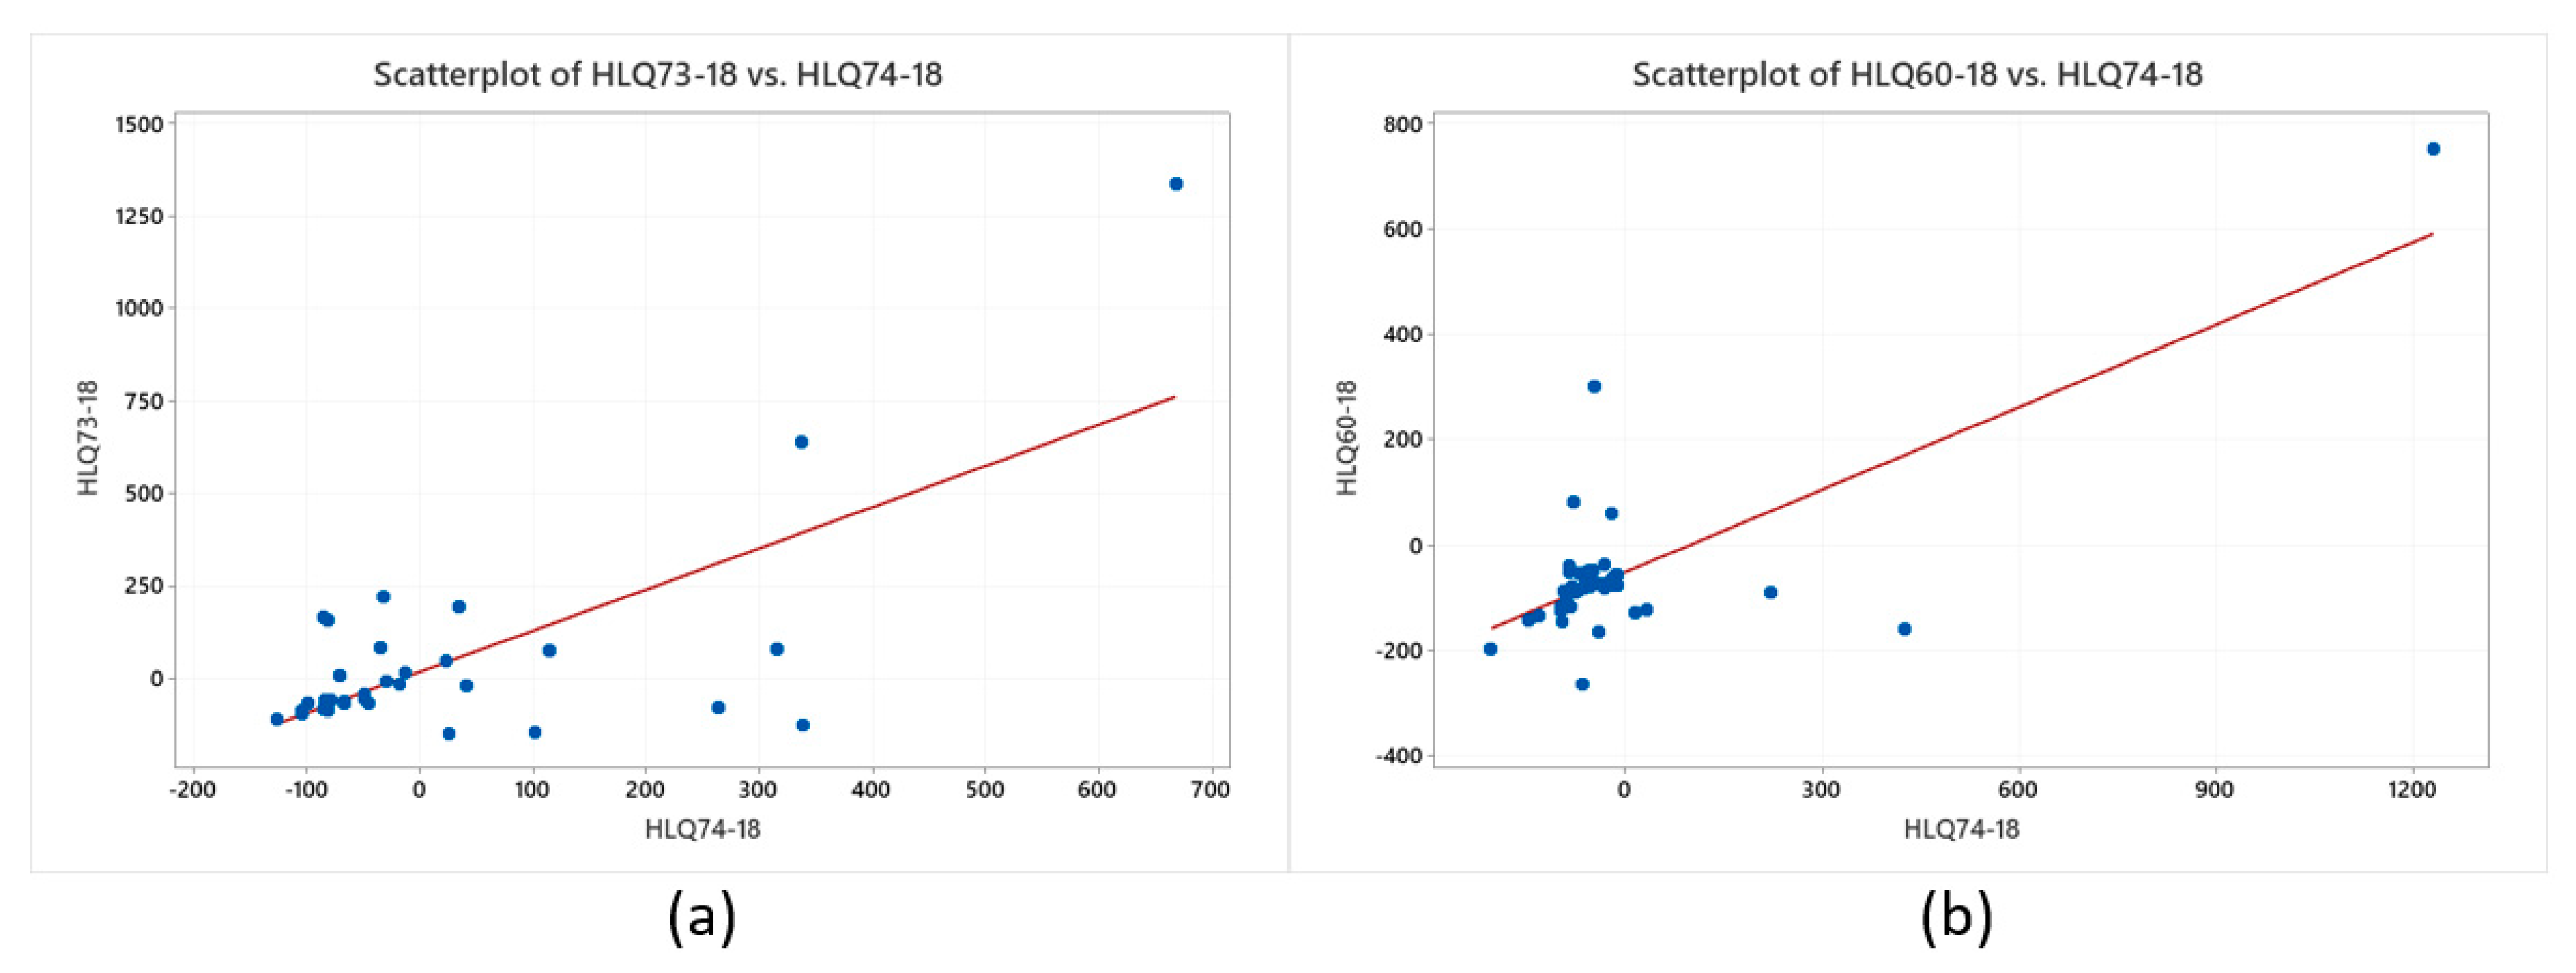
| Correlated Sectors | All Cities | Metropolitan | Non-Metropolitan |
|---|---|---|---|
| 58–62 | (0.811) | (0.856) | |
| 62–73 | (0.744) | (0.757) | |
| 73–74 | (0.737) | (0.880) | |
| 60–73 | (0.715) | ||
| 90–73 | (0.744) | ||
| 62–74 | (0.733) | (0.738) | |
| 60–74 | (0.790) |
| Sector | Municipality Type | Firms (Number) | Jobs (Number) | Economic Profitability | Average Size Per Firm, According to | ||
|---|---|---|---|---|---|---|---|
| Jobs | Assets (Thousands €) | Operating Income (Thousands €) | |||||
| 58 | Metropolitan | 215 | 2231 | 6.64 | 10.38 | 1575.17 | 1296.13 |
| 58 | Non-metropolitan | 192 | 1333 | −0.01 | 6.94 | 654.14 | 563.70 |
| 58 | Total municipalities | 407 | 3564 | 4.84 | 8.76 | 1140.68 | 950.61 |
| 59 | Metropolitan | 269 | 9722 | 1.47 | 36.14 | 14,020.14 | 5512.21 |
| 59 | Non-metropolitan | 168 | 825 | 9.49 | 4.91 | 905.78 | 734.83 |
| 59 | Total municipalities | 437 | 10,547 | 1.78 | 24.14 | 8978.46 | 3675.60 |
| 60 | Metropolitan | 64 | 1755 | 5.94 | 27.42 | 2607.83 | 16,029.17 |
| 60 | Non-metropolitan | 88 | 2244 | −81.85 | 25.50 | 2128.83 | 750.33 |
| 60 | Total municipalities | 152 | 3999 | −2.92 | 26.31 | 12,210.09 | 7183.53 |
| 62 | Metropolitan | 1307 | 34,680 | 4.35 | 26.53 | 2879.30 | 3433.14 |
| 62 | Non-metropolitan | 674 | 3548 | 9.36 | 5.26 | 390.9 | 383.44 |
| 62 | Total municipalities | 1981 | 38,228 | 4.68 | 19.30 | 2032.66 | 2395.53 |
| 74 | Metropolitan | 1015 | 5970 | 3.24 | 5.88 | 1614.27 | 679.43 |
| 74 | Non-metropolitan | 689 | 3704 | 5.36 | 5.38 | 534.82 | 382.00 |
| 74 | Total municipalities | 1704 | 9674 | 3.63 | 5.68 | 1177.80 | 559.17 |
| 90 | Metropolitan | 174 | 671 | 3.20 | 3.86 | 653.46 | 496.61 |
| 90 | Non-metropolitan | 209 | 981 | 6.13 | 4.69 | 329.46 | 313.45 |
| 90 | Total municipalities | 383 | 1652 | 4.30 | 4.31 | 476.66 | 396.66 |
| 91 | Metropolitan | 13 | 40 | −1.69 | 3.08 | 1096.34 | 402.12 |
| 91 | Non-metropolitan | 21 | 407 | 6.92 | 19.38 | 7870.16 | 2349.82 |
| 91 | Total municipalities | 34 | 447 | 6.24 | 13.15 | 5280.17 | 1605.11 |
| All sectors | Metropolitan | 3197 | 56,417 | 4.03 | 17.65 | 3621.01 | 2577.11 |
| Non-metropolitan | 2160 | 13,900 | −5.03 | 6.44 | 649.45 | 462.34 | |
| Total municipalities | 5387 | 70,317 | 3.05 | 13.13 | 2422.84 | 1724.41 | |
Publisher’s Note: MDPI stays neutral with regard to jurisdictional claims in published maps and institutional affiliations. |
© 2020 by the authors. Licensee MDPI, Basel, Switzerland. This article is an open access article distributed under the terms and conditions of the Creative Commons Attribution (CC BY) license (http://creativecommons.org/licenses/by/4.0/).
Share and Cite
Escalona-Orcao, A.; Barrado-Timón, D.A.; Escolano-Utrilla, S.; Sánchez-Valverde, B.; Navarro-Pérez, M.; Pinillos-García, M.; Sáez-Pérez, L.A. Cultural and Creative Ecosystems in Medium-Sized Cities: Evolution in Times of Economic Crisis and Pandemic. Sustainability 2021, 13, 49. https://0-doi-org.brum.beds.ac.uk/10.3390/su13010049
Escalona-Orcao A, Barrado-Timón DA, Escolano-Utrilla S, Sánchez-Valverde B, Navarro-Pérez M, Pinillos-García M, Sáez-Pérez LA. Cultural and Creative Ecosystems in Medium-Sized Cities: Evolution in Times of Economic Crisis and Pandemic. Sustainability. 2021; 13(1):49. https://0-doi-org.brum.beds.ac.uk/10.3390/su13010049
Chicago/Turabian StyleEscalona-Orcao, Ana, Diego A. Barrado-Timón, Severino Escolano-Utrilla, Belén Sánchez-Valverde, Maricruz Navarro-Pérez, Mariola Pinillos-García, and Luis Antonio Sáez-Pérez. 2021. "Cultural and Creative Ecosystems in Medium-Sized Cities: Evolution in Times of Economic Crisis and Pandemic" Sustainability 13, no. 1: 49. https://0-doi-org.brum.beds.ac.uk/10.3390/su13010049