
Increasing Urban Walkability through Citizens’ Participation Processes
by
 , , and
Francesco Scorza
1,* ,
,
Giovanni Fortunato
1 ,
,
Raffaella Carbone
1,
Beniamino Murgante
1 and
and
Piergiuseppe Pontrandolfi
2 1
Laboratory of Urban and Regional Systems Engineering, School of Engineering, University of Basilicata, 85100 Potenza, Italy
2
Department of European and Mediterranean Cultures, University of Basilicata, 85100 Potenza, Italy
*
Author to whom correspondence should be addressed.
Sustainability 2021, 13(11), 5835; https://0-doi-org.brum.beds.ac.uk/10.3390/su13115835
Submission received: 15 March 2021
/
Revised: 20 May 2021
/
Accepted: 20 May 2021
/
Published: 22 May 2021
(This article belongs to the Special Issue Space Syntax and the Sustainable City: Theory, Methods and Applications)
Abstract
:The work is focused on the integration of space syntax analysis (SSA) in a process of participatory planning focused on a neighbourhood scale where the challenge of promoting pedestrian-friendly regeneration process is a bottom-up priority. The promotion of active mobility is one of the main themes of the urban regeneration project CAST operating on the western part of the city of Potenza (capital of the Basilicata region, Italy). Both the state of the art of the case study area and the potential effects of the intervention proposed on the basis of the participatory process have been assessed by SSA as a walkability assessment method. By measuring a street network’s syntactic parameters, it was possible to further enrich the cognitive framework relating to the current situation and to simultaneously evaluate the effects (in terms of potential movement and social usage) deriving from design interventions. The paper presents a methodology to evaluate the urban pedestrian environment and to provide an insight for walking-related intervention and improvements in neighbourhood-scale planning, according to a participatory approach. The research, based on specific local characteristics, represents a transferable approach to supporting and informing policy-makers and designers engaged in inclusive and participative urban regeneration projects.
1. Introduction
A “citizen-centred” participatory framework [1] has helped increase citizens’ awareness concerning the environmental externalities generated by traditional urban mobility organization (based on private and public vehicles) in recent years, as demonstrated by initiatives undertaken at national and international level aimed at reducing the use of private cars, increasing the use of public transport and encouraging walking and cycling [2,3,4]. In fact, urban active mobility helps make cities and communities environmental friendly, healthier and more socially inclusive. The transport sector is responsible for the production of 25% of greenhouse gas (GHG) emissions in the European Union. In particular, urban mobility produces 40% of CO2 emissions in the transport sector [5]. It is clear how action is needed in order to encourage a modal shift in favour of transport modes that guarantee sustainability from environmental, social and economic points of view, such as walking.
By improving physical activity levels of people living in the urban area, walking helps to reduce the number of over-weight and obese people [6] and to prevent diabetes, hypertension and heart diseases [7]. Many remarkable examples of national and urban policies and strategies that aim to prevent chronic diseases through project interventions encouraging walking demonstrated both the feasibility of technical solutions in urban areas and the effectiveness of active mobility shift in improving urban quality of life: the Walkable London (https://www.walkablelondon.co.uk, accessed 10 March 2021), the New Urbanism (http://www.newurbanism.org, accessed 10 March 2021) and the Transportation for America (http://t4america.org, accessed 10 March 2021). Research studies show the close relationship between walkability and health outcomes [8,9,10].
The United Nations (UN) 2030 Agenda for Sustainable Development [11] includes the creation of sustainable cities and communities among its Sustainable Development Goals (SDGs). Additionally, the new urban agenda (NUA) focuses on the need to foster sustainable urban mobility as a safe and affordable public transport mode [12]. Moreover, the NUA highlights the need to promote urban transformation investments by the mean of promoting urban regeneration based on participatory planning ([12] United Nations, 2016).
Urban regeneration projects, aimed at transforming cities and improving people’s quality of life, should combine a definition of sustainable and active (walkable and cyclable) mobility patterns and an approach based on the participation of different stakeholders and inhabitants. In this way, roads could acquire a social function in which users have equal rights and responsibilities [13,14,15]. In fact, roads, urban spaces and squares have been designed primarily from a transport point of view in order to meet the needs of motorized vehicular traffic at the expense of pedestrians and cyclists, i.e., weak users. Therefore, this has negative effects on the public usability of spaces, on quality of life and on health in an urban context.
The Active Citizenship for Sustainable Development of the Territory(CAST) project is an urban regeneration project based on the implementation of Participatory Planning Workshops. The project, promoted in Potenza Municipality by NGO and supported by University and Regional Administration [1], was characterised by the development of innovative and creative activities and processes in urban and territorial planning, and helping to increase citizens’ empowerment. In fact, a characteristic aspect of this “citizen-centred” participatory planning framework has been the integration of traditional participation procedures (street survey-based approaches) with innovative web-assisted procedures and ICT tools in order to improve the management of the relationship between public institution and citizens in policy making processes and to develop “e-democracy” [16]. Inclusive and interdisciplinary “e-participation” model-based experimentation was born from the will of making citizens more informed, aware and responsible, guaranteeing them (who are characterized by different interests and affected by different decisions) the possibility to participate in the government of the territory, from the interactive construction phase of the knowledge framework (integrating collective experience and technical analyses) to the definition of local development projects and urban regeneration policies.
Assuming that technical analyses play a primary role in planning processes, the interaction between different actors helps create a collective and shared knowledge framework, a fundamental condition to concretely introduce a “citizen-based” approach in urban and territorial planning [17,18].
Several papers described the scope and general results of the CAST Project [1,19,20]. Many topics were addressed during the participatory planning workshops: sustainable mobility and accessibility to spatial opportunities, safety, usability of neighbourhood services (such as green areas, equipped parks, schools, neighbourhood centres, public offices, and social centres) and redevelopment and reuse of public areas characterised by both physical and social degradation phenomena. Among the relevant arguments discussed with citizens and stakeholders, the role of active mobility (walking) in a specific neighborhood in the city of Potenza, “Poggio Tre Galli” district, has been analyzed and assessed. In this work, we focused on the issue of “making active mobility a tool to enhance social cohesion”. Such an issue is connected with the values of perceived level of quality of life, urban security and urban healt [7,8,21,22,23,24,25]. The general assumptions are that walking contributes to make urban streets liveable, thus contributing to the creation of sustainable cities with environmental, social and economic benefits [26]. Furthermore, walking encourages social inclusion in an urban context.
This research belongs to the general domain of the “walkability” topic, and we refer to the definition by Leslie, Butterworth and Edwards (2006): “the extent to which characteristics of the built environment and land use may or may not be conductive to residents in the area walking for either leisure, exercise or recreation, to access services, or to travel to work” [27]. Furthermore, there is a close relationship between walking and an urban built environment [28,29].
So, walkability implies a reflection on the quality of urban spaces and on the ability to accommodate and promote pedestrian mobility in urban areas [30,31,32,33,34,35,36,37]. In relation to theories of the capability approach [38,39,40,41] and the “right to the city” [42,43,44,45,46,47], the urban environment and its features determine people’s spatial behaviour and thus the possibilities of choice and action of individuals in an urban context. Identifying and assessing the urban built environment characteristics is a relevant step in order to design interventions encouraging/developing walking and creating a pedestrian-friendly environment.
The analytical contribution of this paper is based on the application of space syntax analysis (SSA) based on graph theory in order to mathematically define and quantify spatial relationships between urban spaces, i.e., their configurational properties. Within urban space morphology research, the use of SSA allows one to investigate spatial configuration and to quantitatively describe the relationship between urban space and people’s movement. According to Hillier (2003) [48], cities’ morphology is strongly characterized by rules oriented to make the physical movement efficient and “intelligible to minds”. So, the city can be considered “as a system of visual distances” [49].
This research contributes to demonstrate how, through the integration of SSA results and participatory process evidence, planners and urban designers acquire extensive information on a built environment‘s syntactic properties based on citizens’ perceptions of public spaces in order to define better urban planning and design strategies for more walkable urban environments, orienting urban policies focusing on people’s needs [50,51].
In the next section, we describe the methodological approach and techniques adopted during the experimentation of the participatory process, while focusing on space syntax theory and the support of ICT tools to encourage the electronic participation (e-participation) of citizens, stakeholders and representatives of public institutions, the dissemination and sharing of information related to the activities of participatory planning workshops. In Section 3, the case study, the CAST project is presented, in particular describing its implementation context, an area located to the north west of the historic centre of the city of Potenza. Section 4 provides results of analyses carried out during inclusive and participatory approach-based workshops. Configurational and quantitative neighbourhood-scale-based analyses of street network supported both the cognitive phase of the territorial context aimed at creating a cognitive framework and the subsequent planning phase, in order to analyze effects deriving from the implementation of the interventions defined according to a shared and inclusive approach. The next section is dedicated to discussing the results of analyses, while including a comparison between the two scenarios: before and after the definition of intervention strategies (consistent with the objectives identified and with the planning tools in force) and the introduction of design solutions. Finally, Section 6 provides conclusions and reflections about the methodological approach, its outputs, future perspectives in urban planning and possible implications for policy-makers.
2. Methodology
Concerning the methodological framework, the research experience includes two levels of content that need to be focused on for the purpose of this paper: the participatory planning approach and the SSA, applied to better understand the current situation of the case study area connectivity and the proposed scenario derived from the proposals discussed both by technicians and citizens’ groups during the workshop. The first is more procedural and reports detail of participatory process management together with supporting tools adopted; the second is quantitative and includes technical details of the space syntax framework characterizing the application.
2.1. The Methodological Approach and the Adopted Partipatory Planning Techniques
The experimentation of a “citizen-centred” participatory process has envisaged the definition of street-auditing-based inclusive walkability assessment method developed during participatory workshop in order to create a cognitive framework of the study area. The workshop (Figure 1) was characterized by the integration of two different methodological approaches: street survey and e-tools. The first involved a small group of people and stakeholders who knew the study area and its characteristics, including experts, neighborhood representatives, organizations and associations. The second approach, more innovative than the previous one, was based on a wider public participation through the use of information technologies and social networks.
The first phase of the workshop consisted of territorial knowledge of the study area that was acquired through street auditing tools: photographic surveys, site inspections and qualitative thematic cards. Moreover, the interaction between different participants and the sharing of their information were two relevant steps [20]. Street surveys have revealed people’s perception of the built environment, since the participants have been given the opportunity to judge the current walking environment. Focus groups and neighborhood scale-based walks are the main techniques adopted in this phase to deepen a specific topic, engage in discussions to produce ideas and proposals in relation to the problems identified in a shared and collaborative way and verify directly some situations, thus helping to expand the framework of built knowledge. This activity was supported by the use of “mapping tools”, such as Google Earth and Google Maps, in order to locate and share with citizens the spatial features discussed in the workshop.
This traditional approach to the construction of the cognitive framework was integrated by the use of “social tools”, i.e., online questionnaires and social networks, such as Twitter, which allowed several users to report positive and negative elements of the area.
During the experimentation process, citizens have contributed to enriching technical analyses presented. From the discussion of their results, citizens recognised negative and positive situations present in the analyzed urban environment and identified the aspects to be addressed, avoided, reused and transformed.
A participatory walkability assessment framework has been developed to define interventions by involving the main stakeholders during the workshop.
To analyze the structure of the road network and pedestrian paths in the area, SSA was used. It allows one to mathematically define spatial relationships between urban spaces by using graph theory. In the case study, space syntax techniques were used to integrate, in a first phase, the analyzes of the current state previously carried out and, in a second phase, to understand how it is possible to intervene in the pedestrian network, thus optimizing design interventions. Based on data collected, thematic maps were elaborated and the problem tree and the objective tree were defined according to the logical framework approach procedure [52,53,54,55]. Then, they were discussed in subsequent workshop meetings in order to define strategies to be adopted in the formulation of the urban regeneration project of the area.
In this phase, the techniques of the space syntax theory and the calculation of its indexes made it possible to evaluate the effects on walkability deriving from the implementation of design strategies that were established in a shared way during the participatory workshop.
2.2. Space Syntax Theory
SSA developed by Bill Hillier since the 1980 [56] is based on the use of graph theory’s techniques that are able to measure the effects of the spatial configuration on physical properties of the street network [57,58]. SSA is based on three assumptions: urban space structure influences phenomena that take place on it, perceptual appreciation of space influences behavioural choices in it and the grid of urban paths is considered as a constitutive structure of urban space. In particular, within urban space morphology, this theory recognises the way in which spatial units (such as street segments) are articulated and mutually arranged (being a quantitative and configurational method of analysis), and the essential reasons for social phenomena (communities’ cohesion, social segregation and economic and social opportunities) that take place in them, to be able to interpret and understand them. In fact, there is a relationship between a mathematical model of the spatial structure and the social behaviour that characterises its use by people. Space syntax allows one to interpret and understand the internal structure of a settlement aggregate and to simulate potential effects of design transformations on spatial system variables and their social forms, thus providing a valuable tool in supporting planning activities. Within space morphology research, this quantitative and configurational approach reveals “the hidden role of geometry in cities” [59]. Through Space Syntax techniques, it is possible to model the real-world road network as a graph, whose nodes are the road lines, in order to carry out a quantitative analysis of the spatial system that calculates how each space unit is connected with the others. Therefore, the axial map analysis allows one to quantify the topological distance between each pair of nodes in the network in terms of number of changes of direction, and in terms of “axial steps”, thus capturing both spatial structure and the cognitive character of all types of urban spaces. The syntactic representation of real-world spaces, including 2D spatial analysis techniques, is based on the construction of the axial map. “An axial map is the minimal set of axial lines such that the set taken together fully surveils the system, and that every axial line that may connect two otherwise unconnected lines is included” [60]. So, taking into account cognitive rules that govern the use of space, all directly accessible and visible urban spaces defined by built form are represented by a set of intersecting axial lines. The axial map “basically captures the cognitive accessibility in movement space in terms of directionality. With the axial map it is possible to quantitatively measure distance in number of changes in direction, in terms of ‘axial steps’” [61]. The primal representation of axial lines, i.e., axial map, is transformed into connectivity dual graph by switching edges for urban streets. In fact, the nodes are the axial lines, and the junctions between them are represented as links in the axial graph. Therefore, a one-to-one relation between the ‘‘axial map’’ and the dual ‘‘graph representation’’ is created in order to perform the syntactic analysis of the network, thus quantifying topological measures that explain its configurational properties. It consists of measuring the topological distance from each node (axial line) to each other node of the graph. Specifically, a “step” from one line to another corresponds to a topological distance of 1 in the axial graph.
To quantify the relationships between spaces and analyze the spatial configuration of the network, space syntax techniques, based on mathematical graph theory, allow one to compute three topological measures: connectivity, integration (mathematical measure of closeness) and choice (mathematical betweenness) (see Figure 2).
By performing the analysis of the urban street network, integration indicates the level of accessibility of a line-street within the network and choice measures how important line-street is as a “through-street” for the network. So, integration and choice are network centrality measures capturing, respectively, the potential “to-movement” and the potential “through-movement” of each line of the network that has been modeled and described through the axial map analysis. In this regard, Hillier (1999) [59] writes: “centrality is clearly not simply a state, but a process with both spatial and functional aspects”.
Connectivity measures the number of spaces that are connected directly to space considered as origin. So, axial connectivity represents the number of other lines with which an axial line (origin) intersects within a network. A high value of this parameter indicates that examined line is potentially characterised by access movements to (or from) a large number of other network lines. According with Saelens et al. [62], streets’ connectivity and destinations’ proximity are two key physical attributes of residential neighborhoods that can positively influence pedestrian mobility leading to more frequent walking trips. In particular, connectivity is determined by grid patterns of interconnecting streets.
Integration (mathematical measure of closeness) is a measure of distance from any space of origin to all the others in a system-network, thus calculating how close the origin space is to all others. It can be considered as a measure of network centrality representing topological network accessibility of a unit from all others units within a certain spatial system. To obtain integration, we use a topological distance, “depth”, taking into account the change in direction, i.e., step or turn, between each axial line (dual graph G vertex) and all the others. Total depth (TDi), i.e., the sum of all depths from a certain origin unit space, is computed as follows:
where dij is the number of syntactic steps between unit space (vertex) i and j, and n is the total number of unit spaces in the dual graph G.
Within the spatial system, mean depth (MDi) of the graph is calculated as:
To make the measurement of depth comparable between local and global structures within the same graph, the concept of relative asymmetry (RAi) is introduced. It is a normalization of the graph depth measure that compares actual axial line’s mean depth with the theoretical highest (max(MD) = n/2) and lowest (min(MD) = 1) values that mean depth could have in the graph.
To enable a comparison between graphs of different sizes that influence the accessibility measures of unit spaces, real relative asymmetry (RRAi) is computed by normalizing RA values by the Dn-Value, i.e., the RA of the root of a “diamond-shape” graph of the same number of n vertices [63], while making them independent from the size of the spatial system.
To quantify the topological network accessibility of a space unit (a street represented by a vertex in a dual graph) from all other spaces within a spatial system, space syntax-based integration (or closeness centrality) is computed as follows:
To define the degree to which a graph vertex is integrated or segregated from the spatial system, integration might be calculated for the whole graph G containing n vertices (global integration), or for a partial system containing a number of neighboring vertices within a certain graph distance (topological radius), i.e., a predefined number of steps (e.g., three steps), from each vertex (local integration). Generally, radius 3 (a lower depth of connectivity) is used to measure local integration: spaces that are three depths away from each graph vertex (origin) are considered in the axialanalysis.
Integration provides quantitative information about a defined spatial unit (street-line): its ease of being reached by others in the space system, i.e., its potential to attract movement and to be a relevant destination, while having potentially greater social co-presence (where social interactions would be more intense). High integration means that the space unit is easy to reach from a topological point of view and therefore it is “integrated”. In SSA, the city is considered a dynamic system whose evolution is based on a continuous iterative feedback loop between centrality (spatial configuration), movement and land use [64].
The betweenness centrality, defined as choice in space syntax terms, measures how likely an axial line, i.e., graph vertex, is to be passed through on all shortest paths from all spaces to all other spaces in a graph G within a predetermined topological distance (number of steps) from each line. Thus, it is possible to quantitatively know how often an axial line lies on the shortest topological paths between any pair of axial lines. As with integration, choice can be defined based on the whole system (global choice) as well as at a local level (local choice). Choice allows one to quantify the “through-movement” potential of a given line in a network. In mathematical terms, according to Freeman (1977) [65], betweenness centrality (CB(Pi)) is defined in network theory as “the weighted frequency a point falls in the shortest path between all origins and destinations in a given system”:
where gjk(pi) is the number of shortest topological paths between node pj and node pk (which contains node pi) and gjk is the number of all paths between pj and pk in a graph G. Therefore, the lower the choice values, the longer the topological paths when moving from the origin to the destination in a network.
3. Case Study: “Poggio Tre Galli” Neighborhood and the CAST Project
The theme of walkability was faced during the participatory processes of the project CAST aimed at defining an urban regeneration project, in an area located in the western part of the city of Potenza. Since it includes the experimentation of creative and innovative activities, the project has been selected within a call relating to these themes launched by the Basilicata Region [1,66]. The experimentation of the participatory process characterizing the project CAST was based on the organization of a participatory planning workshop that took place in the area interested by urban regeneration project. It includes (Figure 3) “Poggio Tre Galli”, “G area” and “Study Centre” districts. The participatory process involved several stakeholders: cultural associations, citizens, some decision makers and technical staff of Potenza municipality, and volunteers [51]. Moreover, the participatory planning workshop was an example of implementation of forms of inclusive smart planning, since it was supported by ICT tools, thus attracting the interest of the local community and public administration [67,68,69,70,71,72,73,74].
Various experiences of participatory processes have been developed in Potenza, the capital of Basilicata region, Southern Italy, and in neighboring towns. Most of these have been directly incentivized by citizens with a bottom-up approach [71,72,73,74] and in other cases promoted by local authorities [75].
The Implementation Context of the Workshop
The case study is located in the West urban area of the city of Potenza, the County Seat of the Basilicata region, located in the mountains (900m above sea level), with about 67,000 inhabitants (inhab.) and a density of 382.6 inhab./km2. It has a density of pedestrian areas equal to 9.1 m2 per inhabitant, while the national average for the sample of provincial capitals is 33.4 m2 per inhabitant. The transport sector with 48% is the main responsible for urban energy consumption: 94% of the transport sector energy consumption is due to the use of private motorized vehicles, in particular private cars. In fact, Potenza with 73.93 vehicles/100 inhab. is the fourth Italian city by “motorization index of cars” [76]. Moreover, the city of Potenza is characterised by fragmented settlement [77,78,79]
The case study includes three districts: “Poggio Tre Galli”, mainly residential, “G area”, which takes its name from urban master-plan and “Study Centre”, since most of the city schools, especially high schools and primary schools, are in this urban area of Potenza (Figure 2).
In addition to the prevalent use related to education, “Study Centre” is characterised by the presence of many no-built areas. “Poggio Tre Galli” and “G area” are instead residential districts with a particularly high settlement density compared to the urban context. In fact, on the basis of the 2011 demographic data of the National Institute of Statistics (ISTAT), 4357 inhabitants reside in the “Poggio Tre Galli” district, while the “G area” has 1919 inhabitants. Furthermore, in the last decades data show that the number of over-50s residents has increased compared to a reduction in the presence of young people in both neighborhoods. To confirm this, the old-age index has increased in the decade 2001–2011.
The construction of the “Poggio Tre Galli” and the “Study Centre” districts dates back to the 1970s and 1980s on the basis of two plans, which have not been fully implemented. Moreover, the two districts have taken over the current urban structure due to changes made to the original planning forecasts in recent years. The “G area” district, whose construction is recent, is currently characterised by the lack of services.
4. Results
4.1. Axial Analysis on the Existing Street Network
To evaluate syntactic properties, the axial analysis was carried out using topological distance and considering two different route network’s maps (Figure 4): the vehicular road network and the network resulting from the integration of the latter with pedestrian paths. In particular, attention was focused on the calculation of syntactic parameters mentioned above. They have been calculated using DephtmapX, an open-source and multi-platform spatial analysis software for spatial networks. In addition, for each syntactic measurement, statistical values are reported: average, standard deviation, variance, minimum, maximum, Gini coefficient.
Calculating the topological connectivity in both scenarios (Figure 5), it is noted that Via Adriatico and Via Anzio, South of Parco Europa Unita, have the highest values (marked by the green color in the thematic map). The same situation occurs North of the area, at the roundabout where Via Varsavia, Via Londra and Via Ancona converge. Furthermore, the street that allows access to Piazzale Sofia, Piazzale Bucarest and Piazzale Zagabria is characterised by the highest values (marked by the yellow color in the thematic map).
Furthermore, it emerges that the average value registered in both analyzed scenarios (road network and road network with pedestrian paths) is greater than 5 (see Table 1).
The calculation of graph theory-based network centrality measures (topological integration-closeness and topological choice-betweenness) was performed considering both the local and the global scale. In fact, axial integration and axial choice were computed in a range of two topological radii (r): r = 3 for the analysis carried out on the local scale (local integration and local choice) and r = n for the analysis on the global scale (global integration and global choice).
The analysis of global topological integration (r = n) shows how the addition of pedestrian paths increases statistic values obtained along the paths of the road network: the minimum, maximum and mean values are higher. In particular, the pedestrian path crossing Parco Europa Unita improves the integration of Via Adriatico (both characterised by red colour in the thematic map) and Via Anzio (Figure 6).
The road network, north of the study area, is characterised by the lowest values. However, the introduction of pedestrian paths also has positive effects on these roads.
Moreover, analyses carried out on the current state show that adding pedestrian paths to the road network leads to an increase in the syntactic index at global scale (r = n) in the minimum, maximum and average values (see Table 2).
The local topological integration (r = 3) calculation shows how the most integrated routes are Via Anzio and Via Londra (colored red on the map). The presence of pedestrian paths improves the centrality of Via Anzio and Via Adriatico while Via Londra is characterised by lower values than the previous scenario. At the local scale (r = 3), there is an increase in the average integration value Figure 7, Table 3).
From the calculation of the global topological choice (r = n), it emerges that Via Parigi has the highest value (colored yellow) in both scenarios (road network and road network integrated with pedestrian paths). In the latter, the pedestrian path crossing Parco Europa Unita (colored green) is potentially among the most chosen routes, but its presence does not significantly improve the values registered by the other routes in the network (Figure 8 and Figure 9).
At the local scale (r = 3), axial topological choice value of the lines falling in the study area is quite uniform, regardless of the scenario (with or without pedestrian paths) considered in the analysis. Thus, the addition of pedestrian paths has not significant positive effects in terms of choice on the route network within the study area (Table 4 and Table 5).
As part of the SSA, it is possible to relate the previously calculated indices, thus obtaining second-degree indices that allow for further evaluation of road network’s syntactic properties.
Intelligibility measures (Figure 10) the correlation between axial topological connectivity and axial global topological integration (r = n). With a strong correlation between these two indices, i.e., ‘‘high intelligibility’’, there is a close relationship between the whole system (overall urban space) and the elements (local features) that make it up. Considering the linear correlation between the two syntactic measures, R2 value is equal to 0.2868.
Synergy is a parameter relating the local (radius-3) topological integration values to ones that have been computed at the global scale (radius-n). Thus, the degree to which the internal structure of an area refers to the global system within which it is located is obtained. In our case, the scatter plot shows that the linear correlation has a moderate value: R2 = 0.4460 (Figure 11).
Movement interface index allows one to compute the correlation between integration values and choice values. Thus, the two measures of network axial centrality are related in order to evaluate both the degree of accessibility to a given space as destination from different origins and the possibility that the same space falls within the minimum paths from all spaces to all the others. In relation to the current state, this type of analysis was carried out both at the global scale (r = n) (Figure 12) and at the local scale (r = 3) (Figure 13).
4.2. The Cognitive Framework: Interviews and Stakeholders’ Session
Analyses of the current state carried out with a participatory approach during the workshop highlighted the deficiencies relating to pedestrian paths’ network from both quantitative and qualitative points of view. This affects the level of walkability, whose development is considered one of the main topics of the urban regeneration project of the study area. The creation of the cognitive framework was relevant in order to better influence next design phase. The acquisition of information was based on street surveys conducted on the territory, using social media and examining the results of questionnaires submitted to the inhabitants of the area. Furthermore, the use of online questionnaires and ICT tools has allowed one not only to extend participation to different users but also to expand the information database. It was possible to collect several and various pedestrian user groups’ perspectives: residents, students, local authorities, community activists and users of services located in the districts (Figure 14).
So, critical issues of the study area were:
- Discontinuity of the sidewalks characterised by the presence of architectural barriers;
- Absence of cycle paths;
- Limited width of pedestrian paths due to the presence of street furniture’s elements such as trees and benches;
- Poor maintenance and cleaning of streets and areas, in particular those that are characterised by neglect and decay since they are not very used;
- Presence of stray dogs;
- Absence of elements of separation between streets characterised by a relevant traffic volume and adjacent pedestrian paths;
- Presence of dangerous pedestrian crossings.
Pedestrian mobility is currently characterised by infrastructural deficiencies, which severely limits its competitiveness compared to other transport means. Moreover, this penalizes the usability of services present in the area and creates situations of social inequity between the sub-districts of the study area and between different types of users. In fact, this concerns above all the “Study Centre” district, whose users are mostly represented by students, which is lacking in safe and interconnected pedestrian paths. The schools, the main attractor for internal and external mobility, have poor spatial relationships with the rest of the “Study Centre” district and with others districts that are within the study area. Although the current level of walkability of the area is low, during the workshop, it emerged that many users usually move around on foot. Among the main users of the area there are students who raised another problem related to walkability: the need to create new pedestrian paths that form a real walking route network with existing ones and that are integrated by multifunctional spaces, possibly surrounded by greenery, equipped for leisure and other services. This was carefully considered in the subsequent planning phase, which in turn was based on the same inclusive and participatory approach. In fact, the development of walkability cannot be separated from the presence of an adequate provision of public services and opportunities. In fact, multiple use of space, as well as mixed social and economic uses in built-up areas allow one to reduce people’s mobility need and consequently “congestion and pollution while improving efficiency, connectivity, accessibility, health and quality of life” [12]. This is fundamental in defining a neighborhood-scale urban regeneration project taking into account several and different needs and eliminates any physical and mental barriers that may be present. The latter represents one of the preconditions for the creation of sustainable cities and communities starting from the local scale as the case study shows.
Furthermore, the cognitive framework showed that the area is poorly served by public transport, thus limiting relationships at the urban scale. This penalizes especially weaker categories of the population at a social and economic level and represents an aspect that negatively affects sustainable (pedestrian and bicycle) mobility and inter-modality.
4.3. The Strategies Proposed in the Workshop
A sustainable infrastructure (for walking and cycling) has to be “implemented in a participatory manner, considering innovative, resource-efficient, accessible, context-specific and culturally sensitive sustainable solutions” [12]. The promotion of this type of infrastructure requires the involvement of all relevant stakeholders (multi-stakeholder partnerships) and inhabitants at all stages of the planning processes, “from conceptualization to design, budgeting, implementation, evaluation and review” [12].
In this methodological principles framework, a proposal for the urban regeneration project based on the promotion of sustainable mobility and, in particular, pedestrian mobility was developed. The stakeholder session made it possible to find a correspondence between the positions of experts and community representatives while selecting a set of priorities to be addressed in the design phase.
The proposal is characterized by the definition of intervention projects oriented to improve network infrastructures for pedestrian mobility in order to favour better usability of green areas and of services located in the case study area [20] (see Figure 15).
Specifically, operative actions relate to:
- Addition of new pedestrian paths to integrate existing ones in order to create a network covering the whole study area in a capillary way;
- Implementation of traffic calming measures;
- Redefinition of the main street sections;
- Functional adaptation of the rainwater disposal networks along the road network and in areas subject to flood risk;
- Extension of the public lighting network (especially in “G area”).
- During the workshop, it emerged that the interventions considered as priorities are:
- Functional organization of some road sections in order to allow the insertion of sidewalks;
- Improvement of existing pedestrian paths THAT are currently in poor condition due to the poor maintenance performed (especially in “G area”).
- Creation of safe pedestrian crossings.
- Construction of a walking route network connecting the most popular areas.
4.4. Axial Analysis on the Route Network Project Hypothesis
The axial map analysis was performed on the effects deriving from the inclusion of new pedestrian paths within street network proposed during the participatory and socially inclusive workshop. Specifically, we proceeded to determine synthetic indices of the spatial configuration that take into account changes implemented in comparison with the previous scenario.
Topological connectivity does not vary much when compared to existing cases. There is an increase only for some lines, those directly connected with new routes (Figure 16, Table 6).
Topological integration (or closeness) increases both globally (r = n) and locally (r = 3), especially in the “Study Centre” and “G area” districts, respectively, in the south and north-west of the study area. In particular, with the support of the thematic map, the Parco Europa Unita, a relevant neighbourhood green area, is the main potential movement attractor (from or to) within the area (Figure 17, Table 7).
In relation to topological choice (betweenness), the lines-paths assume uniform values at the local scale (r = 3). Instead, at the global scale (r = n), the Parco dell’Europa Unita registers above-average choice values. The access roads to this neighborhood park have high values as well as Via Parigi, in the north-western part of the study area. So, these street-lines have greater potential to be chosen as part of a path within a predetermined distance (topological radius) from each line (Figure 18, Table 8).
The calculation of the second-order indices (intelligibility, synergy and movement interface) has almost produced similar results when compared to the current scenario.
5. Discussions
Topological connectivity does not undergo significant changes with the addition of new pedestrian paths and is similar in the different cases analyzed. The area with higher values is the central one that is therefore the most connected both globally and locally, while the rest has medium-low values (Figure 19, Table 9).
Topological integration is also high in the central part of the area considering both scenarios, current status and project scenario. In the “G area” and “Study Centre” districts, on the other hand, the index assumes low values in the case of the existing network. These are increased by the addition of new pedestrian paths.
In particular, the axial analysis highlights how the spatial configuration of the “G area” district and the “Study Centre” district negatively influence pedestrian mobility, confirming what emerged during workshop with respect to structural deficiencies of the pedestrian route network. The analysis on the existing network, therefore, highlights the need for additional pedestrian paths able to guarantee a higher level of connectivity and integration. In fact, the analyses taking into account the final design proposal of the participatory workshop show that adding new pedestrian paths it is possible to improve configurational indices in the most critical sections, increasing their level of network accessibility (Figure 20, Table 10 and Figure 21, Table 11.
From the comparison of the (global and local) topological integration values of the pedestrian route network, before and after design interventions proposed in the workshop, it can be seen that the minimum, maximum and average values are higher while the variance and standard deviation are lower in the design scenario. This means that the study area would benefit from the proposed interventions: these improve its syntactic structure as it becomes more integrated, and more accessible in terms of spatial configuration at both global (r = n) and local (r = 3) scales.
However, same analyses show that the central part of the area has a high level of spatial integration so no new paths are needed. In this case, the improvement of mobility must be obtained by improving the equipment for pedestrian movements, both in qualitative and quantitative terms, or with traffic-calming interventions.
Topological choice assumes mostly low values for the whole area except for some lines. This means that there are few lines that fall more often within paths between other pairs of lines, and therefore the possibility of choosing between alternative paths in moving from one point to another is smaller.
6. Conclusions
The experimentation of the participatory process supported by SSA for ex-ante territorial evaluation and strategic scenario analysis has shown how active mobility may represent a central argument in order to address urban regeneration issues on a neighborhood scale. Here, the proposed interventions designs are based on the acquisition of data and information according to a “citizen-centred” inclusive approach taking into account bottom-up contributions compared with robust technical evaluations based on SSA. In fact, a participatory walkability assessment method was integrated with traditional street survey-based approaches with web-assisted procedures to create a shared and flexible cognitive framework, including different and several pedestrian users’ perspectives (seniors, adults, teenagers, students and residents). Thus, citizens can express needs, opinions, preferences, etc., and actively participate in the definition of effective and comprehensive walking-related strategies, design interventions and improvements in order to better their perceived level of quality of life. In our case study, inclusive and participative urban management based on the ICT platform developed during the project CAST is an example of inclusive smart planning in order to define strategic design interventions and improvements within neighbourhood-scale urban regeneration scenarios.
The urban regeneration proposal developed within the project CAST was based mainly on the issue of walking mobility, and consequently the improvement of walkability level and the quality of the pedestrian environment is a primary objective. Nowadays, the possibility of walking is often denied culturally and materially because of the hypertrophy of urban areas, and urban and planning deficiencies, with serious consequences on individuals’ quality of life and health. Instead, related-walking strategies and interventions would allow for more sustainable use of such areas by citizens and users.
Pedestrian mobility contributes to improving social inclusion of an area by eliminating street physical barriers. This also determines a social re-appropriation of urban spaces: green areas, services and equipment. The creation of a widespread and extensive network of pedestrian paths is able to meet users’ needs and the demand for mobility in the study area. Furthermore, a continuous pedestrian route network helps encourage walking while decreasing pedestrians’ insecurity [82]. Thus, walking is truly competitive with respect to other motorized transportation modes and makes a significant contribution to improving living conditions, reducing pollution and congestion in vehicular traffic.
Moreover, sustainable, active urban mobility, walking and cycling are closely related to urban planning and urban management practice. In fact, a compact urban layout, characterised by more direct and shorter paths to destinations, enhances walking [83]. Walkability-related design interventions should be defined in neighbourhood-scale planning that is appropriate for the development of pedestrian mobility. Furthermore, neighborhood walkability, encouraged by urban street environment interventions, supports pedestrian activity, thus increasing people’s physical activity and improving health.
From those general considerations about walkability effects on the perceived level of quality of live in urban and neighborhoods context, the research approach allowed one to highlight strengths and weaknesses as a contribution to the urban participatory regeneration practices.
Concerning strengths derived from the integration of SSA in participatory planning practice, several advantages have to be pointed out, i.e., that the street auditing method proposed in this research supported the integration of different issues: participation, the use of web-assisted procedures, and detailed knowledge of the road network, based on the calculation of SSA measures. The latter helped to mathematically characterise the street network and the pedestrian environment in a detailed way concerning the state of the art and the strategic scenario proposed through participatory planning. On the basis of analyses carried out, it is possible to evaluate not only the current state of the network but also the effects derived from the implementation of intervention projects defined in an inclusive and participatory way. In fact, the pedestrian environment improves significantly by designing a pedestrian network with high network centrality measures: integration (closeness) and choice (betweenness). Those indicators allow one to quantify the potential movement affecting the paths of a network: respectively, “to-movement” and “through-movement”. Our study shows how an improvement in the syntactic structure of pedestrian route network (syntactic integration, i.e., spatial accessibility) could lead to a better physical integration able to reduce spatial fragmentation [84]. Socio-spatial integration represents one of the goals to be achieved in project interventions both at the neighborhood and urban scale. By using graph theory-based spatial configuration quantitative analysis, it is possible to support participatory planning, urban management and infrastructure network design.
The weaknesses of the approach depend on technical and cognitive levels. The SSA should be extended to a wider urban portion in order to include border effects and to understand the relations existing in terms of accessibility and connectivity between the study area and the whole urban system. This represents a technical tangle easily manageable with available technologies and data, but such an analysis could cause confusion in the participant groups involved in the process. Changing scales in technical interpretation of the context is not an easy task for citizens engaged in a participatory planning exercise, and any complications may strongly affect the whole success of the process. This technical issue has to be carefully managed by the organizers and/or the facilitators of the participatory process.
The technical details of the SSA represent a hard argument to be shared with citizens in order to define a common cognitive framework in the participatory process. Referring to maps may simplify this task for workshop conductors. For instance, the comparison between topological closeness of the existing pedestrian road network and the proposed one (see Figure 20) represents a clear description of the improvement achievable. Such content may be shared even without technical details during the workshop, translating technical meanings into common language concepts. This is not an easy task for workshop conductors, who have to balance the level of technical complexity in spatial analysis and the objective to achieve an effective interaction with workshop participants. Additionally, general critics of SSA regard the fact that the model only takes into account the physical characteristics of the network, without any consideration for the multi-agent choices in organizing real movements around the city of the district. In this research, the contribution of the public participation allowed one to compare the analytical results with the citizens’ opinions. This is not a solution but a way to compare model results with the perception of real people living in the area. The use of SSA as robust analytic for the evaluation of mobility issue in urban regeneration participatory practice presents a wide range of applications connected with the increasing importance that regeneration plays in urban development [85,86]. The evidence from CAST project allows one to affirm that SSA contributed to the cognitive participatory framework in terms of sharing useful quantitative measures facilitating comparisons among different scenarios connected with urban mobility. Particularly in the domain of active mobility and specifically concerning the walkability issue, the evidence of this research expresses how deeper knowledge about configurational analysis of the road network and walkable network strongly drive citizen opinion towards seeing walkability as a priority of urban regeneration strategy. This should be compared with the evidence derived from planning practices based on a similar methodology.
Further research, beyond SSA, could exploit the potential of place syntax analysis (PSA) where in addition to the evaluation of configurational indexes connected with road networks it is possible to take into account a weighted estimation of the potential that selected destinations (i.e., the presence of services spatially identified along the networks) may bring to the analysis. PSA refers to a wide literature concerning urban planning and urban regeneration, where a number of case studies are described.
Traffic-oriented urban planning will be replaced by people-based urban planning focused on a local-oriented environment that has relevant impacts on walking [87]. Moreover, this method provides valid support for policy-makers who want to improve walkability, through walking-related strategies, and make urban environment pedestrian-friendly, contributing to the creation of sustainable cities and communities. Relevant sectors where walkability issues may find suitable implementation domains are energy and climate municipal planning [88,89] and ecosystem-services-oriented planning [90].
Author Contributions
Conceptualization, F.S., B.M. and P.P.; methodology, G.F. and F.S.; validation, F.S., G.F. and R.C.; formal analysis, R.C. and G.F.; data curation, R.C.; writing—original draft preparation, G.F. and F.S.; writing—review and editing, F.S., P.P.; supervision, F.S., B.M. and P.P. All authors have read and agreed to the published version of the manuscript.
Funding
This research received no external funding.
Data Availability Statement
No new data were created or analyzed in this study. Data sharing is not applicable to this article.
Conflicts of Interest
The authors declare no conflict of interest.
References
- Scorza, F.; Pontrandolfi, P. Citizen Participation and Technologies: The CAST Architecture. In Computational Science and Its Applications-ICCSA 2015, Banff, AB, Canada, 22–25 June 2015; Lecture Notes in Computer Science; Gervasi, O., Murgante, B., Misra, S., Gavrilova, M.L., Rocha, A.M.A.C., Torre, C.M., Taniar, D., Apduhan, B.O., Eds.; Springer: Cham, Switzerland, 2015; Volume 9156, Part II, pp. 747–755. [Google Scholar] [CrossRef]
- European Commission. Together Towards Competitive and Resource-Efficient Urban Mobility; European Commission: Brussels, Belgium, 2013. [Google Scholar]
- European Commission. A European Strategy for Low-Emission Mobility; European Commission: Brussels, Belgium, 2016. [Google Scholar]
- European Commission. European Political Strategy Center Strategic Notes towards Low-Emission Mobility—Driving the Modernisation of the EU Economy. 2016. Available online: https://ec.europa.eu/epsc/sites/epsc/files/strategic_note_issue_17.pdf (accessed on 11 November 2019).
- Staricco, L. Smart mobility: Opportunità e condizioni. TeMA J. Land Use Mobil. Environ. 2013, 6, 341–354. [Google Scholar] [CrossRef]
- World Health Organization. Global Health Observatory (GHO) Data. 2015. Available online: http://www.who.int/gho/ncd/en/ (accessed on 27 March 2019).
- Azmi, D.I.; Ahmad, P. A GIS Approach: Determinant of Neighbourhood Environment Indices in Influencing Walkability between Two Precincts in Putrajaya. Procedia Soc. Behav. Sci. 2015, 170, 557–566. [Google Scholar] [CrossRef] [Green Version]
- Fan, P.L.; Wan, G.H.; Xu, L.H.; Park, H.; Xie, Y.W.; Liu, Y.; Yue, W.Z.; Chen, J.Q. Walkability in urban landscapes: A comparative study of four large cities in China. Landsc. Ecol. 2018, 33, 323–340. [Google Scholar] [CrossRef]
- King, A.C.; Sallis, J.F.; Frank, L.D.; Saelens, B.E.; Cain, K.; Conway, T.L.; Chapman, J.E.; Ahn, D.K.; Kerr, J. Aging in neighborhoods differing in walkability and income: Associations with physical activity and obesity in older adults. Soc. Sci. Med. 2011, 73, 1525–1533. [Google Scholar] [CrossRef] [Green Version]
- Lovasi, G.S.; Grady, S.; Rundle, A. Steps forward: Review and recommendations for research on walkability, physical activity and cardiovascular health. Publ. Health Rev. 2011, 33, 484–506. [Google Scholar] [CrossRef] [PubMed] [Green Version]
- United Nations. Resolution A/RES/70/1. Transforming Our World: The 2030 Agenda for Sustainable Development. In Proceedings of the Seventieth Session of the United Nations General Assembly, New York, NY, USA, 25 September 2015; Available online: https://sustainabledevelopment.un.org/post2015/transformingourworld (accessed on 13 December 2019).
- United Nations. New Urban Agenda; New York, USA. 2016. Available online: https://www2.habitat3.org/bitcache/99d99fbd0824de50214e99f864459d8081a9be00?vid=591155&disposition=inline&op=view (accessed on 21 November 2019).
- Fortunato, G.; Sassano, G.; Scorza, F.; Murgante, B. Ciclabilità a Potenza: Una proposta di intervento per lo sviluppo della mobilità attiva in un contesto urbano acclive. Urban. Inf. 2018, 278, 109–115. [Google Scholar]
- Fortunato, G.; Scorza, F.; Murgante, B. Cyclable City: A Territorial Assessment Procedure for Disruptive Policy-Making on Urban Mobility. In Computational Science and Its Applications-ICCSA 2019, Saint Petersburg, Russia, 1–4 July 2019; Lecture Notes in Computer Science; Misra, S., Gervasi, O., Murgante, B., Stankova, E., Korkhov, V., Torre, C., Rocha, A.M.A.C., Taniar, D., Apduhan, B.O., Tarantino, E., Eds.; Springer: Cham, Switzerland, 2019; Volume 11624, Part VI, pp. 291–307. [Google Scholar] [CrossRef]
- Scorza, F.; Fortunato, G. Cyclable cities: Building feasible scenario through urban space-morphology assessment. J. Urban Plan. Dev. 2020, accepted. [Google Scholar] [CrossRef]
- Murgante, B.; Botonico, G.; Graziadei, A.; Sassano, G.; Amato, F.; Scorza, F. Innovation, technologies, participation: New paradigms towards a 2.0 citizenship. Int. J. Electron. Gov. 2019, 11, 62–88. [Google Scholar] [CrossRef] [Green Version]
- Las Casas, G.; Scorza, F.; Murgante, B. New Urban Agenda and Open Challenges for Urban and Regional Planning. In New Metropolitan Perspectives, ISHT 2018; Calabrò, F., Della Spina, L., Bevilacqua, C., Eds.; Springer: Cham, Switzerland, 2019; Volume 100, pp. 282–288. [Google Scholar]
- Las Casas, G.; Scorza, F.; Murgante, B. Razionalità a-priori: Una proposta verso una pianificazione antifragile. Ital. J. Reg. Sci. 2019, 18, 329–338. [Google Scholar]
- Carbone, R.; Saganeiti, L.; Scorza, F.; Murgante, B. Increasing the walkability level through a participation process. In Computational Science and Its Applications-ICCSA 2018, Melbourne, Australia, 2–5 July 2018; Lecture Notes in Computer Science; Gervasi, O., Murgante, B., Misra, S., Stankova, E., Torre, C.M., Rocha, A.M.A.C., Taniar, D., Apduhan, B.O., Tarantino, E., Ryu, Y., Eds.; Springer: Cham, Switzerland, 2018; Volume 10964, Part V, pp. 725–733. [Google Scholar] [CrossRef]
- Pontrandolfi, P.; Scorza, F. Sustainable Urban Regeneration Policy Making: Inclusive Participation Practice. In Computational Science and Its Applications-ICCSA 2016, Beijing, China, 4–7 July 2016; Lecture Notes in Computer Science; Gervasi, O., Murgante, B., Misra, S., Rocha, A.M.A.C., Torre, C.M., Taniar, D., Apduhan, B.O., Stankova, E., Wang, S., Eds.; Springer: Cham, Switzerland, 2016; Volume 9788, Part III, pp. 552–560. [Google Scholar] [CrossRef]
- Carlson, J.; Saelens, B.; Kerr, J.; Schipperijn, J.; Conway, T.; Frank, L.; Chapman, J.; Glanz, K.; Cain, K.; Sallis, J. Association between neighborhood walkability and GPS-measured walking, bicycling and vehicle time in adolescents. Health Place 2015, 32, 1–7. [Google Scholar] [CrossRef] [Green Version]
- De Vos, J. The effect of COVID-19 and subsequent social distancing on travel behavior. Transp. Res. Interdiscip. Perspect. 2020, 100121. [Google Scholar] [CrossRef]
- Pliakas, T.; Wilkinson, P.; Tonne, C. Contribution of the physical environment to socioeconomic gradients in walking in the Whitehall II study. Health Place 2014, 27, 186–193. [Google Scholar] [CrossRef] [PubMed] [Green Version]
- Rundle, A.G.; Sheehan, D.M.; Quinn, J.W.; Bartley, K.; Eisenhower, D.; Bader, M.M.D.; Lovasi, G.S.; Neckerman, K.M. Using GPS data to study neighborhood walkability and physical activity. Am. J. Prev. Med. 2016, 50, e65–e72. [Google Scholar] [CrossRef]
- Stevenson, M.; Thompson, J.; de Sá, T.H.; Ewing, R.; Mohan, D.; McClure, R.; Roberts, I.; Tiwari, G.; Giles-Corti, B.; Sun, X.; et al. Land use, transport, and population health: Estimating the health benefits of compact cities. Lancet 2016, 388, 2925–2935. [Google Scholar] [CrossRef] [Green Version]
- Moura, F.; Cambra, P.; Gonçalves, A. Measuring walkability for distinct pedestrian groups with a participatory assessment method: A case study in Lisbon. Landsc. Urban Plan. 2017, 157, 282–296. [Google Scholar] [CrossRef]
- Leslie, E.; Butterworth, I.; Edwards, M. Measuring the walkability of local communities using Geographic Information Systems data. In Proceedings of the Walk21-VII, the Next Steps, 7th International Conference on Walking and Liveable Communities, Melbourne, Australia, 23–25 October 2006; Volume 6. [Google Scholar]
- Handy, S. Critical Assessment of the Literature on the Relationships among Transportation, Land Use, and Physical Activity; TRB—Transportation Research Board: Washington, DC, USA, 2005; p. 282. [Google Scholar]
- Kalakou, S.; Moura, F. Bridging the gap in planning indoor pedestrian facilities. Transp. Rev. 2014, 34, 474–500. [Google Scholar] [CrossRef]
- Blečić, I.; Cecchini, A.; Congiu, T.; Fancello, G.; Trunfio, G.A. Evaluating walkability: A capability-wise planning and design support system. Int. J. Geogr. Inf. Sci. 2015, 29, 1350–1374. [Google Scholar] [CrossRef]
- Blečić, I.; Canu, D.; Cecchini, A.; Congiu, T.; Fancello, G. Factors of perceived walkability: A pilot empirical study. In Computational Science and Its Applications-ICCSA 2016, Beijing, China, 4–7 July 2016; Lecture Notes in Computer Science; Gervasi, O., Murgante, B., Misra, S., Rocha, A.M.A.C., Torre, C.M., Taniar, D., Apduhan, B.O., Stankova, E., Wang, S., Eds.; Springer: Cham, Switzerland, 2016; Volume 9789, Part IV, pp. 125–137. [Google Scholar] [CrossRef]
- Blečić, I.; Canu, D.; Cecchini, A.; Congiu, T.; Fancello, G. Walkability and street intersections in rural-urban fringes: A decision aiding evaluation procedure. Sustainability 2017, 9, 883. [Google Scholar] [CrossRef] [Green Version]
- Carr, L.; Dunsiger, S.; Marcus, B. Walk ScoreTM as a global estimate of neighborhood Walkability. Am. J. Prev. Med. 2010, 39, 460–463. [Google Scholar] [CrossRef] [Green Version]
- Cervero, R.; Duncan, M. Walking, bicycling, and urban landscapes: Evidence from the San Francisco bay area. Am. J. Public Health 2003, 93, 1478–1483. [Google Scholar] [CrossRef] [PubMed]
- During, A.T. The Car and the City: 24 Steps to Safe Streets and Healthy Communities; Northwest Environment Watch: Seattle, WA, USA, 1996. [Google Scholar]
- Ewing, R.; Handy, S. Measuring the unmeasurable: Urban design qualities related to walkability. J. Urban Des. 2009, 14, 65–84. [Google Scholar] [CrossRef]
- Speck, J. Walkable City; Farrar, Straus and Giroux: New York, NY, USA, 2012. [Google Scholar]
- Sen, A. Inequality Reexamined; Oxford University Press: Oxford, UK, 1992. [Google Scholar]
- Sen, A. Capability and Well-Being. In The Quality of Life; Nussbaum, M., Sen, A., Eds.; Clarendon Press: Oxford, UK, 1993; pp. 30–53. [Google Scholar]
- Sen, A. Development as Freedom; Oxford University Press: Oxford, UK, 1999. [Google Scholar]
- Sugden, R.; Sen, A. Commodities and Capabilities. Econ. J. 1986, 96, 820–822. [Google Scholar] [CrossRef]
- Harvey, D. The right to the city. N. Left Rev. 2008, 53, 23–40. [Google Scholar] [CrossRef]
- Lefebvre, H. Le Droit à la Ville; Anthropos: Paris, France, 1968. [Google Scholar]
- Lefebvre, H. Critica della Vita Quotidiana; Dedalo: Bari, Italy, 1993; pp. 229–238. [Google Scholar]
- Marcuse, P. Whose Right(s) to What City. In Cities for People, Not for Profit: Critical Urban Theory and the Right to the City; Brenner, N., Marcuse, P., Mayer, M., Eds.; Routledge: Abingdon, UK, 2012; pp. 24–41. [Google Scholar]
- McCann, E.J. Space, citizenship, and the right to the city: A brief overview. GeoJournal 2002, 58, 77–79. [Google Scholar] [CrossRef]
- Purcell, M. Possible Worlds: Henri Lefebvre and the Right to the City. J. Urban Aff. 2014, 36, 141–154. [Google Scholar] [CrossRef]
- Hillier, B. The Architectures of seeing and going: Or, are Cities Shaped by Bodies or Minds? And is there a Syntax of Spatial Cognition? In Proceedings of the 4th International Symposium in Space Syntax, London, UK, 17–19 June 2003; Hanson, J., Ed.; The Barlett School of Graduated Study, Space Syntax Laboratory: London, UK, 2003; Volume 6, pp. 1–34. [Google Scholar]
- Hillier, B. The Genetic Code for Cities—Is it Simpler than We Thought? In Proceedings of the Complexity in Cities Conference, Delft, The Netherlands, 18–20 September 2009; University of Delft: Delft, The Netherlands, 2009. [Google Scholar]
- Arras, F.; Cecchini, A.; Ghisu, E.; Idini, P.; Talu, V. Perché e come Promuovere la Camminabilitá Urbana a Partire dalle Esigenze degli Abitanti piú Svantaggiati: Il Progetto “Extrapedestri. Lasciati Conquistare dalla Mobilità Aliena!“. In International Conference Virtual City and Territory, 9th Congresso Città e Territorio Virtuale, Rome, Italy, 2–4 October 2013; Università degli Studi Roma Tre: Rome, Italy, 2014; pp. 185–196. Available online: https://upcommons.upc.edu/bitstream/handle/2099/16180/0185_0196%20MOD%20VIRT%20CITTA.pdf?sequence=7&isAllowed=y (accessed on 15 October 2019).
- Blečić, I.; Cecchini, A.; Fancello, G.; Talu, V.; Trunfio, G. Camminabilità e capacità urbane: Valutazione e supporto alla decisione e alla pianificazione urbanistica. Territ. Ital. 2015, 49–65. [Google Scholar] [CrossRef]
- Aune, J.B. Logical Framework Approach and PRA—Mutually exclusive or complementary tools for project planning? Dev. Pract. 2000, 10, 687–690. [Google Scholar] [CrossRef]
- Gasper, D. Evaluating the ‘logical framework approach’ towards learning-oriented development evaluation. Public Adm. Dev. 2000, 20, 17–28. [Google Scholar] [CrossRef] [Green Version]
- Las Casas, G.B.; Scorza, F. Un approccio “context-based” e “valutazione integrata” per il futuro della programmazione operativa regionale in Europa. Svilupp. Territ. Nell’economia Conosc. Teor. Attori Strateg. Collana Sci. Reg. 2009, 41. [Google Scholar] [CrossRef]
- Las Casas, G.B.; Scorza, F. Sustainable Planning: A Methodological Toolkit. In Computational Science and Its Applications-ICCSA 2016, Beijing, China, 4–7 July 2016; Lecture Notes in Computer Science; Gervasi, O., Murgante, B., Misra, S., Rocha, A.M.A.C., Torre, C.M., Taniar, D., Apduhan, B.O., Stankova, E., Wang, S., Eds.; Springer: Cham, Switzerland, 2016; Volume 9786, Part I, pp. 627–635. [Google Scholar] [CrossRef]
- Hillier, B.; Hanson, J.; Peponis, J.; Hudson, J.; Burdett, R. Space Syntax. A Different Urban Perspective. Archit. J. 1983, 178, 47–63. [Google Scholar]
- Cutini, V.; de Falco, A.; Giuliani, F. Urban grid and seismic prevention: A configurational approach to the emergency management of Italian historic centres. In Proceedings of the 12th International Space Syntax Symposium, SSS 2019, Beijing JiaoTong University, Beijing, China, 8–13 July 2019; Beijing JiaoTong University: Beijing, China, 2019; pp. 48.1–48.20. [Google Scholar]
- Omer, I.; Goldblatt, R. Urban spatial configuration and socio-economic residential differentiation: The case of Tel Aviv. Comput. Environ. Urban Syst. 2012, 36, 177–185. [Google Scholar] [CrossRef]
- Hillier, B. Centrality as a process: Accounting for attraction inequalities in deformed grids. Urban Des. Int. 1999, 4, 107–127. [Google Scholar] [CrossRef]
- Turner, A.; Penn, A.; Hillier, B. An algorithmic definition of the axial map. Environ. Plan. B Plan. Des. 2005, 32, 425–444. [Google Scholar] [CrossRef]
- Ståhle, A. More green space in a denser city: Critical relations between user experience and urban form. Urban Des. Int. 2010, 15, 47–67. [Google Scholar] [CrossRef] [Green Version]
- Saelens, B.E.; Sallis, J.F.; Frank, L.D. Environmental correlates of walking and cycling: Findings from the transportation, urban design, and planning literatures. Ann. Behav. Med. 2003, 25, 80–91. [Google Scholar] [CrossRef] [PubMed]
- Hillier, B.; Hanson, J. The Social Logic of Space; Cambridge University Press: Cambridge, UK, 1984. [Google Scholar]
- Hillier, B. Cities as movement economies. Urban Des. Int. 1996, 1, 41–60. [Google Scholar] [CrossRef]
- Freeman, L.C. A set of measures of centrality based on betweenness. Sociometry 1977, 40, 35–41. [Google Scholar] [CrossRef]
- Pontrandolfi, P.; Scorza, F. Making Urban Regeneration Feasible: Tools and Procedures to Integrate Urban Agenda and UE Cohesion Regional Programs. In Computational Science and Its Applications-ICCSA 2017, Trieste, Italy, 3–6 July 2017; Lecture Notes in Computer Science; Gervasi, O., Murgante, B., Misra, S., Borruso, G., Torre, C.M., Rocha, A.M.A.C., Taniar, D., Apduhan, B.O., Stankova, E., Cuzzocrea, A., Eds.; Springer: Cham, Switzerland, 2017; Volume 10409, Part VI, pp. 564–572. [Google Scholar] [CrossRef]
- Forte, F.; Girard, L.F.; Nijkamp, P. Smart policy, creative strategy and urban development. Stud. Reg. Sci. 2006, 35, 947–963. [Google Scholar] [CrossRef] [Green Version]
- Lanza, V.; Prosperi, D. Collaborative E-Governance: Describing and Pre-Calibrating the Digital Milieu. In UDMS Annual Urban and Regional Data Management; CRC Press: Boca Raton, FL, USA, 2009; pp. 373–384. [Google Scholar] [CrossRef]
- Murgante, B.; Borruso, G. Cities and Smartness: A Critical Analysis of Opportunities and Risks. In Computational Science and Its Applications-ICCSA 2013, Ho Chi Minh City, Vietnam, 24–27 June 2013; Lecture Notes in Computer Science; Murgante, B., Misra, S., Carlini, M., Torre, C.M., Nguyen, H.-Q., Taniar, D., Apduhan, B.O., Gervasi, O., Eds.; Springer: Cham, Switzerland, 2013; Volume 7973, Part III, pp. 630–642. [Google Scholar] [CrossRef]
- Garau, C.; Annunziata, A.; Yamu, C. A walkability assessment tool coupling multi-criteria analysis and space syntax: The case study of Iglesias, Italy. Eur. Plan. Stud. 2020. [Google Scholar] [CrossRef]
- Soligno, R.; Scorza, F.; Amato, F.; Las Casas, G.; Murgante, B. Citizens Participation in Improving Rural Communities Quality of Life. In Computational Science and Its Applications-ICCSA 2015, Banff, AB, Canada, 22–25 June 2015; Lecture Notes in Computer Science; Gervasi, O., Murgante, B., Misra, S., Gavrilova, M.L., Rocha, A.M.A.C., Torre, C.M., Taniar, D., Apduhan, B.O., Eds.; Springer: Cham, Switzerland, 2015; Volume 9156, Part II, pp. 731–746. [Google Scholar] [CrossRef]
- Amato, F.; Bellarosa, S.; Biscaglia, G.; Catalano, L.; Graziadei, A.; Metta, A.; Murgante, B.; Olivetti, M.L.; Passannante, P.; Percoco, A.; et al. “Serpentone Reload” an Experience of Citizens Involvement in Regeneration of Peripheral Urban Spaces. In Computational Science and Its Applications-ICCSA 2015, Banff, AB, Canada, 22–25 June 2015; Lecture Notes in Computer Science; Gervasi, O., Murgante, B., Misra, S., Gavrilova, M.L., Rocha, A.M.A.C., Torre, C.M., Taniar, D., Apduhan, B.O., Eds.; Springer: Cham, Switzerland, 2015; Volume 9156, Part II, pp. 698–713. [Google Scholar] [CrossRef]
- Rocha, M.C.F.; Pereira, G.C.; Murgante, B. City Visions: Concepts, Conflicts and Participation Analysed from Digital Network Interactions. In Proceedings of the Computational Science and Its Applications-ICCSA 2015, Banff, AB, Canada, 22–25 June 2015; Lecture Notes in Computer Science. Gervasi, O., Murgante, B., Misra, S., Gavrilova, M.L., Rocha, A.M.A.C., Torre, C.M., Taniar, D., Apduhan, B.O., Eds.; Springer: Cham, Switzerland, 2015; Volume 9156, Part II, pp. 714–730. [Google Scholar] [CrossRef]
- Rocha, M.C.F.; Pereira, G.C.; Loiola, E.; Murgante, B. Conversation About the City: Urban Commons and Connected Citizenship. In Computational Science and Its Applications-ICCSA 2016, Beijing, China, 4–7 July 2016; Lecture Notes in Computer Science; Gervasi, O., Murgante, B., Misra, S., Rocha, A.M.A.C., Torre, C.M., Taniar, D., Apduhan, B.O., Stankova, E., Wang, S., Eds.; Springer: Cham, Switzerland, 2016; Volume 9790, Part V, pp. 608–623. [Google Scholar] [CrossRef]
- Murgante, B.; Tilio, L.; Lanza, V.; Scorza, F. Using participative GIS and e-tools for involving citizens of Marmo Platano—Melandro area in European programming activities. J. Balk. Near East. Stud. 2011, 13, 97–115. [Google Scholar] [CrossRef]
- Municipality of Potenza. Documento Strategico ITI Sviluppo Urbano della Città di Potenza; 2017. Available online: http://www.comune.potenza.it/?p=23296 (accessed on 21 December 2019).
- Saganeiti, L.; Favale, A.; Pilogallo, A.; Scorza, F.; Murgante, B. Assessing Urban Fragmentation at Regional Scale Using Sprinkling Indexes. Sustainability 2018, 10, 3274. [Google Scholar] [CrossRef] [Green Version]
- Saganeiti, L.; Pilogallo, A.; Faruolo, G.; Scorza, F.; Murgante, B. Territorial Fragmentation and Renewable Energy Source Plants: Which Relationship? Sustainability 2020, 12, 1828. [Google Scholar] [CrossRef] [Green Version]
- Scorza, F.; Pilogallo, A.; Saganeiti, L.; Murgante, B.; Pontrandolfi, P. Comparing the territorial performances of Renewable Energy Sources’ plants with an integrated Ecosystem Services loss assessment: A case study from the Basilicata region (Italy). Sustain. Cities Soc. 2020, 56, 102082. [Google Scholar] [CrossRef]
- Carbone, R.; Fortunato, G.; Pace, G.; Pastore, E.; Pietragalla, L.; Postiglione, L.; Scorza, F. Using open data and open tools in defining strategies for the enhancement of Basilicata Region. In Computational Science and Its Applications-ICCSA 2018, Melbourne, VIC, Australia, 2–5 July 2018; Lecture Notes in Computer Science; Gervasi, O., Murgante, B., Misra, S., Stankova, E., Torre, C.M., Rocha, A.M.A.C., Taniar, D., Apduhan, B.O., Tarantino, E., Ryu, Y., Eds.; Springer: Cham, Switzerland, 2018; Volume 10964, Part V, pp. 725–733. [Google Scholar] [CrossRef]
- Curatella, L.; Scorza, F. Polycentrism and Insularity Metrics for In-Land Areas. In Lecture Notes in Computer Science (Including Subseries Lecture Notes in Artificial Intelligence and Lecture Notes in Bioinformatics; Gervasi, O., Murgante, B., Misra, S., Garau, C., Blečić, I., Taniar, D., Apduhan, B.O., Rocha, A.M.A.C., Tarantino, E., Torre, C.M., et al., Eds.; Springer: Cham, Switzerland, 2020; Volume 12255 LNCS. [Google Scholar] [CrossRef]
- Moniruzzaman, M.; Paez, A. An investigation of the attributes of walkable environments from the perspective of seniors in Montreal. J. Transp. Geogr. 2016, 51, 85–96. [Google Scholar] [CrossRef]
- Song, Y.; Merlin, L.; Rodriguez, D. Comparing measures of urban land use mix. Comput. Environ. Urban Syst. 2013, 42, 1–13. [Google Scholar] [CrossRef]
- Laouar, D.; Mazouz, S.; Teller, J. Spatial accessibility and urban fragmentation in colonial cities. The case of Annaba city. Cybe Geo 2019. [Google Scholar] [CrossRef]
- Cutini, V.; Di Pinto, V.; Rinaldi, A.M.; Rossini, F. Proximal Cities: Does Walkability Drive Informal Settlements? Sustainability 2020, 12, 756. [Google Scholar] [CrossRef] [Green Version]
- Omer, I.; Rofè, Y.; Lerman, Y. The impact of planning on pedestrian movement: Contrasting pedestrian movement models in pre-modern and modern neighborhoods in Israel. Int. J. Geogr. Inf. Sci. 2015, 29. [Google Scholar] [CrossRef]
- Fortunato, G.; Scorza, F.; Murgante, B. Hybrid Oriented Sustainable Urban Development: A Pattern of Low-Carbon Access to Schools in the City of Potenza. In Computational Science and Its Applications-ICCSA 2020, Cagliari, Italy, 1–4 July; Lecture Notes in Computer Science; Gervasi, O., Murgante, B., Misra, S., Garau, C., Blečić, I., Taniar, D., Apduhan, B.O., Rocha, A.M.A.C., Tarantino, E., Torre, C.M., et al., Eds.; Springer: Cham, Switzerland, 2020; Volume 12255, Part VII, pp. 193–205. [Google Scholar] [CrossRef]
- Santopietro, L.; Scorza, F. The Italian Experience of the Covenant of Mayors: A Territorial Evaluation. Sustainability 2021, 13, 1289. [Google Scholar] [CrossRef]
- Scorza, F.; Santopietro, L. A systemic perspective for the Sustainable Energy and Climate Action Plan (SECAP). Eur. Plan. Stud. in printing.
- Pilogallo, A.; Scorza, F. Mapping regulation ecosystem services (ReMES) specialization in Italy. J. Urban Plan. Dev. in printing.
Figure 1.
Traditional approach of public participation based on public meeting in C.A.S.T. project.

Figure 2.
Space Syntax based topological integration analysis of a neighborhood block’s street network.
Figure 2.
Space Syntax based topological integration analysis of a neighborhood block’s street network.

Figure 3.
Location of the area of project CAST: the neighbourhood of “Poggio Tre Galli”, the “G area” and the district called “Study Centre”.
Figure 3.
Location of the area of project CAST: the neighbourhood of “Poggio Tre Galli”, the “G area” and the district called “Study Centre”.

Figure 4.
Axial map of the study area.

Figure 5.
Topological connectivity calculated on the axial map of the study area. (a) Existing road network; (b) existing road network including pedestrian paths.
Figure 5.
Topological connectivity calculated on the axial map of the study area. (a) Existing road network; (b) existing road network including pedestrian paths.

Figure 6.
Global topological integration (r = n). (a) Existing road network; (b) existing road network including pedestrian paths.
Figure 6.
Global topological integration (r = n). (a) Existing road network; (b) existing road network including pedestrian paths.

Figure 7.
Local topological integration (r = 3). (a) Existing road network; (b) existing road network including pedestrian paths.
Figure 7.
Local topological integration (r = 3). (a) Existing road network; (b) existing road network including pedestrian paths.

Figure 8.
Global topological choice (r = n). (a) Existing road network; (b) existing road network including pedestrian paths.
Figure 8.
Global topological choice (r = n). (a) Existing road network; (b) existing road network including pedestrian paths.

Figure 9.
Local topological choice (r = 3). (a) Existing road network; (b) existing road network including pedestrian paths.
Figure 9.
Local topological choice (r = 3). (a) Existing road network; (b) existing road network including pedestrian paths.

Figure 10.
Intelligibility values at the global scale (r = n).

Figure 11.
Synergy values.

Figure 12.
Movement interface index (r = n).

Figure 13.
Movement interface index (r = 3).

Figure 14.
Map of current status of pedestrian mobility within the study area.

Figure 15.
Map of strategic pedestrian mobility design within the study area.

Figure 16.
Topological connectivity calculated on the project network.

Figure 17.
(a) Global Topological integration (r = n) and (b) local topological integration (r = 3) calculated on the project network.
Figure 17.
(a) Global Topological integration (r = n) and (b) local topological integration (r = 3) calculated on the project network.

Figure 18.
(a) Global topological choice (r = n) and (b) local topological choice (r = 3) calculated on the project network.
Figure 18.
(a) Global topological choice (r = n) and (b) local topological choice (r = 3) calculated on the project network.

Figure 19.
(a) Topological connectivity of existing pedestrian route network; (b) topological connectivity of project pedestrian route network.
Figure 19.
(a) Topological connectivity of existing pedestrian route network; (b) topological connectivity of project pedestrian route network.

Figure 20.
(a) Global topological integration of existing pedestrian route network; (b) global topological integration of project pedestrian route network.
Figure 20.
(a) Global topological integration of existing pedestrian route network; (b) global topological integration of project pedestrian route network.

Figure 21.
(a) Local topological integration of existing pedestrian route network; (b) local topological integration of project pedestrian route network.
Figure 21.
(a) Local topological integration of existing pedestrian route network; (b) local topological integration of project pedestrian route network.


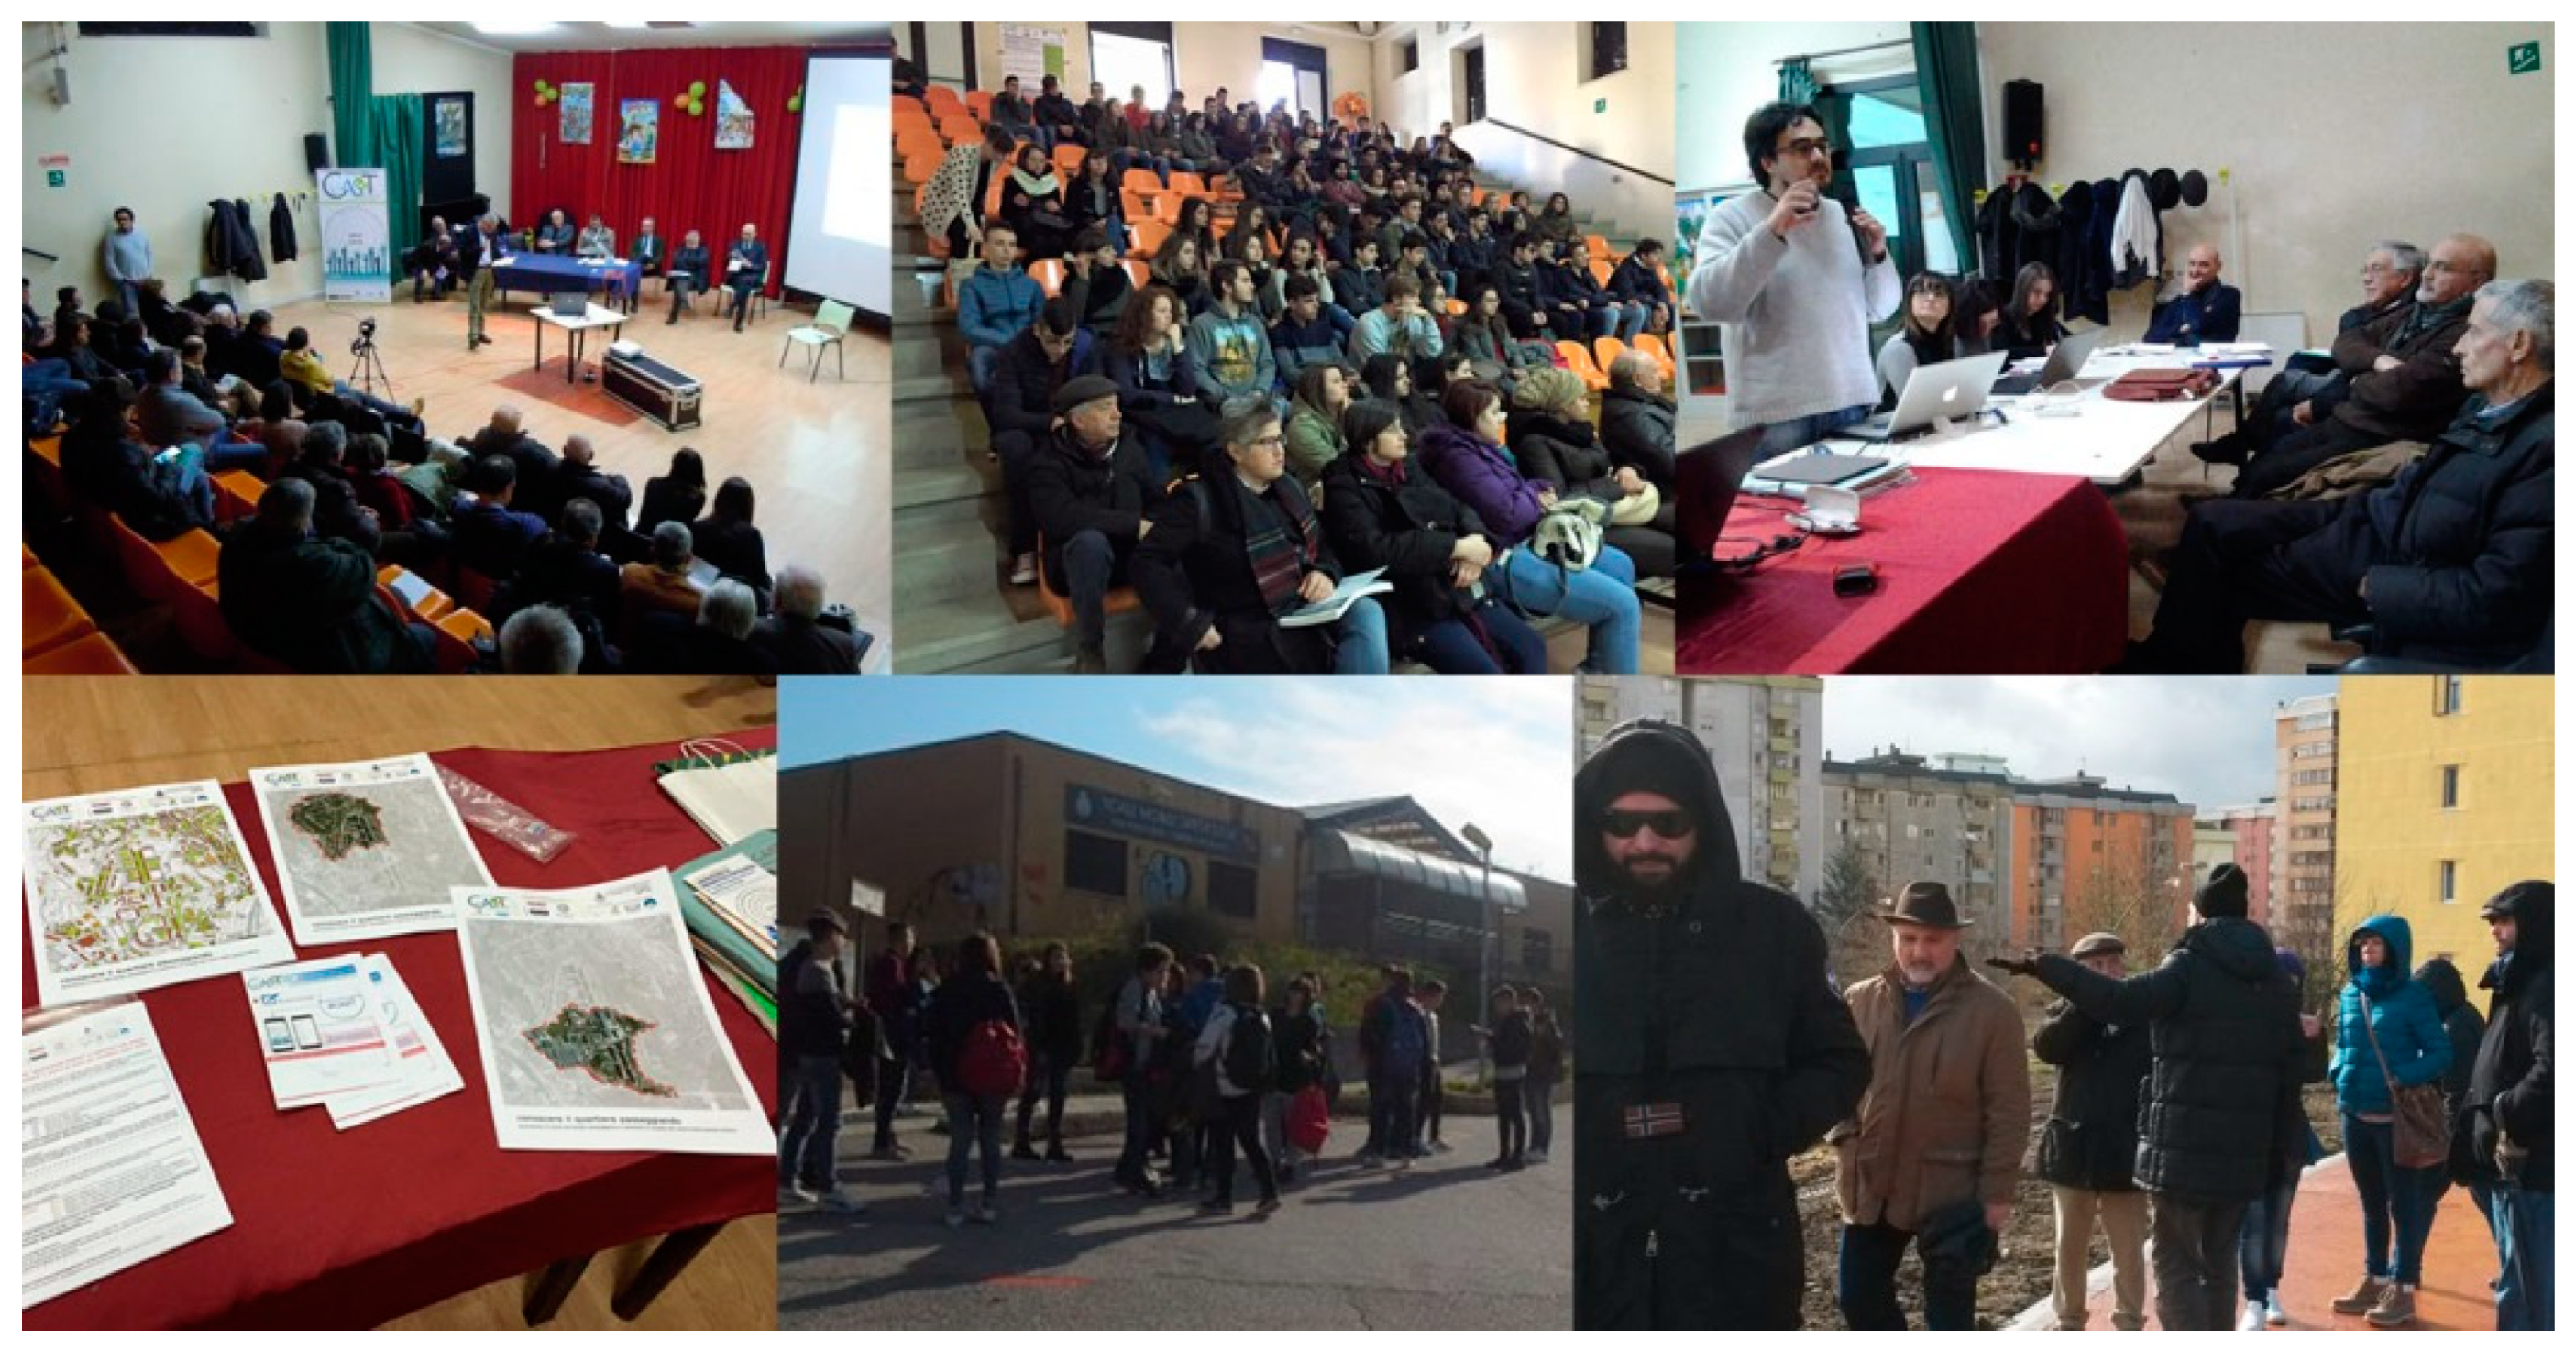
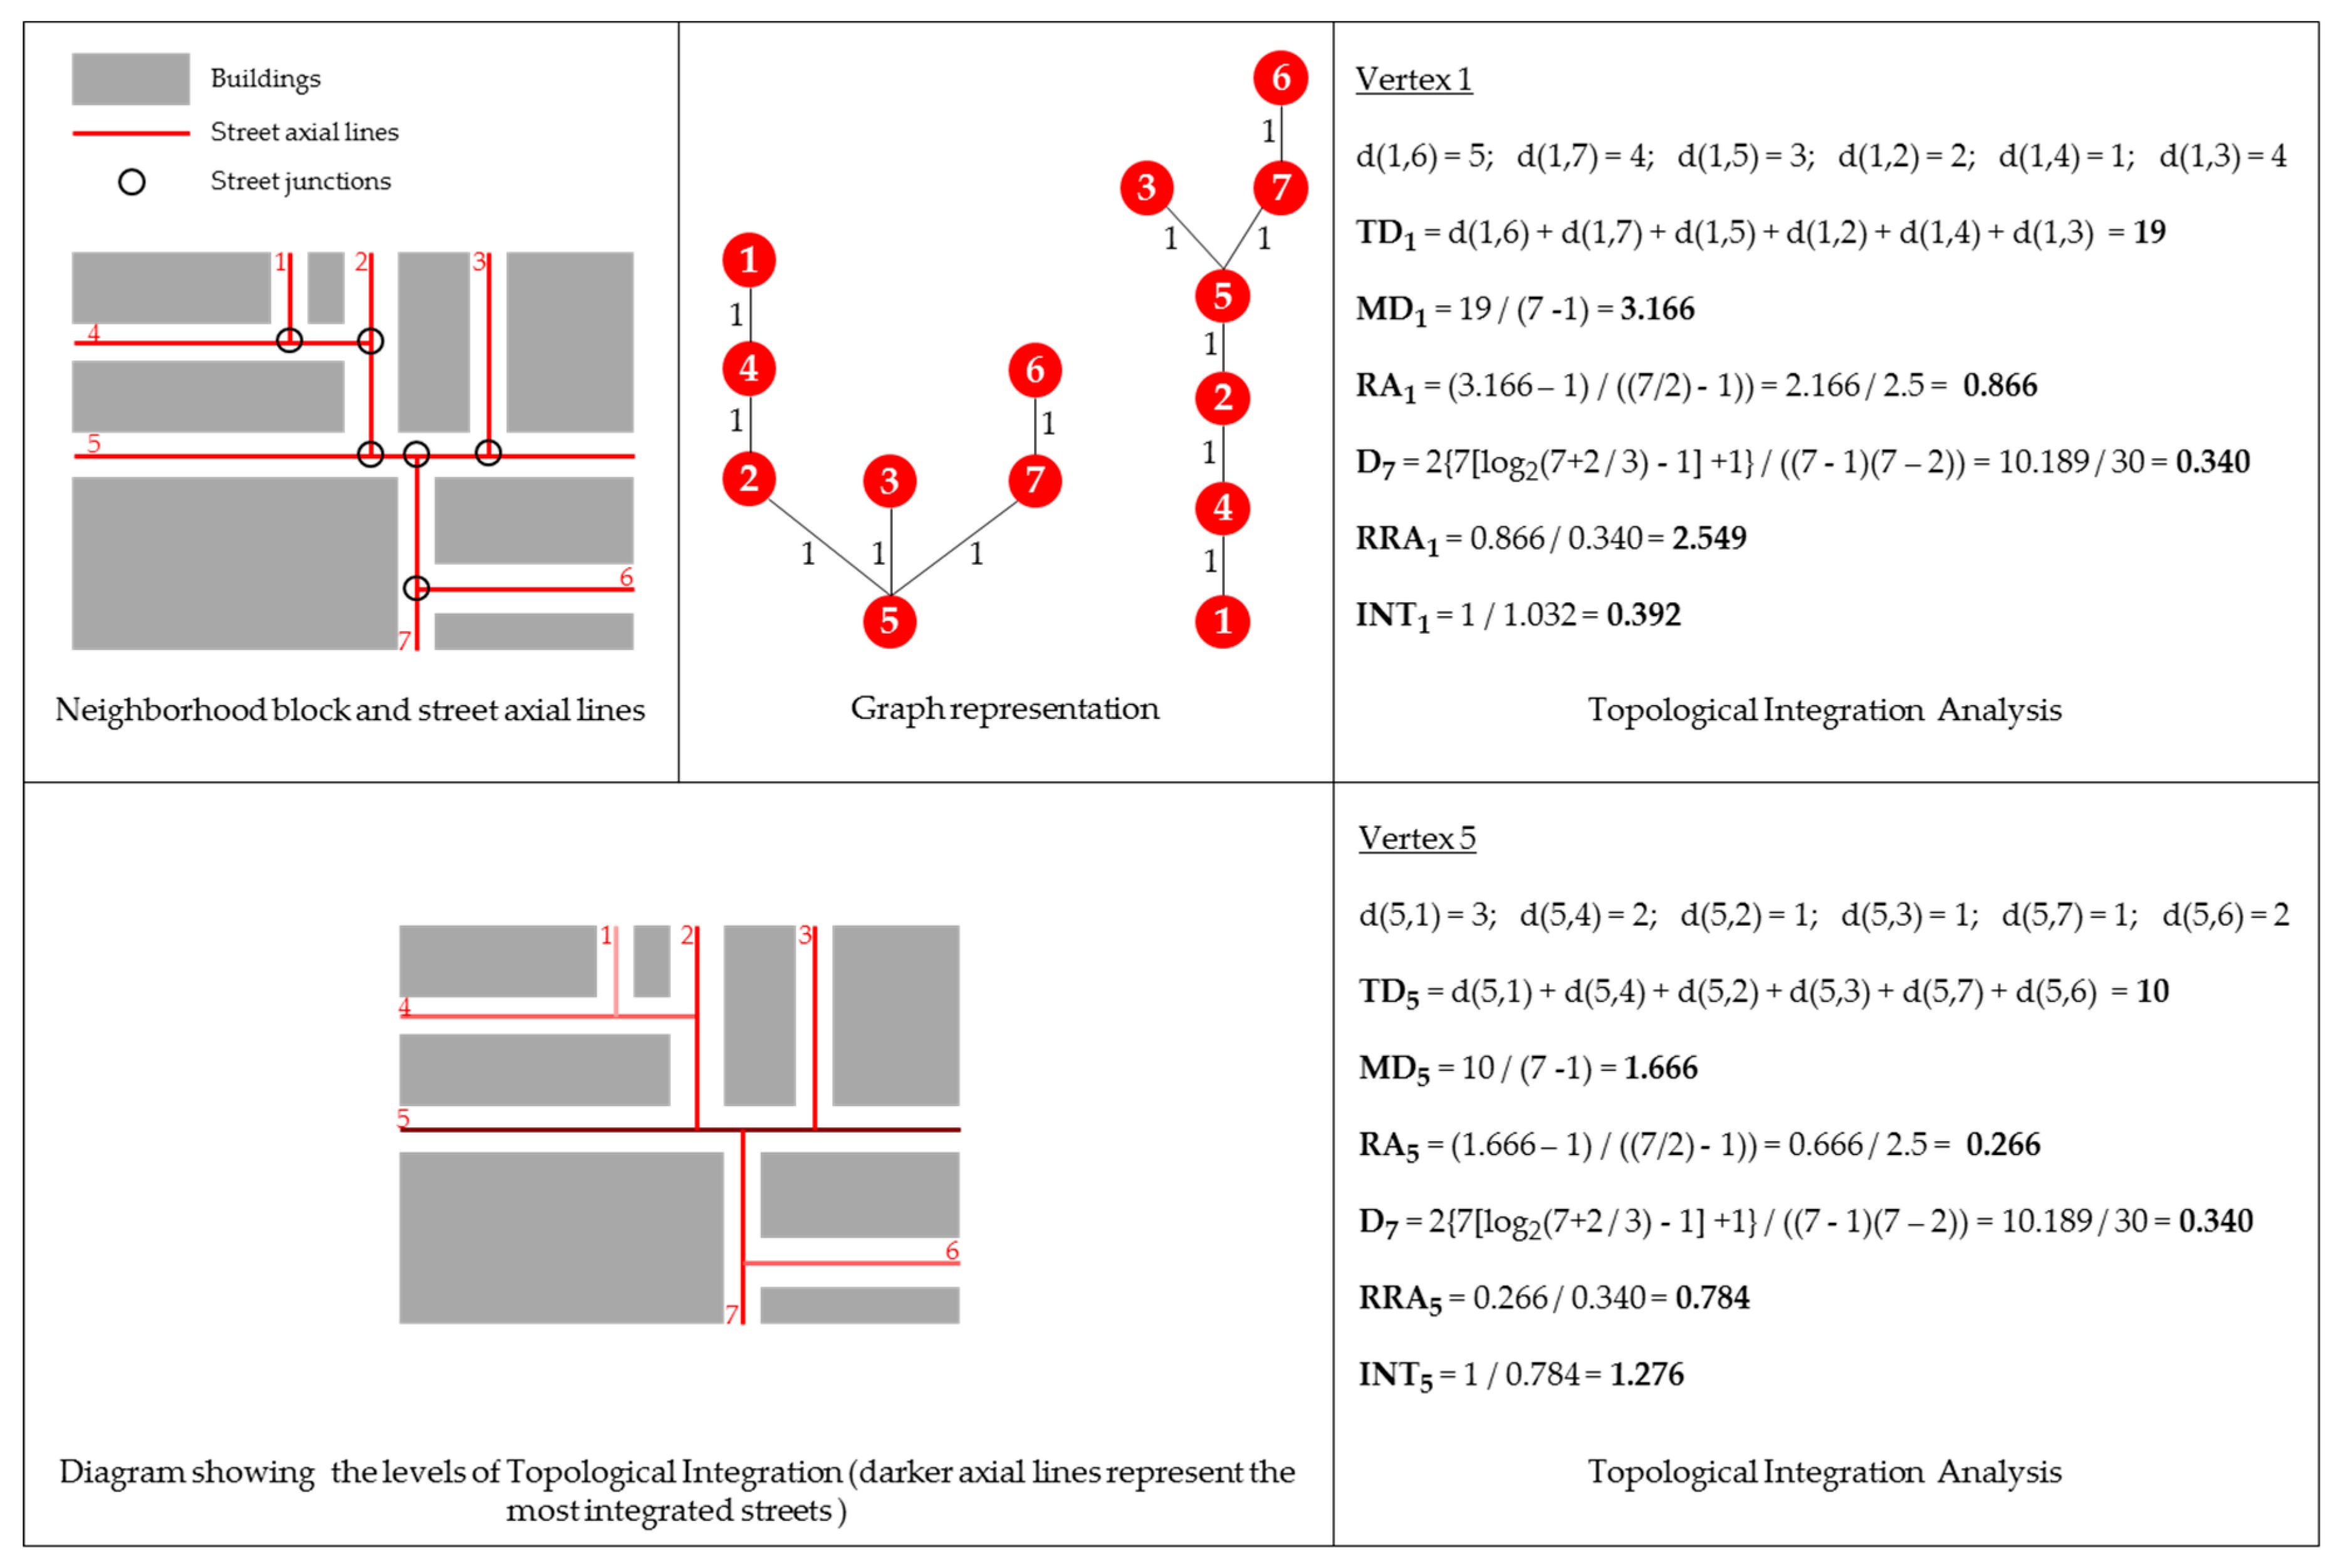
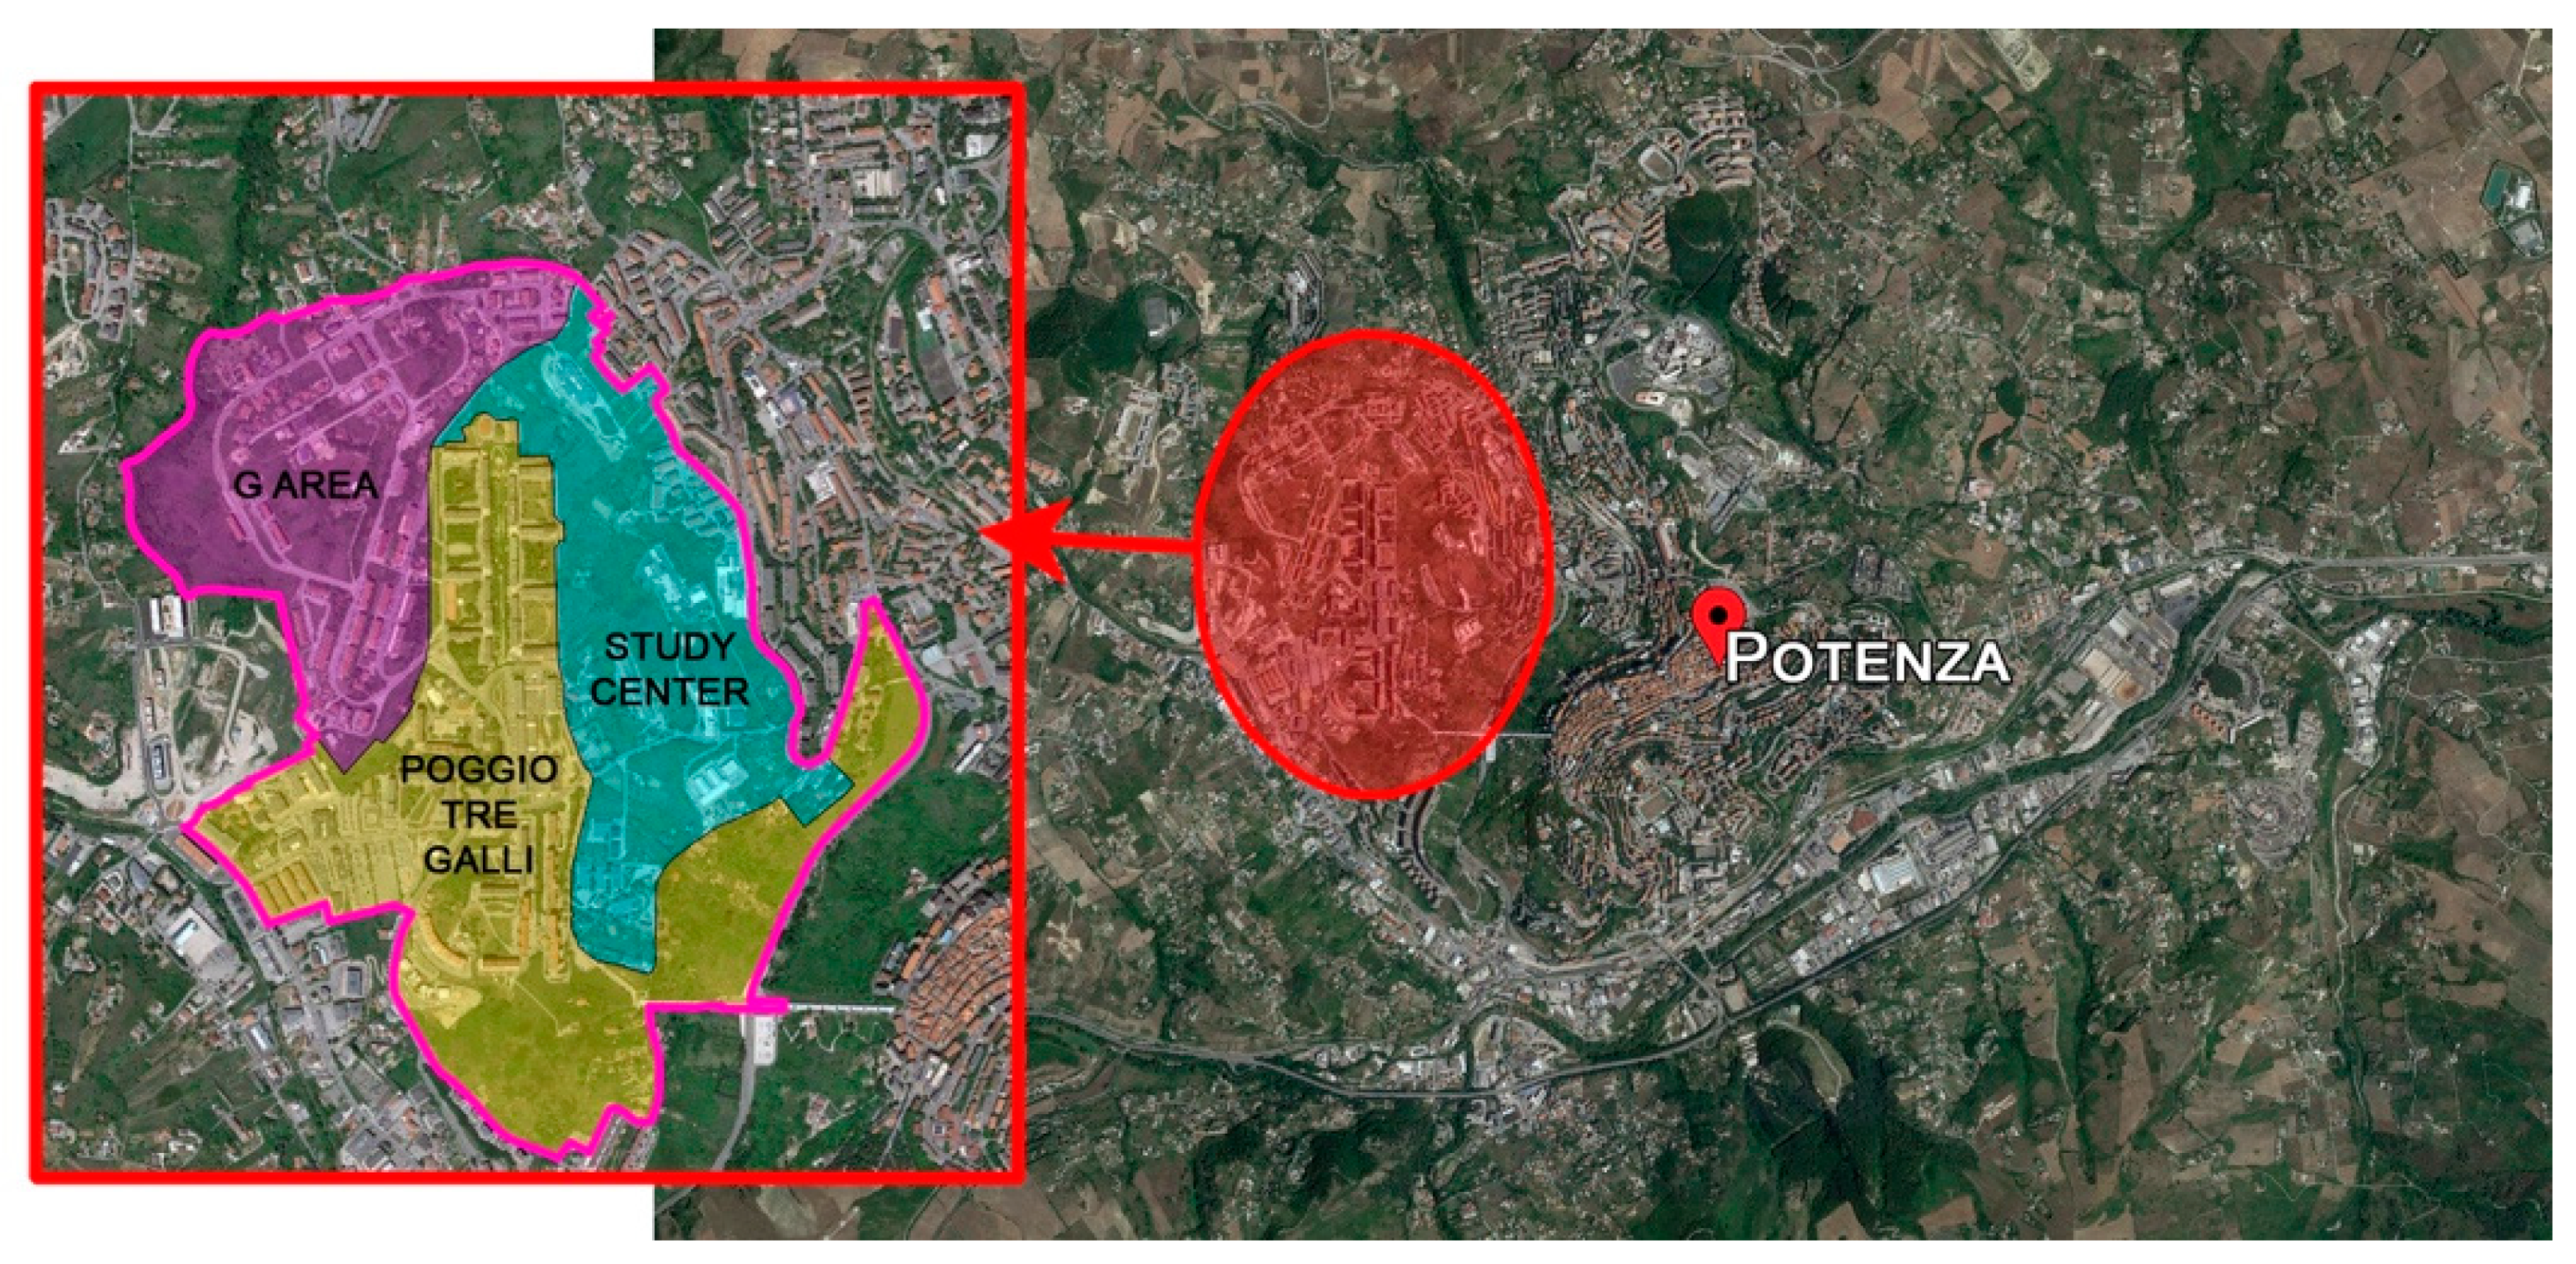
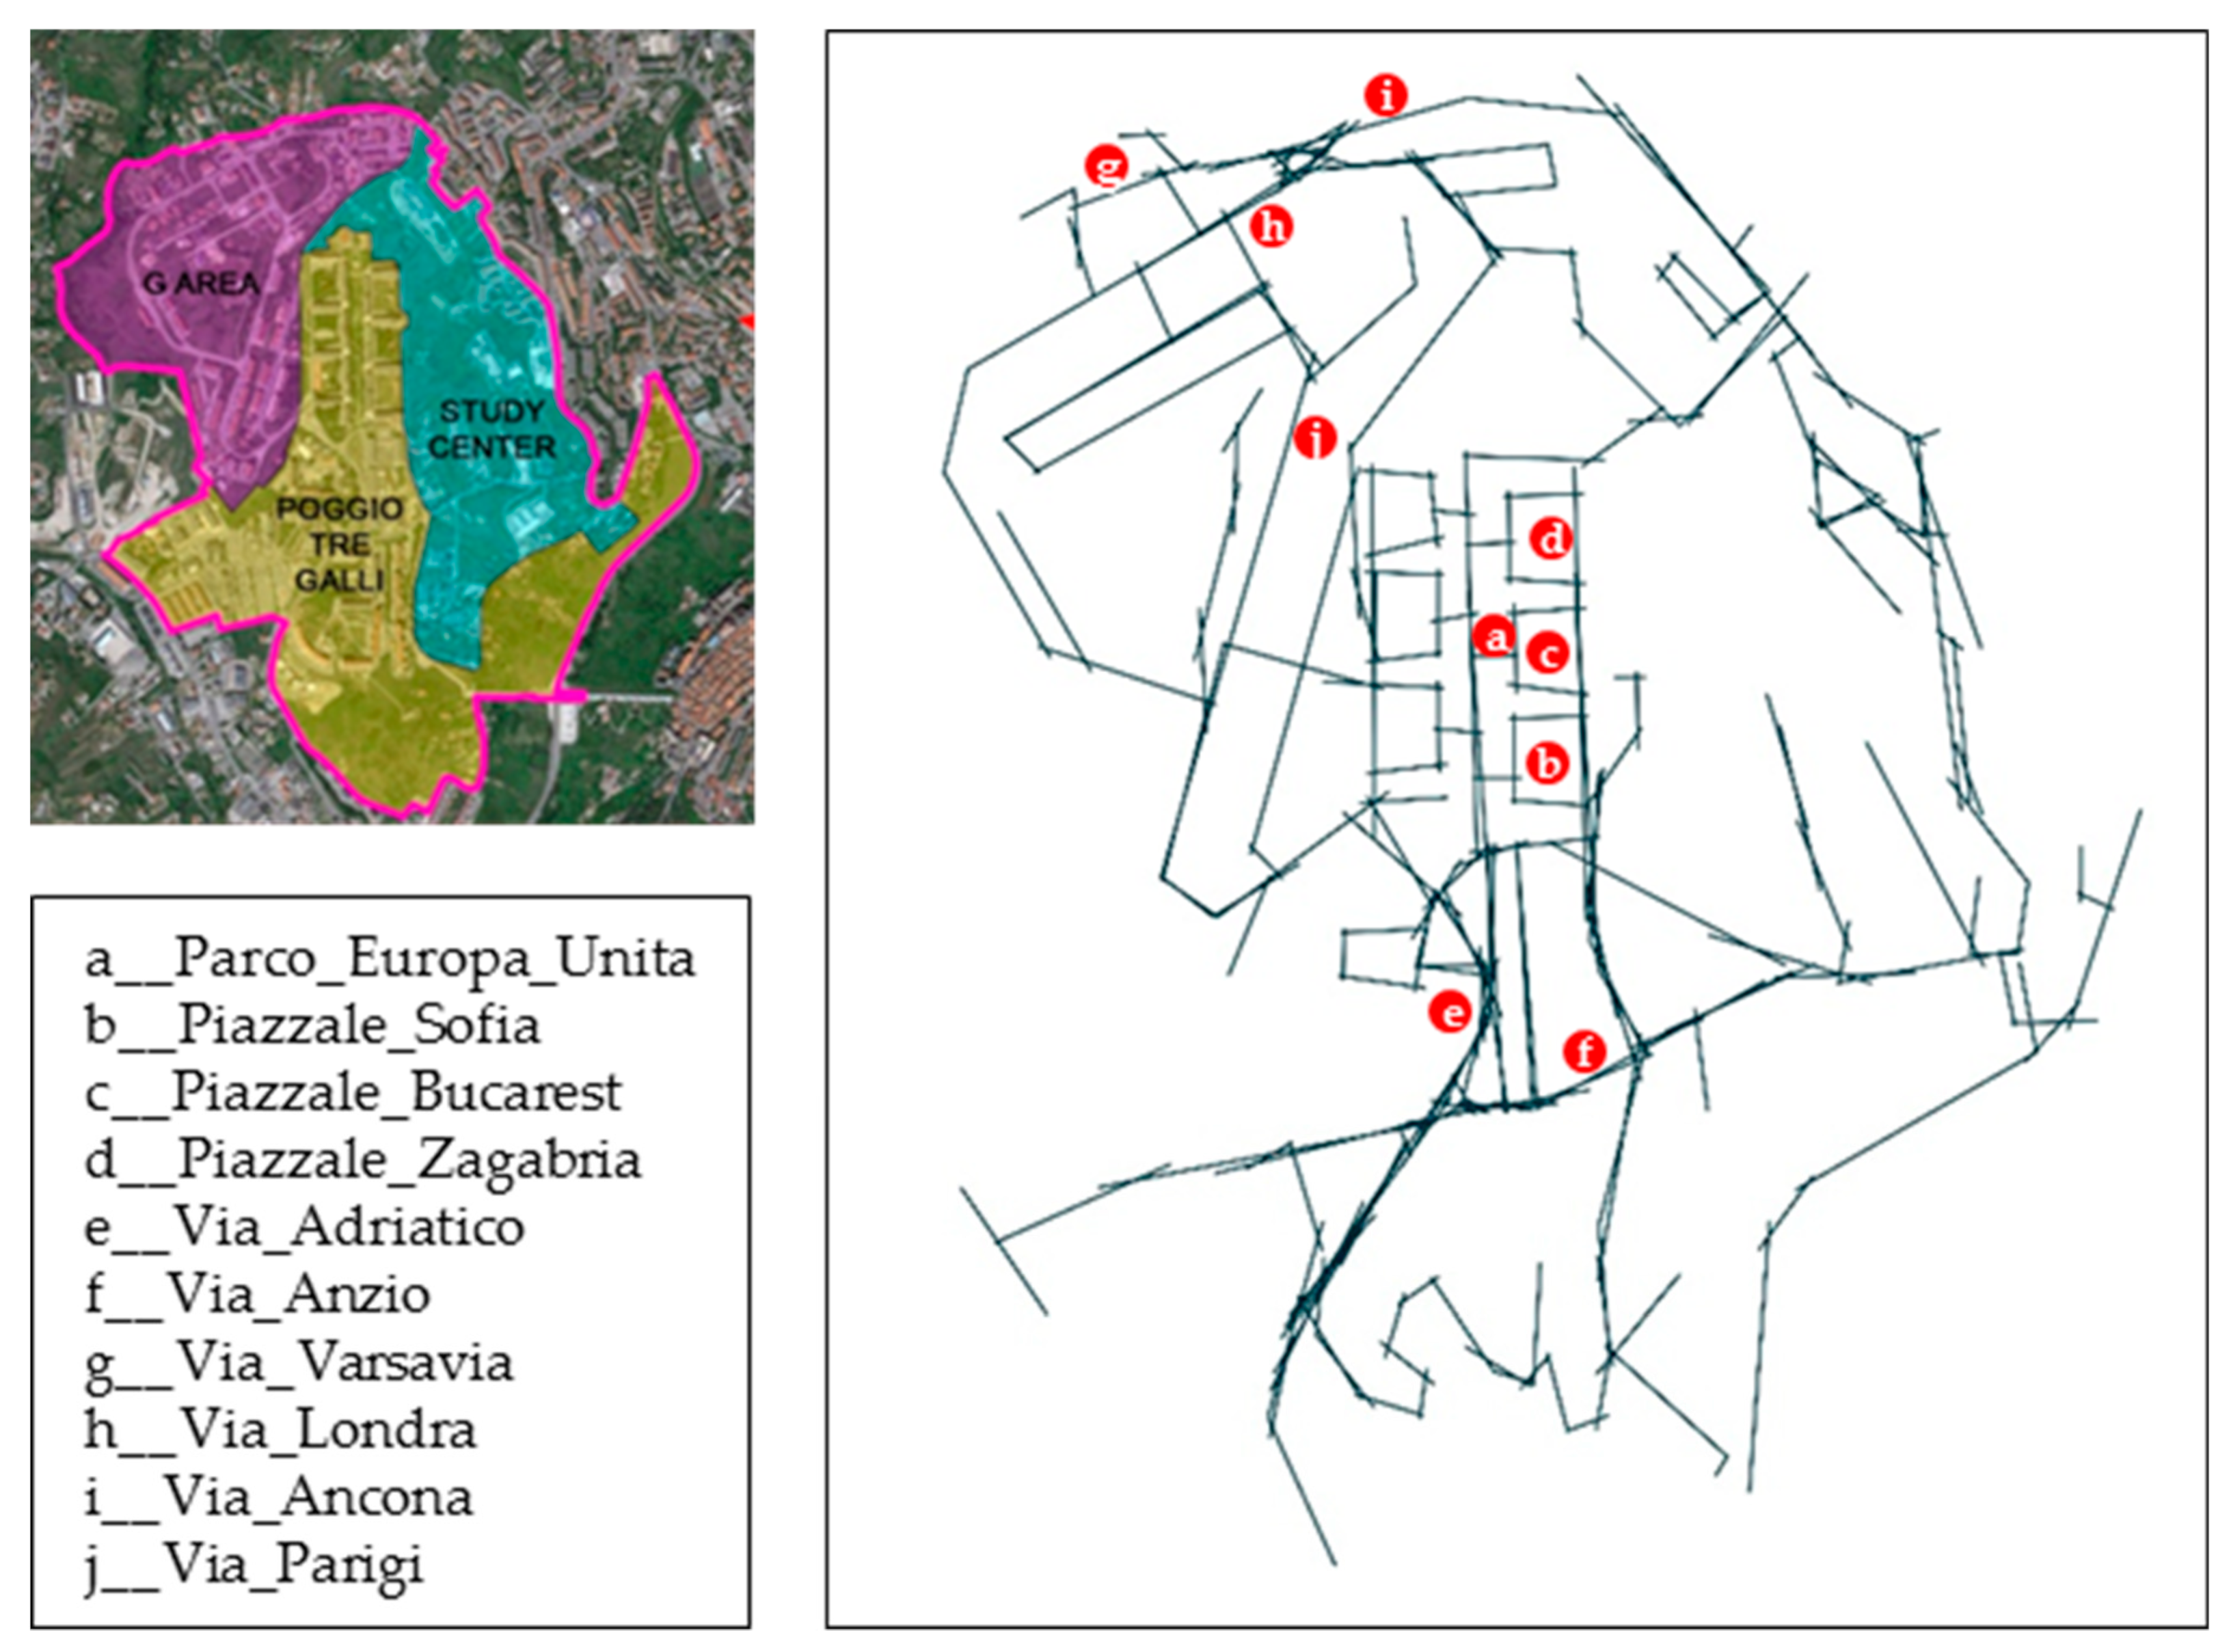
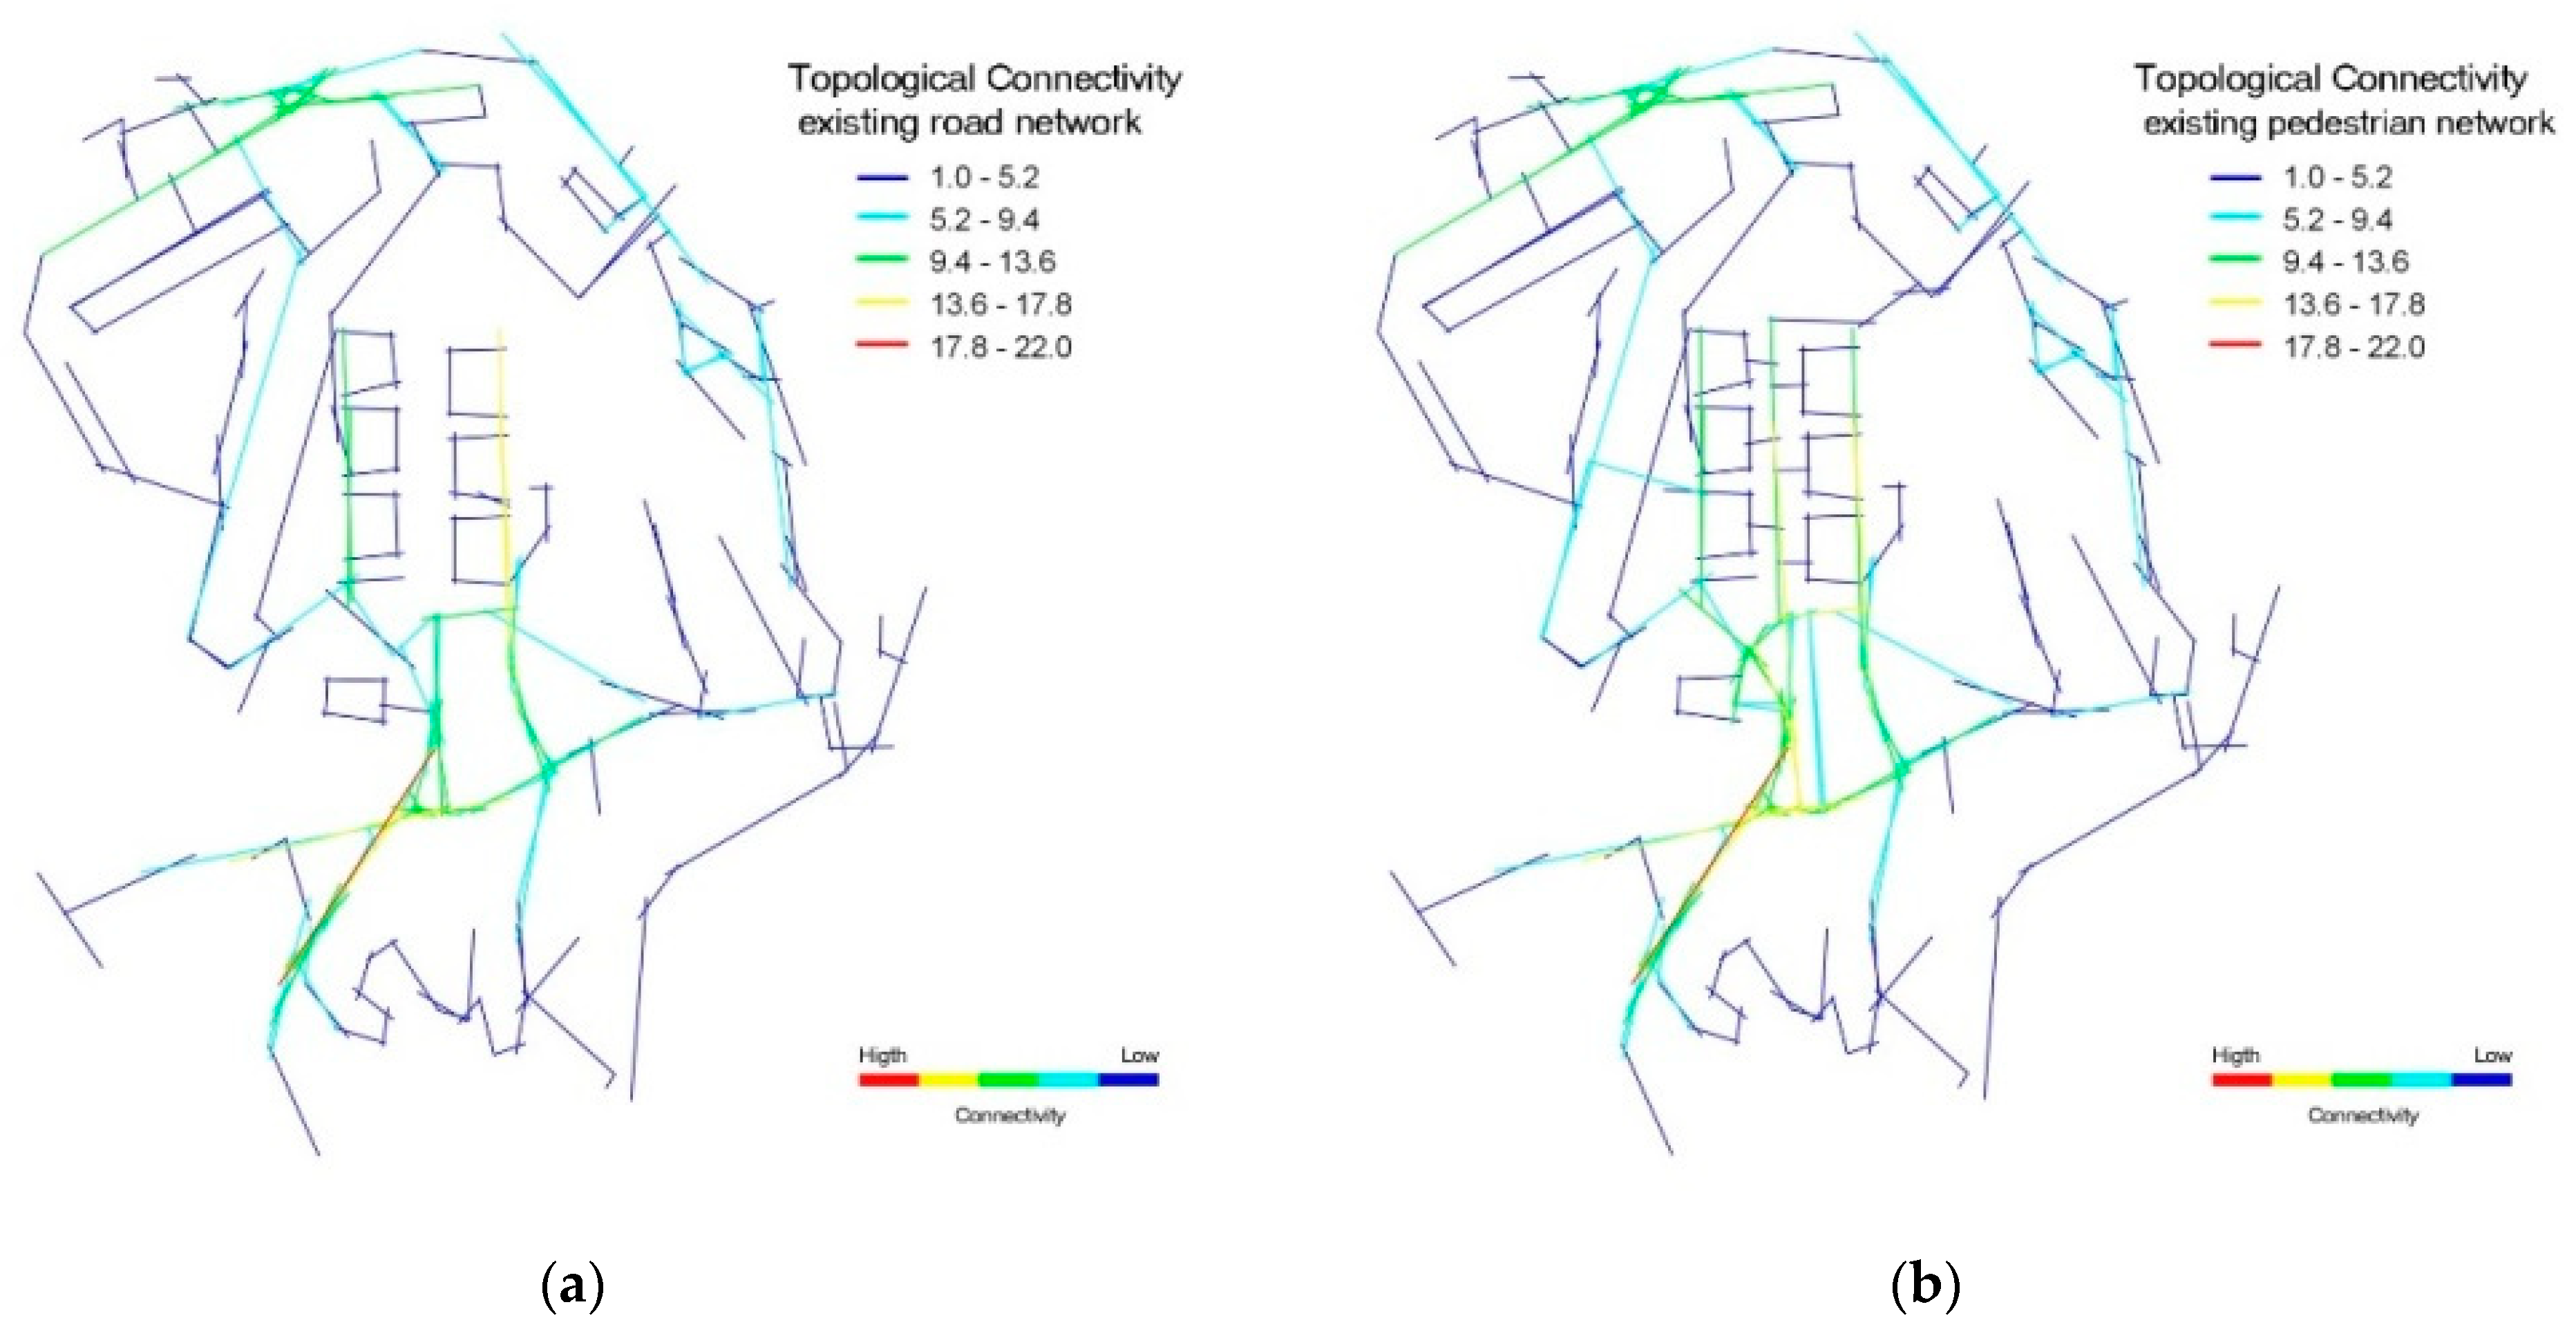
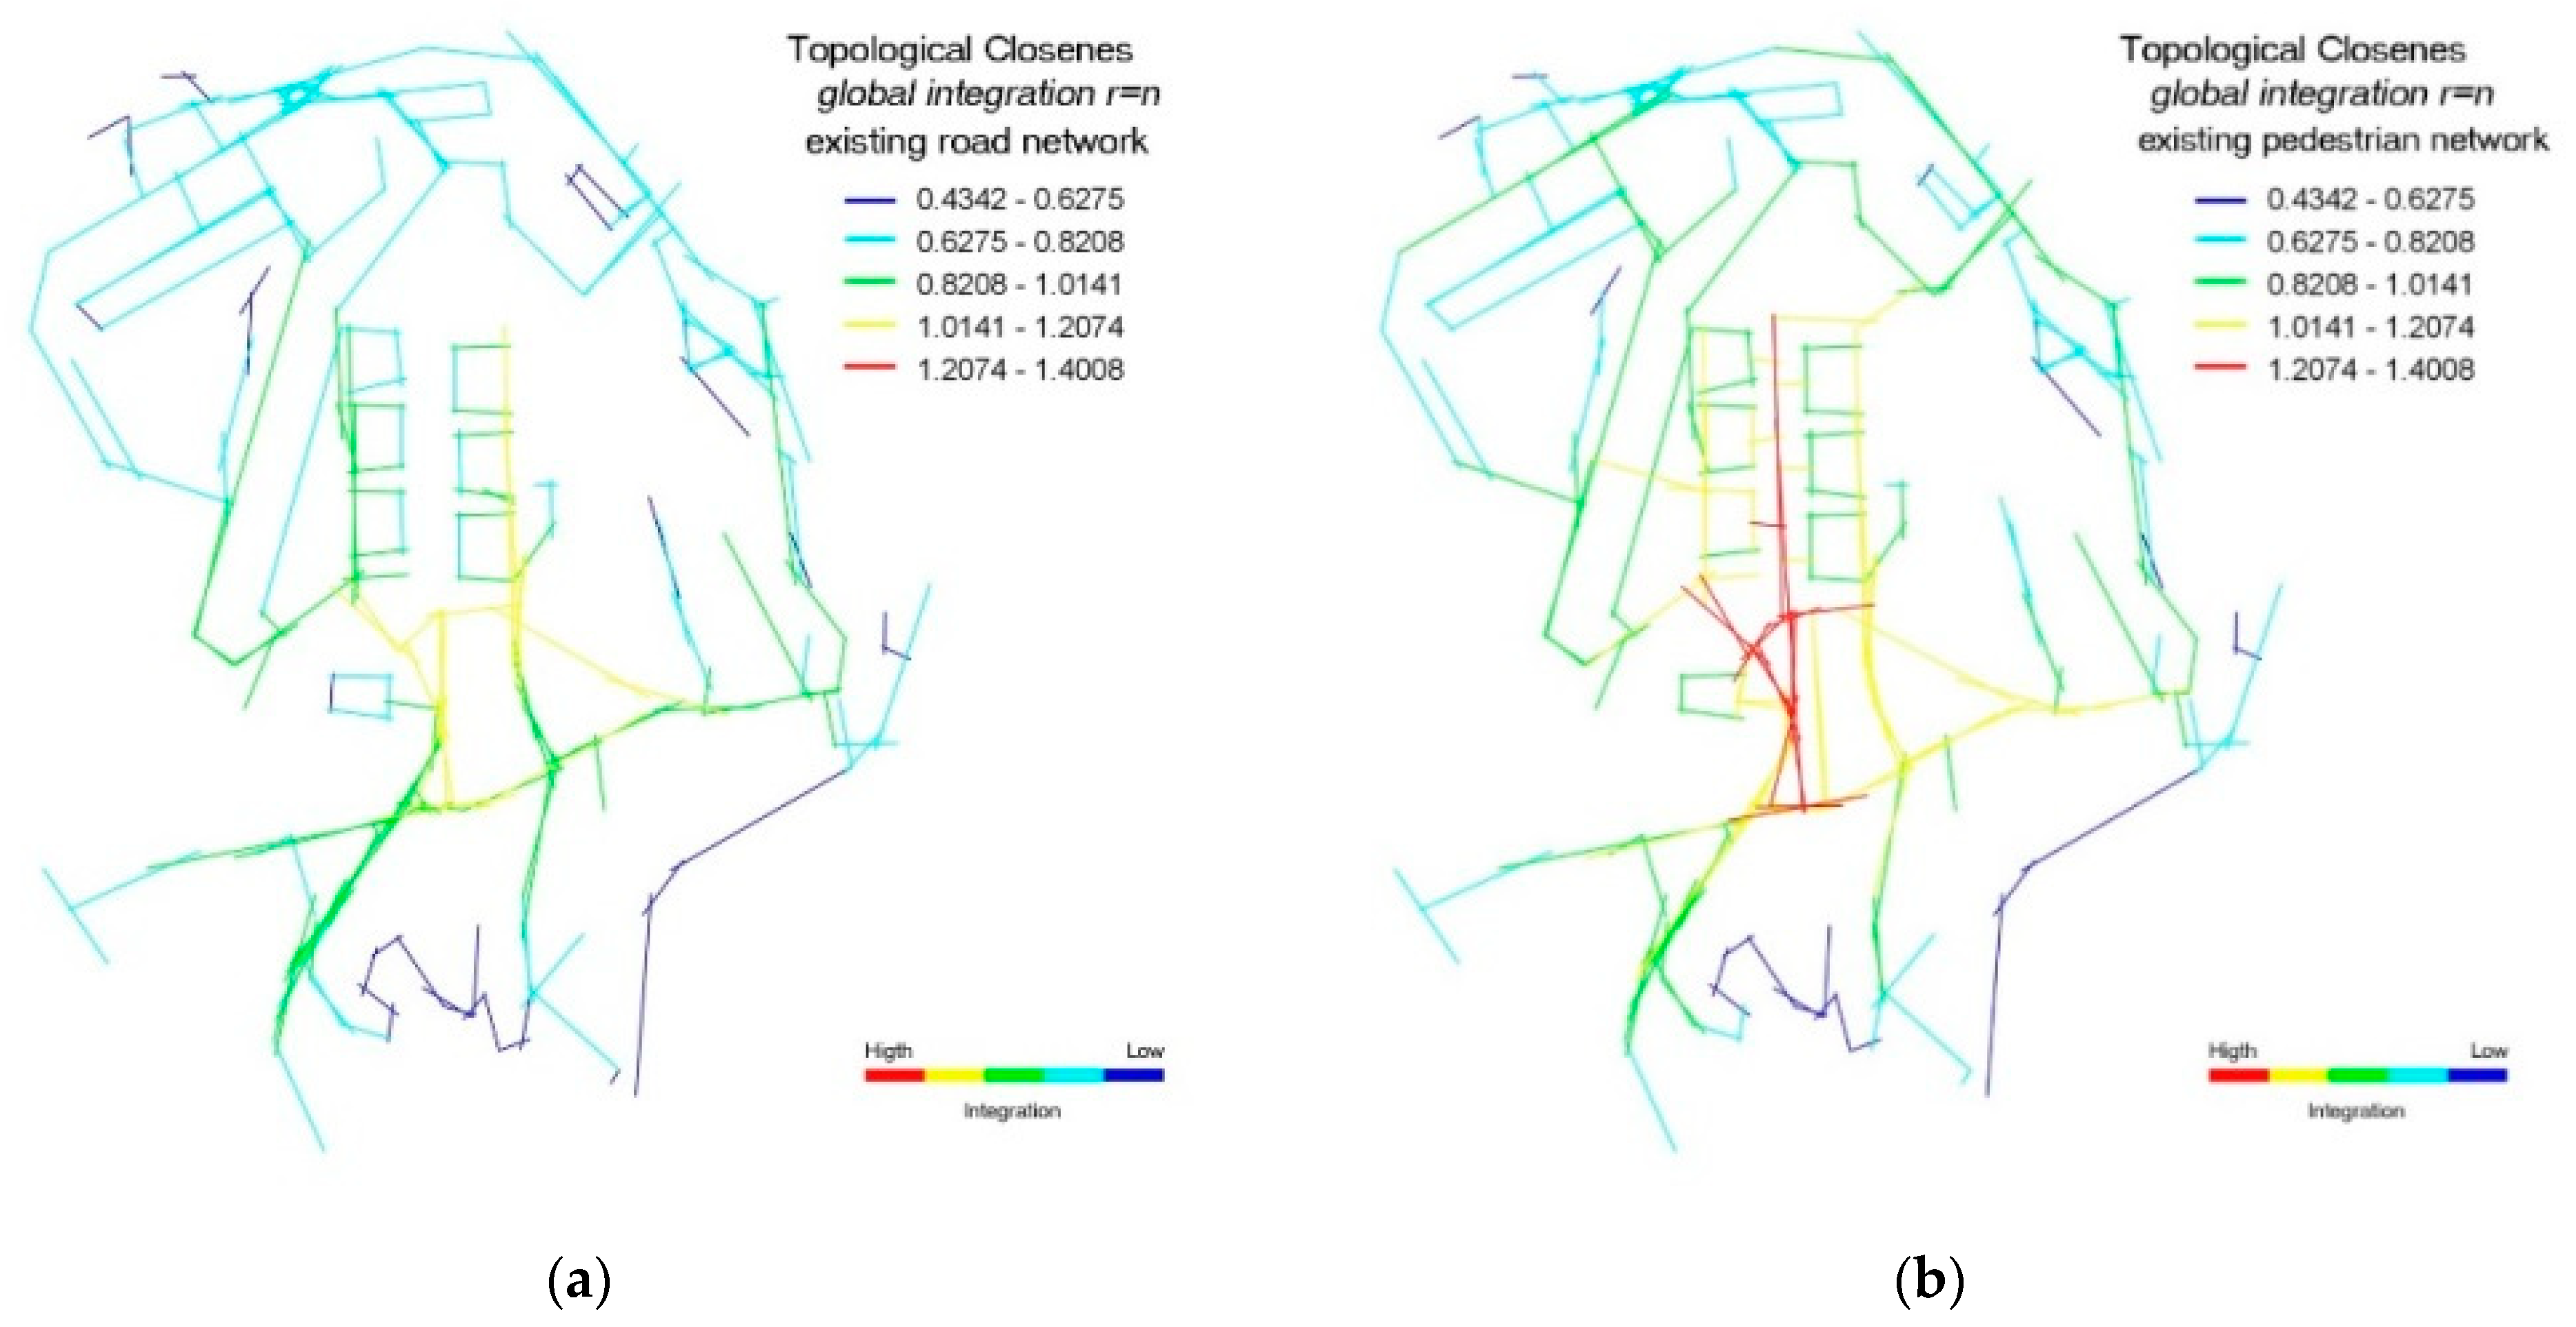
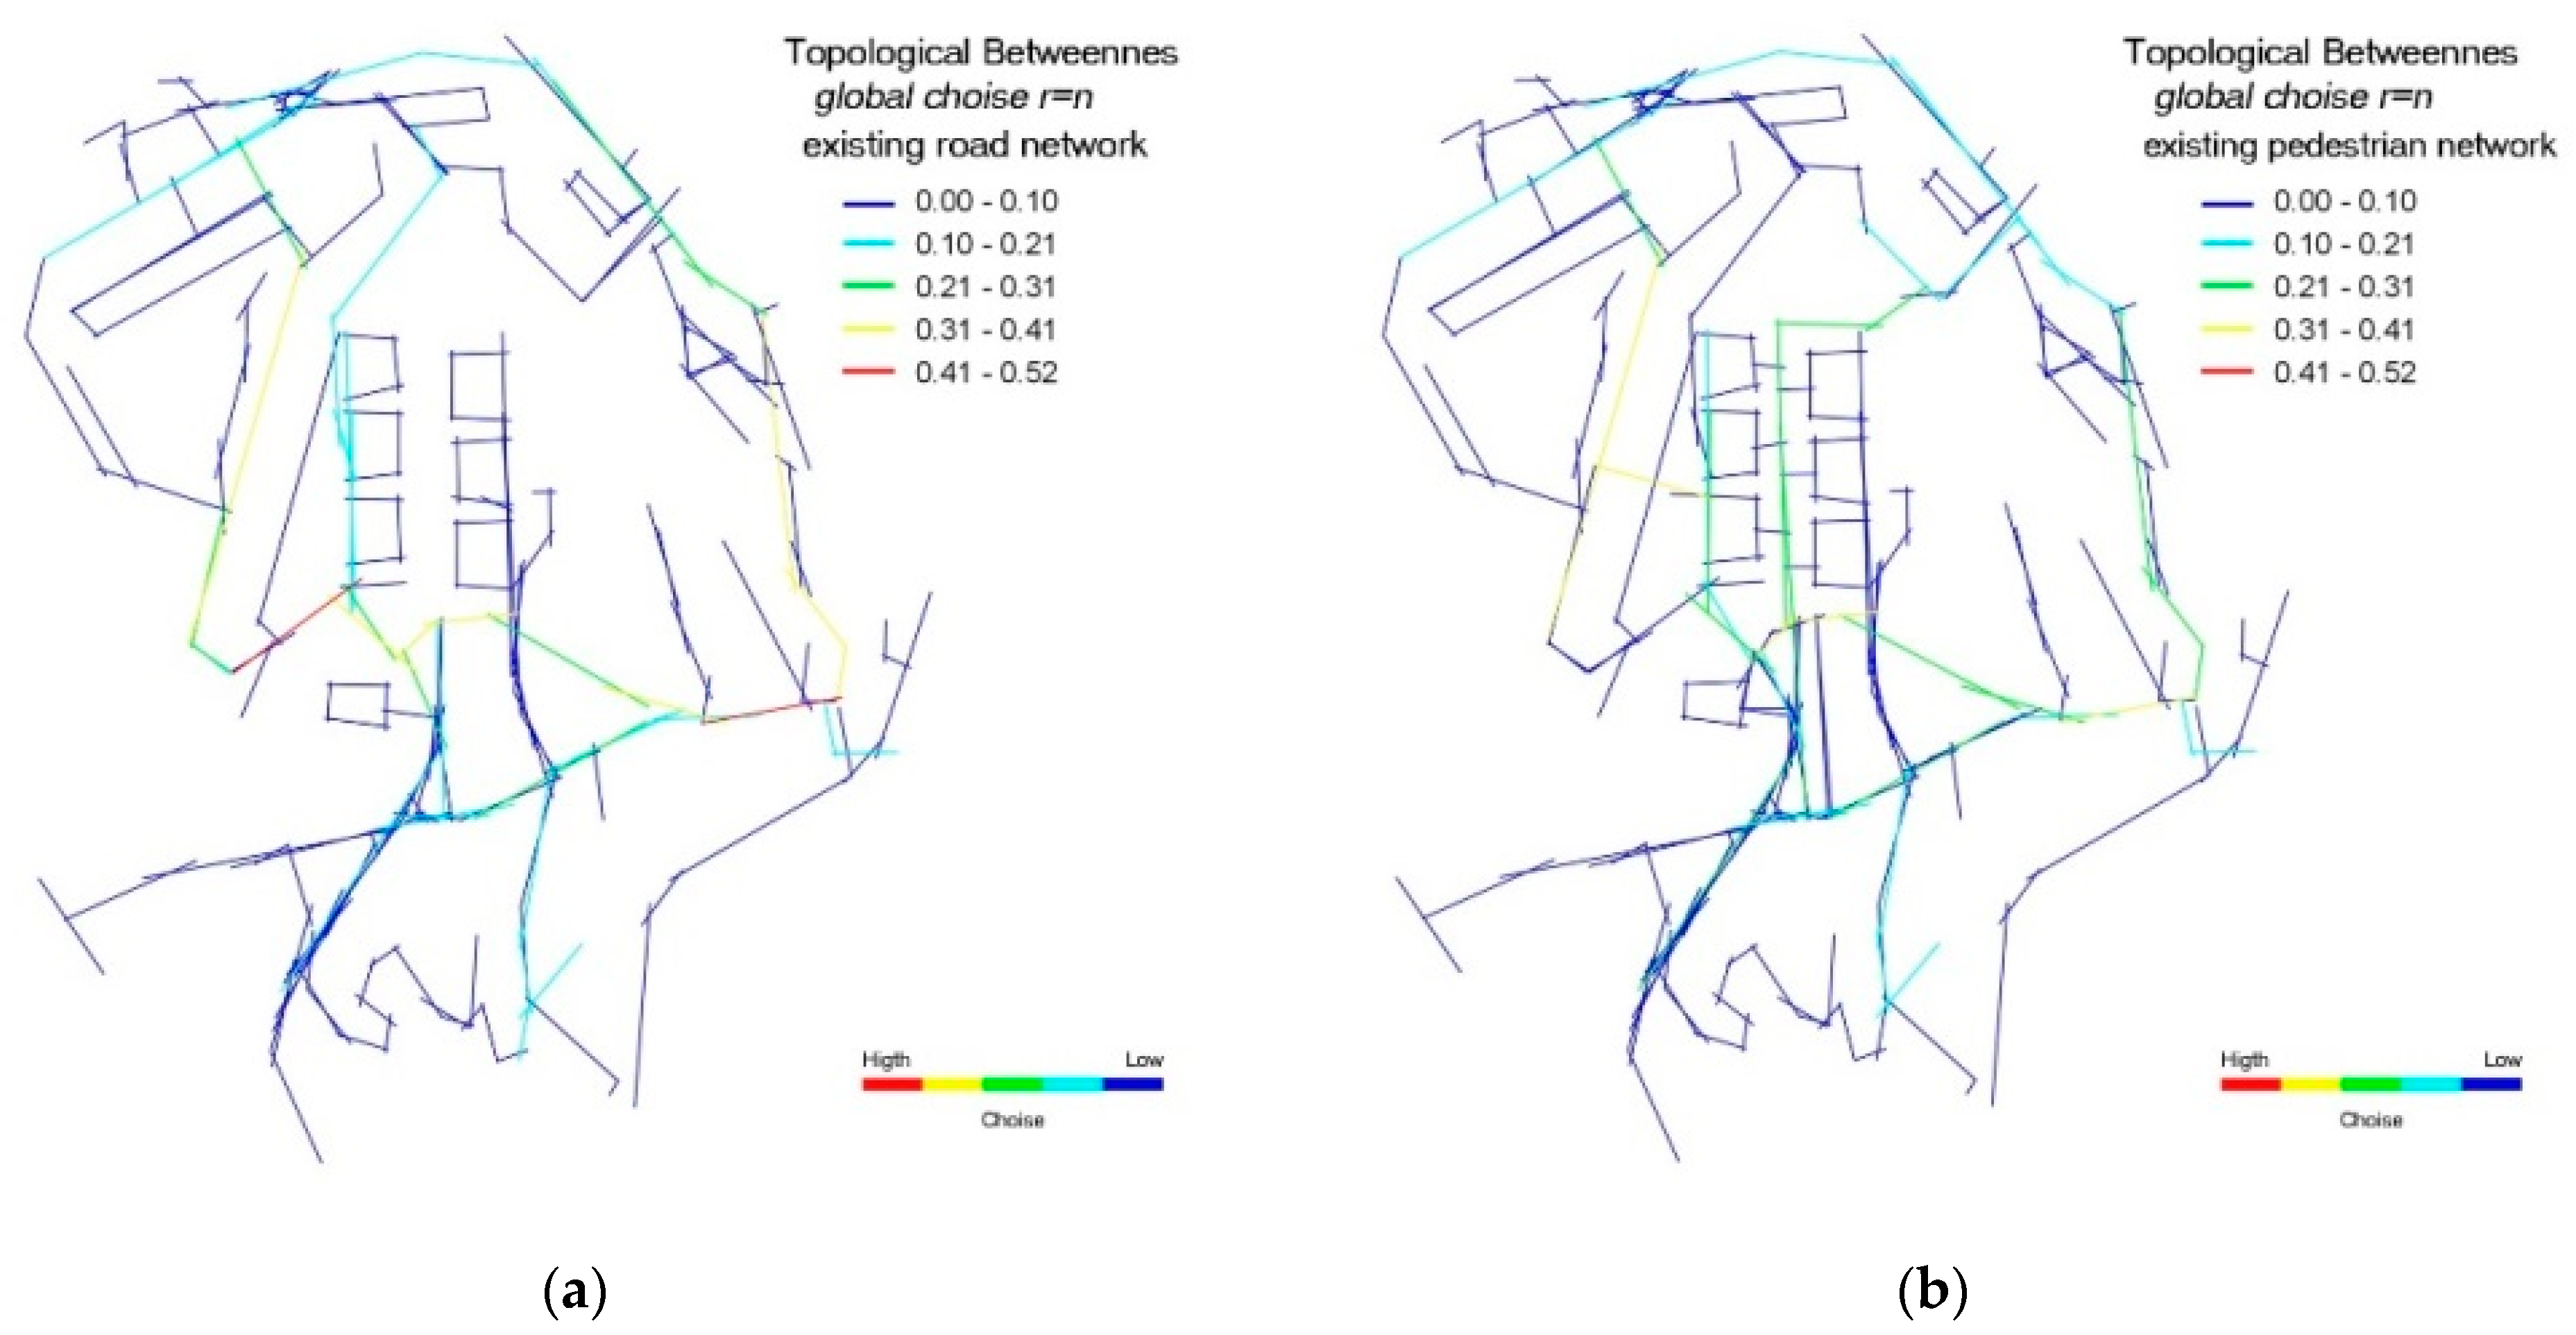
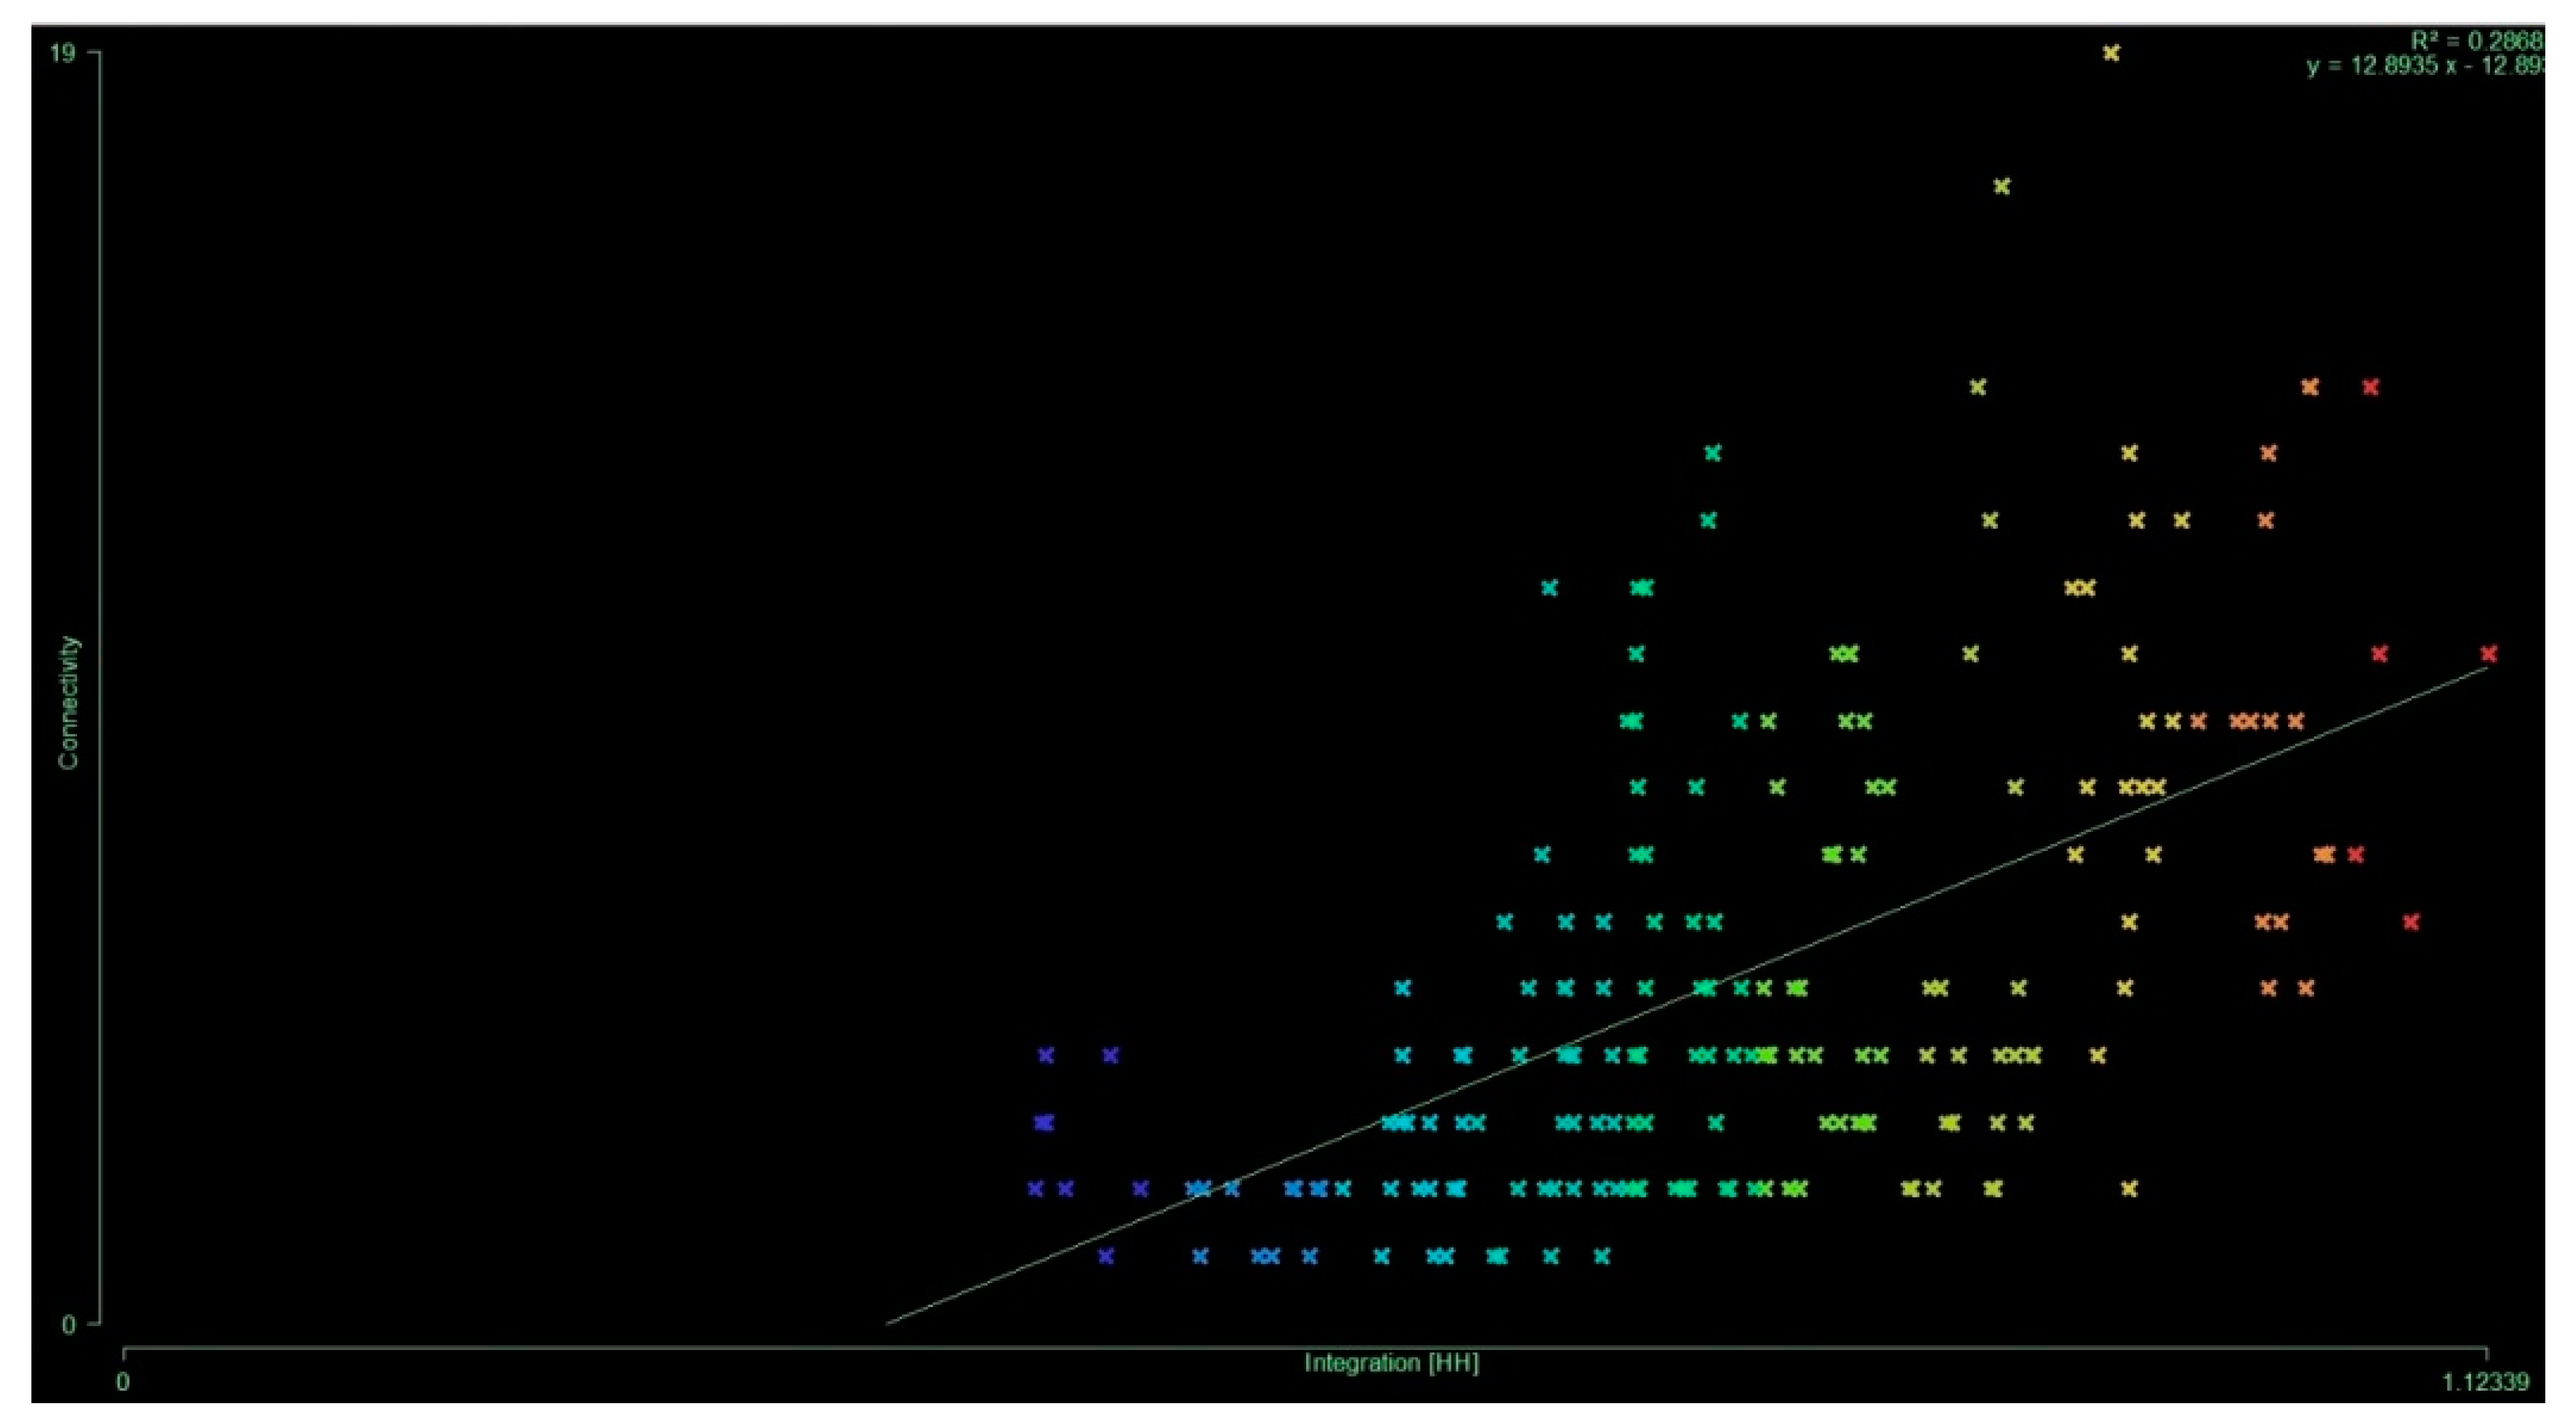
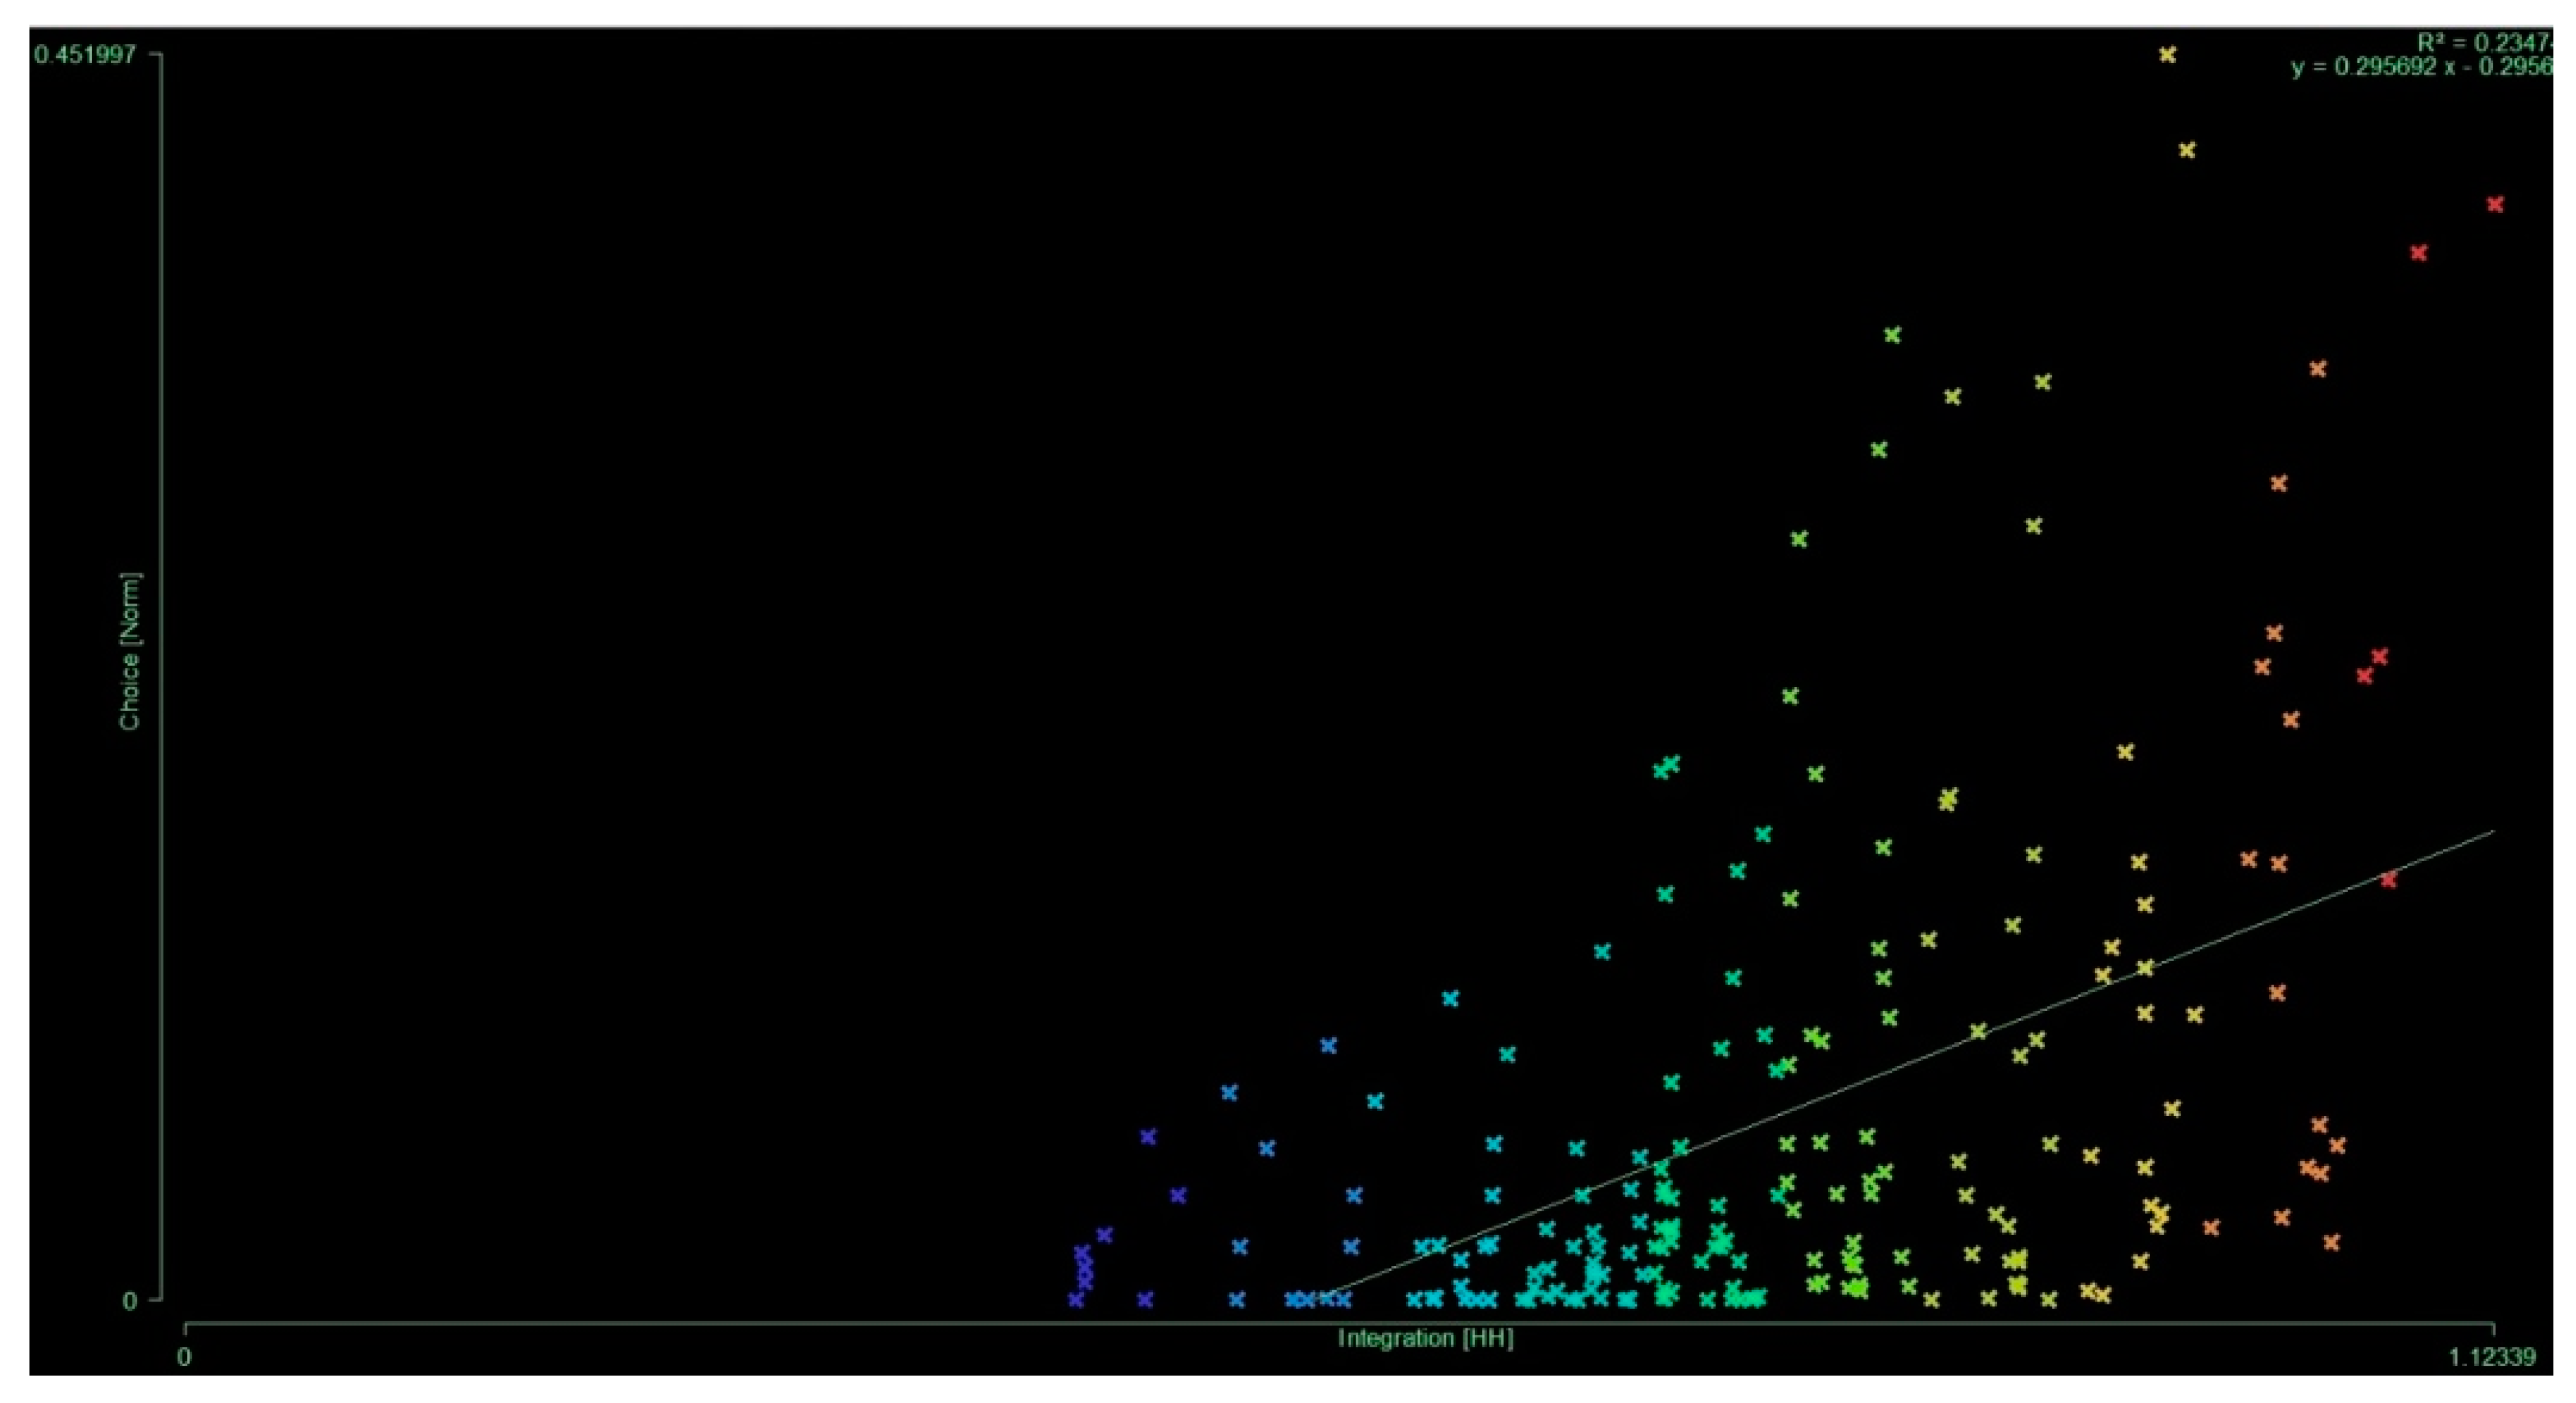
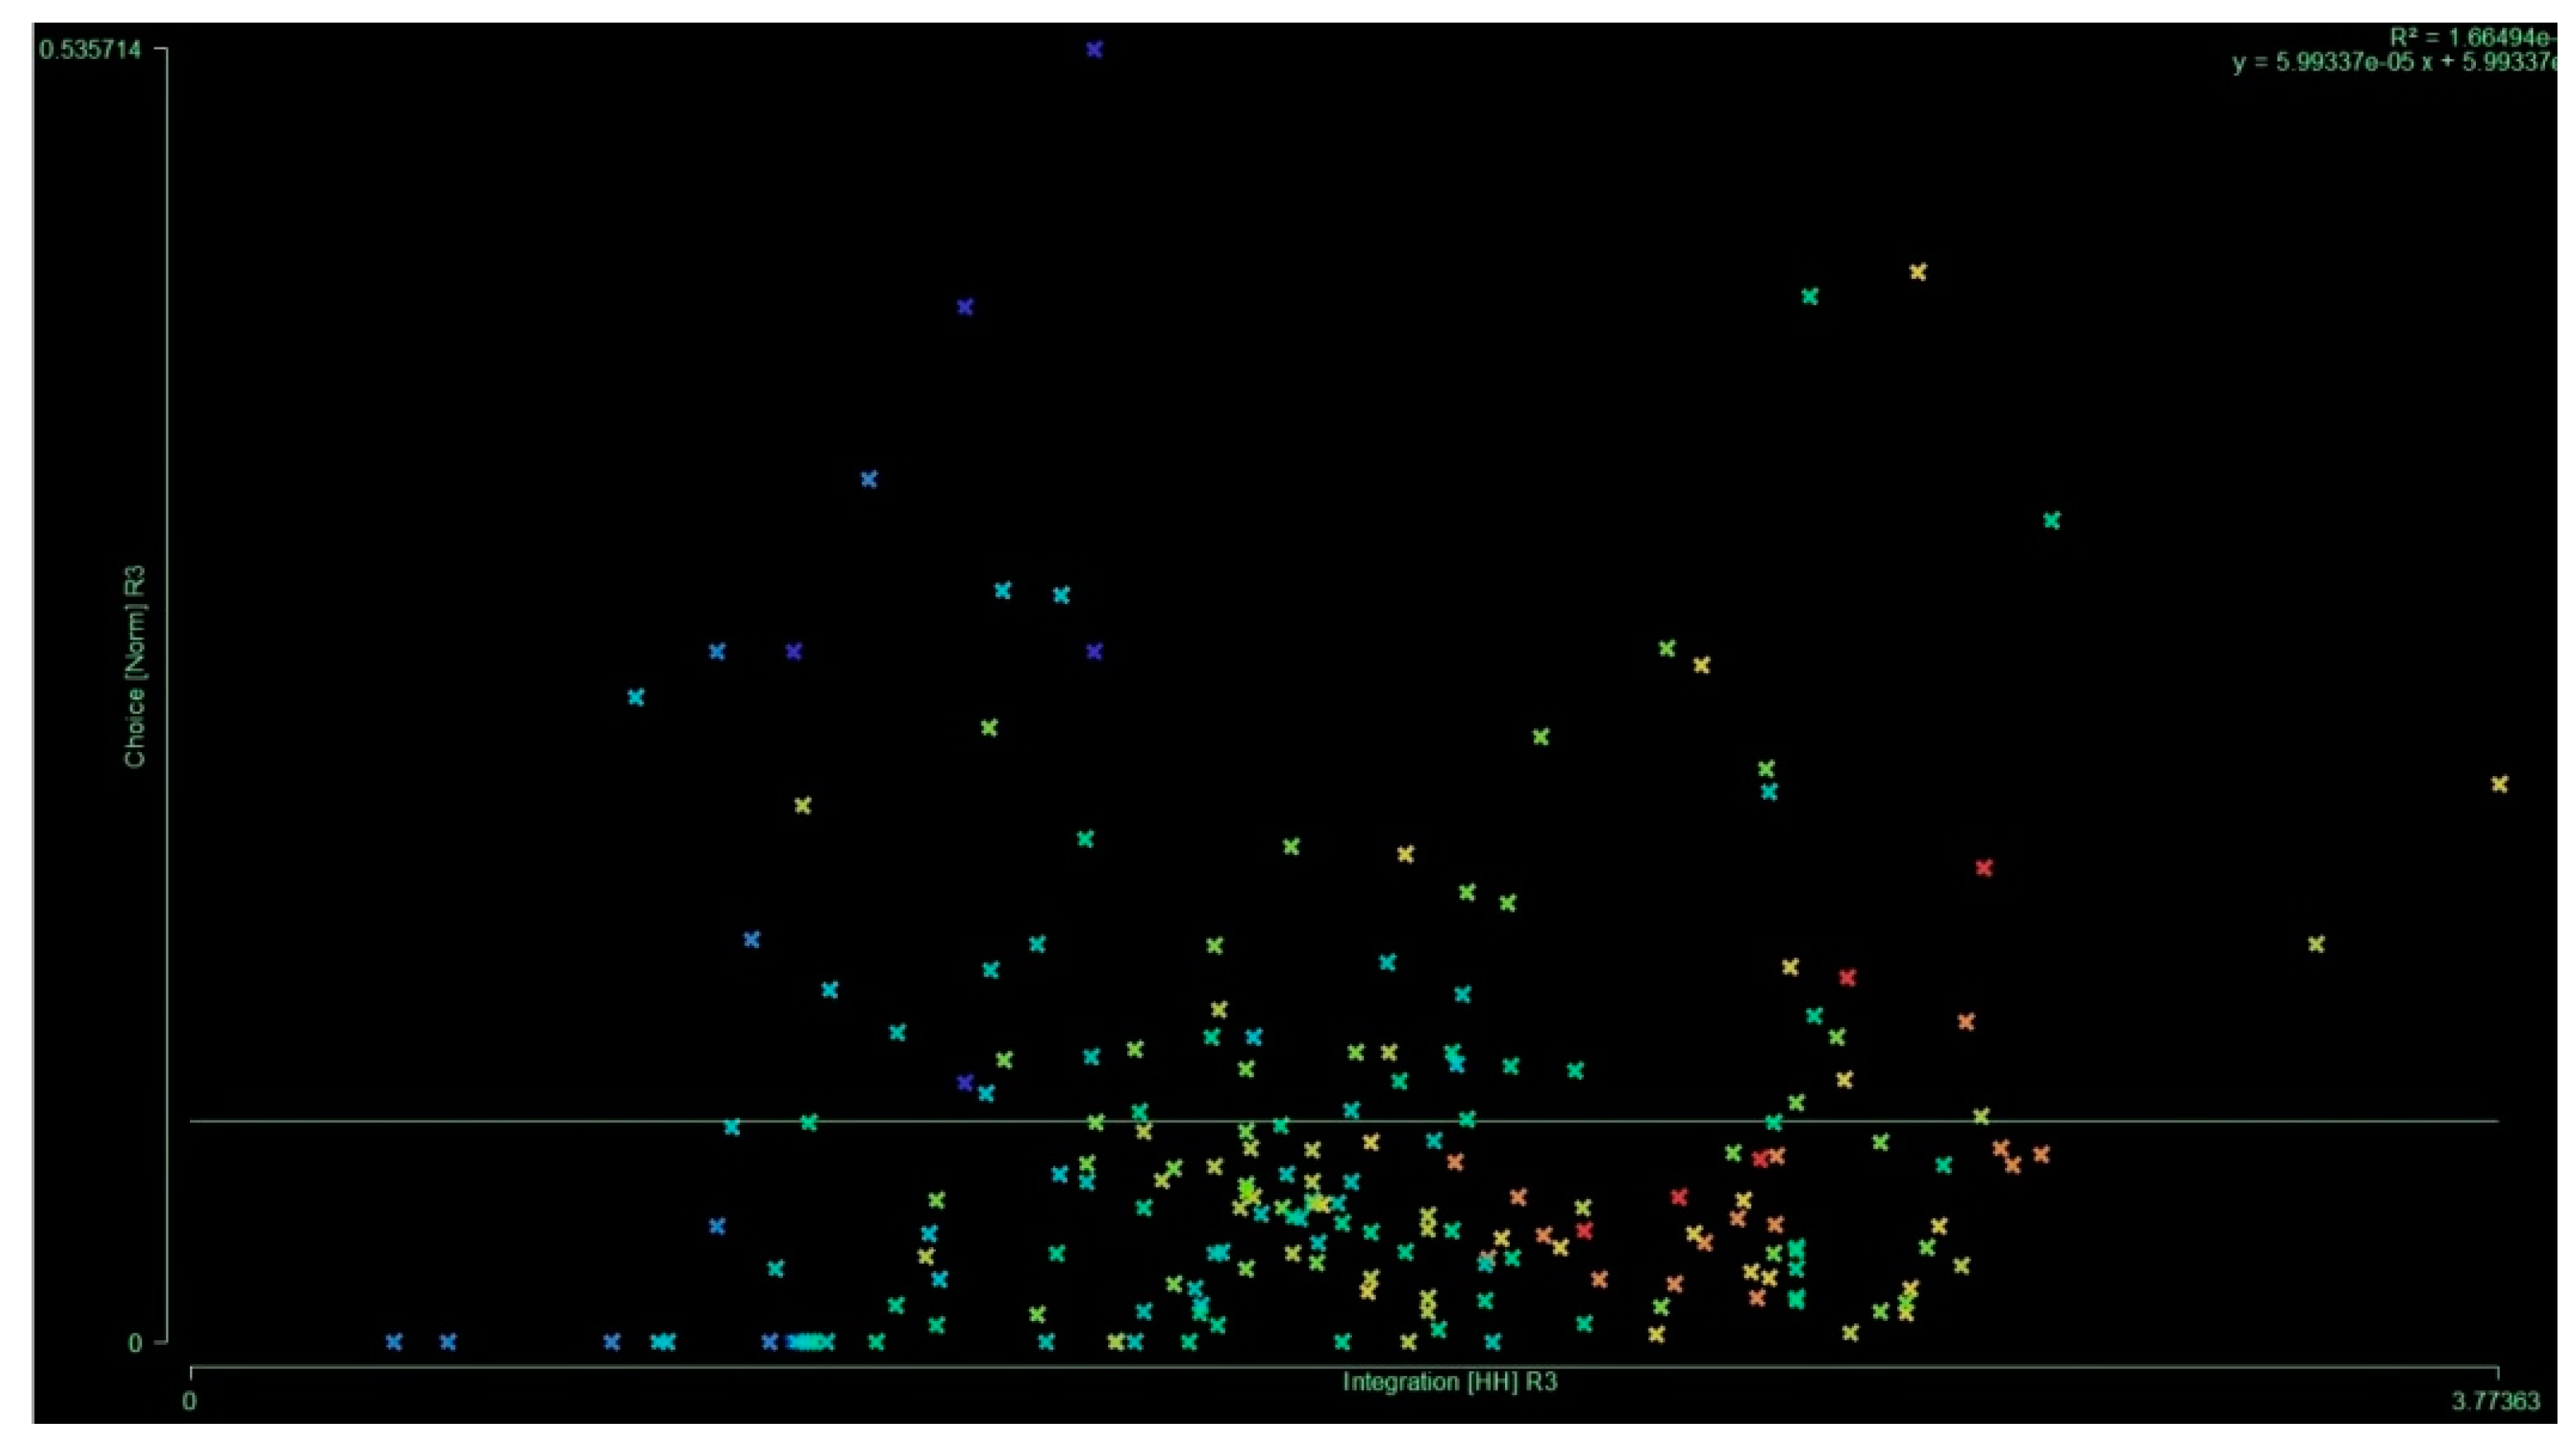
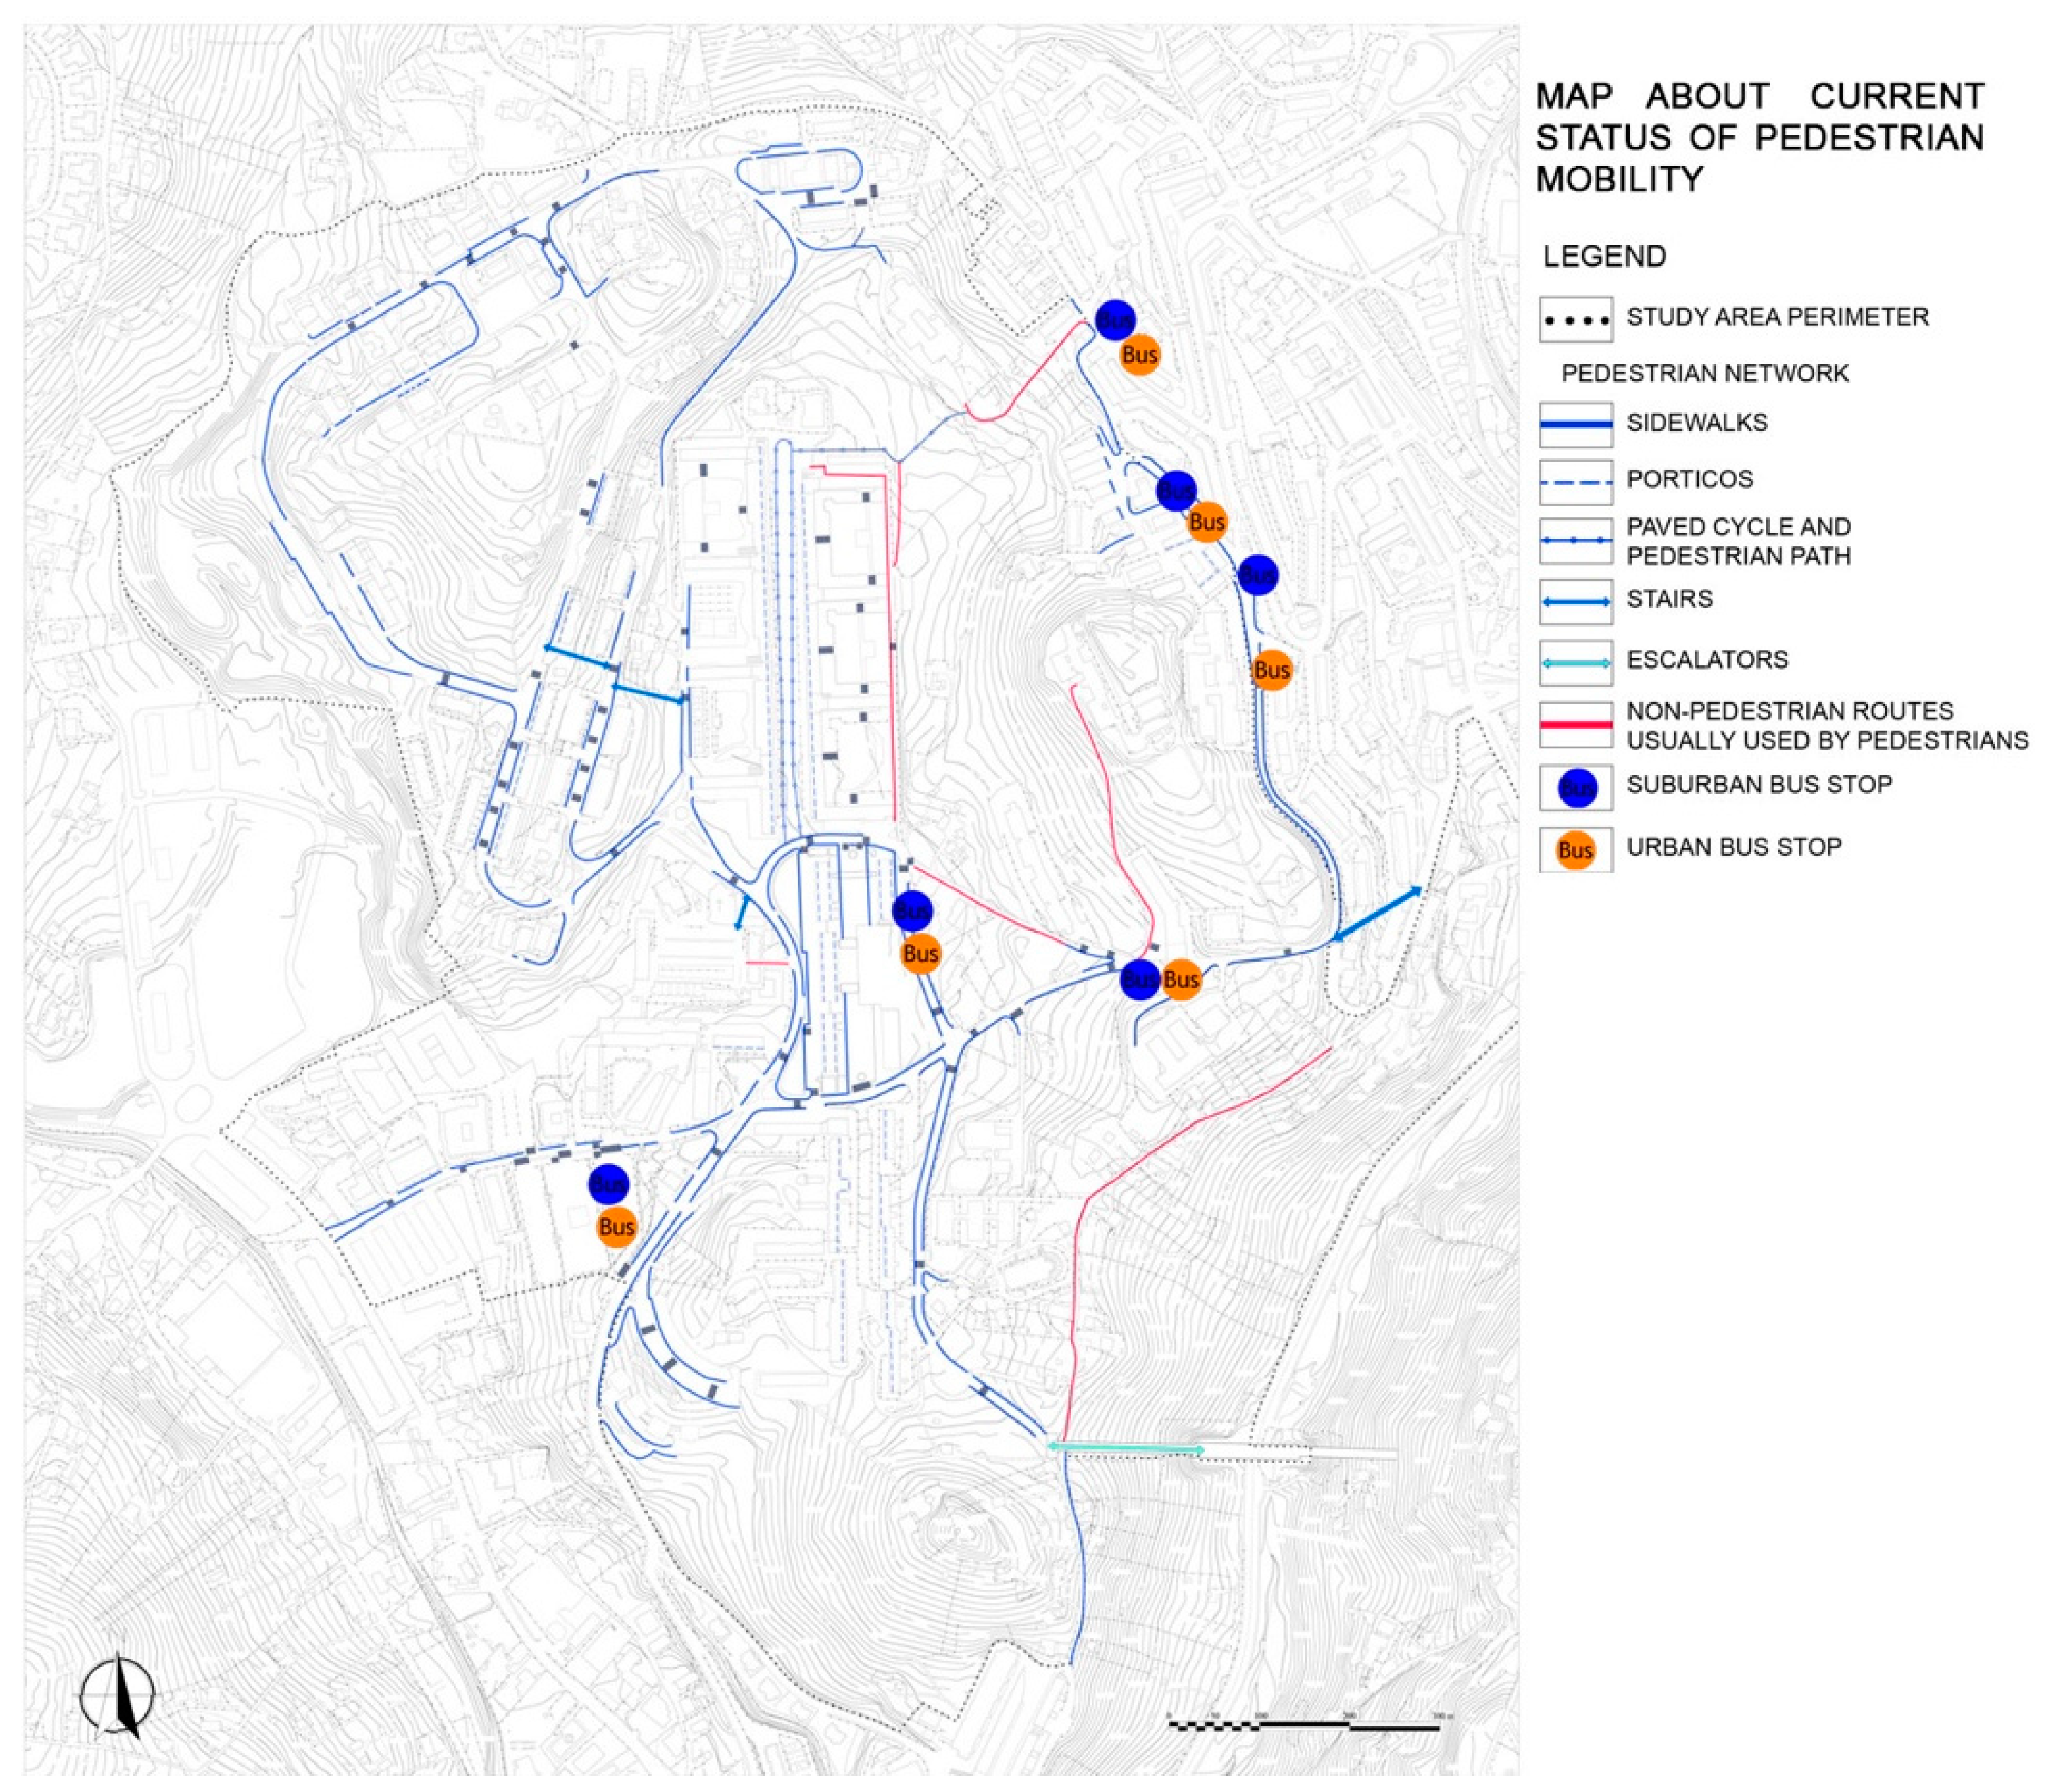
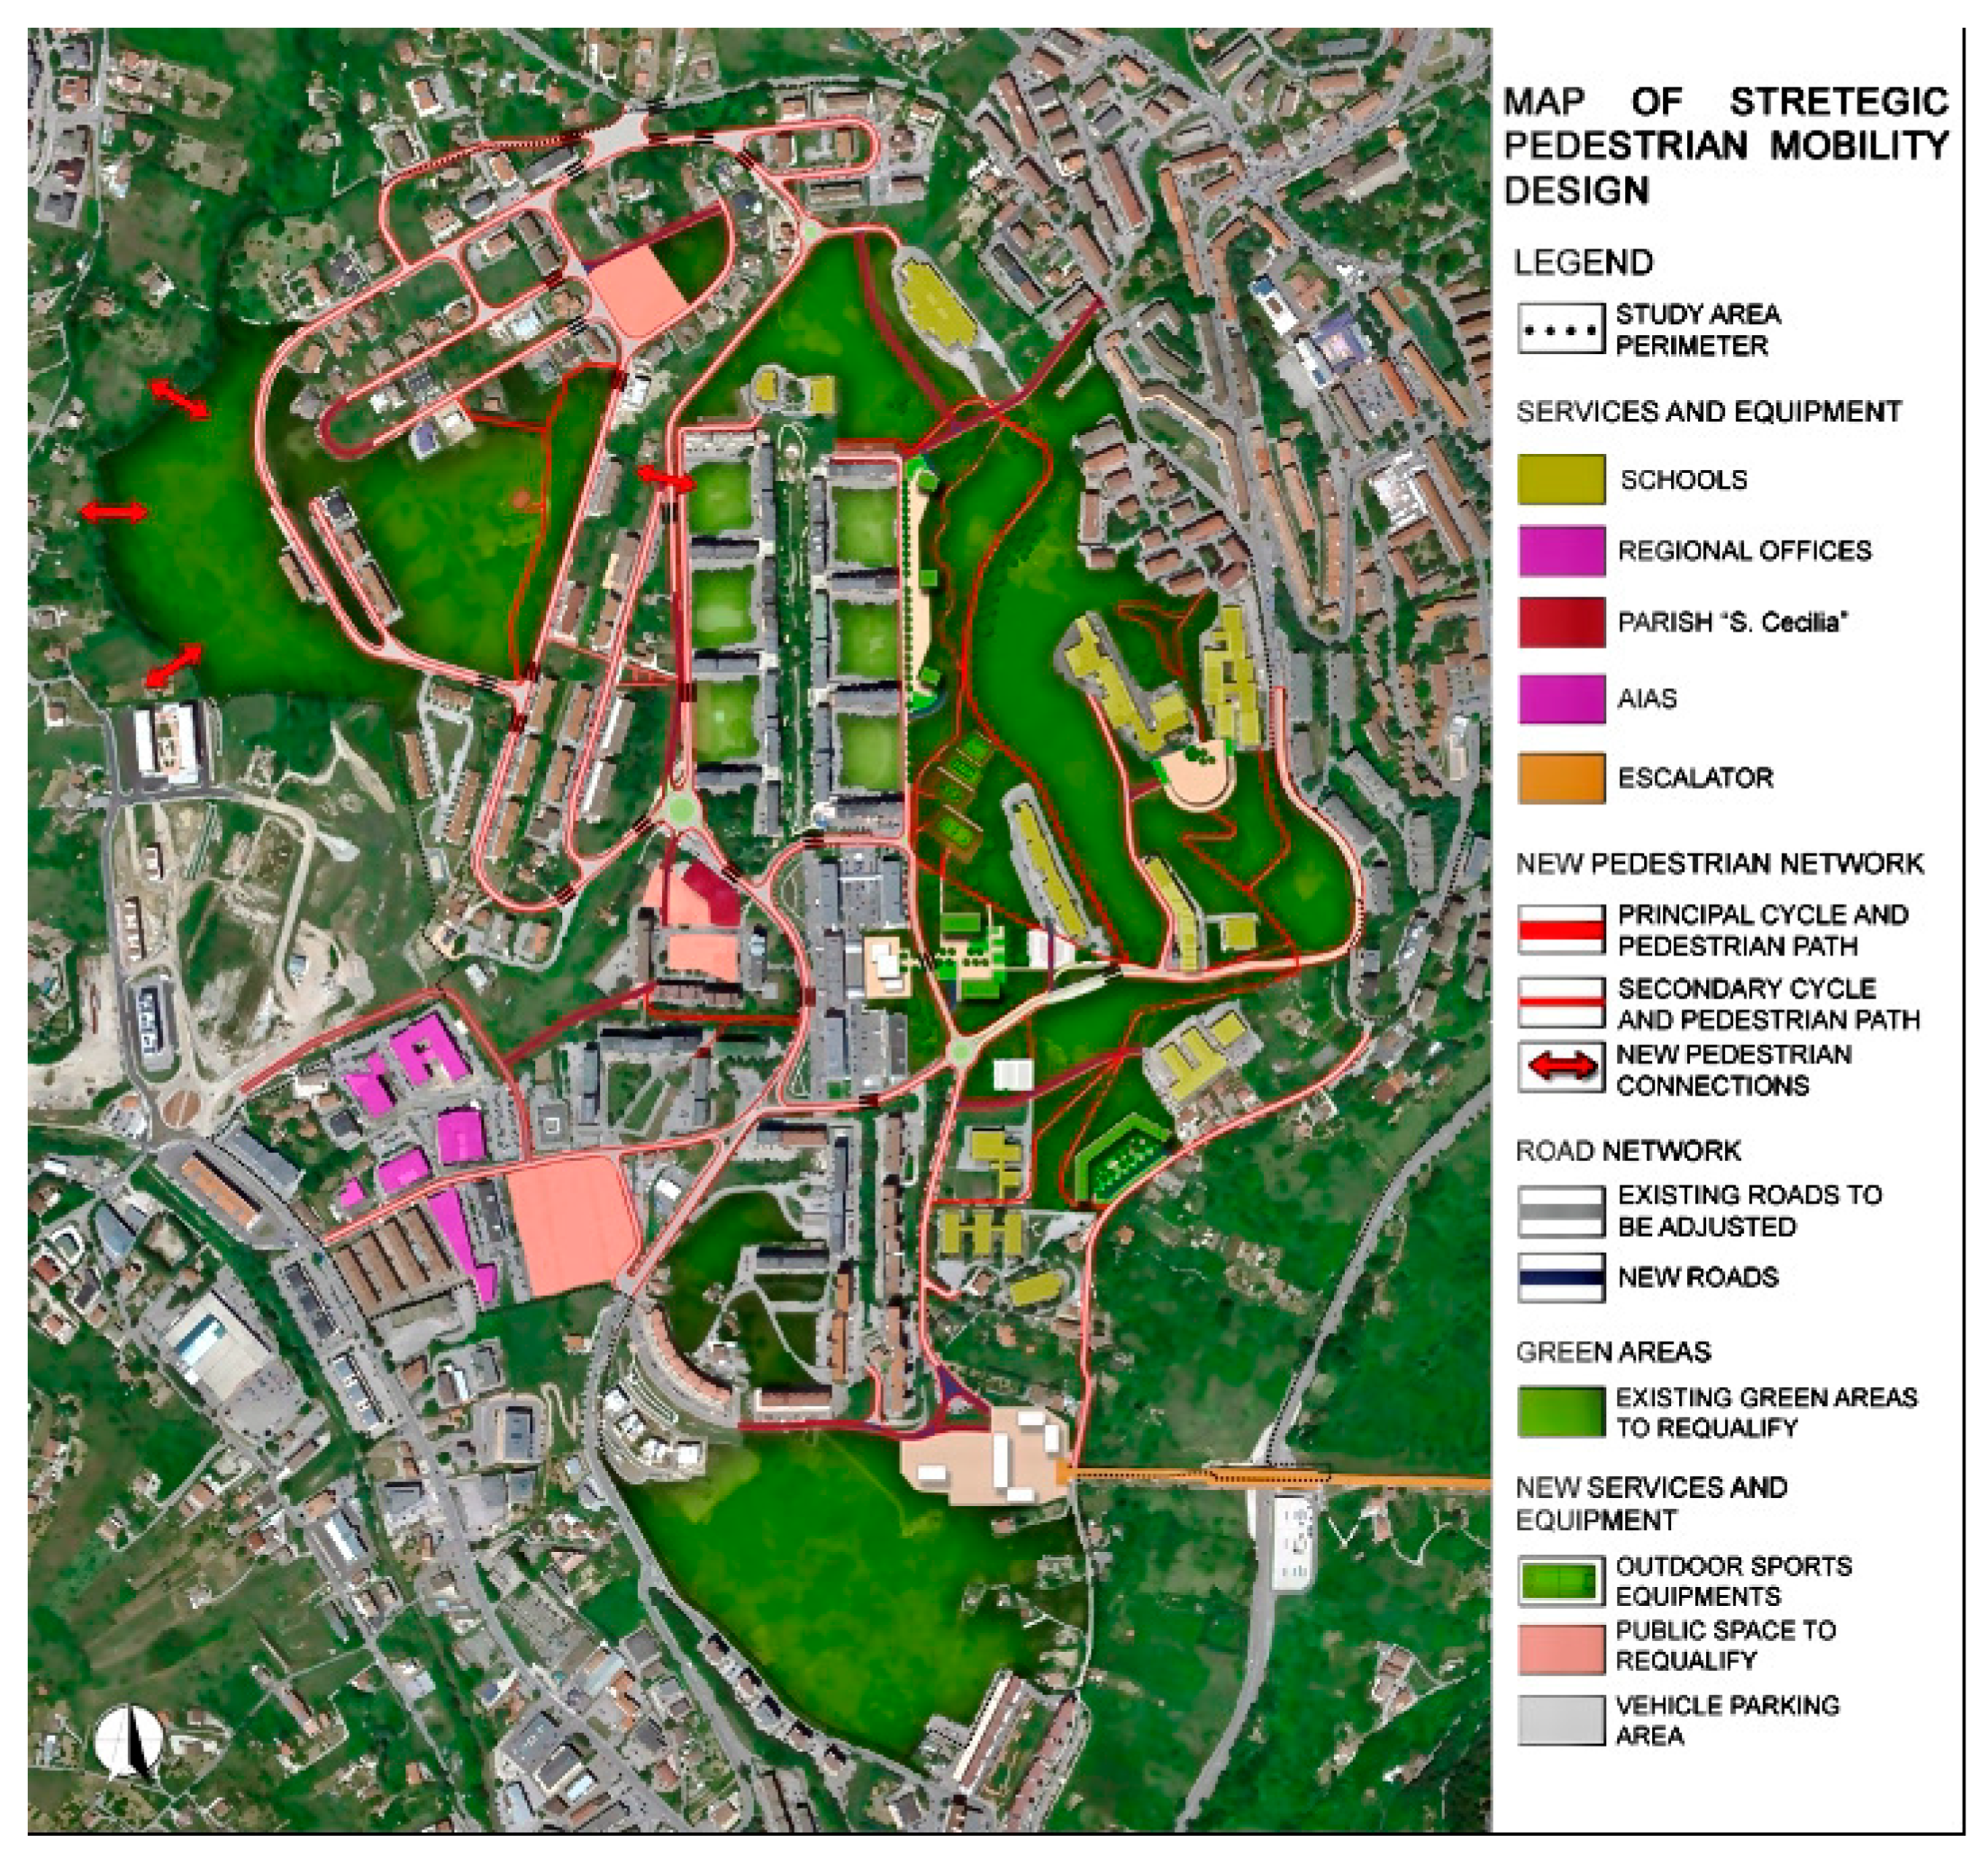
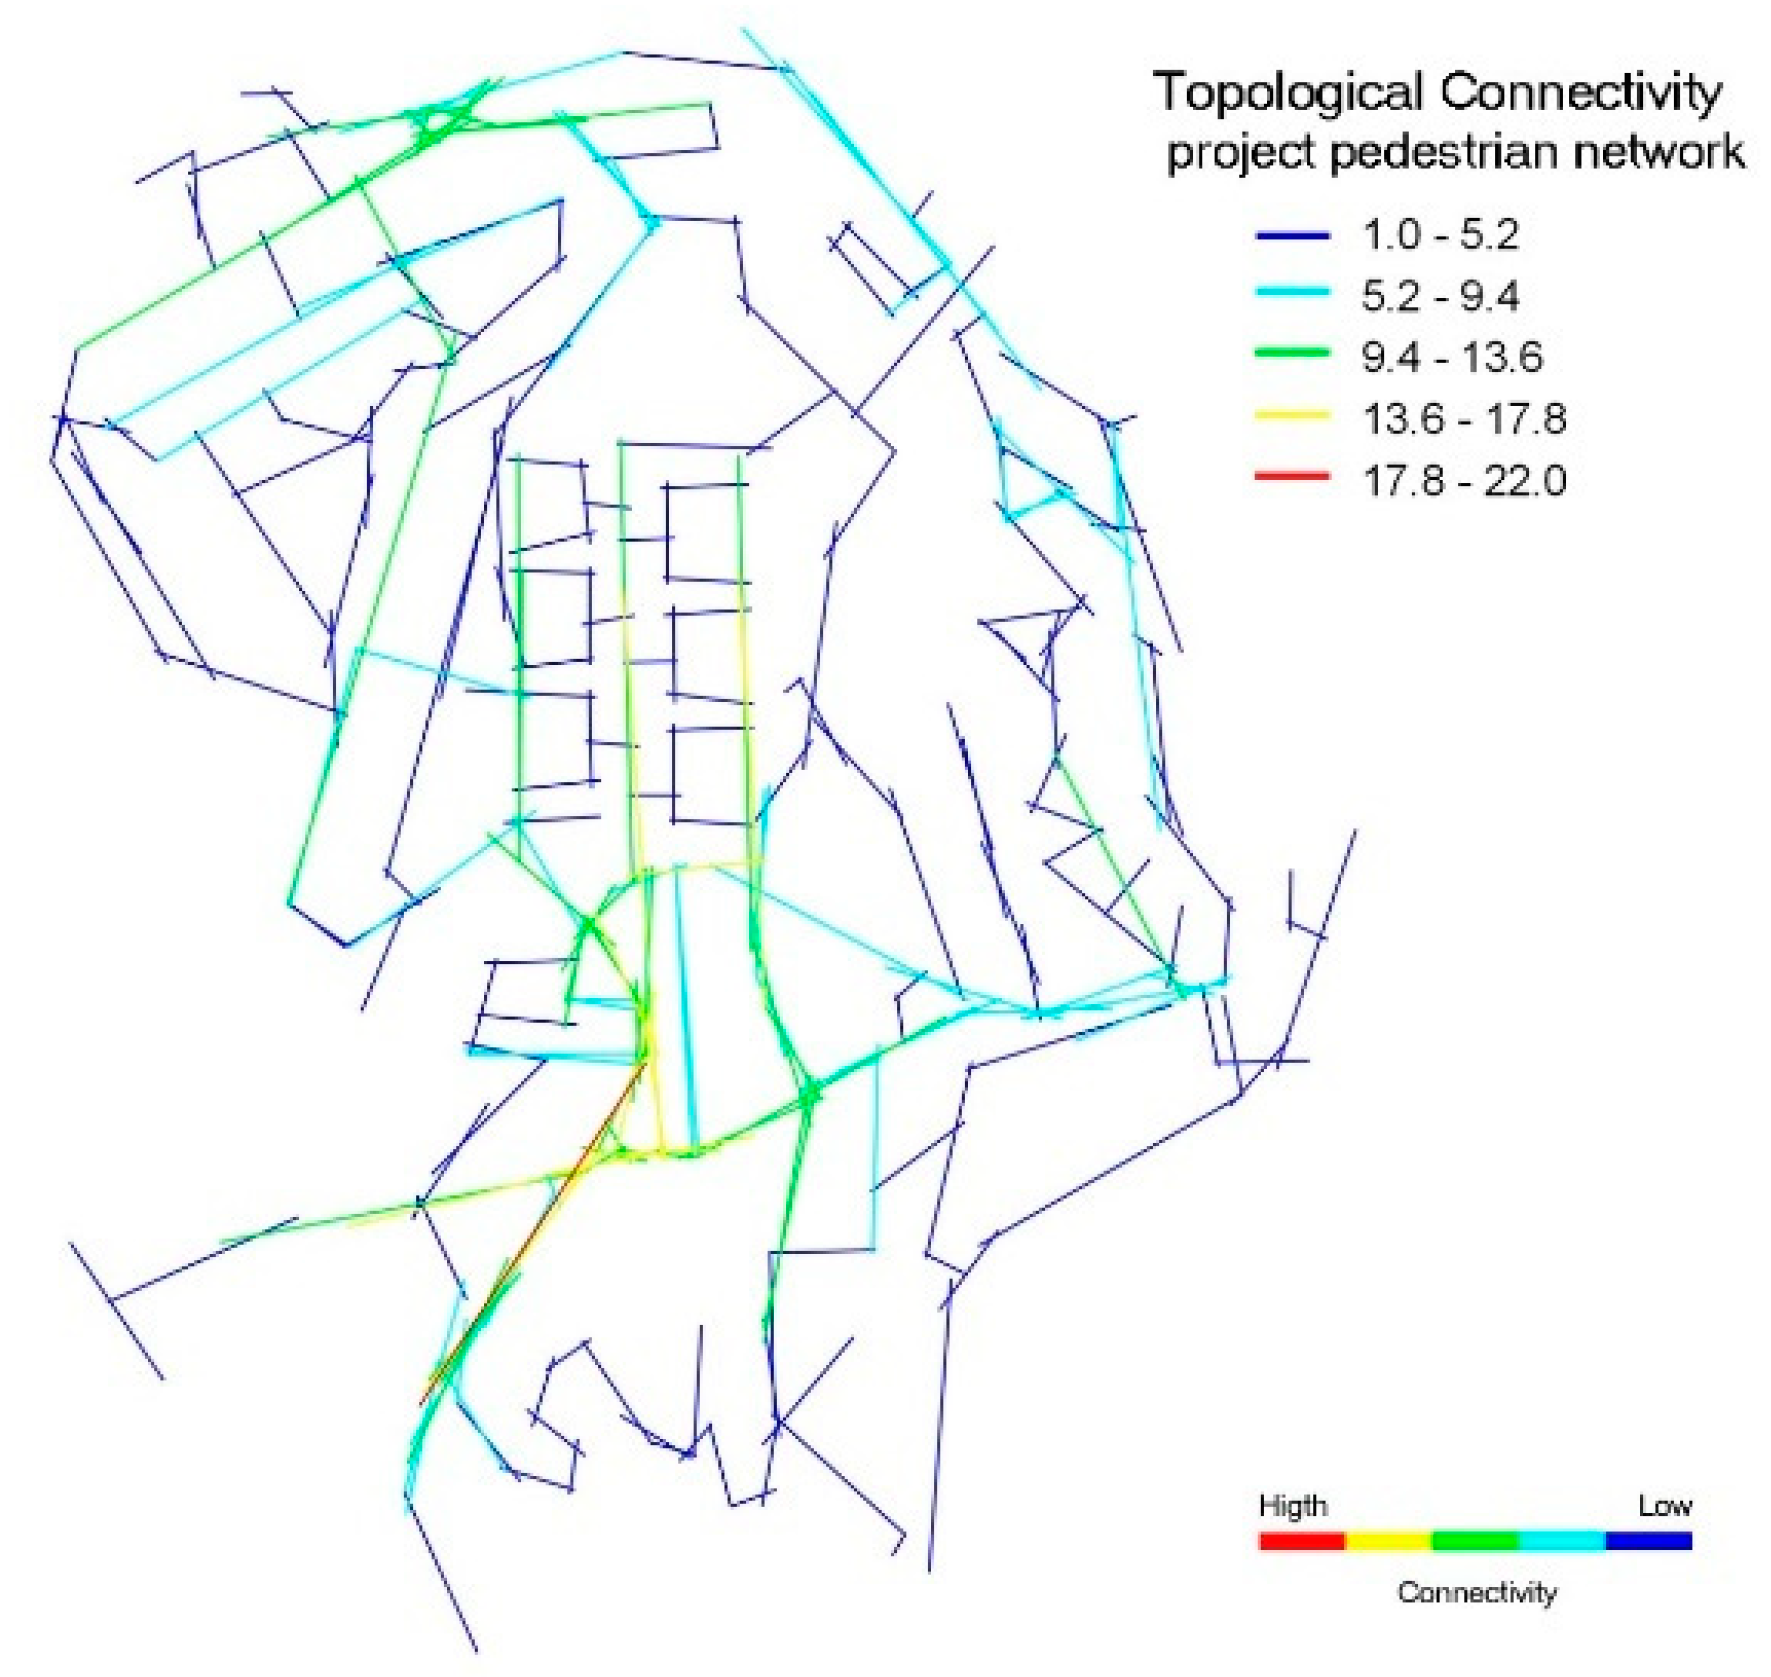
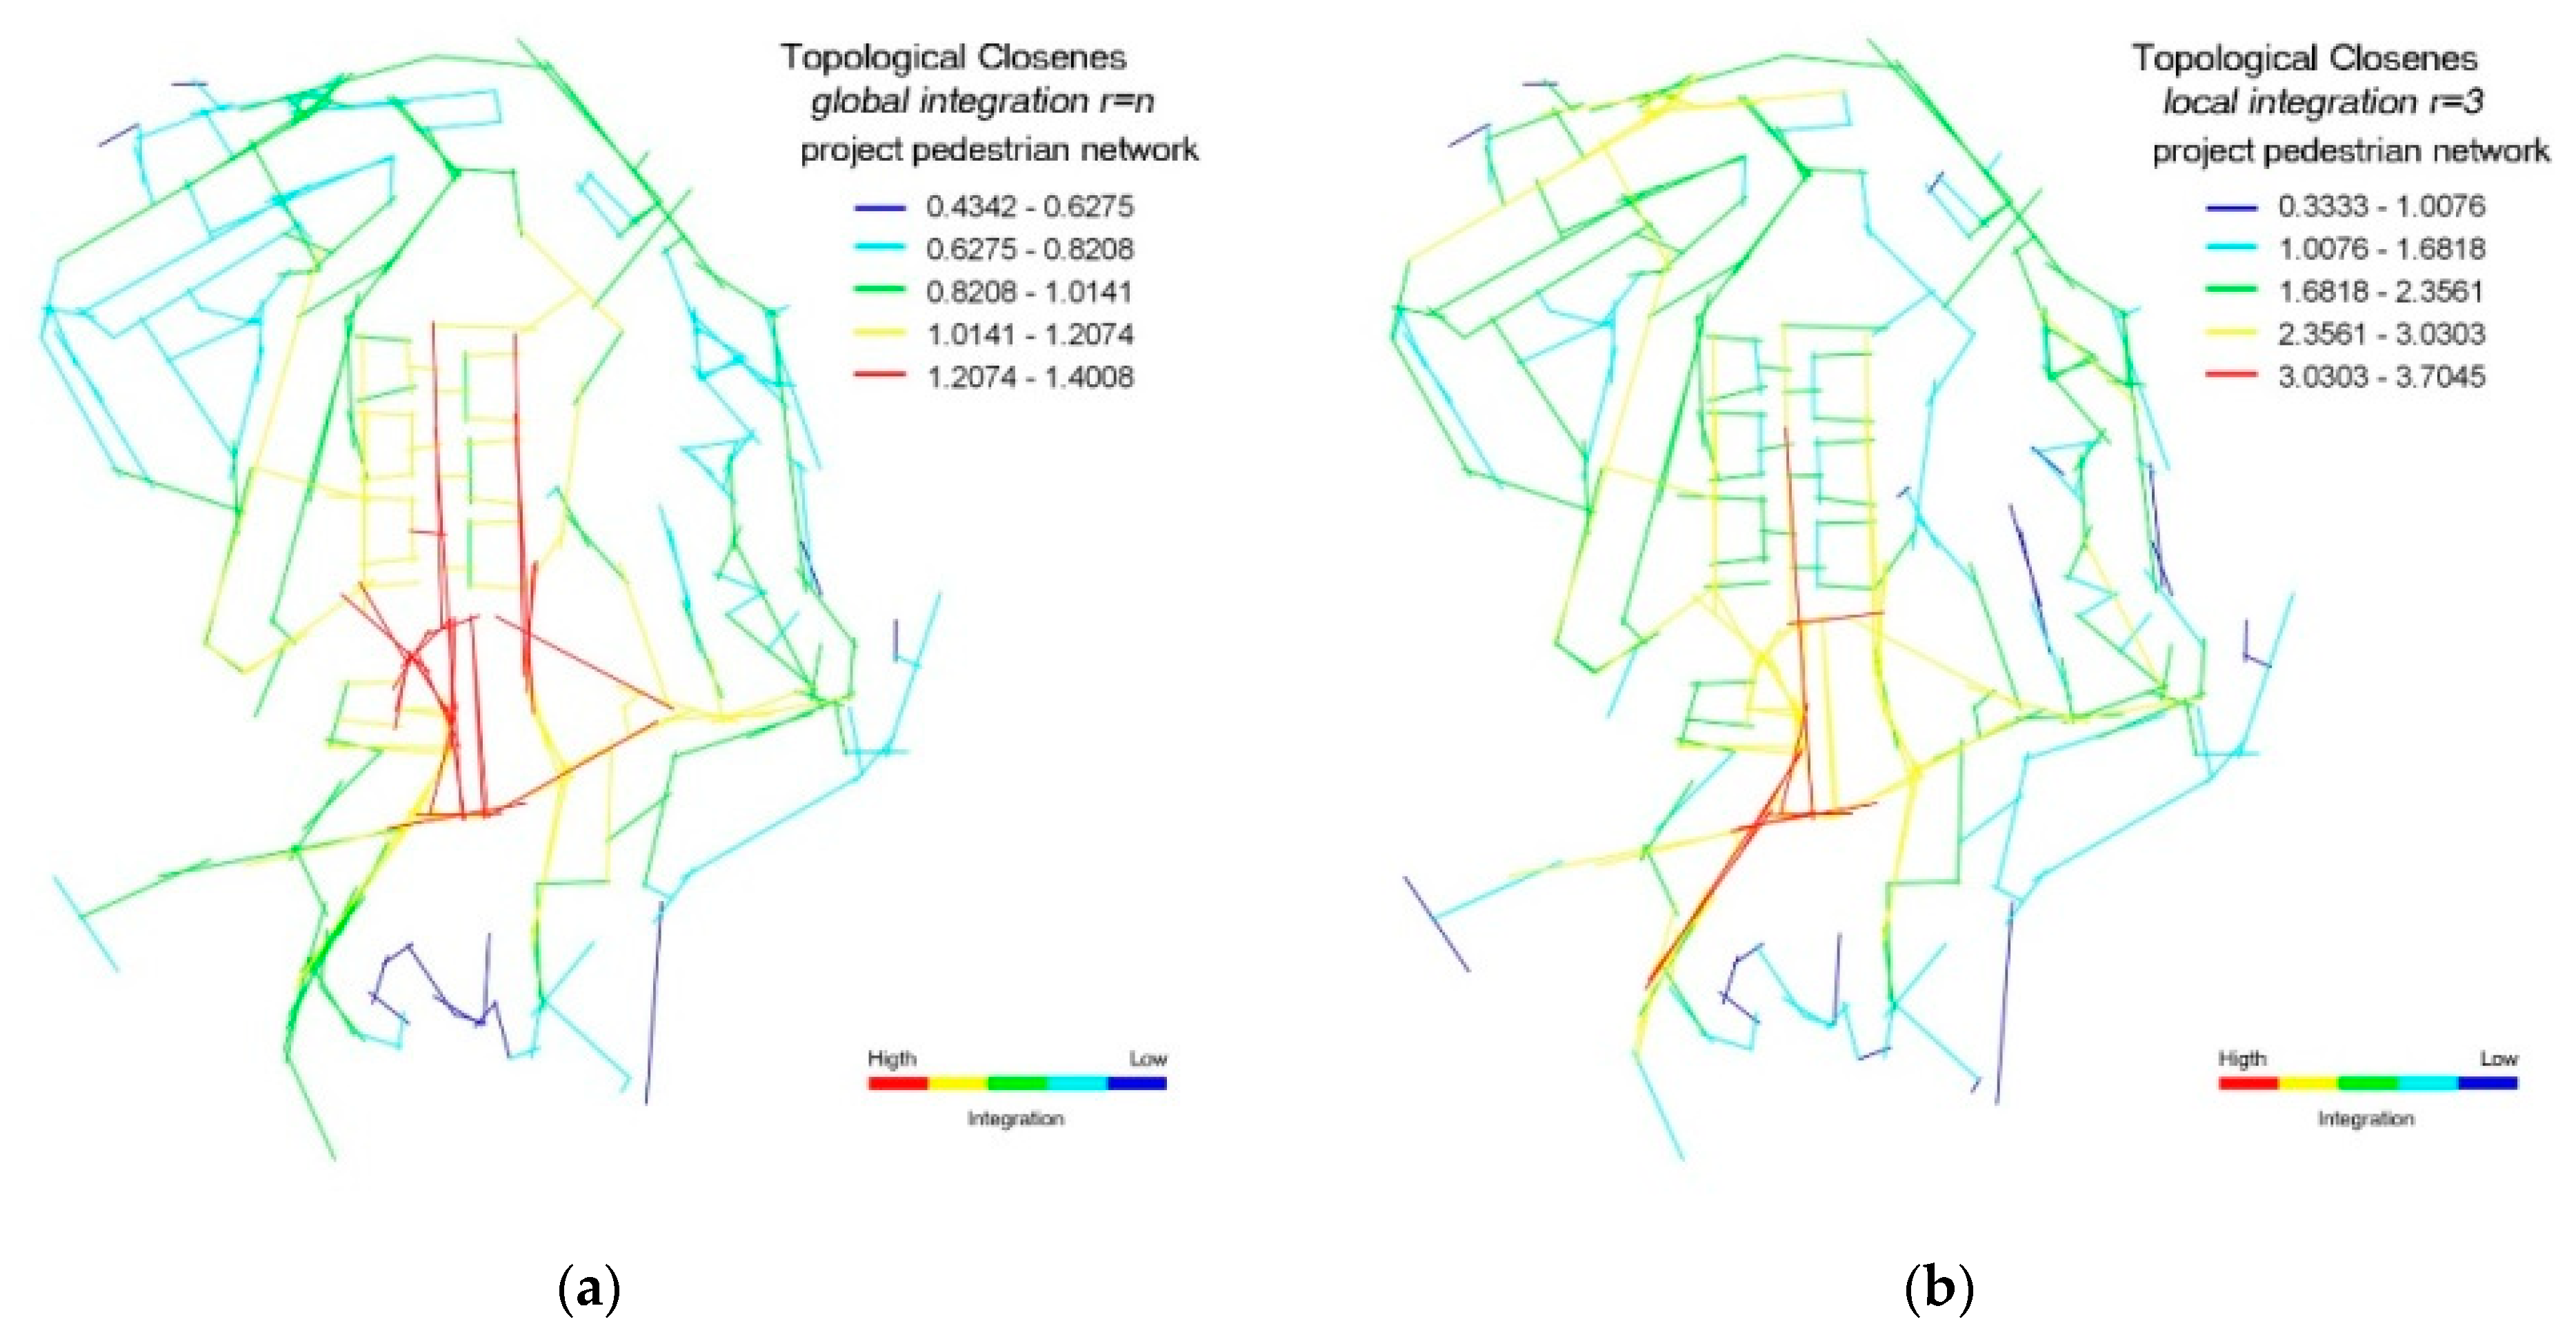
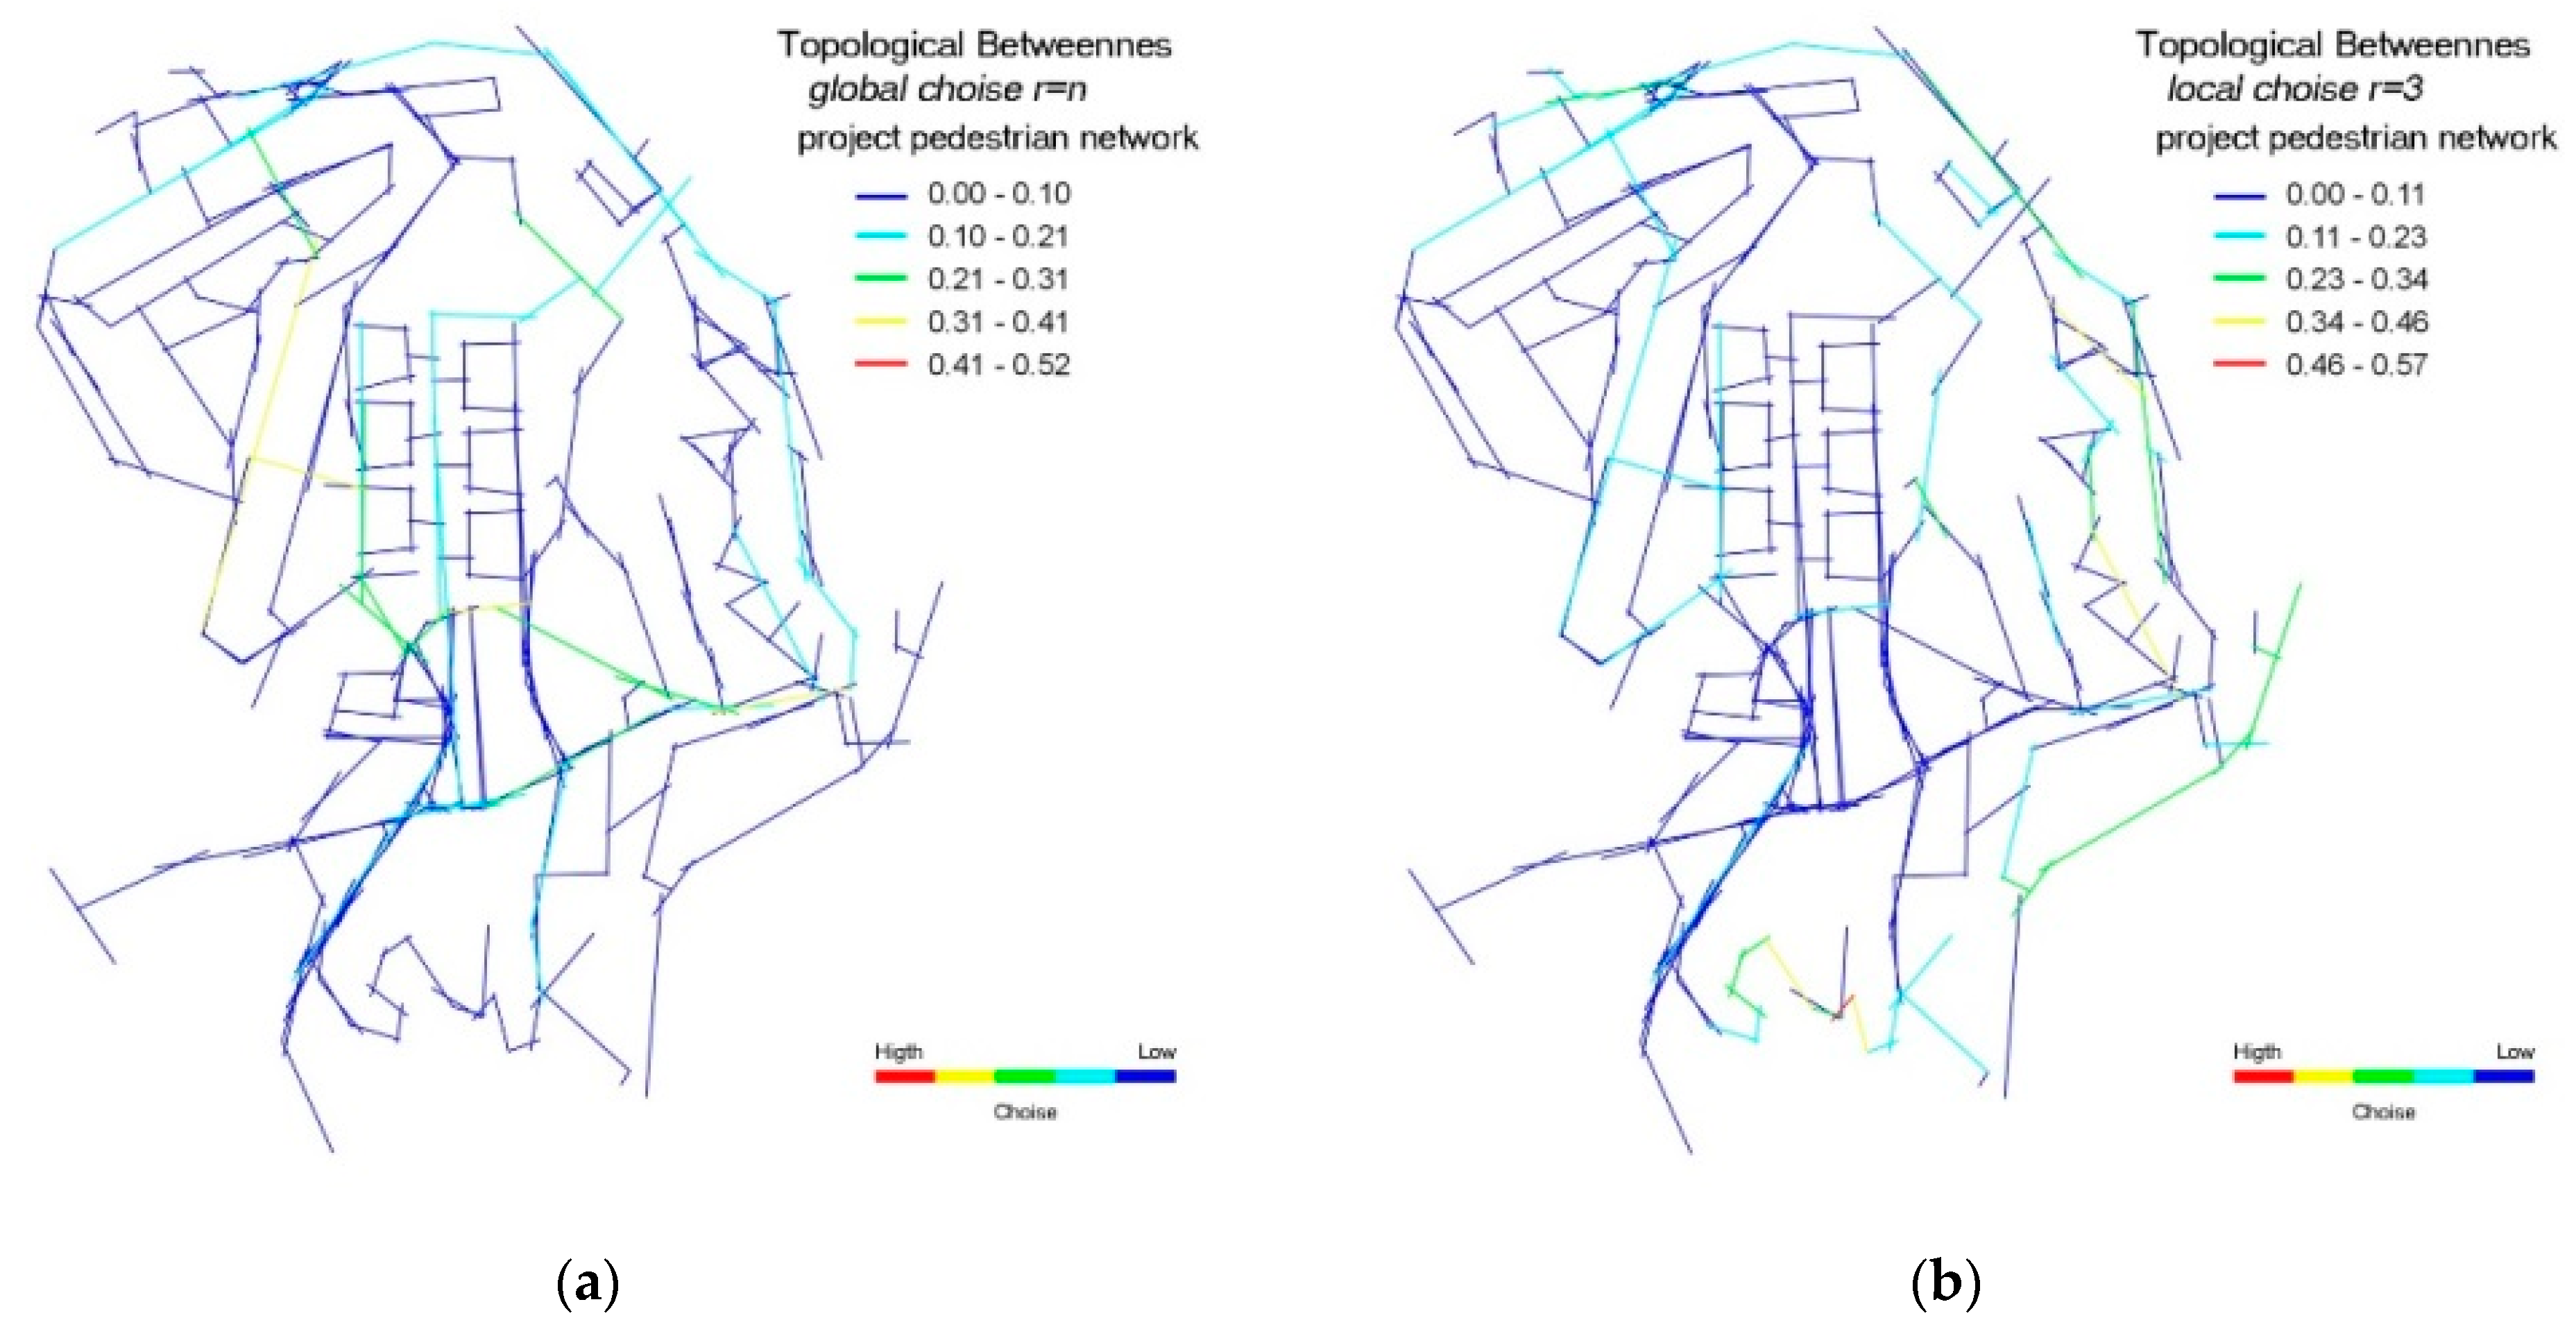
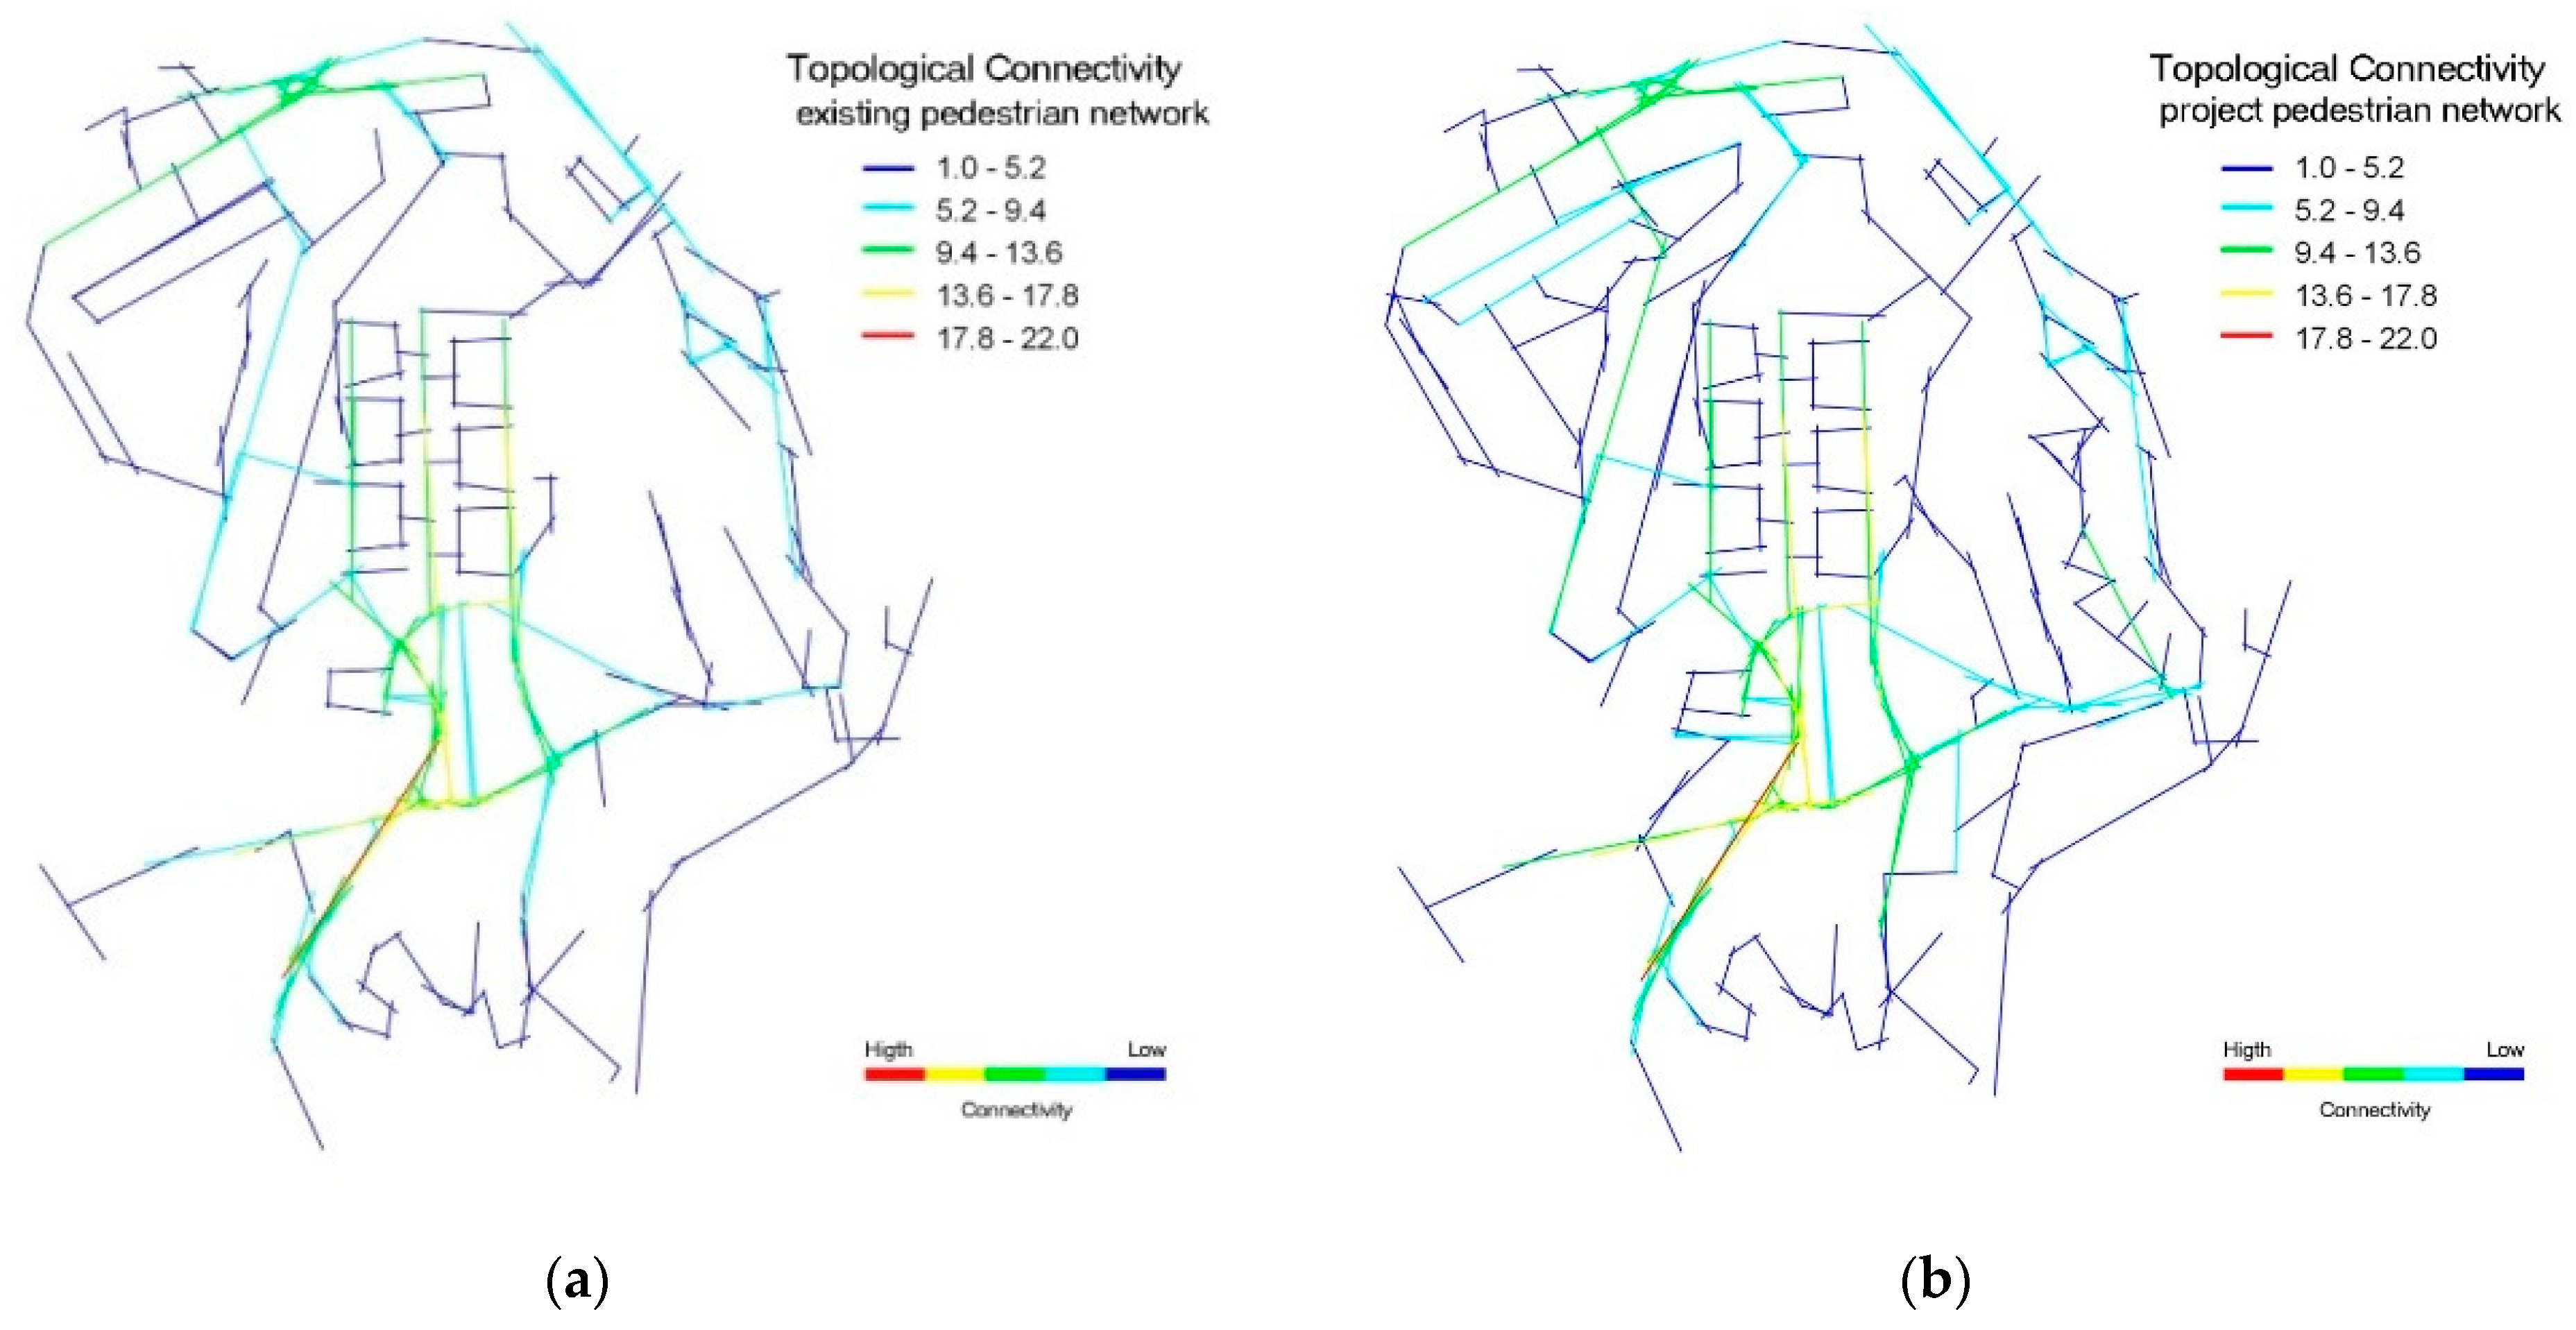
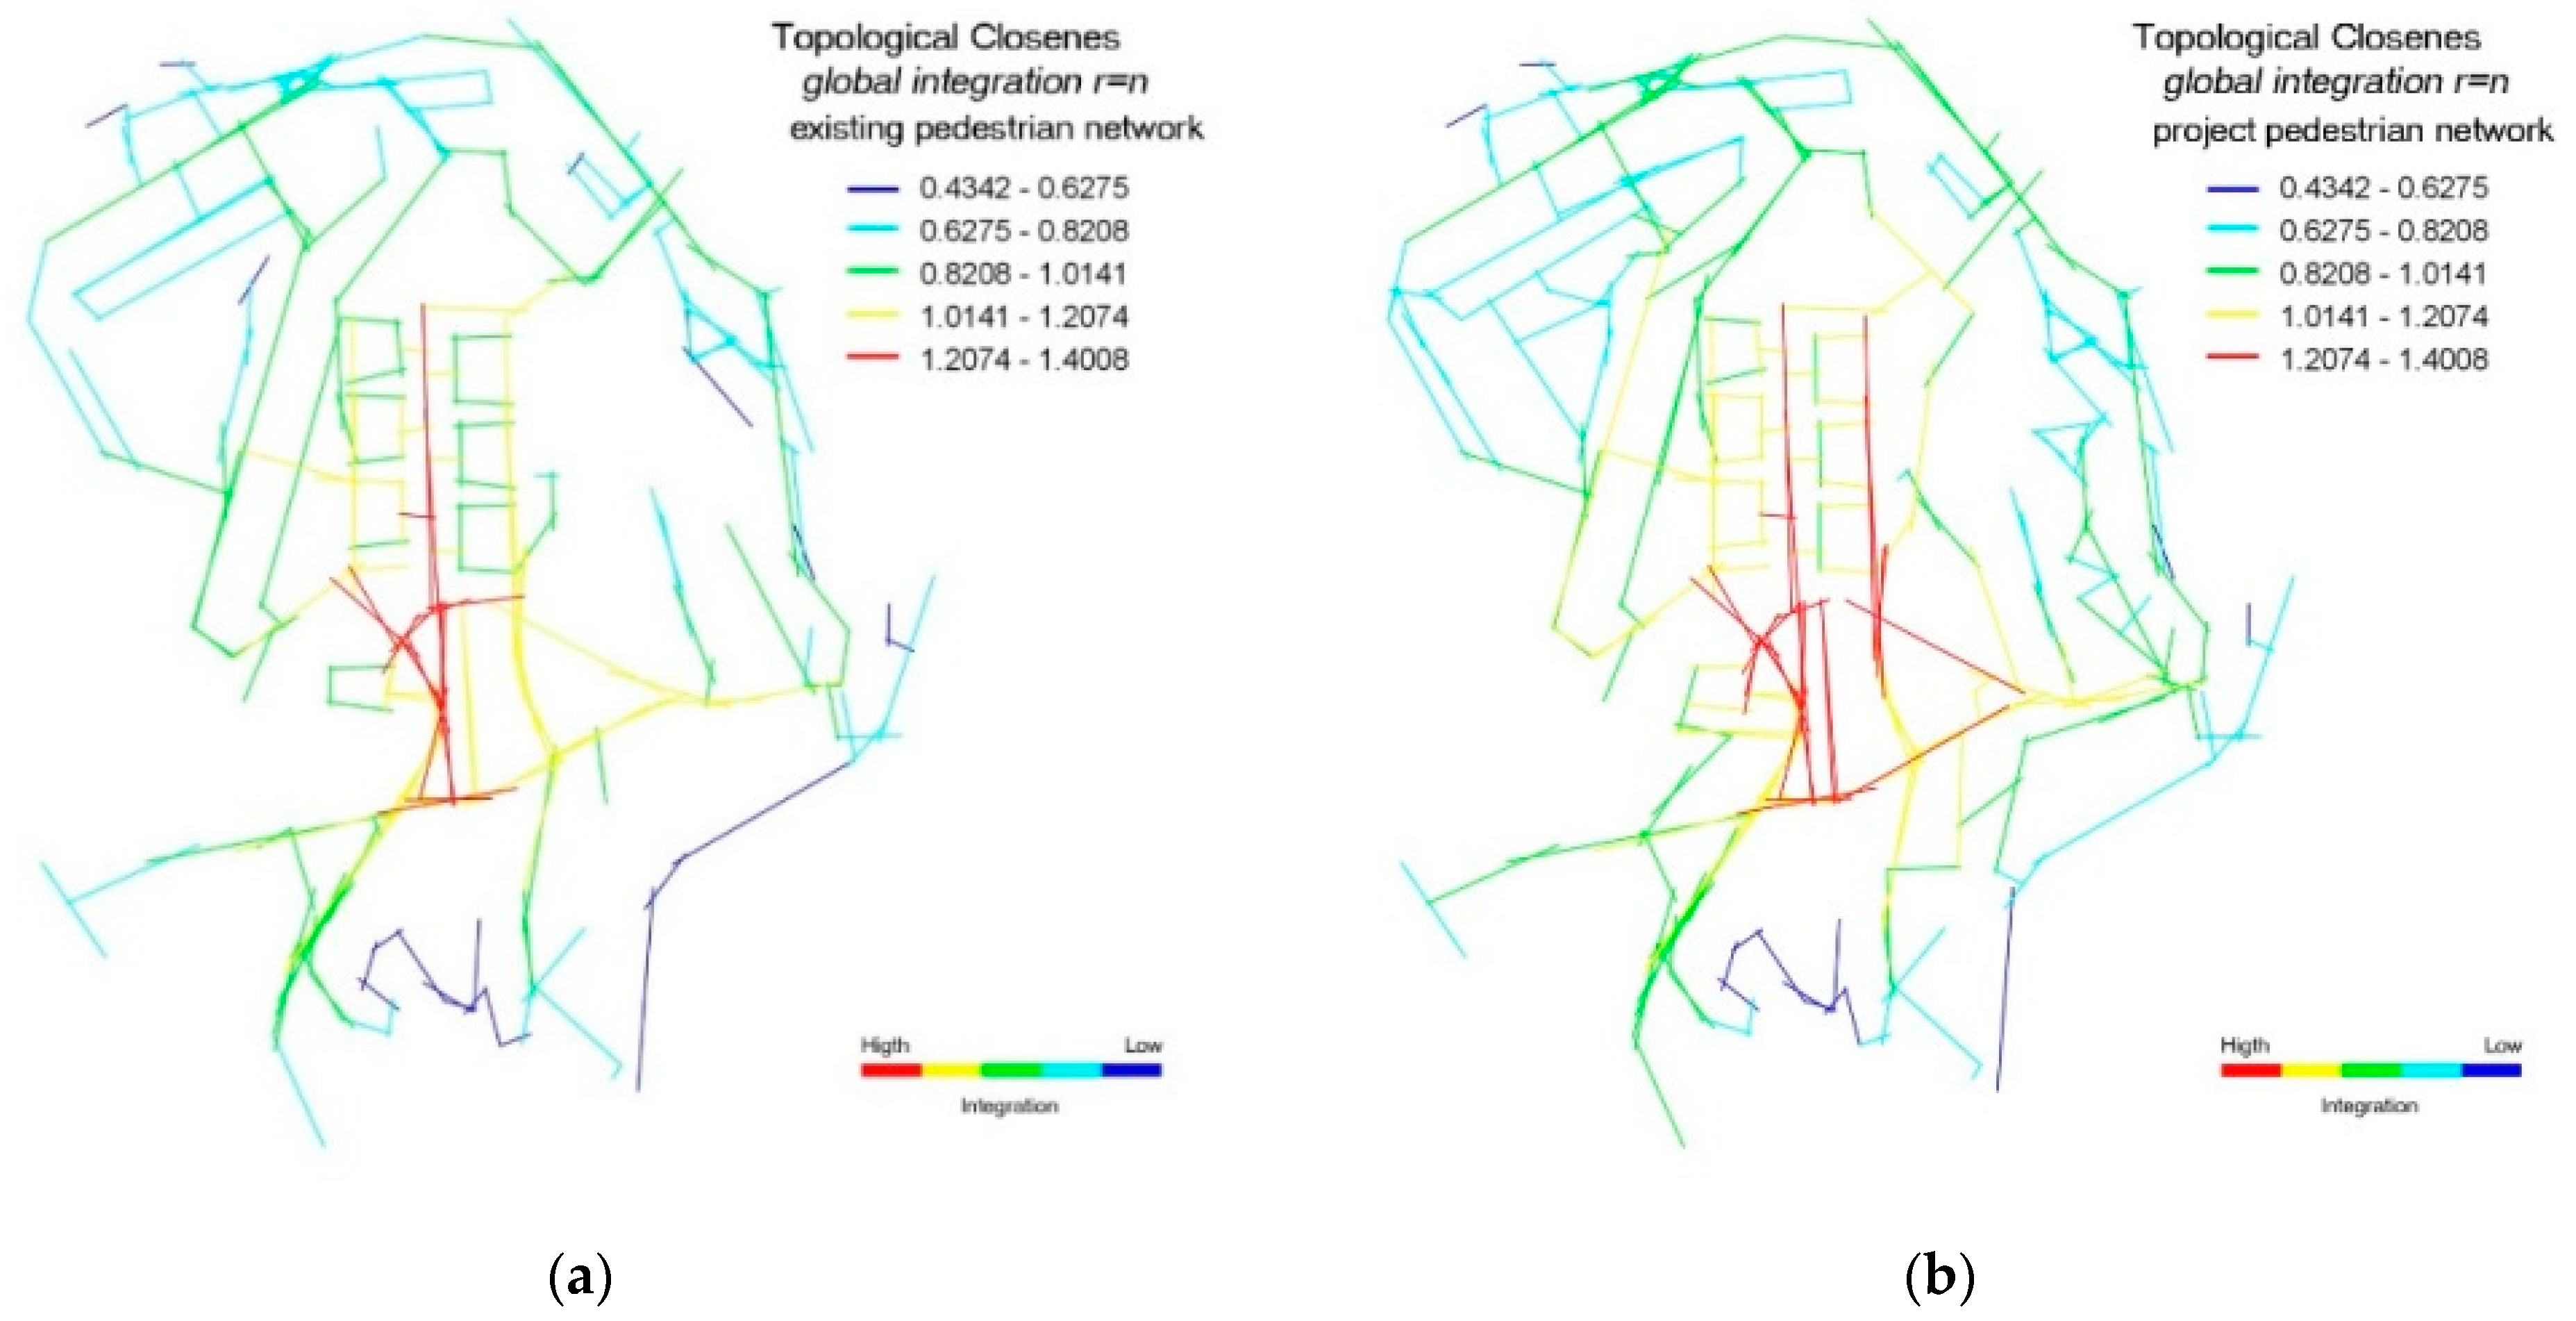
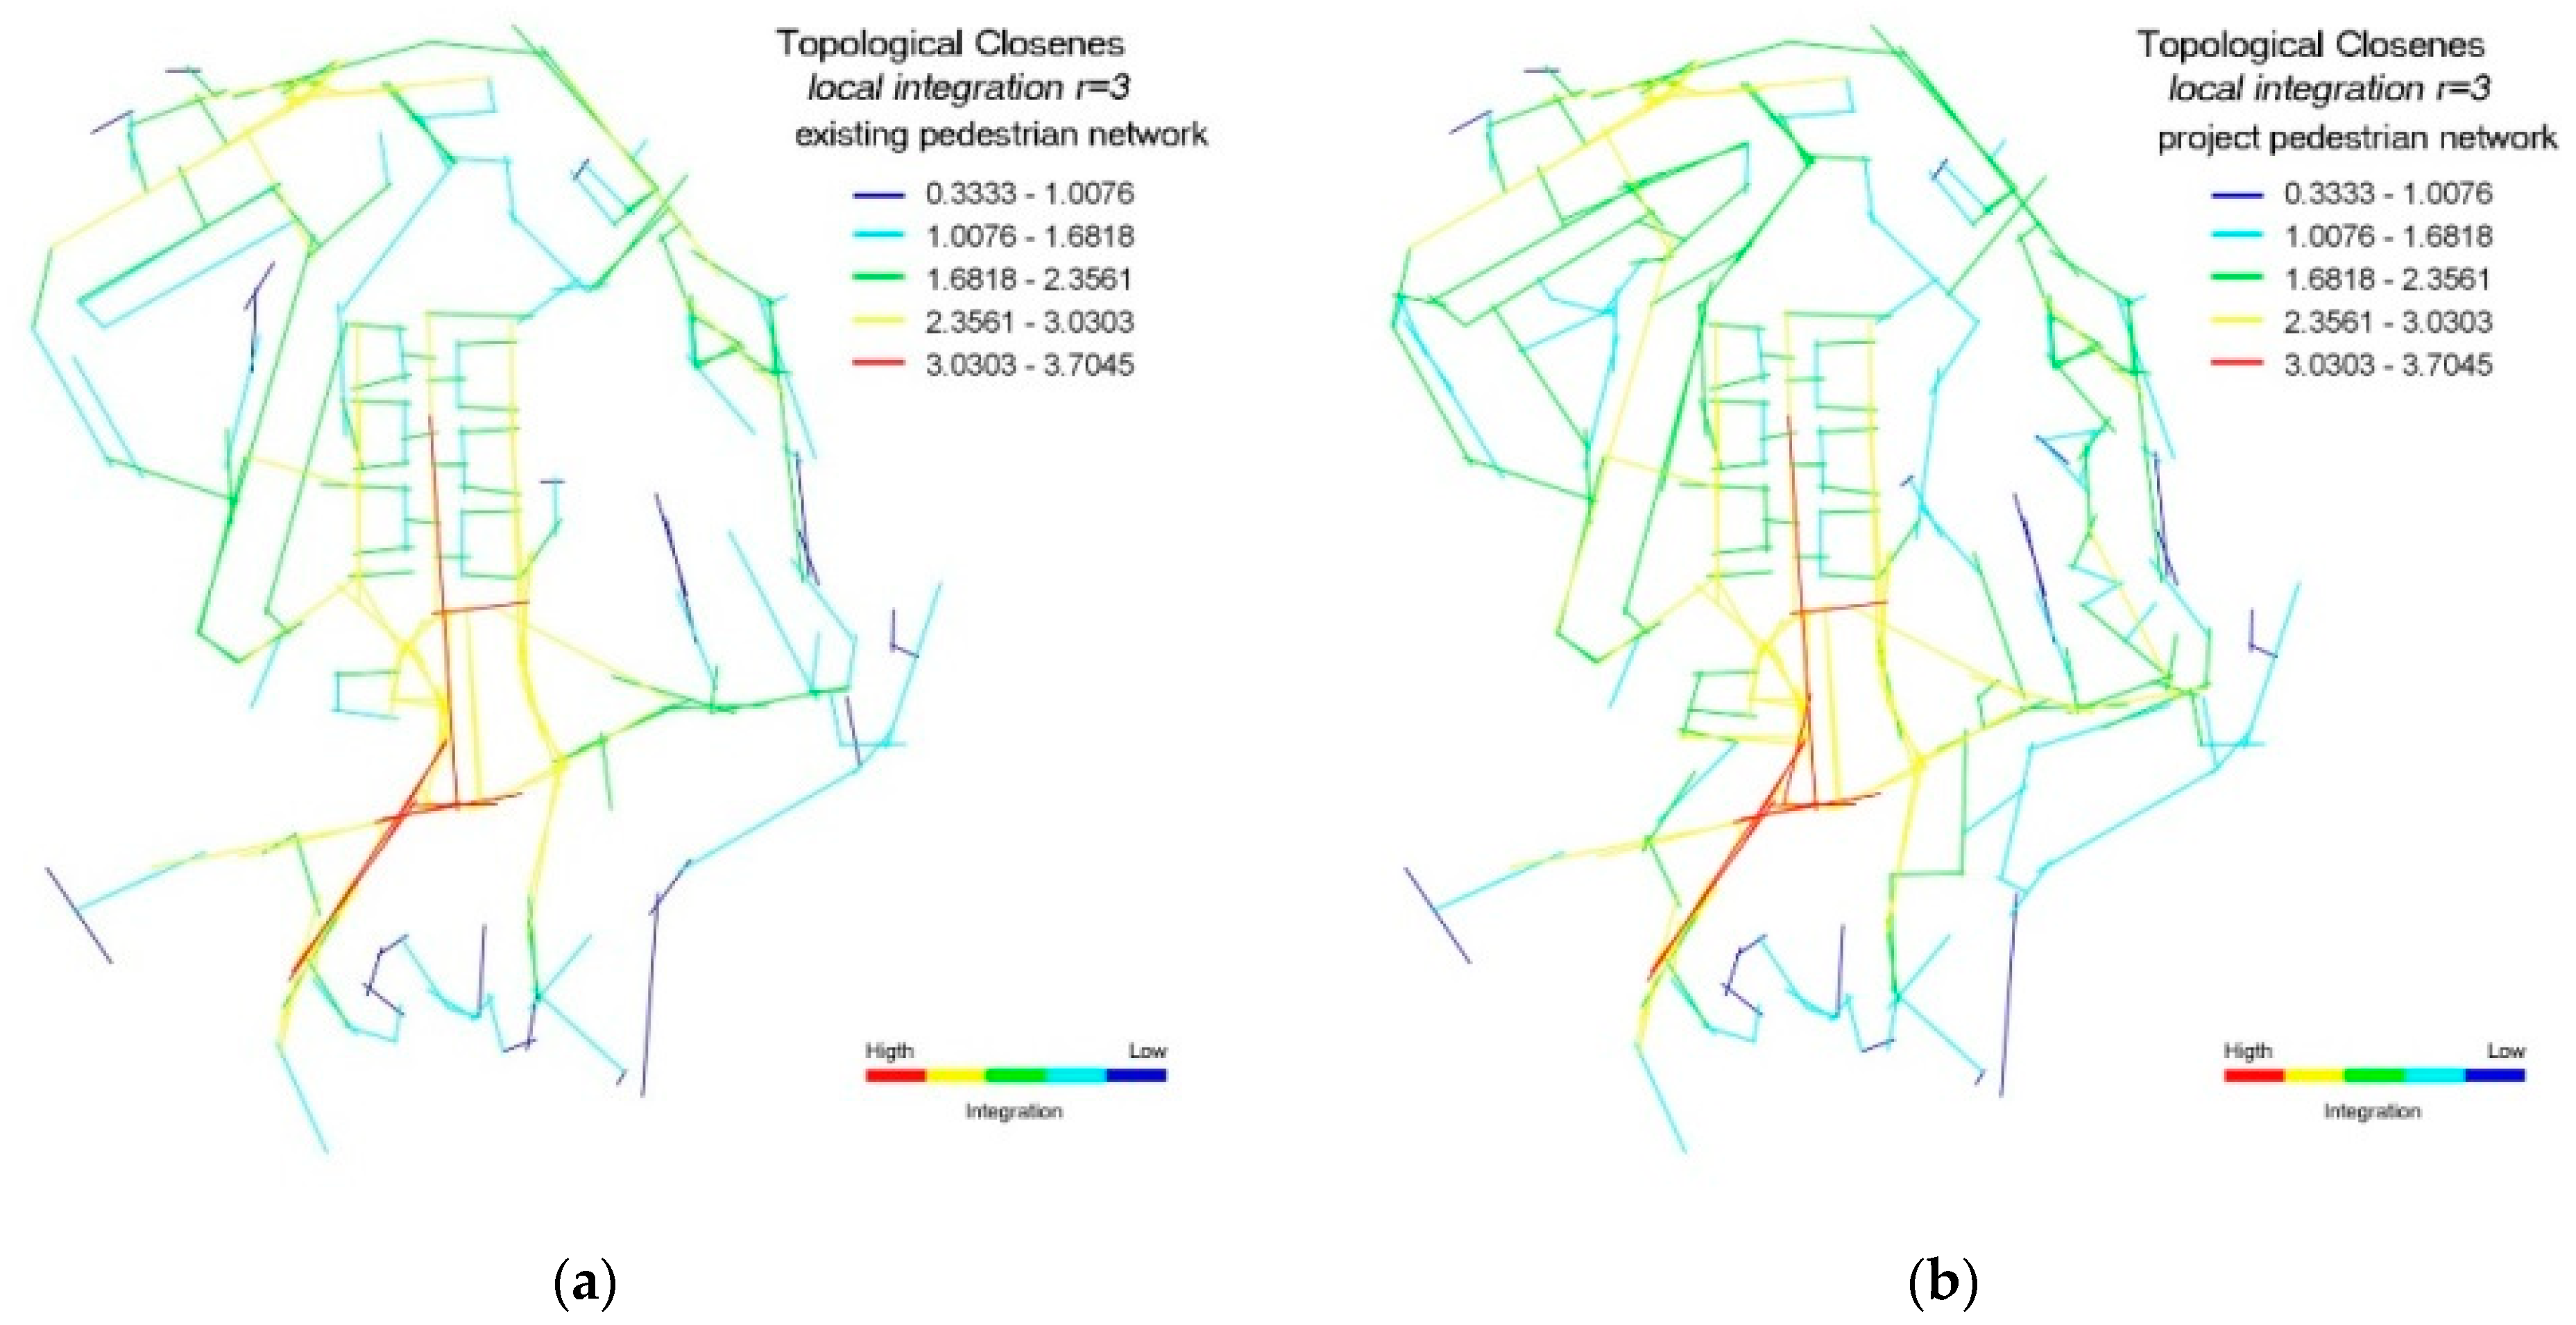
Table 1.
Statistical values for topological connectivity. Value_1 refers to the values calculated on the existing road network. Value_2 shows the values of the existing network that also includes pedestrian paths.
Table 1.
Statistical values for topological connectivity. Value_1 refers to the values calculated on the existing road network. Value_2 shows the values of the existing network that also includes pedestrian paths.
| Statistic Values | Value_1 | Value_2 |
|---|---|---|
| Number of features | 217 | 236 |
| Average | 5.447004608 | 5.83898305 |
| Standard deviation | 3.727862802 | 3.961617412 |
| Variance | 13.896961073 | 15.694412525 |
| Minimum | 1.0 | 1.0 |
| Maximum | 20.0 | 21.0 |
| Gini Coeff. | 0.37 | 0.3695 |
Table 2.
Statistical values for global topological integration. Value_1 refers to the values calculated on the existing road network. Value_2 shows the values of the existing network which also includes pedestrian paths.
Table 2.
Statistical values for global topological integration. Value_1 refers to the values calculated on the existing road network. Value_2 shows the values of the existing network which also includes pedestrian paths.
| Statistic Values | Value_1 | Value_2 |
|---|---|---|
| Number of features | 217 | 236 |
| Average | 0.775625009 | 0.90107865 |
| Standard deviation | 0.155029437 | 0.205679592 |
| Variance | 0.024034126 | 0.042304094 |
| Minimum | 0.43420336 | 0.45905045 |
| Maximum | 1.1294508 | 1.3543476 |
| Gini Coeff. | 0.1136 | 0.1307 |
Table 3.
Statistical values for local topological integration. Value_1 refers to the values calculated on the existing road network. Value_2 shows the values of the existing network which also includes pedestrian paths.
Table 3.
Statistical values for local topological integration. Value_1 refers to the values calculated on the existing road network. Value_2 shows the values of the existing network which also includes pedestrian paths.
| Statistic Values | Value_1 | Value_2 |
|---|---|---|
| Number of features | 217 | 236 |
| Average | 1.852684543 | 1.951828389 |
| Standard deviation | 0.676257005 | 0.668399262 |
| Variance | 0.457323537 | 0.446757574 |
| Minimum | 0.33333334 | 0.33333334 |
| Maximum | 3.7045445 | 3.5384874 |
| Gini Coeff. | 0.2081 | 0.1945 |
Table 4.
Statistical values for global topological choice. Value_1 refers to the values calculated on the existing road network. Value_2 shows the values of the existing network that also includes pedestrian paths.
Table 4.
Statistical values for global topological choice. Value_1 refers to the values calculated on the existing road network. Value_2 shows the values of the existing network that also includes pedestrian paths.
| Statistic Values | Value_1 | Value_2 |
|---|---|---|
| Number of features | 212 | 212 |
| Average | 0.065307596 | 0.053629781 |
| Standard deviation | 0.098053315 | 0.078102101 |
| Variance | 0.009614452 | 0.006099938 |
| Minimum | 0.0 | 0.0 |
| Maximum | 0.51546079 | 0.3866885 |
| Gini Coeff. | 0.6727 | 0.6556 |
Table 5.
Statistical values for Local topological choice. Value_1 refers to the values calculated on the existing road network. Value_2 shows the values of the existing network that also includes pedestrian paths.
Table 5.
Statistical values for Local topological choice. Value_1 refers to the values calculated on the existing road network. Value_2 shows the values of the existing network that also includes pedestrian paths.
| Statistic Values | Value_1 | Value_2 |
|---|---|---|
| Number of features | 212 | 212 |
| Average | 0.087254211 | 0.076828541 |
| Standard deviation | 0.09639385 | 0.089500244 |
| Variance | 0.009291774 | 0.008010293 |
| Minimum | 0.0 | 0.0 |
| Maximum | 0.53571427 | 0.5714286 |
| Gini Coeff. | 0.5488 | 0.556 |
Table 6.
Statistical values for topological connectivity. Value_3 refers to the values calculated on the project road network.
Table 6.
Statistical values for topological connectivity. Value_3 refers to the values calculated on the project road network.
| Statistic Values | Value_3 |
|---|---|
| Number of features | 277 |
| Average | 5.833935018 |
| Standard deviation | 3.847433863 |
| Variance | 14.802747331 |
| Minimum | 1.0 |
| Maximum | 22.0 |
| Gini Coeff. | 0.356 |
Table 7.
Statistical values for topological integration on the project road network.
| Statistic Values | Value_3 (r = n) | Value_3 (r = 3) |
|---|---|---|
| Number of features | 277 | 277 |
| Average | 0.931032989 | 1.985940958 |
| Standard deviation | 0.197277857 | 0.614140742 |
| Variance | 0.038918553 | 0.377168851 |
| Minimum | 0.48586929 | 0.33333334 |
| Maximum | 1.400864 | 3.5725749 |
| Gini Coeff. | 0.121 | 0.1751 |
Table 8.
Statistical values for topological choice on the project road network.
| Statistic Values | Value_3 (r = n) | Value_3 (r = 3) |
|---|---|---|
| Number of features | 277 | 277 |
| Average | 0.045605703 | 0.072918521 |
| Standard deviation | 0.070276358 | 0.082852024 |
| Variance | 0.004938766 | 0.006864457 |
| Minimum | 0.0 | 0.0 |
| Maximum | 0.40653491 | 0.53571427 |
| Gini Coeff. | 0.6665 | 0.5394 |
Table 9.
Statistical values for topological connectivity before and after proposed pedestrian route network.
Table 9.
Statistical values for topological connectivity before and after proposed pedestrian route network.
| Topological Connectivity | ||
|---|---|---|
| Statistic Values | Before | After |
| Number of features | 236 | 277 |
| Average | 5.83898305 | 5.833935018 |
| Standard deviation | 3.961617412 | 3.847433863 |
| Variance | 15.694412525 | 14.802747331 |
| Minimum | 1.0 | 1.0 |
| Maximum | 21.0 | 22.0 |
| Gini Coeff. | 0.3695 | 0.356 |
Table 10.
Statistical values for global topological integration (r = n) before and after proposed pedestrian route network.
Table 10.
Statistical values for global topological integration (r = n) before and after proposed pedestrian route network.
| Global Topological Integration (r = n) | ||
|---|---|---|
| Statistic Values | Before | After |
| Number of features | 236 | 277 |
| Average | 0.90107865 | 0.931032989 |
| Standard deviation | 0.205679592 | 0.197277857 |
| Variance | 0.042304094 | 0.038918553 |
| Minimum | 0.45905045 | 0.48586929 |
| Maximum | 1.3543476 | 1.400864 |
| Gini Coeff. | 0.1307 | 0.121 |
Table 11.
Statistical values for local topological integration (r = 3) before and after proposed pedestrian route network.
Table 11.
Statistical values for local topological integration (r = 3) before and after proposed pedestrian route network.
| Global Topological Integration (r = 3) | ||
|---|---|---|
| Statistic Values | Before | After |
| Number of features | 236 | 277 |
| Average | 1.951828389 | 1.985940958 |
| Standard deviation | 0.668399262 | 0.614140742 |
| Variance | 0.446757574 | 0.377168851 |
| Minimum | 0.33333334 | 0.33333334 |
| Maximum | 3.5384874 | 3.5725749 |
| Gini Coeff. | 0.1945 | 0.1751 |
Publisher’s Note: MDPI stays neutral with regard to jurisdictional claims in published maps and institutional affiliations. |
© 2021 by the authors. Licensee MDPI, Basel, Switzerland. This article is an open access article distributed under the terms and conditions of the Creative Commons Attribution (CC BY) license (https://creativecommons.org/licenses/by/4.0/).
Share and Cite
MDPI and ACS Style
Scorza, F.; Fortunato, G.; Carbone, R.; Murgante, B.; Pontrandolfi, P. Increasing Urban Walkability through Citizens’ Participation Processes. Sustainability 2021, 13, 5835. https://0-doi-org.brum.beds.ac.uk/10.3390/su13115835
AMA Style
Scorza F, Fortunato G, Carbone R, Murgante B, Pontrandolfi P. Increasing Urban Walkability through Citizens’ Participation Processes. Sustainability. 2021; 13(11):5835. https://0-doi-org.brum.beds.ac.uk/10.3390/su13115835
Chicago/Turabian StyleScorza, Francesco, Giovanni Fortunato, Raffaella Carbone, Beniamino Murgante, and Piergiuseppe Pontrandolfi. 2021. "Increasing Urban Walkability through Citizens’ Participation Processes" Sustainability 13, no. 11: 5835. https://0-doi-org.brum.beds.ac.uk/10.3390/su13115835
Note that from the first issue of 2016, this journal uses article numbers instead of page numbers. See further details here.