Article

Sustainable Competitiveness of Tourism in the Algarve Region. Critical Stakeholders’ Perception of the Supply Sector

by
Fátima Farinha
1,*,
David Bienvenido-Huertas
2,
Manuel Duarte Pinheiro
3,
Elisa M. J. Silva
1,
Rui Lança
1,
Miguel José Oliveira
1 and
Ricardo Batista
4
1
Higher Institute of Engineering, University of Algarve, CEPAC/CTA, 8005-139 Faro, Portugal
2
Department of Building Construction II, University of Seville, Av. Reina Mercedes 4A, 41012 Seville, Spain
3
Department of Civil Engineering, Architecture and Georesources, Técnico, Universidade Lisboa, CERIS, 1049-001 Lisboa, Portugal
4
AHETA—Associação dos Hotéis e Empreendimentos Turísticos do Algarve, E.C. Cerro Alagoa—Apartado 2360, 8201-918 Albufeira, Portugal
*
Author to whom correspondence should be addressed.
Sustainability 2021, 13(11), 6072; https://0-doi-org.brum.beds.ac.uk/10.3390/su13116072
Submission received: 29 January 2021 / Revised: 26 April 2021 / Accepted: 17 May 2021 / Published: 28 May 2021

Abstract

:
The Algarve region, located in the south of Portugal, is a well-known tourism destination that seeks to be sustainable and competitive. The local administration looks to establish a collaborative network, where stakeholders take a crucial role. The research aims to appeal to the accommodations and food services stakeholders to have a shared vision of the issues and priorities related to sustainable tourism development. Their perception is a critical factor in making decisions regarding the region’s competitiveness. Algarve’s two major and leading associations of the tourism supply sector AIHSA and AHETA were invited to participate in the study. Based on the responses of an online questionnaire, an artificial intelligence algorithm was applied to the data to identify the common and divergent aspects. The conceptual model developed is based on a simplified model of psychological ownership. The results highlight a convergent perspective regarding sustainability challenges, namely, natural resources and biodiversity, safety, and supply chain. However, hotels and restaurants do not reflect the same perception regarding sustainability initiatives, e-tourism, or free internet access. These divergences are essential results since they indicated which issues require local authorities’ priority intervention.

1. Introduction

Tourism is becoming undoubtedly a driving force for economic growth. This industry plays a crucial role in creating employment opportunities and regional development. Still, it should also be a vehicle to protect and restore earth biodiversity and build bridges between people and cultures [1] to ensure the tourism sector’s long-term sustainability.
For this dynamic tourism, searching sustainability is essential to understand the underlying structure and the feedback mechanisms that influence the functioning of tourism over time [2]. While the economic benefits are clear, it is essential to understand the repercussions on the environmental, sociocultural, and institutional aspects.
According to Nadalipour et al. [3], sustainable competitiveness requires two major aspects: (i) economic, sociocultural, and ecological dimensions of tourism, and (ii) the stakeholders’ view that participates in the tourism process.
To search tourism sustainability objectives, it is necessary to develop collective actions. However, supposing the stakeholders, e.g., a part that has an interest and can either affect or be affected by the sector policy, do not have shared visions on sustainability, in this case, governance faces significant obstacles, such as the difficulty to influence the private sector and different interests and priorities of the relevant stakeholders. These difficulties in sustainable tourism policies should be better understood to design adequate measures and plans [4] and are among the most critical challenges when improving the sustainability of a region [5]. According to Benur and Framwell [6], there is a need for consensus between the government and stakeholders to ensure an integrated and sustainable strategy. The role of stakeholders in sustainable tourism strategies is critical [7]. Kornilaki et al. [8] reported the importance of “perceived self-efficacy influence” and the “capabilities and motivation to behave sustainably”.
A higher level of sustainability and competitiveness may be achieved if there is cooperative governance assuring the engagement of stakeholders [9]. One of the least analyzed perspectives is understanding the supply side of the tourism equation, like hotels and restaurants [9].
In the destination competitiveness, Abreu-Novais et al. [10] highlight one of the gaps in how different stakeholders conceptualize destination competitiveness. Understanding the shared vision and differences is essential to build sustainable and competitive tourism in the region, namely, the leading sustainability factors (e.g., water, energy) and competitive advantages (e.g., safety, price).
The research problem is to analyze if stakeholders on the supply side (accommodations and food services stakeholders) have a shared vision of the issues and priorities on sustainable tourism development to assess the competitiveness of the region, i.e., do accommodations and food services stakeholders have a different perspective depending on the type of activity, size, category, and other key factors?
The region of Algarve represents 31% of the Portuguese hotel’s beds, receiving in 2019 15.92 million visits of foreign tourists and 5.03 million visits of national tourists. Thus, it was selected for the case analysis and since sustainable growth of the region is a relevant concern for public decision-makers and the private sector, mainly the supply services.
For supporting and monitoring the search of sustainability, Algarve has a web platform, designated, Observatory of Sustainability of the Algarve Region for Tourism (OBSERVE) [11], where the most relevant sustainability indicators in four main domains—environmental, economic, sociocultural, and institutional [12]—allow the analysis and assessment of the Algarve region, helping government and stakeholders to make the right decisions.
Within the OBSERVE platform’s scope, a survey was developed to assess the sustainable competitiveness of the tourism sector in the region of Algarve. Stakeholders from the supply service (e.g., hotels, restaurant) were invited to answer specific questions and share their vision concerning the environmental, sociocultural, economic, and institutional domains.
The paper structure presents a literature review of competitive tourism advantages, stakeholders’ perception and factors in sustainable tourism (Section 2), the methodology framework (Section 3), the results obtained (Section 4), in Section 5, the discussion and research limitations, and finally, the conclusions and further research paths (Section 6). Appendix A presents the complete questionnaire.

2. Tourism Competitive Advantages, Stakeholders’ Perception, and Factors in Sustainable Tourism

2.1. Sustainable Tourism and Competitive Tourism Advantages

Competitiveness “is one of the core issues for tourism destinations and regional stakeholders” [13], where an appropriate level of development in terms of services (i.e., connectivity, infrastructure, safety, attractions, excursions, hotels, restaurants, and others) is achieved [14].
Tourism destination competitiveness has several definitions and perspectives [15]. The concept of destination competitiveness, has in the classical perspective, the focus on the capacity to attract visitors, assure revenues, obtain a favorable position [16] to a memorable experience and balance with the wellbeing of destinations residents and natural capital of the future generations [17].
In their seminal work, Ritchie and Crouch [18] claimed that a competitive destination “promotes the maximum wellbeing for its inhabitants in a sustainable way”. They also emphasized the importance of the destination management organization “in providing leadership and coordination the many destination stakeholders that must contribute and work together”.
The traditional market perspective sustainable competitive advantage is “an advantage that allows a business to be more successful than its competitors over a long period of time” [19], and extended to a new increasing trend where the competitiveness is connecting with sustainability [15], considering the perspective environmental and sustainable development [20] with other economic and social dimensions. Therefore, improving the competitiveness of a destination should be done by analyzing the more significant beneficial impact obtained with the limitation of resources [21].
Sustainable tourism responds to the need for more responsible policies and forms of corporate governance [22]. A green marketing strategy based on a shared vision can help to define and implement a sound strategy [23] and cultivate a shared environmental vision while harnessing the capability of fast response to new environmental technologies and challenges [24].
In 2000, the United Nation Economic and Social Council stated that “the tourism development has to be built on an ecological base on the long-term and the economic and social levels of the local societies” [25]. In its modern definition, sustainable development does not exclude tourism as a sensitive sector that seems to be a new global direction. Nowadays, creating a solid base for this industry targets its transformation in achieving sustainable development. The objectives of sustainable tourism are [26]
  • Maintenance and protection of the natural, cultural, social, historical, and patrimonial heritage of a region, including the gastronomy, the dances, the dress code, the ancestral festivals, among others. These aspects will allow the perpetuation of traditions and the involvement of the local residents, giving them a sense of community. It will also personalize the destination and allow closer contact between tourists and locals;
  • Minimizing the pressure caused by tourism on the natural environment. Protection and mitigation of the impact generated by the sector on water (water quality, water availability); coastal and fluvial waters and beaches quality; the ecosystem of the region (fragile by nature since it depends on an equilibrium between species); soils, cliffs, and wetlands (pollution, erosion); forest, wildlife, and climate;
  • Rationalizing the resources used by the tourists. Tourism is changing, and touristic destinations must evolve and adapt to the new challenges.
For a long time, economic development used to be the major factor in tourist destinations. A progressively sustainable touristic destination concept is related to creating a destination with lasting livelihoods while minimizing resource depletion, environmental damage, cultural instability, and social disruption [6].
Many tourism destination visions lack consistency, and only a few address sustainability itself [27]. The tourism sector in some countries is developing comprehensive policies that have medium- and long-term effects while avoiding short-term development plans, working on putting long-term studies and plans to create a kind of stability and establishment for this sector [28].
The development of a model of destination competitiveness cloud is assessed by a set of indicators that allows the identification of the relative strengths and weaknesses of different tourism destinations and can be used by industry and governments to increase tourism numbers and expenditure and enhance socioeconomic prosperity [29].
Destinations must learn how to think, more like businesses, and develop new products, markets, and customers. Simultaneously, how different governance systems and destinations with varying levels of development compete, mainly if they are cooperative or managerial [9].
Governance to sustainable tourism should take into consideration a shared vision, goal congruence, and interaction [30], engage stakeholders, beginning with the supply side services that could also be a partner or press to innovation [31], and adopt sustainable practices [32]. A sustainable touristic destination concept is related to creating a destination with lasting livelihoods while minimizing resource depletion, environmental damage, cultural instability, and social disruption [6].

2.2. Stakeholders’ Perception and Factors in Sustainable Tourism

Sustainability of tourism, and specifically of destination, relies on the basic assumption of tourist sustainability, which is concerned with fulfilling the needs of all groups of tourism stakeholders in a given destination; the structural idiosyncrasy of a cultural, political, and socioeconomic context influences the perceptions of the local tourism industry regarding tourism sustainability [33].
The World Tourism Organization (WTO) has stated that tourism development activities have to be planned, managed, and developed, taking into account the needs and attitudes of the stakeholders towards tourism development [34].
In the tourism industry of some regions, the relevant stakeholders are not concerned about environmental and sustainability matters. However, with most of them, natural attractions are a crucial and distinctive part of the experience [14]. The behavior of the residents is essential for the sustainability of a destination brand, and positive ownership affects the protective behavior [35]. The residents’ perception of the benefits of tourism, economic, sociocultural, and environmental sustainability affect the consolidation and development and could limit the involvement stages of community-based tourism development [36].
Local ownership patterns and destination governance play critical roles in defining a destination’s direction/pace of development, steering it towards or away from tourism-led inclusive growth [37] and to sustainability.
Collaborative policymaking is needed among stakeholders, namely, local and government agencies/authorities, as well as native and enterprise communities, which should work together under the same purpose [38,39] to achieve sustainable tourism development. Furthermore, multi-stakeholder engagement and the significance of partnerships between government, businesses, local residents, and visitors could be a way of contributing to competitive tourism advantages [40].
A shared vision of the stakeholders is a critical point for implementing specific policies to promote the sustainability and competitiveness of a destination [23].
The evolution of stakeholders’ influence and involvement in tourism destinations help to understand the three aspects of stakeholder theory of Donaldson and Preston [41]. Geiger [42] summarizes it as:
  • Descriptive/empiric aspect—describes the past, present, and future state of the organization. In tourism, this might be stakeholders in a destination, their relationships, but also the history of touristic development and how it influenced the present;
  • Instrumental aspect—highlights the connections between actions in stakeholder management and the resulting outcomes. In tourism, this might be the appearance of a new competitor in a sector and the subsequent redistribution of market shares;
  • Normative aspect—used to interpret the corporation’s function, including identifying moral or philosophical guidelines for the operation and management of corporations [41] and according to Byrd [43] is the fundamental core of the stakeholder theory. The normative aspect dictates that all stakeholders and their interests must be viewed as targets and, therefore, be involved in the development destination.
For this process to succeed, all stakeholder interests must be recognized and comprehended in all their facets, even though not all stakeholders need to be involved equally in decision-making processes [41]. The omission of the interest of even one primary stakeholder can prevent the success of the process as a whole [44]. Therefore, policy-decision stakeholders should try to hear and understand the interests of each stakeholder group; otherwise, stakeholders with less power might lose interest in the process [45].
In the last three decades, researchers have been recommending a broader integration of all stakeholders in the planning process of touristic development. Byrd [46] points out that studies are divided into two different perspectives: (i) a more business-oriented, calling for a stakeholder inclusion model based on their respective power and influence in a destination; (ii) a collaborative idea of stakeholder involvement, not associated with individual stakeholders’ power-level. This last approach is based on community-based tourism development [47], which is the normative aspect of the Stakeholder Theory, summarized by Sautter and Leisen [45]. To enable stakeholders to achieve the goal of equalizing their influence and power levels is also an important role of governmental agencies [48].
The importance of understanding stakeholders’ vision and their perceptions, attitudes and involvement can influence tourism development, minimizing the negative impacts and maximizing its benefits, leading to community development and greater support for tourism [49].
The need for stakeholder involvement is especially high in a destination that has a sustainable development goal since it considers the different aspects of sustainability, allowing all stakeholders’ participation in the decision-making processes, and pointing out their influence and importance to achieve the overall goal. However, conflicts may occur among stakeholders with different interests and perspectives [50,51,52,53]. Therefore, it is important to alert stakeholders that some of the decisions might prevent them from obtaining their targets in the short-term, but they will probably gain more in a long-term analysis [50].
According to Byrd et al. [54], sustainable tourism is achieved and successful only when stakeholders’ perceptions are accessed and their ideas and interests are integrated and respected in the planning and management process. Stakeholders’ analysis provides a means to start understanding the environmental and social problems and identify different stakeholder group perspectives and stakeholder interests at different levels [51].
However, Freeman et al. [52] state that stakeholder groups are characterized by their relationships between diverse groups and individuals; from this definition, it was evident that stakeholders’ views may be incredibly broad and diverse. Cooperation is one of the stages in the collaborative process but does not solve the fragmented nature of tourism [53]. Considering a large number of stakeholders and interests together might increase complexity and difficulties in the process; however, it is an important stage to establish an effective collaborative process [55].
According to Ven [56]: “stakeholders’ participation in tourism development is necessary to form an essential ingredient in the ‘hospitality atmosphere’ of any destination”. Ven also suggests that initially, stakeholders have a homogenous attitude towards tourism development, and over time, their attitude becomes heterogeneous, especially in the community stakeholders’ perception.
Therefore, it is preferable to assess stakeholders’ attitudes on consolidated touristic destinations or regions. March and Wilkinson [57] report that the complex interrelationships between stakeholders is important and should be considered, since the level of cohesion among them is directly related to the performance of a tourism destination. Unfortunately, sometimes they do not show cohesive and active support and favorable attitudes to achieve the target objective [58,59].
Regarding their attitudes, Ellis and Sheridan [60] state that stakeholders’ positiveness leads to favorable behavior towards tourism development. Their argument is supported by the Theory of Reasoned Action [61], which states that attitude influences behavioral intention leading to particular behaviors. Moreover, as per the social exchange theory, when stakeholders perceive that the benefits of tourism development are higher than the cost, they will be motivated to support it [58].
Therefore, one aspect of stakeholders’ management that needs to be understood is the type of involvement stakeholders will have in the tourism development process. The different interests of each stakeholder group must be considered to have the greatest chance of success. Based on this understanding, planners can then find specific indicators for each group and their perception relative to those issues [53].
Hence, in these last years, segmentation approaches to assess stakeholders’ perceptions and attitudes towards tourism development have been performed, generating important information for tourism policy-makers [40,59,60,62]. Cluster analysis is one of the most used techniques to classify stakeholders that have different attitudes and perceptions towards tourism development [63,64,65,66].
Liu and Ma [67] present a list of research studies conducted on a tourism stakeholder’s perception, which allowed them to understand the diffusion of issues and, consequently, several stakeholder groups.
Abdelgadir et al. [28] define two important steps that need to be put into practice to consider the influence of stakeholders’ perception and factors on sustainable tourism, namely:
  • Listening to different stakeholder groups that are primary participants from the tourism industry, defining strategies according to it and remaining committed to it [45];
  • Advancing to the involvement of different stakeholder groups for promoting steady growth of tourism in areas where four stakeholders are involved: inhabitants, executives, government functionaries, and tourists [43].
Leonidou et al. [23] analyze resources and capabilities as drivers for an environmental marketing survey to answer several hypotheses explaining organizational resources (physical, financial, experiential) and organizational capabilities (share vision, relationship and technology) as supporting an environmental marketing strategy. They also approach the implications of an environmental marketing strategy to assure competitive advantage, influenced by the competitive intensity and market dynamics, and how to take those advantages.
A simplified model of psychological ownership, modified from Pierce et al. [68], is presented in Figure 1. The results of Leonidou et al. [23] study link (besides others) the shared vision (A) with the environmental marketing strategy and the adoption of it as positively related to the achievement of competitive advantage (B). The study is in line with Porter and Linde [62] that consider “companies must go further in innovation and resource productivity to assure the greatest benefits”.
The study of Leonidou et al. [23] also highlights that some touristic stakeholders (e.g., hotels) have a shared vision—the presence of common ideas, commitment, and dedication among the firm’s employees toward the achievement of green organizational objectives [63]—and could be essential to implementing environmental marketing strategies and potential support sustainable tourism.
Figure 2 shows the relationship between formal ownership, attitudes, and behaviors as the base to create competitive advantages in developing a sustainable tourism destination, adjusted from framework structure proposed by Pierce et al. [68].
The bibliographic research, highlight studies, and surveys have been conducted to understand tourists and residential community perception regarding sustainable tourism destinations and their future perspectives. There are fewer research studies and a foggy perception of their vision and from the supply stakeholders’ perceptions.

3. Methodology Framework

3.1. Global Approach

The shared vision could be essential as the base of the supply sector (e.g., hotels, restaurant). Therefore, it is critical to understand the key market stakeholders in the supply service, if they have a shared vision about sustainability and if it is mainly common or different in some key factors.
Using the simplified model of psychological ownership from Pierce et al. [68] as the base context, focusing on the relationships indicated by the solid lines, the conceptual model for the developed research is proposed, which is presented in Figure 3.

3.2. Survey Approach

To assess the perspective of the supply agents, like, hotels and restaurants, a specific survey was carried out from September to November 2019. The survey was designed and launched with the support of two of the most important associations of enterprises with activity on the touristic sector in the region of Algarve, namely, the Association of Hotels and Tourist Resorts in the Algarve (AHETA) and the Association of Hotel and Similar Industrialists in the Algarve (AIHSA).
The questionnaire has six groups of questions, four being on the principal domains of sustainability, namely, environment, sociocultural, economic, and institutional, and two on areas that are relevant for the tourism in the region, namely, gastronomy and a set of other issues related to themes that lead tourists to choose the destination, information about on-going initiative among others. Table 1 shows the major topics covered in the survey. Appendix A presents the full questionnaire (Table A1).
AHETA has 177 associates, representing 411 hotels and tourist resorts, and AIHSA counts about 600 associates, distributed by hotels, restaurants, and bars throughout the Algarve.
The online questionnaire was disseminated electronically among their associates between September and November 2019. Eighty-eight responses were received, 45 and 43, respectively, from AHETA and AIHSA associates. These responses represent 46,535 beds, which correspond to 33% of the 141,000 officially classified beds in hotels and tourist resorts of the Algarve region.
Since the survey is anonymous and the questions about
  • the type and size of the company;
  • the professional category of the person who answered the questionnaire;
are not mandatory, it was decided to analyze the results of the survey carried out without evaluating the relationships between the type and size of the company but giving special attention to the relations between the type of activity of the companies and the answers related to the environmental, sociocultural, economic, and institutional domains.

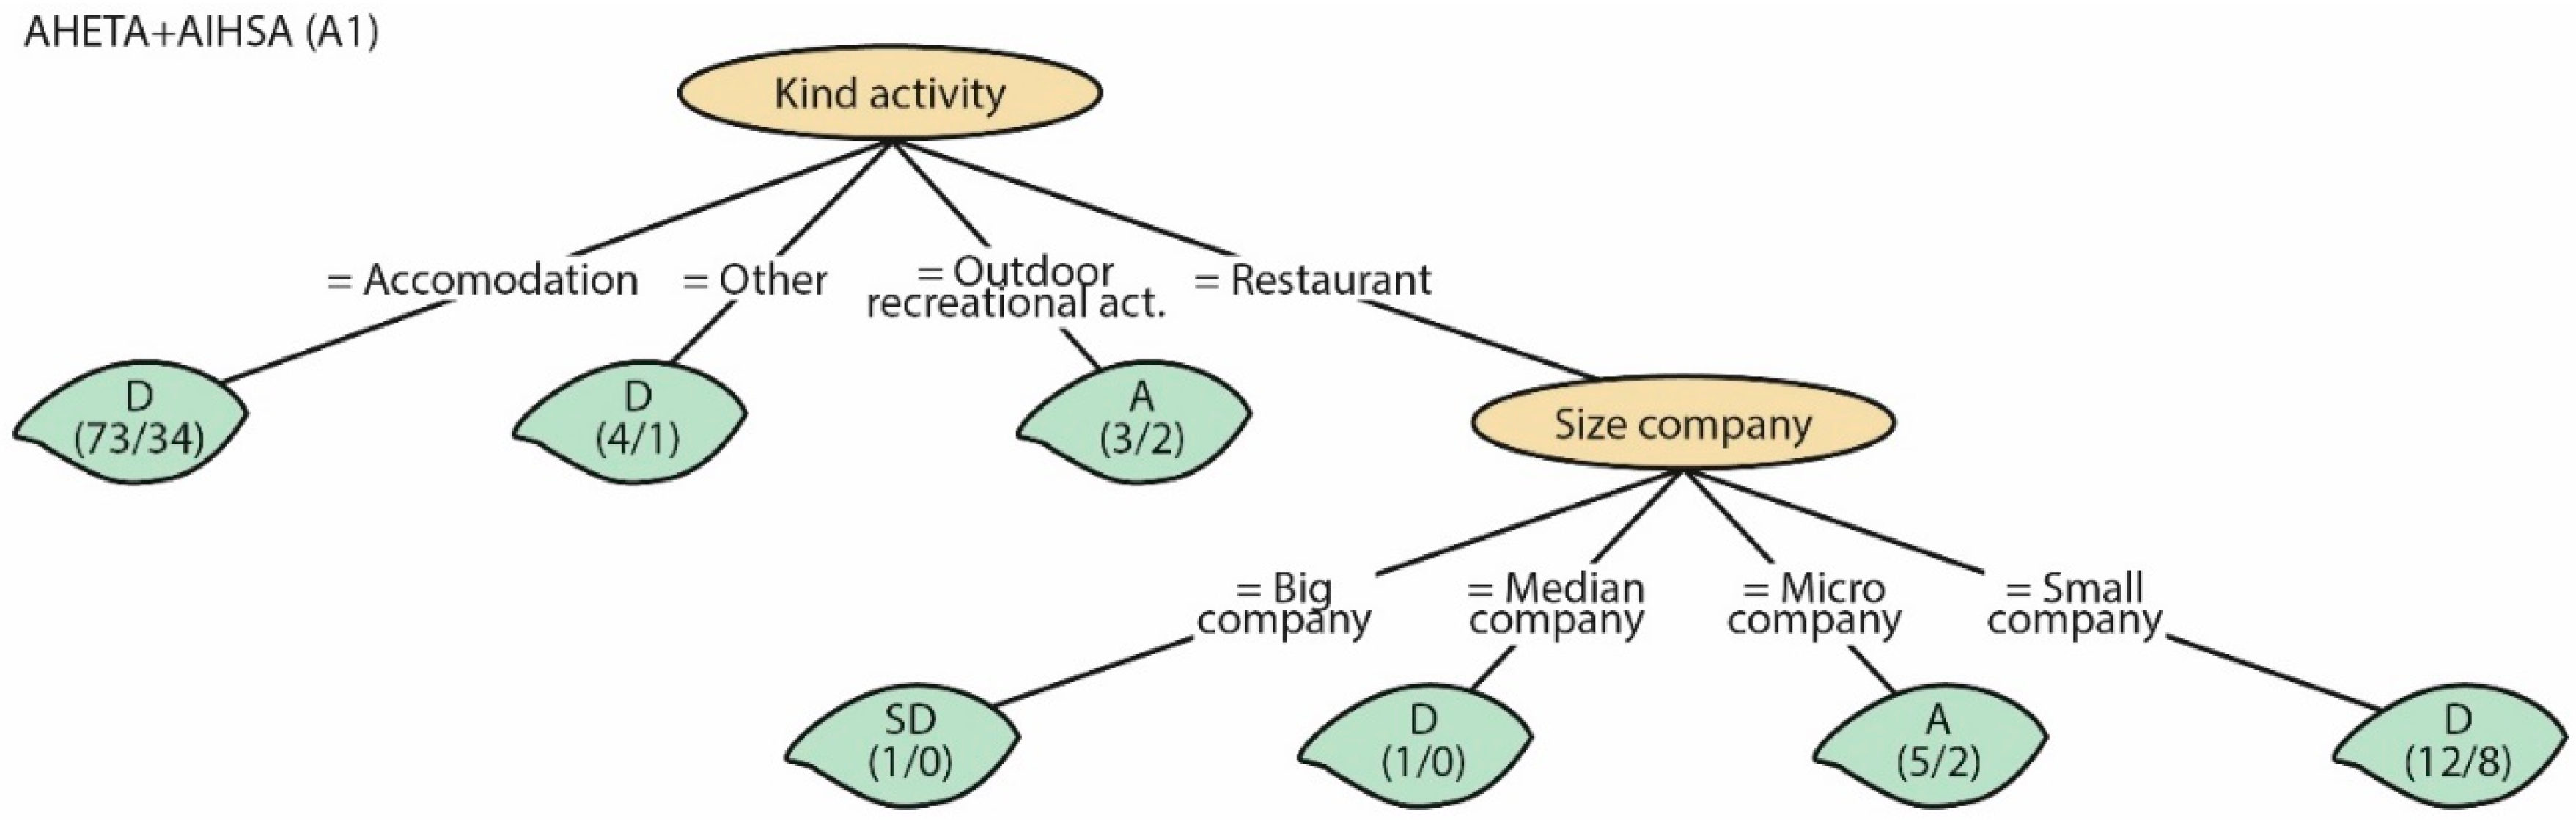
3.3. Artificial Intelligence Analysis
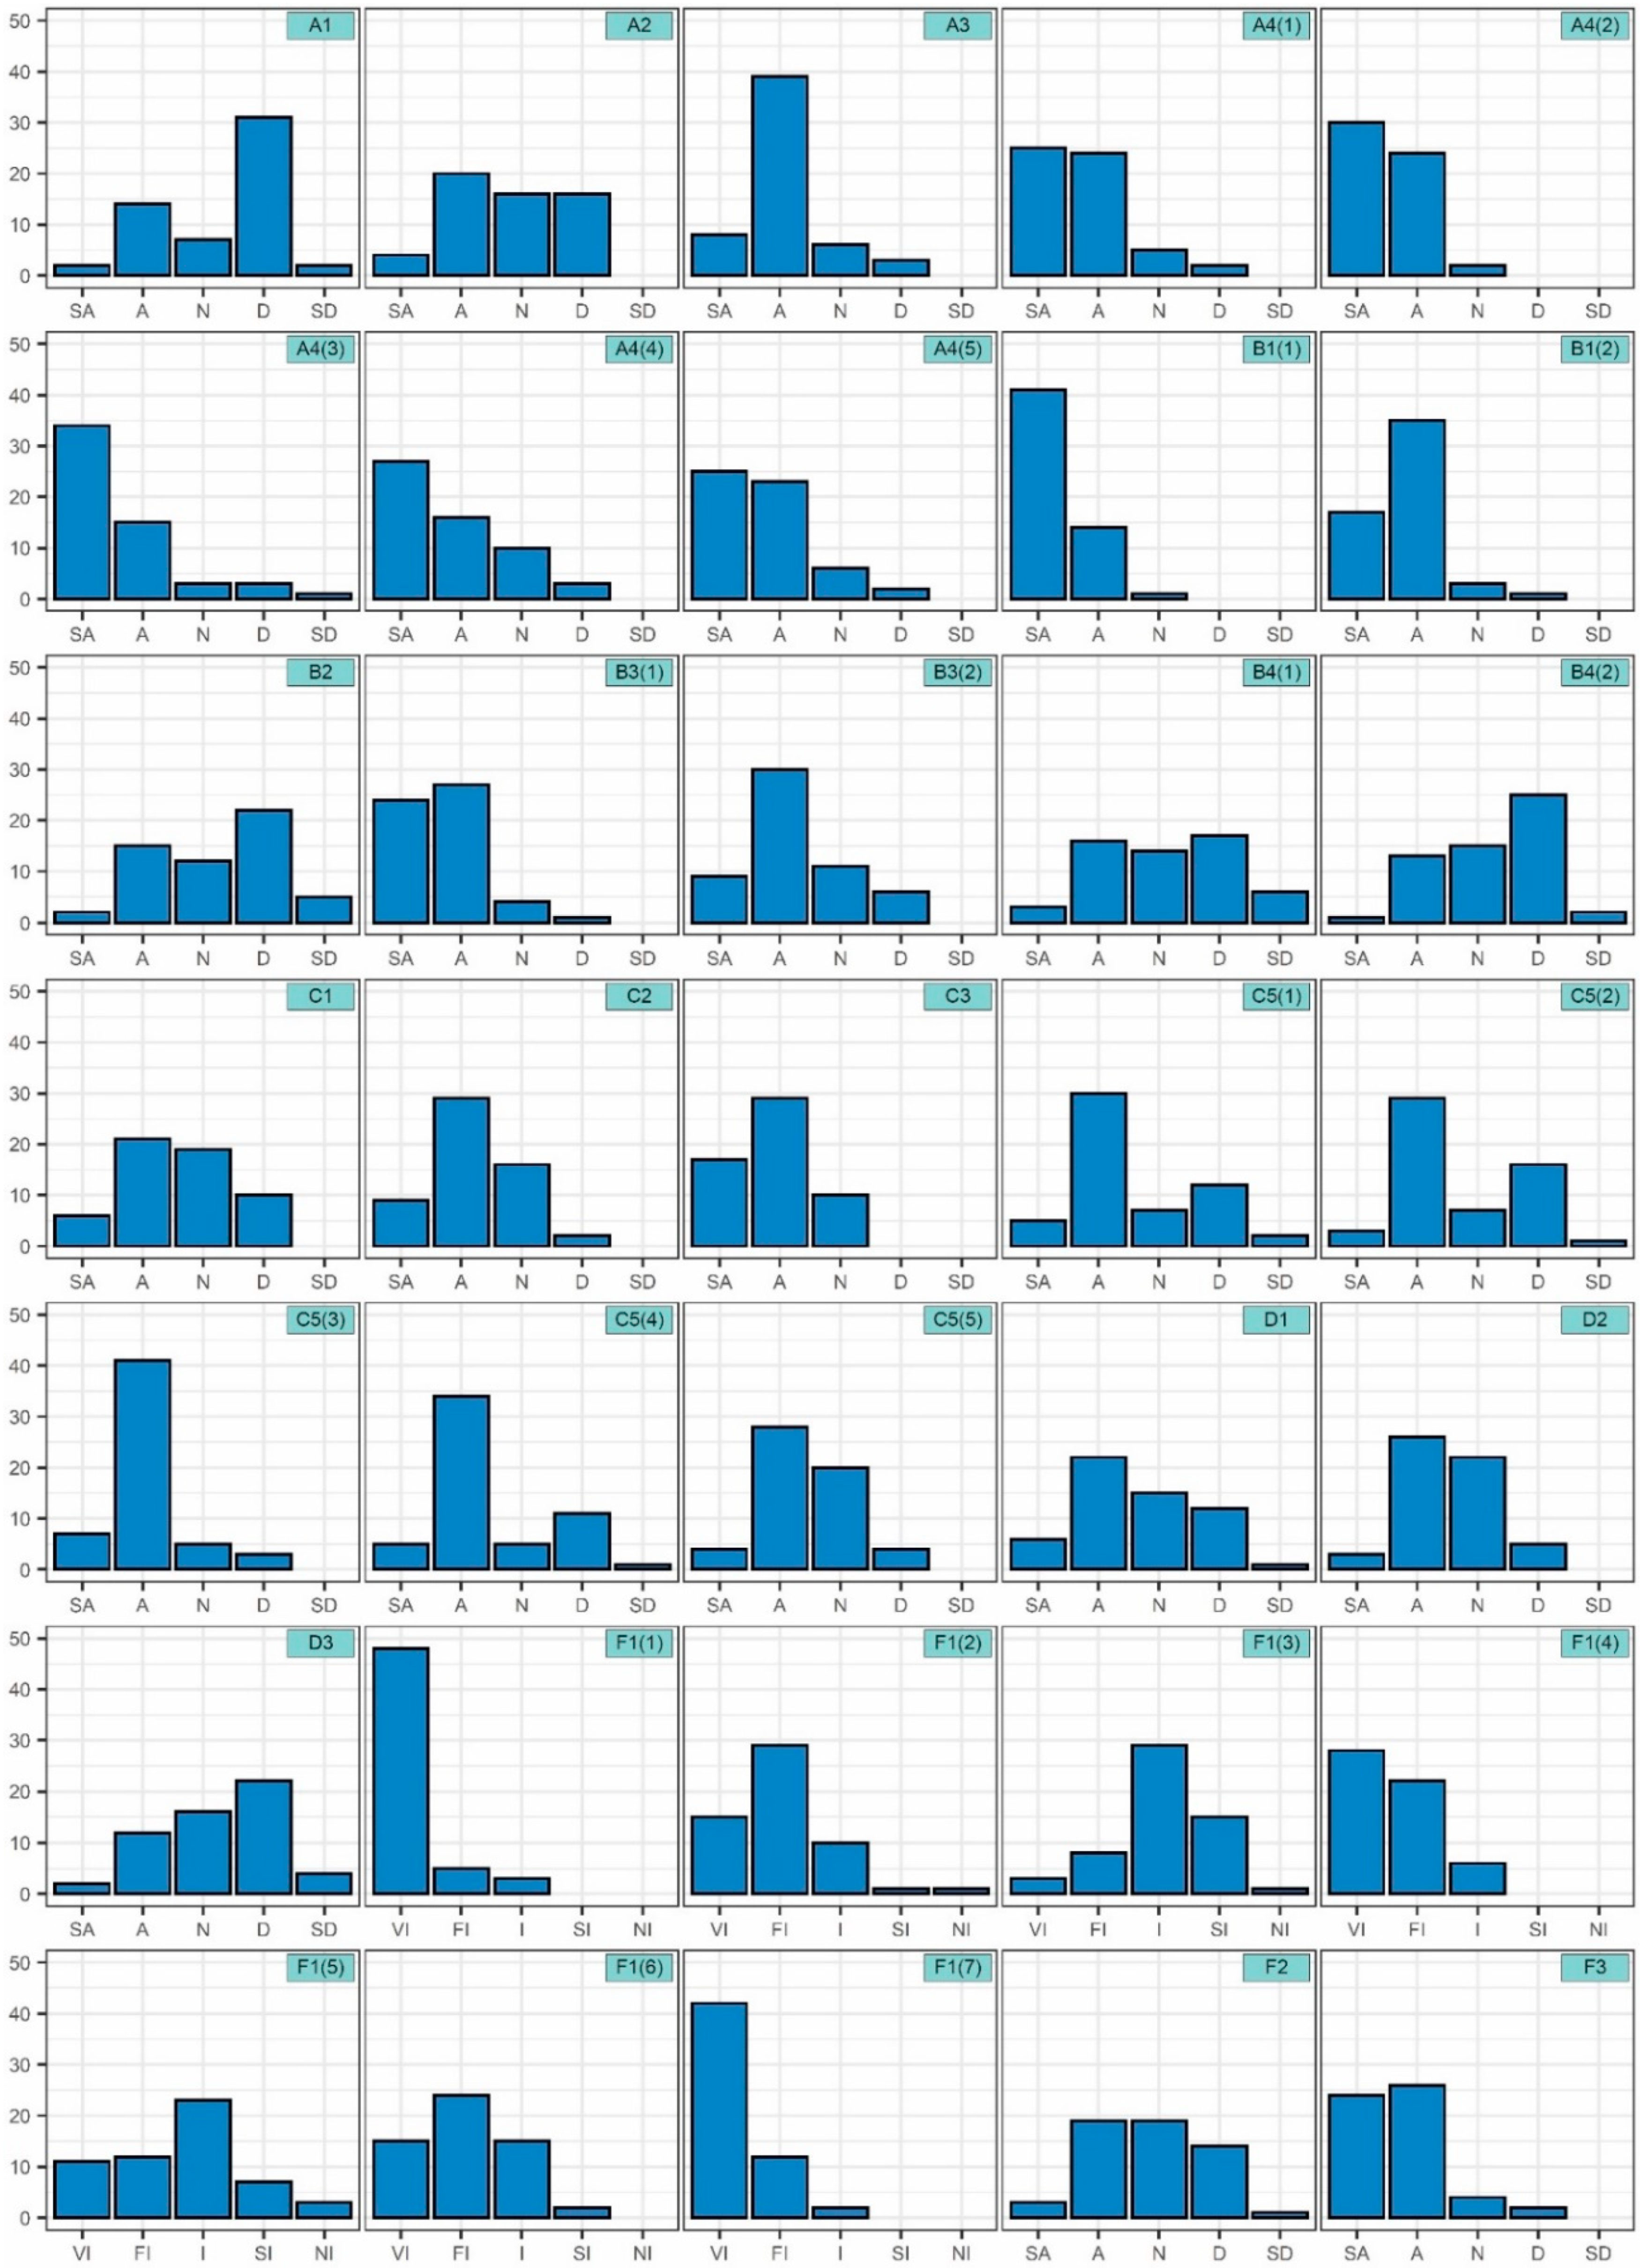
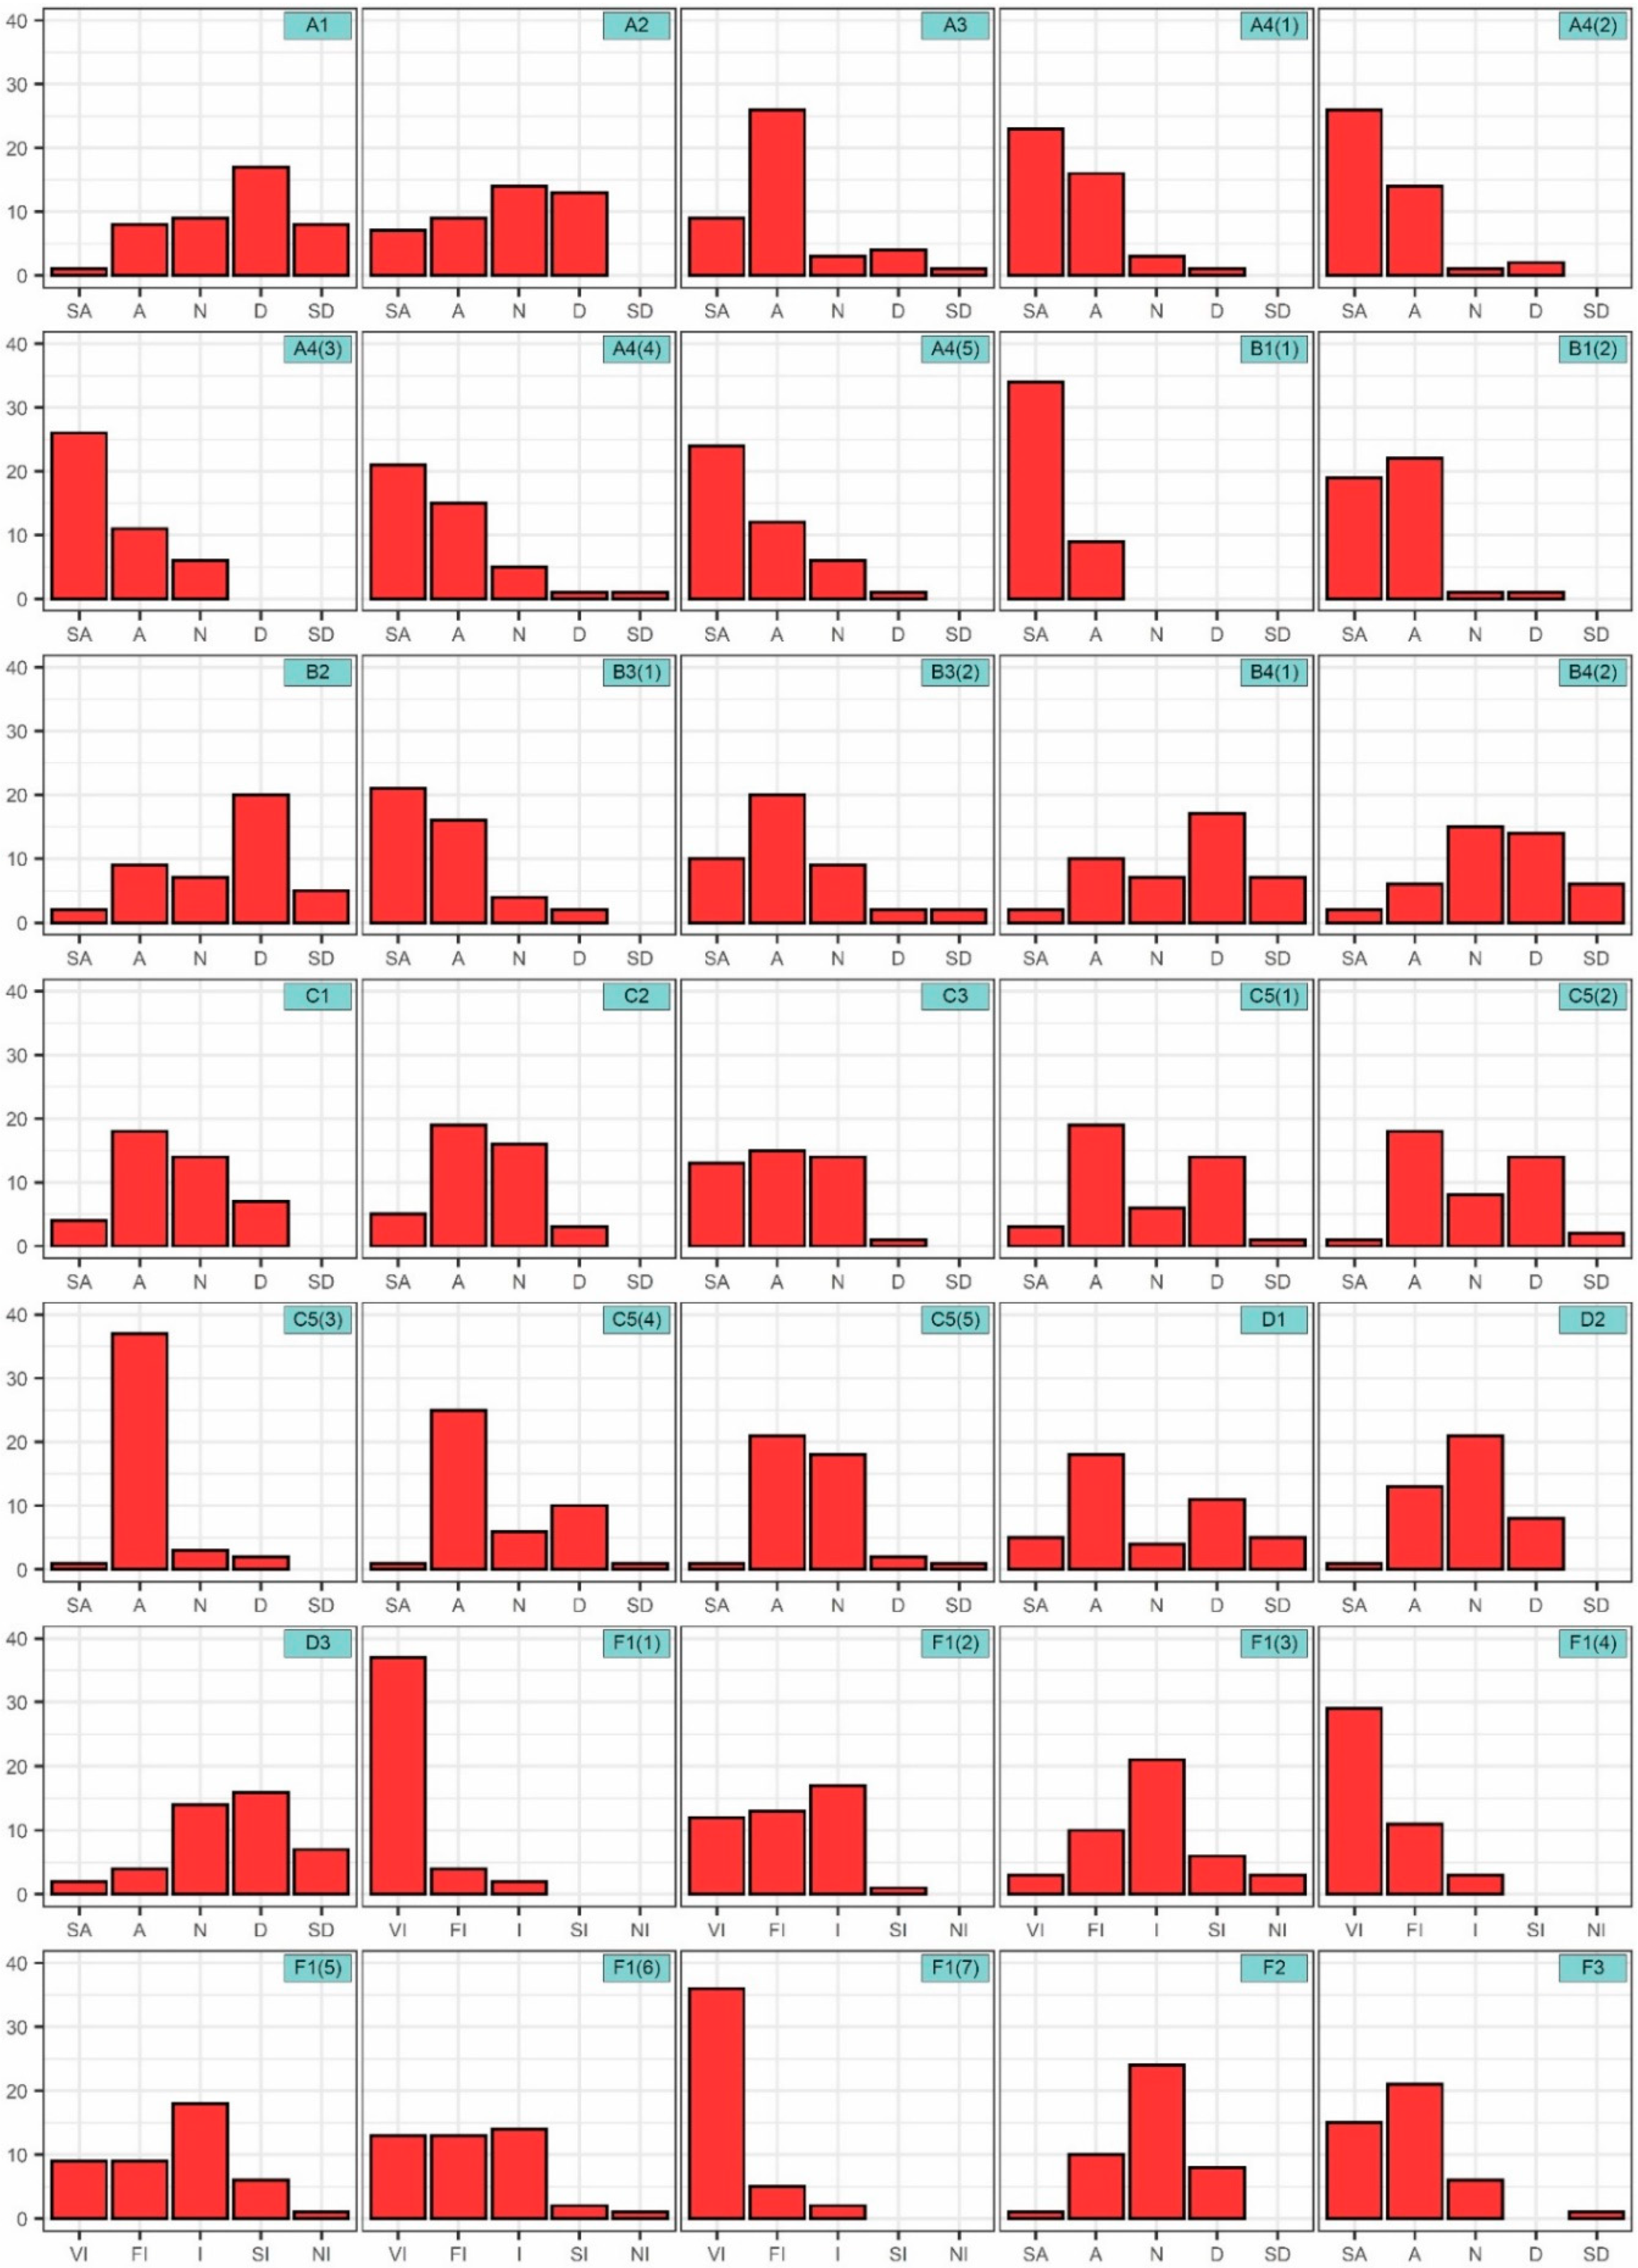
For the analysis of the relationships between the size and type of the company with the answers given, a decision tree algorithm was used. Decision trees are a data-mining algorithm that develops classification models with an inverted tree scheme: the nodes are the variables, the lines are the values of each variable. Finally, the leaves are the output value (Figure 4).
Thus, they allow determining the system’s response following the rules that are followed from the nodes to one of its leaves. Decision trees divide the dataset into subsets until the structure of the model is determined.
In the family of decision’s trees, two algorithms mainly stand out: ID3 and C4.5. The ID3 algorithm was the first one designed by Quinlan [64] and allows decision trees to be developed through a training sample. The development of the ID3 algorithm is found in algorithm C4.5, published by Quinlan [65]. These algorithms determine the best variable at each step using the concept of information gain of Claude Shannon [66]. For this, it is essential to first determine the entropy, which determines the degree of uncertainty of the sample. The probabilities of each value of the classification variable are used to calculate the entropy:
E ( S ) = i = 1 c p i l o g 2 ( p i )
where c is the number of values of the classification variable, and p i is the probability that the set of samples belongs to i -value of the classification variable. If the sample is homogeneous, that is, all the values belong to the same class, the entropy is null, while if the sample is proportional, the entropy is maximum.
The information gain I G ( S , A ) is based on the decrease in entropy caused by participating in a training set S, concerning an attribute A (Equation (2)). Thus, the algorithm constructs the model looking for those attributes that return the highest possible information gain:
I G ( S , A ) = E ( S ) v V ( A ) c S v S E ( S v )
where S v is the subset of the set of samples with those instances that in attribute A have the value v, and V ( A ) is the set of values of attribute A.
Traditionally, it is the most widely used supervised inductive learning classification technique used in the decision-making process and has the advantage that the connections between nodes can be expressed at the computational level as if-then rules, which facilitates their programming in different programming languages [69]. Due to this aspect, it is possible to establish the relationships between the input and output variables that best group the data set. Thus, for the purposes of this research, individual models were developed for each of the output variables using the size and type of company as input variables. The models were developed without establishing specifications for tree size and pruning so that the relationships between the input values can be established to better group the responses given by the respondents. This aspect allowed establishing patterns of similarity in the answers given by the respondents. Likewise, a true positive (TP) ratio (Equation (3)) and a false positive (FP) ratio (Equation (4)) were used to evaluate the quality of the obtained models. Such parameters were used to determine the validity of the relationships established with C4.5. Therefore, high values of a TP ratio (close to 1) indicate a pattern between the input variables and the response. In contrast, low values indicate a lack of relationship between the size and type of company and the given response.
T P = I n s t a n c e s   c o r r e c t l y   c l a s s i f i e d T o t a l   n u m b e r   o f   i n s t a n c e s
F P = I n s t a n c e s   i n c o r r e c t l y   c l a s s i f i e d T o t a l   n u m b e r   o f   i n s t a n c e s

4. Results

Figure 5 and Figure 6 present the histograms, for all the 35 questions, obtained during the survey for AHETA (blue) and AIHSA (red), respectively. In most questions, the results are quite similar.
Analyzing the histograms and considering the situation in which there are dissimilarities in the most voted option, the differences are presented in Table 2.
Although the answers are not exactly the same, there is no diverging position in any of the domains. For example, for A1—Water question: The long-term water supply is assured, and the normal development of the touristic activity will not be affected by water scarcity, the most chosen option was the disagreement, meaning that stakeholders consider that the long-term water supply in the region is not protected and could affect tourism activity.
Once the results of the histograms were analyzed, algorithm C4.5 was applied to the data obtained from the survey. The analysis was carried out merging data for the AIHSA and AHETA surveys. In each of these data sets, independent models were designed for each of the 35 indicators evaluated in the survey (Appendix A, Table A1) and the size and type of companies were used as input variables. Therefore, 105 analyses were carried out. Figure 7 shows an example of the models obtained for indicator A1—Water: The long-term water supply is assured, and the normal development of the touristic activity will not be affected by water scarcity and Table 3 shows the TP and FP ratios.
As can be seen with the results of the statistical parameters, the TP presents two behaviors depending on the indicator: (i) one of the groups of indicators presented a TP ratio of less than 55% and (ii) other indicators presented a higher TP ratio (greater than 60%).
As indicated in Section 3.3, a lower TP ratio is an indicator of lower robustness of the relationships created with the algorithm, and for the purposes of this study, is an indicator of the disparity of responses given by the stakeholders based on the input variables (i.e., companies of the same type and size give different answers). Thus, for most indicators: A1, A2, A4 (1), A4 (4), A4 (5), B2, B3 (1), B3 (2), B4 (1), B4 (2), C1, C2, C3, C5 (1), C5 (2), C5 (5), D1, D2, D3, F1 (2), F1 (3), F1 (5), F1 (6), F2, and F3 do not have robust relationships between the companies and the responses. This aspect may suggest the influence it has on the answer given the beliefs and customs of the respondent.
Therefore, stakeholders that are more aware of sustainable water management may disagree with current management, while the less aware person may have different perceptions. In this sense, and as can be seen in Figure 7, most of the classifications made by the C4.5 models have a disagreement response, although in all cases, incorrectly classified instances are detected (e.g., in the case of accommodations, 46.57% of companies have other response).
However, some relationships could be detected. For example, in the case of environmental indicators, the type of company was detected as the main classification variable, while the size of the company is used by the algorithm as a secondary variable to make classifications.
In indicator A1—Water, it has been detected how the type of activity allows classifications of the most common response detected, except in the case of restaurants where it is necessary to make a distinction based on the size of the company. A similar trend is identified in the case of indicator A2—Energy: The energy dependency of the Algarve may compromise in the future touristic sector competitiveness, although a distinction is made based on the size of the accommodation. At this point, it is convenient to highlight that the medium-sized accommodations disagreed with question A2, while the rest of the accommodations agreed. Something similar occurs for indicator A2 with the restaurant’s stakeholders, since those of large- and micro-sized selected the neutral response, while medium and small companies disagreed.
Therefore, it was not possible to establish trends in the responses based on the size of the stakeholders’ accommodation or restaurants. In indicator A4 (1)—Mobility: The mobility infrastructure limits the touristic development, the flatness of the response detected in the histograms towards a firm agreement with the question generated that the ramifications generated by the model had a homogeneous response, although it is interesting to note how the other recreational activities surveyed selected the option “Neutral”. Something similar occurs with indicators:
  • A4 (4)—Mobility: The lack of information and an efficient payment system for the A22 tolls has an effect on the tourist’s entrance by the border of Vila Real de Santo António;
  • A4 (5)—Mobility: The increase in the number of bike lanes and pedestrian zones contributes to the touristic development of the region in which there is a majority response of “Agreement” or “Strongly agree”, except in the large- or medium-sized restaurants that responded differently.
In the case of sociocultural indicators with a lower TP, it was detected as the first input variable that allows classifications to be made is the size of the company and depending on the analyzed indicator, it is possible to establish ramifications in each of the labels of company size. Thus, it is detected how the assessment of the sociocultural dimension of the region by companies tends to present trends more related to the size of the company than to the type of activity.
By analyzing the indicators individually, it was detected, in B2—Health: The existing health care infrastructure (private and public) is adequate and does not affect the choice of the Algarve negatively as a touristic destination that recreational activities responded differently to the most common response given by other activities, selecting “Strongly agree” or “Agree” while in the rest the most common response was “Disagree”. This reflects how different stakeholders value in different way facilities in the region.
In the case of indicator B4 (1)—Vocational development and training: The vocational training infrastructures for the touristic sector are adequate, it was detected that the most general response due to the size of the company did not present a clear trend, in such a way that large and micro-companies answered “Disagree” and small companies answered, “Agree”.
Likewise, in the case of medium-sized companies, distinctions are made according to the type of company in such a way that the hotels and restaurants’ stakeholders responded in disagreement while the other activities agreed. This analysis reflects the difficulties in establishing logical relationships of size and type of company with the answers given, although, in general terms, it was detected how the size of the company has a greater influence on the responses of the stakeholders.
In the case of economic indicators (C), it was identified that the importance of the size or type of company varies depending on the variable. In such a way, that for indicators:
  • C1—Formalities for incoming tourists: C1.1—The formalities for the incoming tourists from outside of the space Schengen may limit the economic attractiveness of the Algarve destination;
  • C5—Supply chain: There are in the Algarve suppliers able to respond to the demand of the touristic activity, namely in the field of, C5.1—Building construction, maintenance and rehabilitation, and C5.2—Equipment supply, maintenance and repair.
The size of the company has a greater relationship with the answers given by the companies, while in the other economic indicators, it is the type of company. This same aspect was detected in the indicator F—Other issues in which the indicators F1—Other issues: Destination demand: Sort by the degree of importance the themes that lead tourists to choose the Algarve as their destination (4) Safety and (5) Health care, are better classified by company size, while the rest are classified using the type of company. Finally, the institutional domain indicators (D) show that the variable that best classifies is the type of activity.

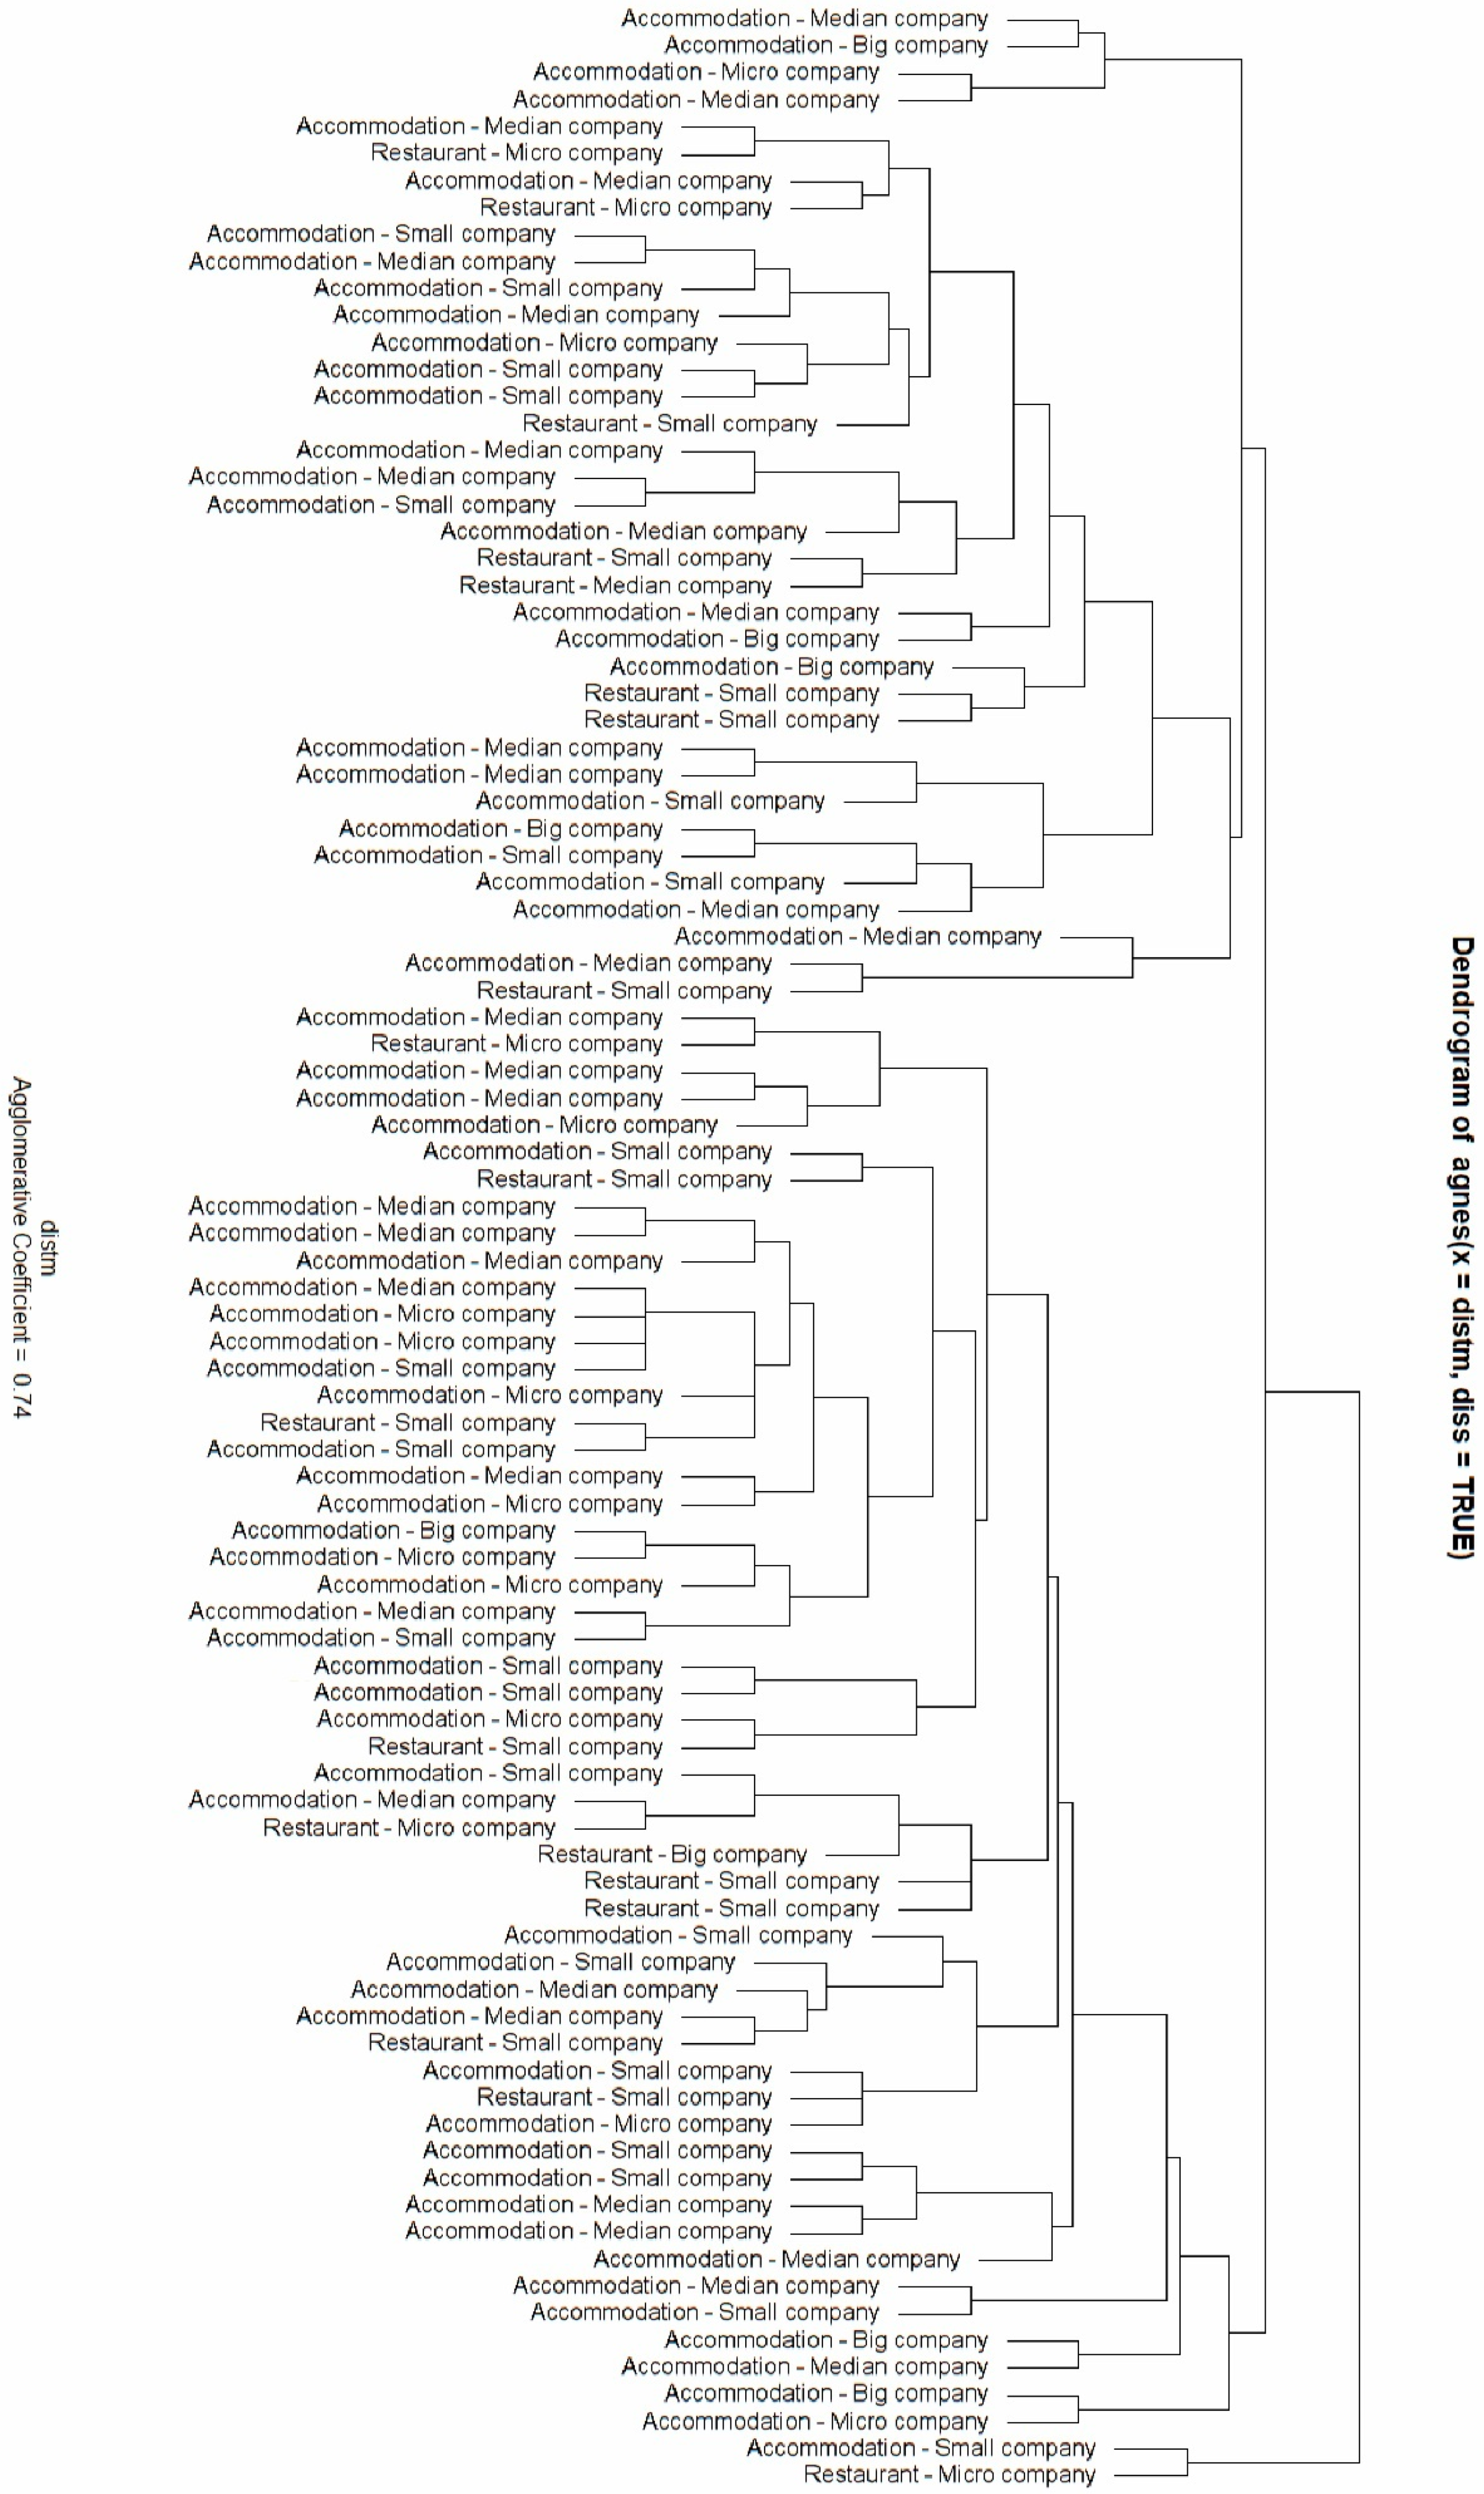
5. Discussion and Research Limitations

To identify a common vision, the similarities and the relation of true positive (TP) were used. The indicators with a high TP ratio are due to a homogeneous and very similar response given by the different stakeholders. In this sense, in the case of indicator A3—Natural resources and biodiversity: The actions for the preservation of the biodiversity and natural resources contribute to the development of the touristic activity, most companies respond to the option of agreement. Thus, the high TP value shows a homogeneous trend in the response given by stakeholders. In any case, the performance results obtained by the C4.5 models show that establishing relationships between the size and type of company with the answers given in the surveys do not allow establishing solid relationships. In this sense, it is possible to conclude that there are aspects related to the customs and beliefs of the respondents, which may influence the responses.
Therefore, conducting surveys of different workers and managers of the same company could give different answers, which would lead to great heterogeneity in the perception of the importance of the different indicators analyzed. New interesting research steps could be geared towards asking respondents more questions about their beliefs and customs.
It should be noted that from the analysis of the histograms and the relationships established by C4.5, it has been detected that there are certain similarities between the answers given by the accommodations and restaurants stakeholders and with difficulties in establishing relationships due to their characteristics. In order to know this aspect better, it was decided to carry out cluster analyses between the lodging and catering companies. The analyses were carried out by examining the responses considered in each of the domain (A—Environmental, B—Sociocultural, C—Economic, D—Institutional, and F—Other issues). Figure 8 illustrates the dendrogram of environmental indicators. By analyzing all the dendrograms obtained, there are two main trends:
  • The dendrograms of the A—Environmental, B—Sociocultural, C—Economic and F—Other issue domain showed different trends in the similarity between companies. In this sense, the dendrograms obtained companies of different types and sizes that were similar to different companies (e.g., the similarity between medium accommodation and a small restaurant);
  • The Institutional domain (D) dendrogram shows a more ordered structure. This aspect allows us to more clearly detect the similarities between companies of different types that have been observed in the other domains.
Therefore, the relationships established between the stakeholders are quite similar in the domains analyzed. In this sense, groupings between activities of the same type, but with different sizes (e.g., large and small accommodations), as well as groupings between accommodation and restaurants of different sizes (e.g., similarities between large and small restaurants).
It is possible to conclude that stakeholders with the same characteristics have a great similarity. This aspect corroborates what was detected with the histogram and C4.5 analyses and shows the heterogeneity of the responses given between companies with the same characteristics and as, between accommodations and restaurants, there are similarities without a clear relationship with the size of the company.
The results show that the relationships established between the Algarve stakeholders are similar in most of the sustainability domains. Furthermore, assessing if these similarities will be the same with different characteristics, two analysis were conducted:
  • For the same type, with different sizes (e.g., large and small accommodations);
  • Between accommodation and restaurants of different sizes (e.g., similarities between large and small restaurants).
It was also identified that the stakeholders’ group with the same characteristics have a great similarity, i.e., there are similarities without a clear relationship with the size of the company. The results highlight a convergent view in most sustainability challenges, like, natural resources and biodiversity, safety, and supply chain.
Nevertheless, when compared with restaurants and other services, it is not considered as a shared view: the formalities for incoming tourists (C1); e-tourism (C2); internet access (D1); sustainability initiatives (F2), and the importance of information (F3).
The limitations are mainly associated with the responses obtained since they represent a third of the 141,000 officially classified beds in hotels and tourist resorts of the Algarve region. In addition to this one, the relationship between the type and size of the company can be pointed out, as well as the relationship between the type of activity of the companies and the answers related to the environmental, sociocultural, economic, and institutional domains. These aspects were already discussed.
Likewise, it is to be expected that the role of the people surveyed may lead to variations in the responses. Thus, employers may have different perceptions than workers. This aspect can have a great impact on the sustainability perceptions of the sector.
In addition, it is convenient to highlight the advantages associated with the data analysis approach used. This type of analysis can establish relationships between the variables analyzed, establishing the routes or paths detected in the data. However, outliers may influence the results. The use of a data set with a larger number of individuals or with more variables could improve the establishment of relationships. This could improve the values associated with TP and FP obtained in the study.
In any case, the results of the study have made it possible to detect relationships between the variables that make it possible to improve the existing knowledge about the perception of sustainability.

6. Conclusions and Further Research Paths

In the Algarve region, economic activity is mainly driven by the tourism sector. Due to its importance and in line with the defined strategy, it is essential to know the perceptions of the interesting parts of the region in relation to how they value sustainability dimensions of the region, such as environmental, sociocultural, economic, or institutional aspects.
The review highlights the importance of stakeholders’ perceptions to have a shared vision to assume good governance in search of sustainable tourism in the region of Algarve, beginning with the supply side, where hotels (Algarve has 31% of the Portuguese hotels’ beds) could be a critical point. A common vision of problems and priorities on sustainable tourism development will allow the promotion of the region’s competitiveness respecting the natural environment with the balance of economics and local social development.
A survey for the supply side of the tourism sector, with a specific artificial intelligence algorithm, analyze if hotels and restaurants have a common or different perspective depending on the type of activity, size, category, and other key factors. The hotel’s answers correspond to 33% of Algarve’s beds, involving large to small lodgings.
The results concluded that, in general, there is a broad consensus, e.g., importance of natural resources and biodiversity, safety, and supply chain. It was also possible to verify a great agreement with the different questions asked, although, in some aspects, such as the importance of energy and water, there is no such marked trend in the importance of these aspects.
With the engagement of the most important companies in the tourism sector of Algarve—accommodations and restaurants, it was observed that the valuations of the interested parties are varied, and there are no clear relationships between the type and size of the company with the responses.
Thus, there are similarities in the perception of sustainability in the region between companies as different as large accommodation and small restaurants. This aspect may indicate the importance of the customs and beliefs of all interested parties in the assessment of the importance of sustainability in the tourism sector. Still, a clear relationship with the type of company was not found.
One fundamental aspect of these results is the need to improve and protect the vulnerability that the tourism sector may have in the face of the different dimensions analyzed. Enhancing the competitiveness of the tourism sector in each country is to improve the sustainable growth of the respective economy and, ultimately, enhance citizens’ prosperity.
There is a need for alignment on infrastructure investment, natural resources safety, and mobility for the sustainable competitiveness of the sector. The tourism industry has taken active steps to reduce its impact on the environment and continue to do so while implementing better measurement tools.
The implications for research are that the trend of a shared vision in several aspects begin to exist in local suppliers (hotel and restaurants) and must be used to leverage a higher level of sustainability and resilience. The results are in line with Alonso-Almeida [70] that the awareness of environmental aspects and positive economic and practices in hotels could be seen as evidence of the maturity of sustainable tourism.
The results open the possibility for developing a more collaborative action plan and program, aiming to a higher level of sustainability. Therefore, it is essential to expand the analysis to other local stakeholders to ensure a more sustainable local base tourism destination with increased value, innovation, and regional development.
In further studies, it would be interesting to compare hotels from different categories, which would lead to even more specific recommendation destinations [70] and spread to other services. At a more strategic level analyzing if collaborative and associative forms of governance among tourism companies and other related agents are growing in importance in the drive for sustainable and environmentally sensitive tourism [71], namely, in Algarve.
COVID-19 brought the enormous problem of resilience to infectious outbreaks and its tremendous consequence to which the tourism sector cannot be indifferent and must immediately anticipate solutions. Potential measures as, for example, tourism density adjustments could allow a transition to more sustainable tourism. Innovation is an important base for tourism and hospitality [72]. The search for innovative solutions to challenging problems is essential, including better integration of information technology, since the importance of the emergence of information technologies (IT) for sustainable tourism is increasing [71], as well as to assure climate resilience, are indubitable contemporary drivers of sustainable development [73].

Author Contributions

Conceptualization, F.F. and M.D.P.; data curation, D.B.-H., R.L., M.J.O. and R.B.; formal analysis, F.F., M.D.P., E.M.J.S. and M.J.O.; investigation, D.B.-H., R.L. and M.J.O.; validation, E.M.J.S. and R.B.; writing—original draft, D.B.-H., M.D.P., E.M.J.S., R.L. and M.J.O.; writing—review and editing, F.F., D.B.-H. and M.D.P. All authors have read and agreed to the published version of the manuscript.

Funding

Operational Program CRESC ALGARVE 2020 (ALG-01-0246-FEDER-027503) funded this research.

Institutional Review Board Statement

Not applicable.

Informed Consent Statement

The survey and the Operational Program CRESC ALGARVE 2020 for funding the OBSERVE project.

Data Availability Statement

Not applicable.

Acknowledgments

The authors would like to acknowledge AHETA and AIHSA to collaborate on the survey and the Operational Program CRESC ALGARVE 2020 for funding the OBSERVE project.

Conflicts of Interest

The authors declare no conflict of interest.

Appendix A

Table A1. Online questionnaire disseminated electronically by the associates of AHISA and AHETA from September to November 2019.
QuestionResponse Options
Company Identification
Entity/Group name:ST
Area of activity: *Hotel/Restaurant or bar/Outdoor activities/Other
If the previous answer is other, please specify:ST
Company size: *Big (n > 250 employees)
Medium (50 < n < 250 employees)
Small (10 < n < 50)
Micro (n < 10)
Position:ST
E-mail:ST
A—Environmental Domain
A1—Water:
A1.1—The long-term water supply is assured and the normal development of the touristic activity will not be affected by water scarcity. *SA/A/N/D/SD
A2—Energy:
A2.2—The energy dependency of the Algarve may compromise in the future the competitively of the touristic sector. *SA/A/N/D/SD
A2.2.1—If the previous response is positive, please identify the issues.
A3—Natural resources and biodiversity:SA/A/N/D/SD
A3.3—The actions for the preservation of the biodiversity and natural resources contribute to the development of the touristic activity. *
A4—Mobility:
A4.1—The mobility infrastructure limits the touristic development. *SA/A/N/D/SD
A4.2—During the summer season, the mobility infrastructure affects negatively the tourist satisfaction. *SA/A/N/D/SD
A4.3—The existence of an efficient railway infrastructure would contribute positively to the competitiveness of the region. *SA/A/N/D/SD
A4.4—The lack of information and an efficient payment system for the A22 tolls has effect on the tourist entrance by the border of Vila Real de Santo António. *SA/A/N/D/SD
A4.5—The increase in the number of bike lanes and pedestrian zones contributes for the touristic development of the region. *SA/A/N/D/SD
B—Sociocultural Domain
B1—Safety:
B1.1—The safety is important in the choice of the Algarve destination. *SA/A/N/D/SD
B1.2—The perception of the safety by the tourists is positive. *SA/A/N/D/SD
B2—Health care:
B2.1—The existing health care infrastructure (private and public) is adequate and does not affect negatively the choice of the Algarve as a touristic destination. *SA/A/N/D/SD
B3—Creative and cultural resources:
B3.1—The cultural and creative resources in the region must be improved and preserved in order to attract more and new tourists. *SA/A/N/D/SD
B3.2—The tourism has been contributing to the preservation of the identity, culture and heritage of the Algarve. *SA/A/N/D/SD
B4—Vocational development and training:
B4.1—The vocational training infrastructures for the touristic sector are adequate. *SA/A/N/D/SD
B4.2—The professionals in the touristic activities are valorized and keep working in the same sector. *SA/A/N/D/SD
C—Economic Domain
C1—Formalities for incoming tourists:
C1.1—The formalities for the incoming tourists from outside of the space Schengen may limit the economic attractiveness of the Algarve destination. *SA/A/N/D/SD
C2—E-tourism:
C2.1—The region is preparing a progressive and continuous digital transition (Apps, Mupis, services, and points of interest in digital platforms). *SA/A/N/D/SD
C3—Diversification of the markets and emerging markets:
C3.1—There are emerging markets where it is necessary to promote more efficiently the Algarve destination. *SA/A/N/D/SD
C3.1.1—If the previous response is positive, please identify the issues.ST
C4—Seasonality:
C4.1—Identify the opportunities that the region may develop to mitigate the seasonality.LT
C5—Supply chain: There are in the Algarve suppliers able to respond to the demand of the touristic activity, namely in the field of
C5.1—Building construction, maintenance, and rehabilitation. *SA/A/N/D/SD
C5.2—Equipment supply, maintenance and repair. *SA/A/N/D/SD
C5.3—Food supply. *SA/A/N/D/SD
C5.4—Cleaning services. *SA/A/N/D/SD
C5.5—Other consumables. *SA/A/N/D/SD
D—Institutional Domain
D1—Internet access:
D1.1—The Wi-Fi and 4G coverage is efficient. *SA/A/N/D/SD
D2—Expenses in I&D from institutions and companies:
D2.1—The investment in R&D in the Algarve boosts the competitiveness of the companies. *SA/A/N/D/SD
D3—Participation of the local population in the planning:
D3.1—The local population is evolved and has effect, influence the tourism planning, and development. *SA/A/N/D/SD
E—Gastronomic Tourism **
E1—Relevance of the gastronomic tourism on the region of Algarve:
E1.1—The gastronomic tourism is an attraction to visit the region of Algarve. *SA/A/N/D/SD
E2—Sustainability of the catering industry:
E2.1—The gastronomic tourism (catering) industry is sustainable. *SA/A/N/D/SD
E3—Relevance of the catering industry on the employment in the region of Algarve:
E3.1—The industry of catering promote the fixation of the employees and provide vocational training. *SA/A/N/D/SD
E4—Mediterranean diet:
E4.1—The Mediterranean diet is and attraction to visit the region of Algarve. *SA/A/N/D/SD
E5—Circular economy:
E5.1—The catering industry may be important to the development of the circular economy. *SA/A/N/D/SD
E6—Effect of the gastronomic tourism on the quality of life of local population:
E6.1—The industry of catering is oriented to local population (menus, price and attendance). *SA/A/N/D/SD
F—Other Issues
F1—Destination demand: Sort by degree of importance the themes that lead tourists to choose the Algarve as their destination
F1.1—Beach. *ER/VR/R/MR/NR
F1.2—Gastronomy. *ER/VR/R/MR/NR
F1.3—Cultural programs. *ER/VR/R/MR/NR
F1.4—Safety. *ER/VR/R/MR/NR
F1.5—Health care. *ER/VR/R/MR/NR
F1.6—Nature. *ER/VR/R/MR/NR
F1.7—Climate. *ER/VR/R/MR/NR
F2—On-going initiatives to increase the sustainability on the region of Algarve:
F2.1—I know about the on-going initiatives to increase the sustainability in the region of Algarve. *SA/A/N/D/SD
F3—Acquisition and processing of data:
F3.1—Having information on the trends of various indicators and their temporal and spatial evolution can contribute to improving decision-making and competitiveness in the region. *SA/A/N/D/SD
F4—Sustainable development and improvement of competitiveness:
F4.1—List other issues to consider for the improvement of the competitiveness of the tourism sector and the sustainable development of the region.LT
SA—Strongly agree; A—Agree; N—Neutral; D—Disagree; SD—Strongly disagree; ER—Extremely relevant; VR—Very relevant; R—Relevant; MR—Marginal relevance; NR—Not relevant; n—number of employees; LT—Long text; ST—Short text; * Mandatory question; ** Only in the questionnaire sent to AHISA associates.

References

  1. World Economic Forum. The Travel & Tourism Competitiveness Report 2017; World Economic Forum: Geneva, Switzerland, 2017. [Google Scholar]
  2. Roxas, F.M.Y.; Rivera, J.P.R.; Gutierrez, E.L.M. Framework for creating sustainable tourism using systems thinking. Curr. Issues Tour. 2020, 23, 280–296. [Google Scholar] [CrossRef]
  3. Nadalipour, Z.; Imani Khoshkhoo, M.H.; Eftekhari, A.R. An integrated model of destination sustainable competitiveness. Compet. Rev. 2019, 29, 314–335. [Google Scholar] [CrossRef]
  4. Bramwell, B. Governance, the state and sustainable tourism: A political economy approach. J. Sustain. Tour. 2011, 19, 459–477. [Google Scholar] [CrossRef]
  5. Timur, S.; Getz, D. Sustainable tourism development: How do destination stakeholders perceive sustainable urban tourism? Sustain. Dev. 2009, 17, 220–232. [Google Scholar] [CrossRef]
  6. Benur, A.M.; Bramwell, B. Tourism product development and product diversification in destinations. Tour. Manag. 2015, 50, 213–224. [Google Scholar] [CrossRef]
  7. Waligo, V.; Clarke, J.; Hawkins, R. Embedding stakeholders in sustainable tourism strategies. Ann. Tour. Res. 2015, 55, 90–93. [Google Scholar] [CrossRef] [Green Version]
  8. Kornilaki, M.; Thomas, R.; Font, X. The sustainability behaviour of small firms in tourism: The role of self-efficacy and contextual constraints. J. Sustain. Tour. 2019, 27, 97–117. [Google Scholar] [CrossRef]
  9. Kubickova, M.; Martin, D. Exploring the relationship between government and destination competitiveness: The TALC model perspective. Tour. Manag. 2020, 78, 104040. [Google Scholar] [CrossRef]
  10. Abreu-Novais, M.; Ruhanen, L.; Arcodia, C. Destination competitiveness: What we know, what we know but shouldn’t and what we don’t know but should. Curr. Issues Tour. 2016, 19, 492–512. [Google Scholar] [CrossRef]
  11. Oliveira, M.J.; Farinha, F.; da Silva, E.; Lança, R. Observatory of Sustainability of the Algarve Region for Tourism—Overview and outset. In Proceedings of the 2nd UNWTO World Conference on Smart Destinations, Oviedo, Spain, 25–27 June 2018. [Google Scholar]
  12. Farinha, F.; Oliveira, M.J.; Silva, E.M.J.; Lança, R.; Pinheiro, M.D.; Miguel, C. Selection process of sustainable indicators for the Algarve region-OBSERVE project. Sustainability 2019, 11, 444. [Google Scholar] [CrossRef] [Green Version]
  13. Tsai, H.; Song, H.; Wong, K.K.F. Tourism and hotel competitiveness research. J. Travel Tour. Mark. 2009, 26, 522–546. [Google Scholar] [CrossRef] [Green Version]
  14. Aqueveque, C.; Bianchi, C. Tourism Destination Competitiveness of Chile: A Stakeholder Perspective. Tour. Plan. Dev. 2017, 14, 447–466. [Google Scholar] [CrossRef]
  15. Cronjé, D.F.; du Plessis, E. A review on tourism destination competitiveness. J. Hosp. Tour. Manag. 2020, 45, 256–265. [Google Scholar] [CrossRef]
  16. Rey-Maquieira, J.; Ramos, V. Destination competitiveness. In Encyclopedia of Tourism; Jafari, J., Xiao, H., Eds.; Springer International Publishing: Cham, Switzerland, 2016; pp. 244–245. ISBN 978-3-319-01384-8. [Google Scholar]
  17. Crouch, G.I.; Ritchie, J.R.B. Tourism, Competitiveness, and Societal Prosperity. J. Bus. Res. 1999, 44, 137–152. [Google Scholar] [CrossRef]
  18. Ritchie, J.R.B.; Crouch, G.I. The Competitive Destination: A Sustainable Tourism Perspective; CABI Publishing: Cambridge, UK, 2004; Volume 41, ISBN 085199847X. [Google Scholar]
  19. Cambridge Dictionary Sustainable Competitive Advantage | Meaning in the Cambridge English Dictionary. Available online: https://dictionary.cambridge.org/dictionary/english/sustainable-competitive-advantage (accessed on 26 April 2021).
  20. Streimikiene, D.; Svagzdiene, B.; Jasinskas, E.; Simanavicius, A. Sustainable tourism development and competitiveness: The systematic literature review. Sustain. Dev. 2021, 29, 259–271. [Google Scholar] [CrossRef]
  21. Crouch, G.I. Destination Competitiveness: An Analysis of Determinant Attributes. J. Travel Res. 2010, 50, 27–45. [Google Scholar] [CrossRef]
  22. Niñerola, A.; Sánchez-Rebull, M.-V.; Hernández-Lara, A.-B. Tourism Research on Sustainability: A Bibliometric Analysis. Sustainability 2019, 11, 1377. [Google Scholar] [CrossRef] [Green Version]
  23. Leonidou, L.C.; Leonidou, C.N.; Fotiadis, T.A.; Zeriti, A. Resources and capabilities as drivers of hotel environmental marketing strategy: Implications for competitive advantage and performance. Tour. Manag. 2013, 35, 94–110. [Google Scholar] [CrossRef]
  24. Eisenhardt, K.M.; Martin, J.A. Dynamic capabilities: What are they? Strateg. Manag. J. 2000, 21, 1105–1121. [Google Scholar] [CrossRef]
  25. United Nation Economic and Social Council. Report United Nation Economic and Social Council; United Nation Economic and Social Council: New York, NY, USA, 2000; Available online: https://www.un.org/ecosoc/en/documents/reports (accessed on 27 May 2020).
  26. Weaver, D.B.; Lawton, L.J. Twenty years on: The state of contemporary ecotourism research. Tour. Manag. 2007, 28, 1168–1179. [Google Scholar] [CrossRef] [Green Version]
  27. Conaghan, A.; Hanrahan, J.; Mcloughlin, E. The Sustainable Management of a Tourism Destination in Ireland: A Focus on County Clare. Adv. Hosp. Tour. Res. 2015, 3, 62–87. [Google Scholar]
  28. Halis, M.; Abdelgadi, F.A.A. Tourism Stakeholders Attitudes toward Sustainable Developments: Empirical Research from Shahat City. Ottoman J. Tour. Manag. Res. 2017, 2, 182–200. [Google Scholar] [CrossRef]
  29. Dwyer, L.; Kim, C. Destination Competitiveness: Determinants and Indicators. Curr. Issues Tour. 2003, 6, 369–414. [Google Scholar] [CrossRef]
  30. Cizel, B.; Ajanovic, E.; Cakar, K. Prerequisites for effective and sustainable destination governance. Anatolia 2016, 27, 155–166. [Google Scholar] [CrossRef]
  31. Romero, I.; Tejada, P. Tourism intermediaries and innovation in the hotel industry. Curr. Issues Tour. 2020, 23, 641–653. [Google Scholar] [CrossRef]
  32. Suárez-Cebador, M.; Rubio-Romero, J.C.; Pinto-Contreiras, J.; Gemar, G. A model to measure sustainable development in the hotel industry: A comparative study. Corp. Soc. Responsib. Environ. Manag. 2018, 25, 722–732. [Google Scholar] [CrossRef]
  33. Gkoumas, A. Evaluating a standard for sustainable tourism through the lenses of local industry. Heliyon 2019, 5, e02707. [Google Scholar] [CrossRef] [PubMed]
  34. Sustainable Tourism for Development Guidebook—Enhancing Capacities for Sustainable Tourism for Development in Developing Countries; World Tourism Organization (UNWTO): Geneva, Switzerland, 2013.
  35. Zhang, H.; Xu, H. Impact of destination psychological ownership on residents’ “place citizenship behavior”. J. Destin. Mark. Manag. 2019, 14, 100391. [Google Scholar] [CrossRef]
  36. Lee, T.H.; Jan, F.-H. Can community-based tourism contribute to sustainable development? Evidence from residents’ perceptions of the sustainability. Tour. Manag. 2019, 70, 368–380. [Google Scholar] [CrossRef]
  37. Jeyacheya, J.; Hampton, M.P. Wishful thinking or wise policy? Theorising tourism-led inclusive growth: Supply chains and host communities. World Dev. 2020, 131, 104960. [Google Scholar] [CrossRef]
  38. Fredline, E.; Faulkner, B. Host community reactions: A cluster analysis. Ann. Tour. Res. 2000, 27, 763–784. [Google Scholar] [CrossRef]
  39. Presenza, A.; Del Chiappa, G.; Sheehan, L. Residents’ engagement and local tourism governance in maturing beach destinations. Evidence from an Italian case study. J. Destin. Mark. Manag. 2013, 2, 22–30. [Google Scholar] [CrossRef]
  40. Feyers, S.; Stein, T.; Klizentyte, K. Bridging Worlds: Utilizing a Multi-Stakeholder Framework to Create Extension–Tourism Partnerships. Sustainability 2019, 12, 80. [Google Scholar] [CrossRef] [Green Version]
  41. Donaldson, T.; Preston, L.E. The Stakeholder Theory of the Corporation: Concepts, Evidence, and Implications. Acad. Manag. Rev. 1995, 20, 65. [Google Scholar] [CrossRef] [Green Version]
  42. Geiger, O. The Impact of Stakeholder Relations on the Sustainability of Tourism Development. Master’s Thesis, UiT the Arctic University of Norway, Tromsø, Norway, 2017. [Google Scholar]
  43. Byrd, E.T.; Bosley, H.E.; Dronberger, M.G. Comparisons of stakeholder perceptions of tourism impacts in rural eastern North Carolina. Tour. Manag. 2009, 30, 693–703. [Google Scholar] [CrossRef]
  44. Clarkson, M.E. A Stakeholder Framework for Analyzing and Evaluating Corporate Social Performance. Acad. Manag. Rev. 1995, 20, 92–117. [Google Scholar] [CrossRef]
  45. Sautter, E.T.; Leisen, B. Managing stakeholders: A tourism planning model. Ann. Tour. Res. 1999, 26, 312–328. [Google Scholar] [CrossRef]
  46. Byrd, E.T. Stakeholders in sustainable tourism development and their roles: Applying stakeholder theory to sustainable tourism development. Tour. Rev. 2007, 62, 6–13. [Google Scholar] [CrossRef]
  47. Jamal, T.B.; Getz, D. Collaboration theory and community tourism planning. Ann. Tour. Res. 1995, 22, 186–204. [Google Scholar] [CrossRef]
  48. Tosun, C. Challenges of sustainable tourism development in the developing world: The case of Turkey. Tour. Manag. 2001, 22, 289–303. [Google Scholar] [CrossRef]
  49. Timur, S.; Getz, D. A network perspective on managing stakeholders for sustainable urban tourism. Int. J. Contemp. Hosp. Manag. 2008, 20, 445–461. [Google Scholar] [CrossRef]
  50. Freeman, R.E.E.; McVea, J. A Stakeholder Approach to Strategic Management. SSRN Electron. J. 2005. [Google Scholar] [CrossRef]
  51. Grimble, R.; Wellard, K. Stakeholder methodologies in natural resource management: A review of principles, contexts, experiences and opportunities. Agric. Syst. 1997, 55, 173–193. [Google Scholar] [CrossRef]
  52. Freeman, R.E.; Freeman, R.E. The Stakeholder Approach. In Strategic Management; Cambridge University Press: Cambridge, UK, 2015; pp. 1–2. [Google Scholar]
  53. Kim, K.B. The Perceived role of Key Stakeholders’ Involvement in Sustainable Tourism Development. Ph.D. Thesis, The University of Nottingham, Nottingham, UK, 2013. [Google Scholar]
  54. Byrd, E.T.; Cárdenas, D.A.; Greenwood, J.B. Factors of stakeholder understanding of tourism: The case of Eastern North Carolina. Tour. Hosp. Res. 2008, 8, 192–204. [Google Scholar] [CrossRef]
  55. Timothy, D.J. Cooperative tourism planning in a developing destination. J. Sustain. Tour. 1998, 6, 52–68. [Google Scholar] [CrossRef]
  56. Ven, S. Residents’ Participation, Perceived Impacts, and Support for Community-based Ecotourism in Cambodia: A Latent Profile Analysis. Asia Pac. J. Tour. Res. 2016, 21, 836–861. [Google Scholar] [CrossRef]
  57. March, R.; Wilkinson, I. Conceptual tools for evaluating tourism partnerships. Tour. Manag. 2009, 30, 455–462. [Google Scholar] [CrossRef]
  58. Ap, J. Residents’ perceptions on tourism impacts. Ann. Tour. Res. 1992, 19, 665–690. [Google Scholar] [CrossRef]
  59. Brida, J.G.; Del Chiappa, G.; Meleddu, M.; Pulina, M. A Comparison of Residents’ Perceptions in Two Cruise Ports in the Mediterranean Sea. Int. J. Tour. Res. 2014, 16, 180–190. [Google Scholar] [CrossRef]
  60. Ellis, S.; Sheridan, L. The role of resident perceptions in achieving effective community-based tourism for least developed countries. Anatolia 2015, 26, 244–257. [Google Scholar] [CrossRef] [Green Version]
  61. Ajzen, I.; Fishbein, M. Understanding Attitudes and Predicting Social Behaviour; Prentice-Hall: Englewood Cliffs, NJ, USA, 1980. [Google Scholar]
  62. Porter, M.E.; Van Der Linde, C. Green and Competitive: Ending the Stalemate Green and Competitive; Harvard Business Review Press: Cambridge, MA, USA, 1995. [Google Scholar]
  63. Hurtado-torres, N.; Arago, J.A.; Sharma, S.; Garcı, J. Environmental strategy and performance in small firms: A resource-based perspective. Environ. Manag. 2007, 86, 88–103. [Google Scholar] [CrossRef]
  64. Quinlan, J.R. Induction of decision trees. Mach. Learn. 1986, 1, 81–106. [Google Scholar] [CrossRef] [Green Version]
  65. Quinlan, J.R. C4.5: Programs for machine learning. Mach. Learn. 1993, 16, 235–240. [Google Scholar]
  66. Shannon, C.E. A note on the concept of entropy. Bell Syst. Tech. J. 1948, 27, 379–423. [Google Scholar] [CrossRef] [Green Version]
  67. Liu, J.; Ma, Y. The perceptual differences among stakeholders in the tourism supply of Xi’an City, China. Sustainability 2017, 9, 214. [Google Scholar] [CrossRef] [Green Version]
  68. Pierce, J.L.; Rubenfeld, S.A.; Morgan, S. Employee Ownership: A Conceptual Model of Process and Effects. Acad. Manag. Rev. 1991, 16, 121. [Google Scholar] [CrossRef]
  69. Bienvenido-Huertas, D.; Farinha, F.; Oliveira, M.J.; Silva, E.M.J.; Lança, R. Challenge for Planning by Using Cluster Methodology: The Case Study of the Algarve Region. Sustainability 2020, 12, 1536. [Google Scholar] [CrossRef] [Green Version]
  70. Alonso-Almeida, M.-M.; Fernández Robin, C.; Celemín Pedroche, M.S.; Astorga, P.S. Revisiting green practices in the hotel industry: A comparison between mature and emerging destinations. J. Clean. Prod. 2017, 140, 1415–1428. [Google Scholar] [CrossRef]
  71. Gossling, S. Tourism, information technologies and sustainability: An exploratory review. J. Sustain. Tour. 2017, 25, 1024–1041. [Google Scholar] [CrossRef]
  72. Omerzel, G.D. A systematic review of research on innovation in hospitality and tourism. Int. J. Contemp. Hosp. Manag. 2016, 28, 516–558. [Google Scholar] [CrossRef]
  73. Scott, D.; Hall, C.M.; Gossling, S. A review of the IPCC Fifth Assessment and implications for tourism sector climate resilience and decarbonization. J. Sustain. Tour. 2016, 24, 8–30. [Google Scholar] [CrossRef]
Figure 1. Conceptual model to competitive advantages.
Sustainability 13 06072 g001
Figure 2. Ownership and attitudes to potential competitive advantages.
Sustainability 13 06072 g002
Figure 3. Conceptual challenges for the research.
Sustainability 13 06072 g003
Figure 4. Sketch of the decision tree algorithm C4.5 model.
Sustainability 13 06072 g004
Figure 5. Histograms with the answers of the AHETA questionnaire.
Sustainability 13 06072 g005
Figure 6. Histograms with the answers of the AIHSA questionnaire.
Sustainability 13 06072 g006
Figure 7. Sketch of the model obtained for answer A1—Water.
Sustainability 13 06072 g007
Figure 8. Dendrogram of environmental indicators.
Sustainability 13 06072 g008
Table 1. Subjects covered in the survey disseminated electronically by the associates of AHISA and AHETA.
Company Identification
A—Environmental
A1—Water; A2—Energy; A3—Natural resources and biodiversity; A4—Mobility.
B—Sociocultural
B1—Safety; B2—Health care; B3—Creative and cultural resources; B4—Professional development and training.
C—Economic
C1—Formalities for incoming tourists; C2—E-tourism; C3—Diversification of the markets and emerging markets; C4—Seasonality; C5—Supply chain.
D—Institutional
D1—Internet access; D2—Expenses in R&D; D3—Participation of residents in the planning process.
E—Gastronomic Tourism **
E1—Relevance of the gastronomic tourism in the region of Algarve; E2—Sustainability of the catering industry; E3—Relevance of the catering industry on the employment; E4—Mediterranean diet; E5—Circular economy; E6—Effect of the gastronomic tourism on the quality of life of the local population.
F—Other Issues
F1—Destination demand; F2—On-going initiatives to increase the sustainability of the region of Algarve; F3—Acquisition and processing of data; F4—Sustainable development and improvement of competitiveness.
** Only in the questionnaire sent to AHISA associates.
Table 2. Main dissimilarities between AHISA and AHETA answers.
A—Environmental Domain
A2—Energy:
A2.1—The energy dependency of the Algarve may compromise in the future the competitively of the touristic sector
AHETA—agree; AHISA—neutral
B—Sociocultural Domain
B4—Vocational development and training:
B4.2—The professionals in the touristic activities are valorized and keep working in the same sector
AHETA—disagree; AHISA—neutral
D—Institutional Domain
D2.1—The investment in I&D in the Algarve boosts the competitiveness of the companies
AHETA—agree; AHISA—neutral
F—Other Issues
F1—Destination demand: Sort by the degree of importance the themes that lead tourists to choose the Algarve as their destination
F1.2—Gastronomy
AHETA—fairly important; AHISA—important
F1.6—Nature
AHETA—fairly important; AHISA—important
Table 3. TP and FP results obtained in each variable for answer A1—Water.
VariableTP [%]FP [%]VariableTP [%]FP [%]
A152.547.5C5 (1)52.547.5
A241.458.6C5 (2)51.548.5
A366.733.3C5 (3)78.821.2
A4 (1)56.643.4C5 (4)60.639.4
A4 (2)64.635.4C5 (5)57.642.4
A4 (3) 63.636.4D1 (1)45.554.5
A4 (4) 52.547.5D254.545.5
A4 (5) 57.642.4D349.550.5
B1 (1)76.823.2F1 (1)85.914.1
B1 (2)61.638.4F1 (2)49.550.5
B244.455.6F1 (3)57.642.4
B3 (1)54.545.5F1 (4)63.636.4
B3 (2)51.548.5F1 (5)44.455.6
B4 (1)42.457.6F1 (6)48.551.5
B4 (2)43.456.6F1 (7)80.819.2
C143.456.6F253.546.5
C250.549.5F356.643.4
C354.545.5
Publisher’s Note: MDPI stays neutral with regard to jurisdictional claims in published maps and institutional affiliations.

