1. Introduction
In the last four decades, China has achieved major economic development, which has been accompanied by serious environmental pollution. When the central government decides to roll out environment-related rule policies requiring compliance across a whole social welfare level, different enterprises are adversely affected by different regulatory constraints affecting different endowment factors (e.g., technology and resources). As a result, the degree of impact on these enterprises is different. Moreover, the environment-related efficiency of various industries is also affected. From a short-term perspective, the impact exerted by environment-related rules onto environment-related efficiency is primarily a “cost effect”. Environment-related rules increase the cost expenditure of enterprises, affect investment in technological innovation, reduce profits, and lower the production efficiency and performance level of enterprises or industries. In the long run, environment-related rules will exert “innovation compensation” effects and lead to increasingly reasonable future environment-related rules. In accordance with the technology compensation effect, the environment-related product quality and outputs can be enhanced. In the meantime, enterprises can be encouraged to develop technological innovations, enhance their production efficiency, remedy the extra costs attributed to environment-related rules, as well as boost their technological innovation ability and both their own comprehensive competitiveness and that of the broader national industry [
1,
2]. This study aimed to delve into the effect exerted by environment-related rules of industries on environment-related efficiency in China and to determine whether environment-related rules have an optimal intensity in different industries. Accordingly, first, the threshold effect exerted by environment-related rules on environment-related efficiency is studied; second, an empirical analysis was conducted regarding the influence system of environment-related rules on the environment-related efficiency of various industries (e.g., the broader national industry, mining industry, manufacturing industry, industries for generating and supplying power, heat, gases, and water, as well as the construction industry). Lastly, the threshold effect exerted by environment-related rules on environment-related efficiency is expounded. This study decomposed the effect of the environment-related rule. Under the stress placed on the transmission path of environment-related rules on environment-related efficiency, the internal mechanism and related factors of environment-related rules on different industries and regions are clarified, which exert different impacts on environment-related efficiency.
This study studied China’s real economic data and the self-adaptive semi-parameter model to verify the influence system of the environment-related rules of industries on environment-related efficiency. Notably, environment-related rules can critically impact environment-related efficiency by facilitating the upgrade of industrial structures, technological progress, and pollutant transfers, as well as by enhancing enterprise competitiveness and enterprise performance. Thus, the aforementioned factors and variable factors should be controlled in spatial econometric analyses.
For measurement approaches, the semi-parameter model assumes a linear relationship between several independent and dependent variable factors, while the other factors display a non-linear relationship. To capture the spatial heterogeneity of data in different regions, different smoothing factors are required. Accordingly, the adaptive semi-parameter model is used here to quantitatively analyze the interaction mechanism between the industry effect of environment-related rules and environment-related efficiency. In the meantime, industries are classified, and the optimal effect of environment-related rules is calculated with the threshold regression model. Thus, this study underpins the formulation of environment-related rules.
2. Literature Review
The “Porter Hypothesis”, developed by American scholar Michael Porter [
2], elucidates the potential derivative effects of environment-related rules from a dynamic perspective. The Porter hypothesis considers that moderate environment-related rules can inspire enterprises’ initiative innovation consciousness and impetus in a longer-term period, which triggers increased efforts to exploit production technologies to employ higher efficiency, less energy consumption, and less sewage to complete the production. As a result, a potential positive impact, termed as the innovative compensation effect, is further produced. This helps constantly improve the production efficiency of enterprises, decrease production cost, enhance market competitiveness, and boost the performance level of enterprises. Current studies on environment-related rules at the industry level primarily verified whether the Porter Hypothesis is true or false. The Porter Hypothesis can be one of two types, i.e., “weak” and “strong” [
1]. The “strong” Porter Hypothesis holds that the environment-related rule policies based on the appropriate design can enhance enterprise productivity and competitiveness. Alternatively, the “weak” Porter Hypothesis holds that the environment-related rule policies based on the appropriate design can boost enterprise innovations. It has been extensively demonstrated that the Porter Hypothesis effect does not exist, and environment-related rules negatively impact industrial productivity. Barbera and McConnell [
3], Shadbegian and Gray [
4] exploited the American industry data and empirically found that the cost of pollution control caused by environment-related rules could lead to the decrease in industrial productivity to varying degrees. Gray and Shadbegian [
5] analyzed the correlation of environment-related rules and investment in innovations under the “weak” Porter hypothesis framework. This suggests that environment-related rules do not show positive correlation with investment in innovations, but negative ones. Under the framework of the “strong” Porter Hypothesis, Shadbegian and Gray [
6] found that environment-related rules could increase the enterprises’ cost of pollution control while technological innovations cannot fully offset the cost of environment-related rules, thereby resulting in a decrease in environment-related performance and the competitiveness of enterprises. In addition, Rubashkina et al. [
7] applied the panel information pertaining to 17 European nations and identified no evidence supporting the “strong” Porter Hypothesis. Moreover, the research conclusion of Rexhauser and Rammer [
8] indicated that the “strong” Porter Hypothesis is generally invalid, and the type of environment-related innovations determines the impact of environment-related rules on industrial competitiveness. Given the questioning of the Porter Hypothesis, supporters mainly have four pieces of evidence: (1) The inconsistent and even contradictory empirical conclusions underlining the theoretical framework of the Porter Hypothesis originate from the biased errors caused by index selection and estimation methods [
9]; (2) Step-by-step regression testing of Porter Hypothesis will cause inconsistencies in empirical conclusions [
10]; (3) The primary reason why the empirical results obtained under the framework of the “strong” Porter Hypothesis are controversial is that the impact of environment-related rules on productivity growth varies with nations, regions and industries, and it depends on the technological level of each nation or enterprise [
11,
12]. (4) It takes time for stricter environment-related rules to stimulate technological innovations, which up-regulates the efficiency and down-regulates costs. The main reason for doubts is that the dynamic dimension of the Porter Hypothesis is not fully considered in empirical tests [
13]. This viewpoint is also supported by the investment adjustment cost theory [
14].
There are also considerable articles on the influence system between environment-related rules and environment-related efficiency based on the industry level. Based on the measurement of China’s industrial environment-related productivity, Tu [
15] empirically analyzed the relationship between environment-related rules and China’s industrial environment-related productivity, which demonstrated that there is no obvious negative correlation. Through the evaluation and empirical investigation on the technical efficiency of the provincial electric power industry, Zhang and Xia [
16] concluded that there is a “U-shaped” curve relation between environment-related rules and the technical efficiency of the electric power industry. The empirical analysis of 39 industries conducted by Shen [
17] revealed a “U-shaped relationship” between environment-related rules and the environment-related efficiency of industries. Moreover, environment-related rules could help improve the environment-related efficiency of clean industries in the current period, while there is no significant short-term effect on pollution-intensive industries. With the panel data of 30 municipalities directly under the central government and autonomous regions from 2000 to 2011, Liu and Ran [
18] empirically delved into the influence exerted by environment-related rules on the production technological progress of 17 industries in industrial enterprises. They verified that several industries present a significant “U-shaped” or inverted “U-shaped” relation, while there is no significant relation in other industries. In addition, the effect of environment-related rules on the production technological progress of each industry has no relation with the pollution type of the industry. Albrizio [
19] used the national panel data of the OECD to empirically analyze the influence exerted by environment-related policy intensity on productivity growth at the industry level. As suggested from the results, strict environment-related policies in nations with higher scientific and technological levels could promote the short-term productivity growth at the industry level, while the growth effect decreases with the increase in the distance from the global productivity frontier until it becomes insignificant. By measuring the environment-related efficiency of the whole manufacturing industry, severe, moderate and mild-pollution industries in Hebei Province, Zhuang et al. [
20] conducted an empirical analysis on the relation between environment-related rules and environment-related efficiency. According to these scholars, environment-related rules exert noticeably positive influences onto the environment-related efficiency of the mild-pollution industry, while environment-related rules exert an insignificant positive effect on the environment-related efficiency of the severe and moderate-pollution industries. By building a mathematical model and based on the assumption of regional consistency, Shen [
21] tested the nonlinear relation between environment-related rules and technological innovations in China and determined the optimal rule level of environment-related rules. The research indicated a double threshold of the level of the economy development. The greater the threshold of the level of the economic development crossed, the more significant the promoting effect of environment-related rules on technological innovations will be. With the panel data of 33 subdivided sectors in China from 2004 to 2011 and the threshold regression method, Song [
22] empirically investigated the threshold effect of environment-related rules on the R&D double-link efficiency. The empirical conclusion indicated that the threshold effect of environment-related rules on the R&D double-link efficiency had significant heterogeneity. Based on the measurement of the intensity and efficiency of environment-related rules in 30 provinces and cities (excluding Tibet, Hong Kong, Macao, and Taiwan) from 2007 to 2016, Zhou et al. [
23] conducted an empirical analysis and confirmed a “U-shaped” relation between the two at the national level and an inverted “U-shaped” relation in the eastern region. Furthermore, there is a threshold effect between environment-related rules and environment-related efficiency. Moreover, some researchers explored the threshold influence exerted by environment-related rules from the perspective of the region [
24,
25,
26].
In brief, there are some divergences in the demonstration of Porter Hypothesis in the current studies. The influence system of environment-related rules on environment-related efficiency and the relation between the two vary with data and models. However, there are relatively few studies on whether there is a threshold effect in industrial environment-related rules. Here, the impact mechanism of environment-related rules on environment-related efficiency, the heterogeneity of different industries, and the threshold effect of environment-related rules of different industries are further explored.
3. The Influence of Environment-Related Rules of Industries on Environment-Related Efficiency
When the government rolls out environment-related rule policies, enterprises generally satisfy the government’s requirements by managing pollution, or by improving their technological level and implementing cleaner production measures. However, industries exhibiting different pollution levels face different constraints affecting environment-related rules. Heavy polluting industries are facing robust constraints. It is an urgent requirement to reduce their pollution emissions via pollution control, or by cleaner production, or elevating their current technological level, etc. Less polluting industries are subject to less constraints, and environment-related rule policies slightly affect them. For the huge differences in the elements and levels technological development of extensive industries, the influence exerted by different effects of environment-related rules on the environment-related efficiency of various industries is different. Overall, there are three scenarios: (1) if the environment-related rules are in a certain range of intensity, these may significantly enhance the environment-related efficiency of the industry, and its improvement. A gradual increase in its degree refers to an increase in its marginal effect; (2) If environment-related rules are in a certain range of intensity, these will help increase the environment-related efficiency of the industry, though its degree of improvement declines progressively, i.e., the phenomenon of diminishing marginal effect; (3) If environment-related rules are at a certain level, it may also occur that these environment-related rules hinder the improvement of environment-related efficiency of industries, i.e., a negative correlation is identified [
17,
27,
28,
29]. Thus, it is considered that environment-related rules exert a “threshold effect” on environment-related efficiency, i.e., there are some thresholds values. If environment-related rules fall in different thresholds, the impact of environment-related rules on environment-related efficiency is different. Thus, the following hypotheses 1 and 2 are proposed.
Hypothesis 1 (H1). A range of industries are facing different degrees of restriction of environment-related rules, so different effects of environment-related rules are exerted on the environment-related efficiency of various industries.
Hypothesis 2 (H2). Environment-related rules have a “threshold effect” on environment-related efficiency. If environment-related rules fall in different thresholds, the marginal effect of environment-related rules on environment-related efficiency varies.
4. Variable Factors Selection, Data Sources and Descriptive Statistics
4.1. Materials and Methods
Given the analysis of the theoretical mechanism of the second section, this study selects three variable factors as dependent variable factors and seven variable factors as independent variable factors: environment-related efficiency (y1); environment-related efficiency technology gap (y2); environment-related efficiency improvement potential (y3); effect of environment-related rules (x1); technological progress (x2); FDI dependency (x3); industrial profit margin (x4); capital and labor structure (x5); market concentration (x6); and nationalization rate (x7), and calculates the urban environment. Efficiency acts as a dependent variable. The variable factors and indicators include:
- 1.
Environment-related efficiency (y1): Where capital and labor are input variables, and by using the expected (GDP) and unexpected output (i.e., the environment pollution) as output variables, the SBM model is employed to calculate green environment efficiency.
In combination with the models and methods of Tone [
30,
31], this study employs the SBM model with unexpected output to determine the environment-related efficiency.
A system is assumed to have n decision units , which have three indicators, i.e., m input indicators (i = 1, 2, ⋯, m), s1 expected output indicators as well as s2 non-expected output indicators. These indicators are, respectively, considered as vectors , , . Matrix X,, are , , . Suppose , , .
The production possibility set has the following definition:
The SBM model (VRS,
) with an undesired output based on a variable income is expressed as
where
,
and
, respectively, denote input, expected output and unexpected output;
expresses the weight vector; objective function is
. The aforementioned three decrease to
,
and
, respectively.
- 2.
Environment-related efficiency technology gap (y2):
By using the formula of meta-frontier SBM model, we can calculate the energy efficiency by complying with the group frontier and meta frontier, respectively. Here, this study marks
and
,
is termed as the total factor energy efficiency, and it is able to fall to the technology gap (
TG) and technical efficiency (
TE):
The technology gap can be exploited to measure the technology gap between group frontier and meta frontier. The more the value approaches 1, the lower the technology gap will be.
- 3.
Environment-related efficiency improvement potential (y3):
In the SBM model of environment-related efficiency measurement, the optimal relaxation variables can be calculated simultaneously. The relaxation variables of input, expected output and unexpected output are recorded as
,
,
, respectively, which can represent the optimal adjustment range of input and output. Since environment-related efficiency stresses energy input and pollutant emission, this study uses the energy input relaxation variable and the unexpected output relaxation variable to construct an evaluation index of environment-related efficiency improvement potential (EI):
where
denotes the relaxation variable of energy input, i.e., the reduction in energy input;
expresses the relaxation variable of unexpected output and the reduction in pollutant emission. Therefore, the larger the EI, the greater the potential for environment-related efficiency improvement will be.
- 4.
Strength of environment-related rules (
x1): Numerous indexes can be adopted to measure environment-related management strength in existing literatures, which are measured by using proxy variables from different perspectives. In brief, it can fall to 4 types: (1) The measurement with the comprehensive index of pollution emissions—for instance, Li and Mu [
32] (2013) used carbon emissions per unit output to determine the strength of environment-related management. Fu and Li [
33], Li and Tao [
34] used the emission of pollutants to build a comprehensive index method to determine the strength of environment-related management; (2) The use of investment expenditure on pollution control for the measurement—for example, Zhang Cheng et al. [
35] exploited the overall investment in the control over the industrial pollution as a measurement index; (3) According to the perspective of economic development level—for example, Lu [
36] adopted the level of per capita income to quantify informal environment-related management; (4) the use of the number of environment-related management laws and policies as the measurement index of environment-related management. Compared with the number of relevant laws and rules, the strength of environment-related management is determined by the actual implementation. Thus, the number of laws and rules cannot directly measure the effect of environment-related management. Though the level of economic development is affected by the level of environment-related management to a certain extent, only informal environment-related management can be measured. Such a measurement cannot be completely accurate. As the investment quota for pollution control is directly affected by the size of the industry, large-scale industries will inject more capital and technologies into pollution control. However, this index does not indicate that the industry’s environment-related management strength is high. Thus, this study uses pollutant discharge as an index, fully considers three different types of pollutants (i.e., wastewater, waste gas and waste), and comprehensively reflects the strength of environment-related management through the technical treatment (e.g., unit output and standardization).
By using the method to build comprehensive indexes proposed by Yu [
37], and considering the availability of data, this study selects two single indexes of industrial wastewater discharge and industrial waste gas discharge from various industries to build a comprehensive measurement index of environment-related management strength. The specific treatment is as follows:
- (1)
The annual industrial wastewater discharge and industrial waste gas discharge of each region is divided by the total industrial output, as an attempt to solve the problem of the difference of pollutant discharge among different industries;
- (2)
The emission per unit output is standardized, and the values of each index are converted into the range of [0,1]. Since both indexes are negative indexes, the following treatment methods are adopted:
where
xij denotes the strength of environment-related management for a province in a year,
vij represents the emission value of a province in a year (after the de-differentiation), max(
vij), min(
vij) are the maximal and minimal emissions of a province in nine years (after the de-differentiation), respectively;
- (3)
It is always meaningful to add standardized pollutant indexes for their horizontal comparability. In this study, the standardized data of industry-related wastewater discharge and industrial waste gas discharge are combined to obtain the regional environment-related strength data by using the equal weight method. Notably, since environment-related management is measured by pollutant emissions, this study uses negative indexes to process data. Thus, the greater the value of environment-related strength, the greater the strength of environment-related management will be.
- 5.
Technological progress (x2): The elevation of their level of technological development, i.e., technological progress primarily consists of technological innovations and innovation and technological process renewal and transformation, to exploit resources and energy and stimulate environment-related efficiency more efficiently. The industry R&D is split by industry GDP to determine its technological progress.
- 6.
FDI dependency (x3): Dividing industry FDI by industry GDP, which reflects the degree of dependence of GDP on FDI in a specified period.
- 7.
Profit margin of industries (x4): This study divides industry profit by gross output to obtain industry profit margin index, thereby revealing industry competitiveness.
- 8.
Capital labor structure (x5): This study uses the ratio of net fixed assets to the number of employees to determine capital labor structure indicators.
- 9.
Market concentration (x6): This study divides the difference between industrial added value and total wage by total industrial output to determine the market concentration index.
- 10.
Nationalization rate (x7): Overall, non-state-owned enterprises exhibit higher production efficiency than state-owned enterprises. State-owned enterprises have a higher monopoly position in resources and energy; they face poor cost constraints affecting resources and energy. This commonly leads to the waste and inefficient use of resources and energy. The proportion of state-owned enterprises in China’s industrial output is commonly high. Environment-related efficiency has declined. With the ratio of the gross domestic product of state-owned and state-controlled enterprises to that of industrial enterprises above the scale, the index of nationalization rate can be determined.
4.2. Data Sources
The research scope of this part consists of the data of mining, manufacturing, power, heat, gas and water production and supply, and construction industries from 2007 to 2015. The basic data employed in this study originate from China Statistical Yearbook, China Industrial Statistical Yearbook, China Population and Employment Statistical Yearbook, China Environment-Related Statistical Yearbook and the official website of the National Bureau of Statistics.
4.3. Descriptive Statistics
Descriptive statistics of all variable factors in the industry are listed in
Table 1. The average environment-related efficiency of the broader national industry reaches 0.835, and the average intensity of effect of environment-related rules is 0.892.
Descriptive statistics of variable factors in the mining industry are listed in
Table 2. The average environment-related efficiency of mining industry is 0.796, and the average value of effect of environment-related rules is 0.76. The environment-related efficiency and effect of environment-related rules of mining industry are lower than that of the broader national industry.
Table 3 presents the descriptive statistics of variable factors in the manufacturing industry. The average environment-related efficiency of manufacturing industry is 0.846, and the average value of effect of environment-related rules is 0.92. The average of environment-related efficiency and effect of environment-related rules of manufacturing industry is higher than that of the broader national industry.
Descriptive statistics of variable factors in the production, supply and supply sectors of electricity, heat, gas and water are listed in
Table 4. The average environment-related efficiency of power, heat, gas and water production and supply industries is 0.851, and the average effect of environment-related rules is 0.944. The average environment-related efficiency and regulatory intensity of the production and supply industries of electricity, heat, gas and water are the highest among the four industries.
Descriptive statistics of variable factors in the construction industry are listed in
Table 5. The average environment-related efficiency of the construction industry is 0.795, and the average value of the effect of environment-related rules is 0.811. The average of environment-related efficiency and effect of environment-related rules of the construction industry is also low.
Generally, the environmental efficiency and the intensity of environmental regulations in the industries of manufacturing and production and supply of electricity, heat, gas, and water have a relatively high average value, higher than the environmental efficiency value of the full sample of the industry. The environmental efficiency and the intensity of environmental regulations in mining and construction industries have relatively low average values, lower than the environmental efficiency values of the full sample of the industry. The standard deviation of environmental efficiency values in all industries is 0.1~0.2, with a low degree of dispersion. However, as revealed from descriptive statistical analysis, the performance of the manufacturing and electricity, heat, gas and water production and supply industries regarding the environmental efficiency and the intensity of environmental regulations is better, higher than the performance of the other two industries and the entire industry.
5. Adaptive Semi-Parametric Panel Model
Specific to measurement approaches, the semi-parameter model assumes a linear relationship between some independent and dependent variable factors, while the other part presents a non-linear relationship. To capture the spatial heterogeneity of data in different regions, different regions need different smoothing factors. In addition, the MADM method can solve similar problems [
33,
38,
39], whereas more variables and the adaptability of the model are considered. In this study, the adaptive semi-parameter model is employed for the econometric analysis.
Overall, the specific form of the econometric model is determined in the parametric model. However, the function relation between the dependent variable and independent variable may not be the case. The nonparametric model does not assume the functional form between the dependent variable and independent variable, while it directly fits to the data of the dependent variable and independent variable, which solves this problem to a certain extent [
40]. Nevertheless, the nonparametric model may cause the problem of “dimension curse”, and the boundary data fitting error is more significant. Thus, the self-adaptive semi-parametric panel model is used for the econometric analysis to solve the aforementioned problems. The semi-parametric model assumes that there is a linear relationship between part of the present independent and dependent variables, as well as a nonlinear relationship between the other part of independent and dependent variables. In addition, different smoothing factors are employed to capture the spatial heterogeneity of data from different industries [
41].
For the nonparametric model:
The expression is supposed as
where
,
,
, and
,
equals to
.
To avoid the over fitting problems, it is assumed that:
(the symbol ~ denotes
’s distribution of obedience). According to the work of Crainiceanu [
42], the punitive spline model can be determined, as expressed in (10):
It is supposed that
and
are modeled by logarithmic linear models, as expressed in Equations (12) and (13). Setting
in log linear model is to develop a spatial adaptation method to simulate
. The spatial adaptation method can capture the spatial heterogeneity of data in different regions. Moreover, different regions apply to different smoothing factors:
Given the work of Baladandayuthapani [
43],
prior distribution is a normal distribution with a mean value of 0 and a large variance.
’s prior distribution is independent of normal distribution.
,
and
’s prior distribution refers to Gama distribution. In other words,
,
let
be the first behavior of a matrix:
relies on
, and the front
diagonal element is 0. The rest of the diagonal elements are, respectively,
’s diagonal array, adaptive smoothing coefficient
b’s punitive spline estimation
can be determined by the work of Ruppert et al. [
41]:
The adaptive smoothing coefficient
is determined by minimizing the generalized cross validation statistics [
41]:
where
denotes the degree of freedom for fitting.
To analyze the relationships of effect of environment-related rules and environment-related efficiency, the previous analysis revealed that the impact of the effect of environment-related rules on environment-related efficiency is non-linear, and the factors (e.g., upgrading of industrial structures, GDP per capita, human resources level, urbanization rate, openness and technological progress) should be regulated. Accordingly, this study established an adaptive semi-parametric panel model with non-linear variable factors as well as linear variable factors. According to Equation (16), the full sample of cities, resource-based cities and non-resource-based cities, eastern, central and western cities are analyzed, respectively:
where
denotes the coefficient of the corresponding variable, given the meaning of
,
–
above.
6. Empirical Results
With the AdaptFit module of R software, the evaluated results of the whole sample and the adaptive semi-parametric panel model of various industries are listed in
Table 6. This table elaborates that technological progress boosts environment-related efficiency, which reveals that technological progress contributes to the environment-related efficiency enhancements. FDI dependency significantly reduces environment-related efficiency. The industrial profit margin affects environment-related efficiency both positively and negatively, and the whole sample, mining industry and the production and supply of electricity, heat, gas and water. Industrial profit margin of industries enhances environment-related efficiency, industrial profit margin of the manufacturing industry and the construction industry significantly reduces environment-related efficiency. Capital labor structure and environment-related efficiency have a negative impact. The effect of market concentration on environment-related efficiency is negative. Only the market concentration of the construction industry enhances environment-related efficiency, whereas such a positive effect is slight. The nationalization rate positively impacts environment-related efficiency.
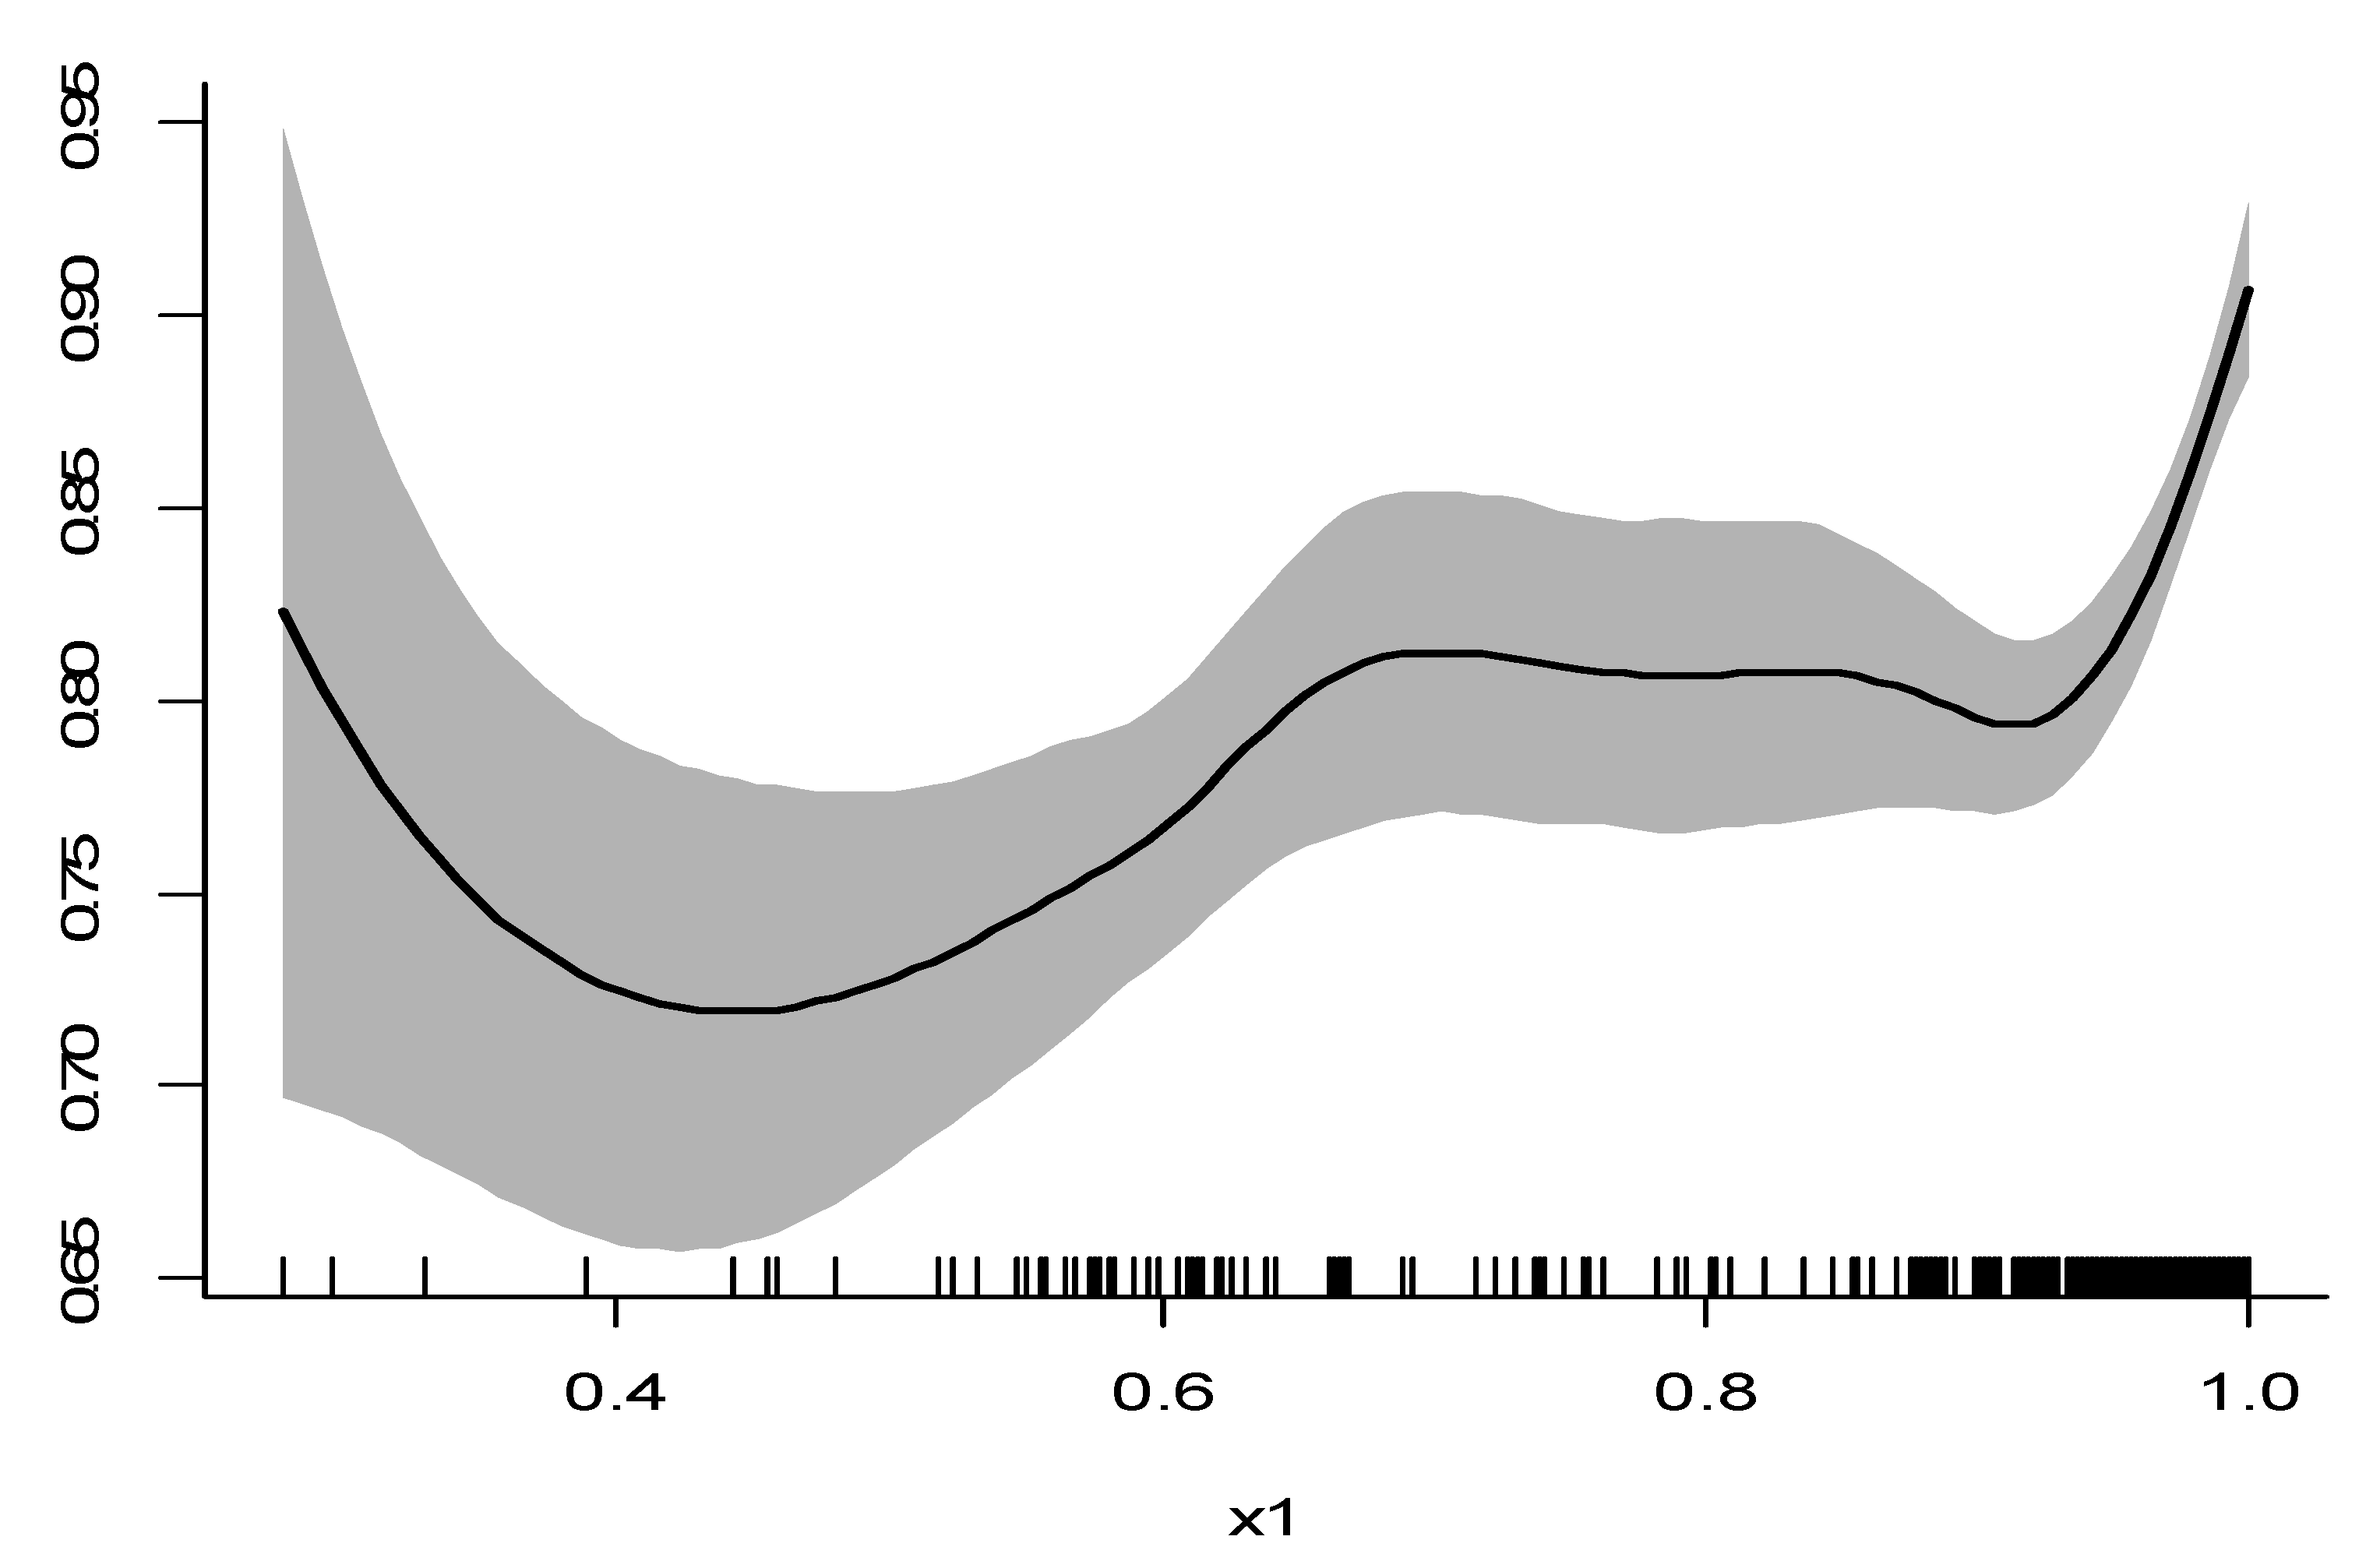
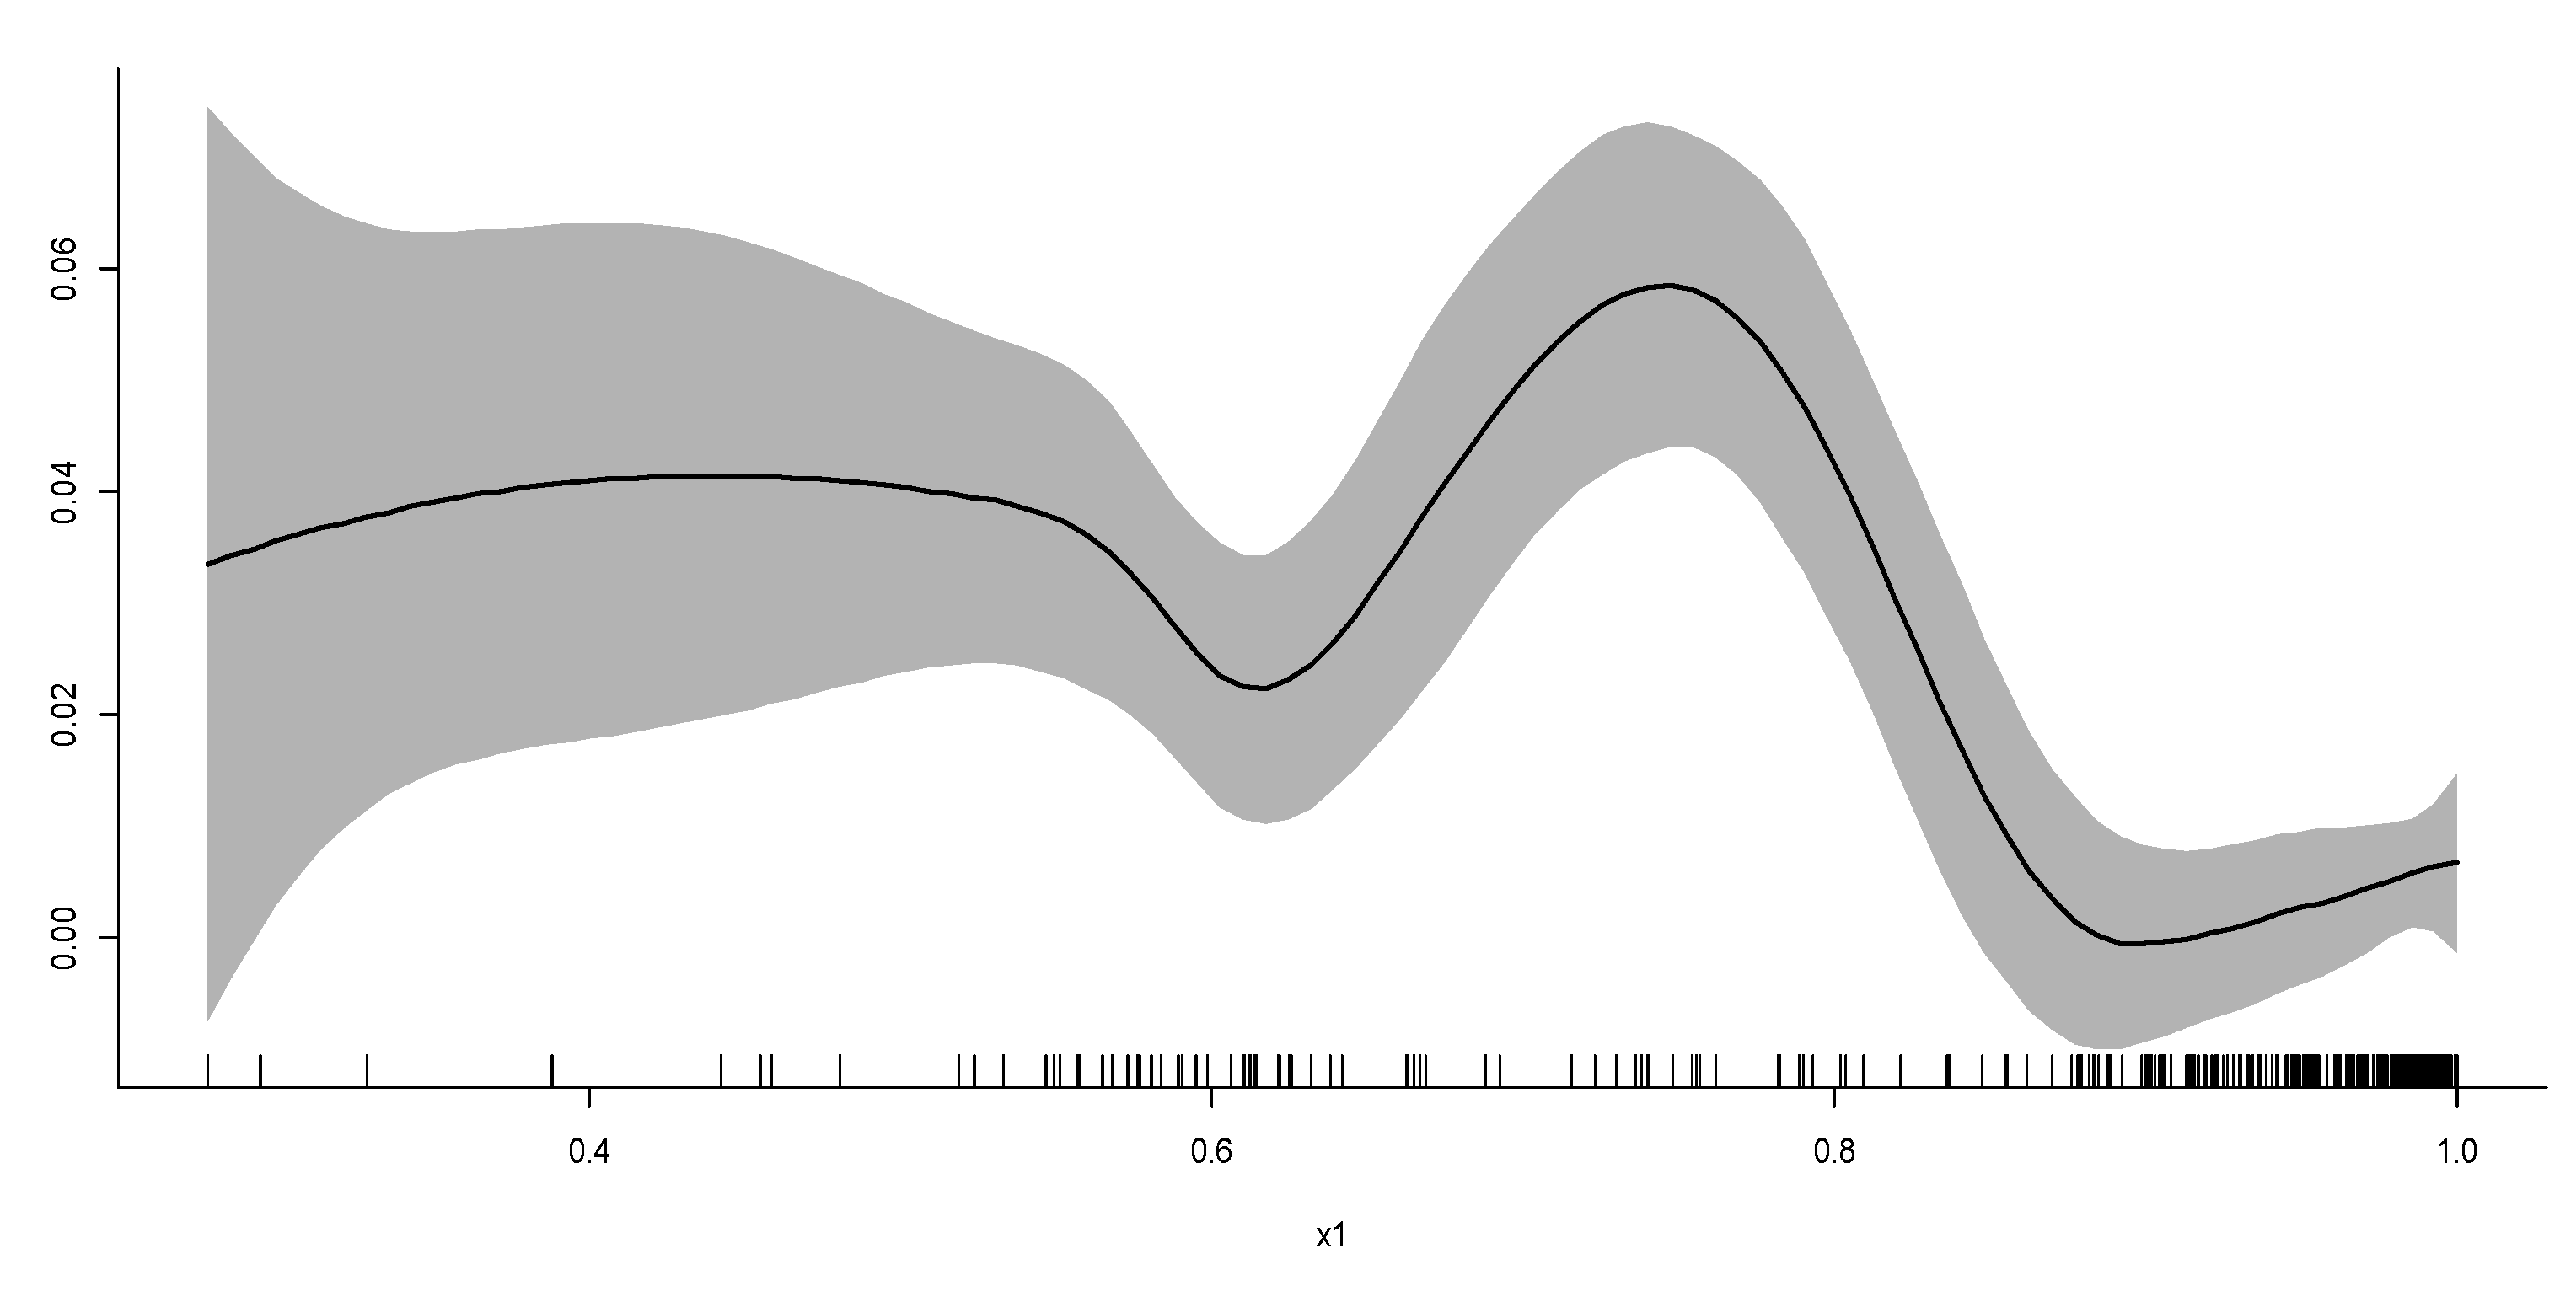
With the adaptive semi-parametric regression model, the fitting graph of the effect of environment-related rules and environment-related efficiency of the broader national industry is presented in
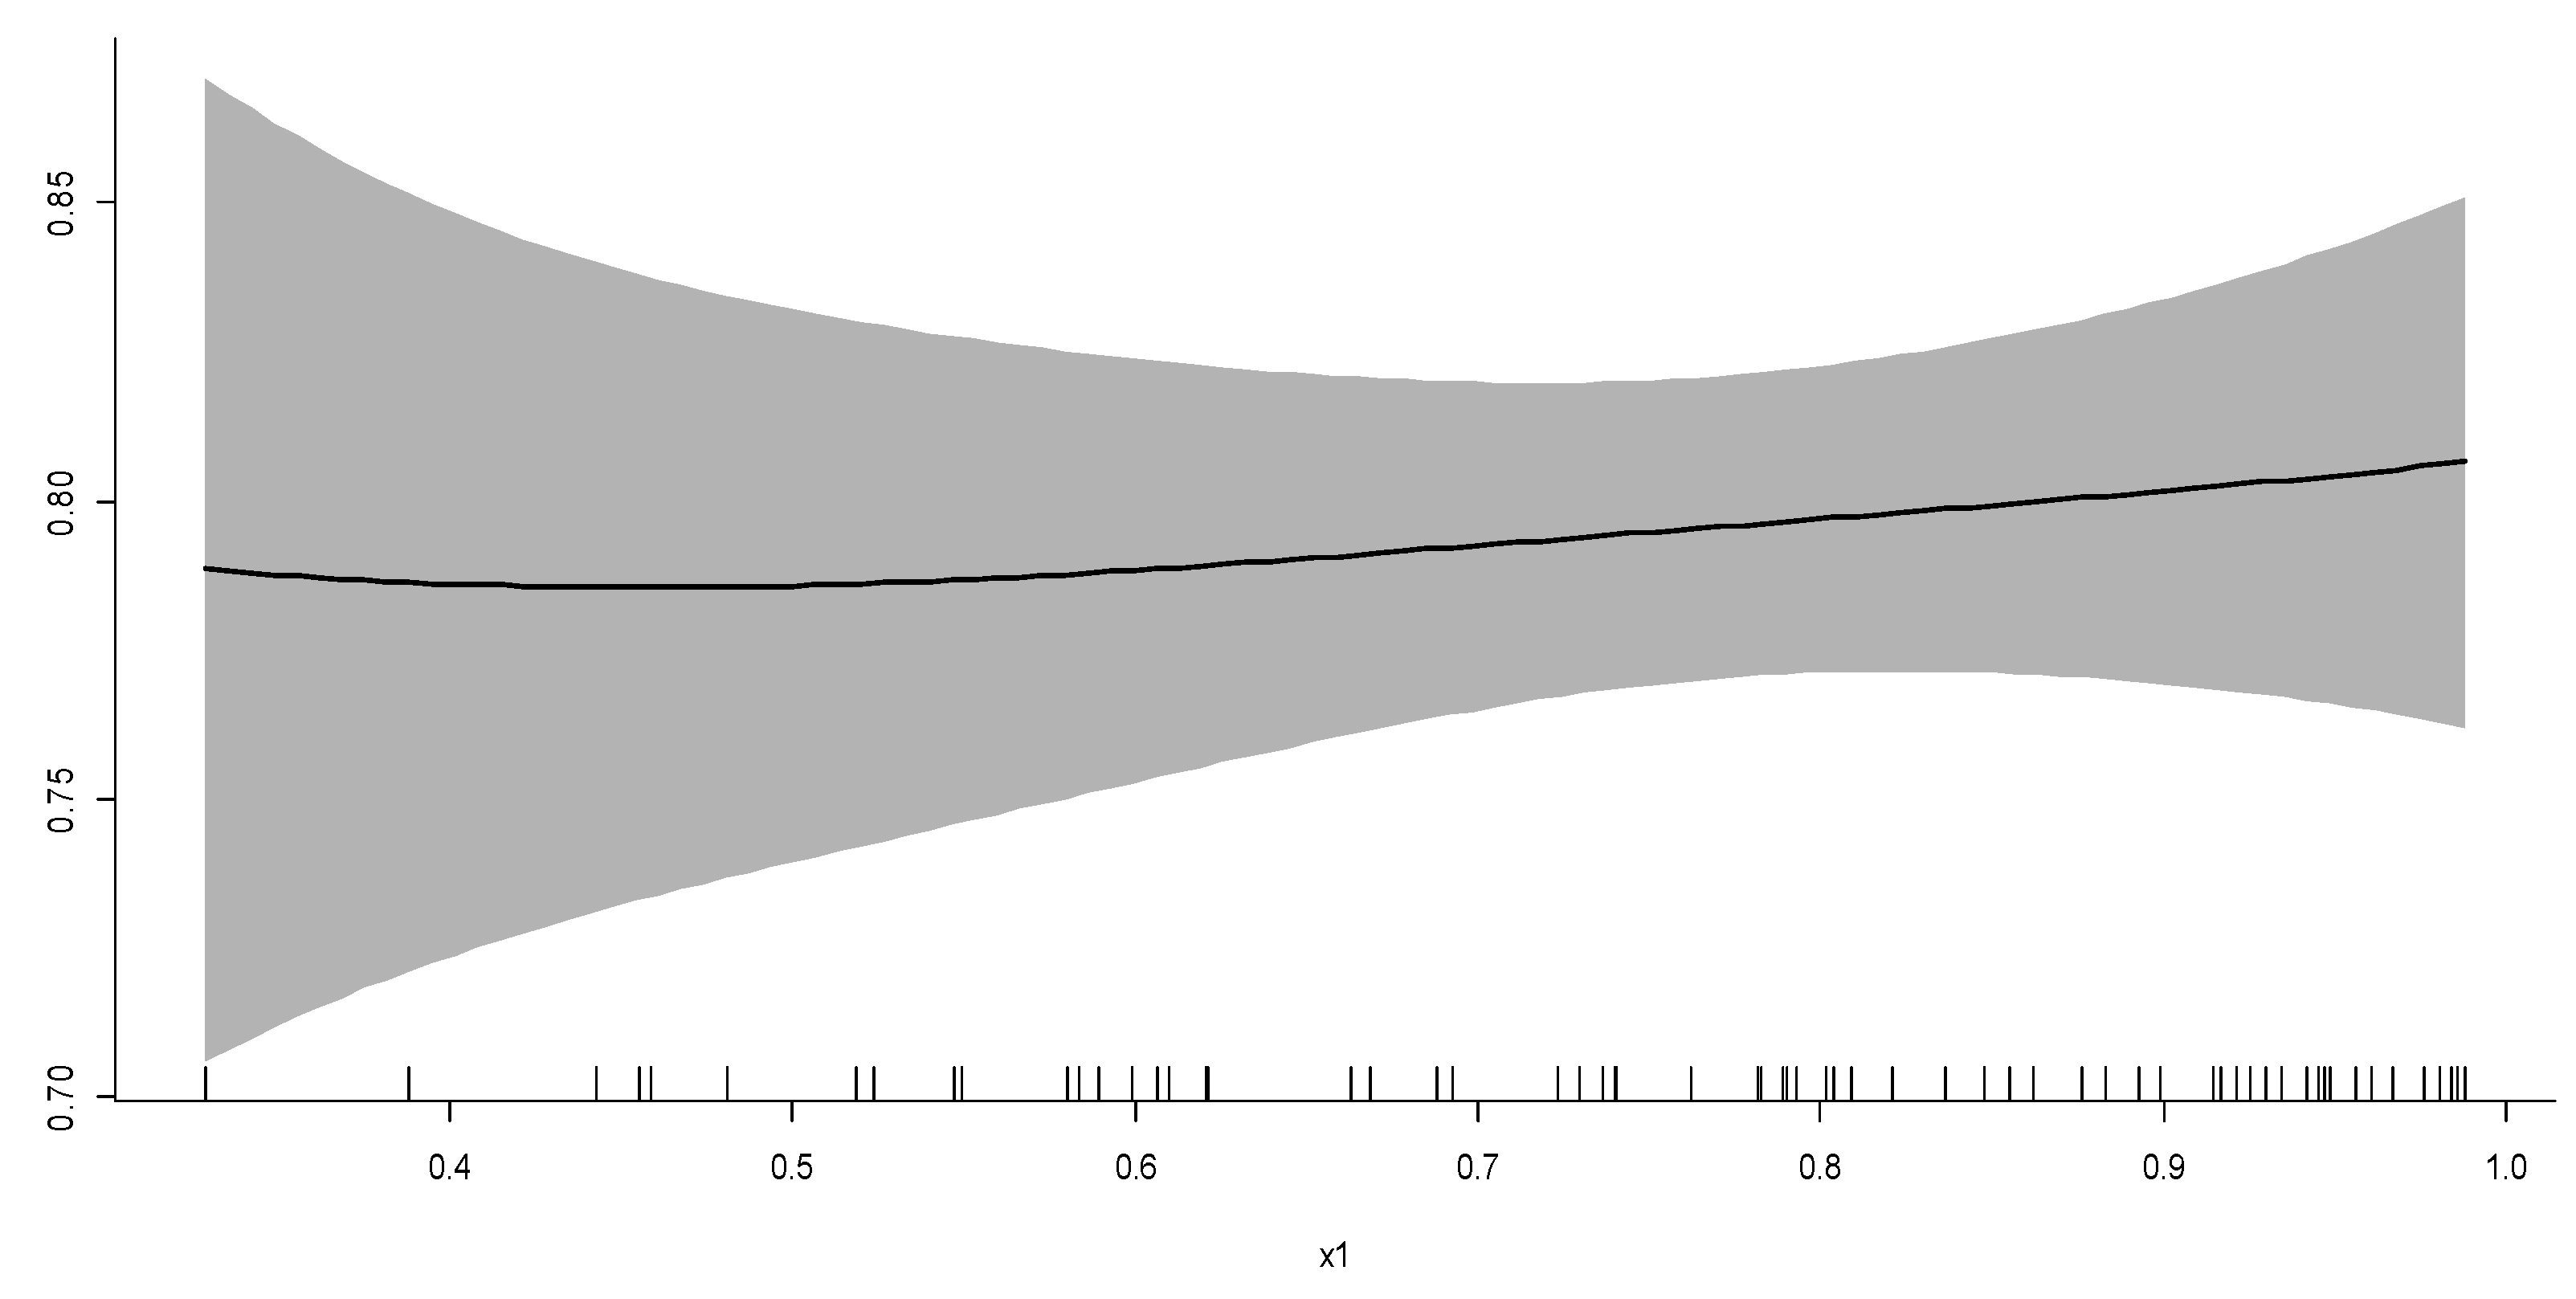
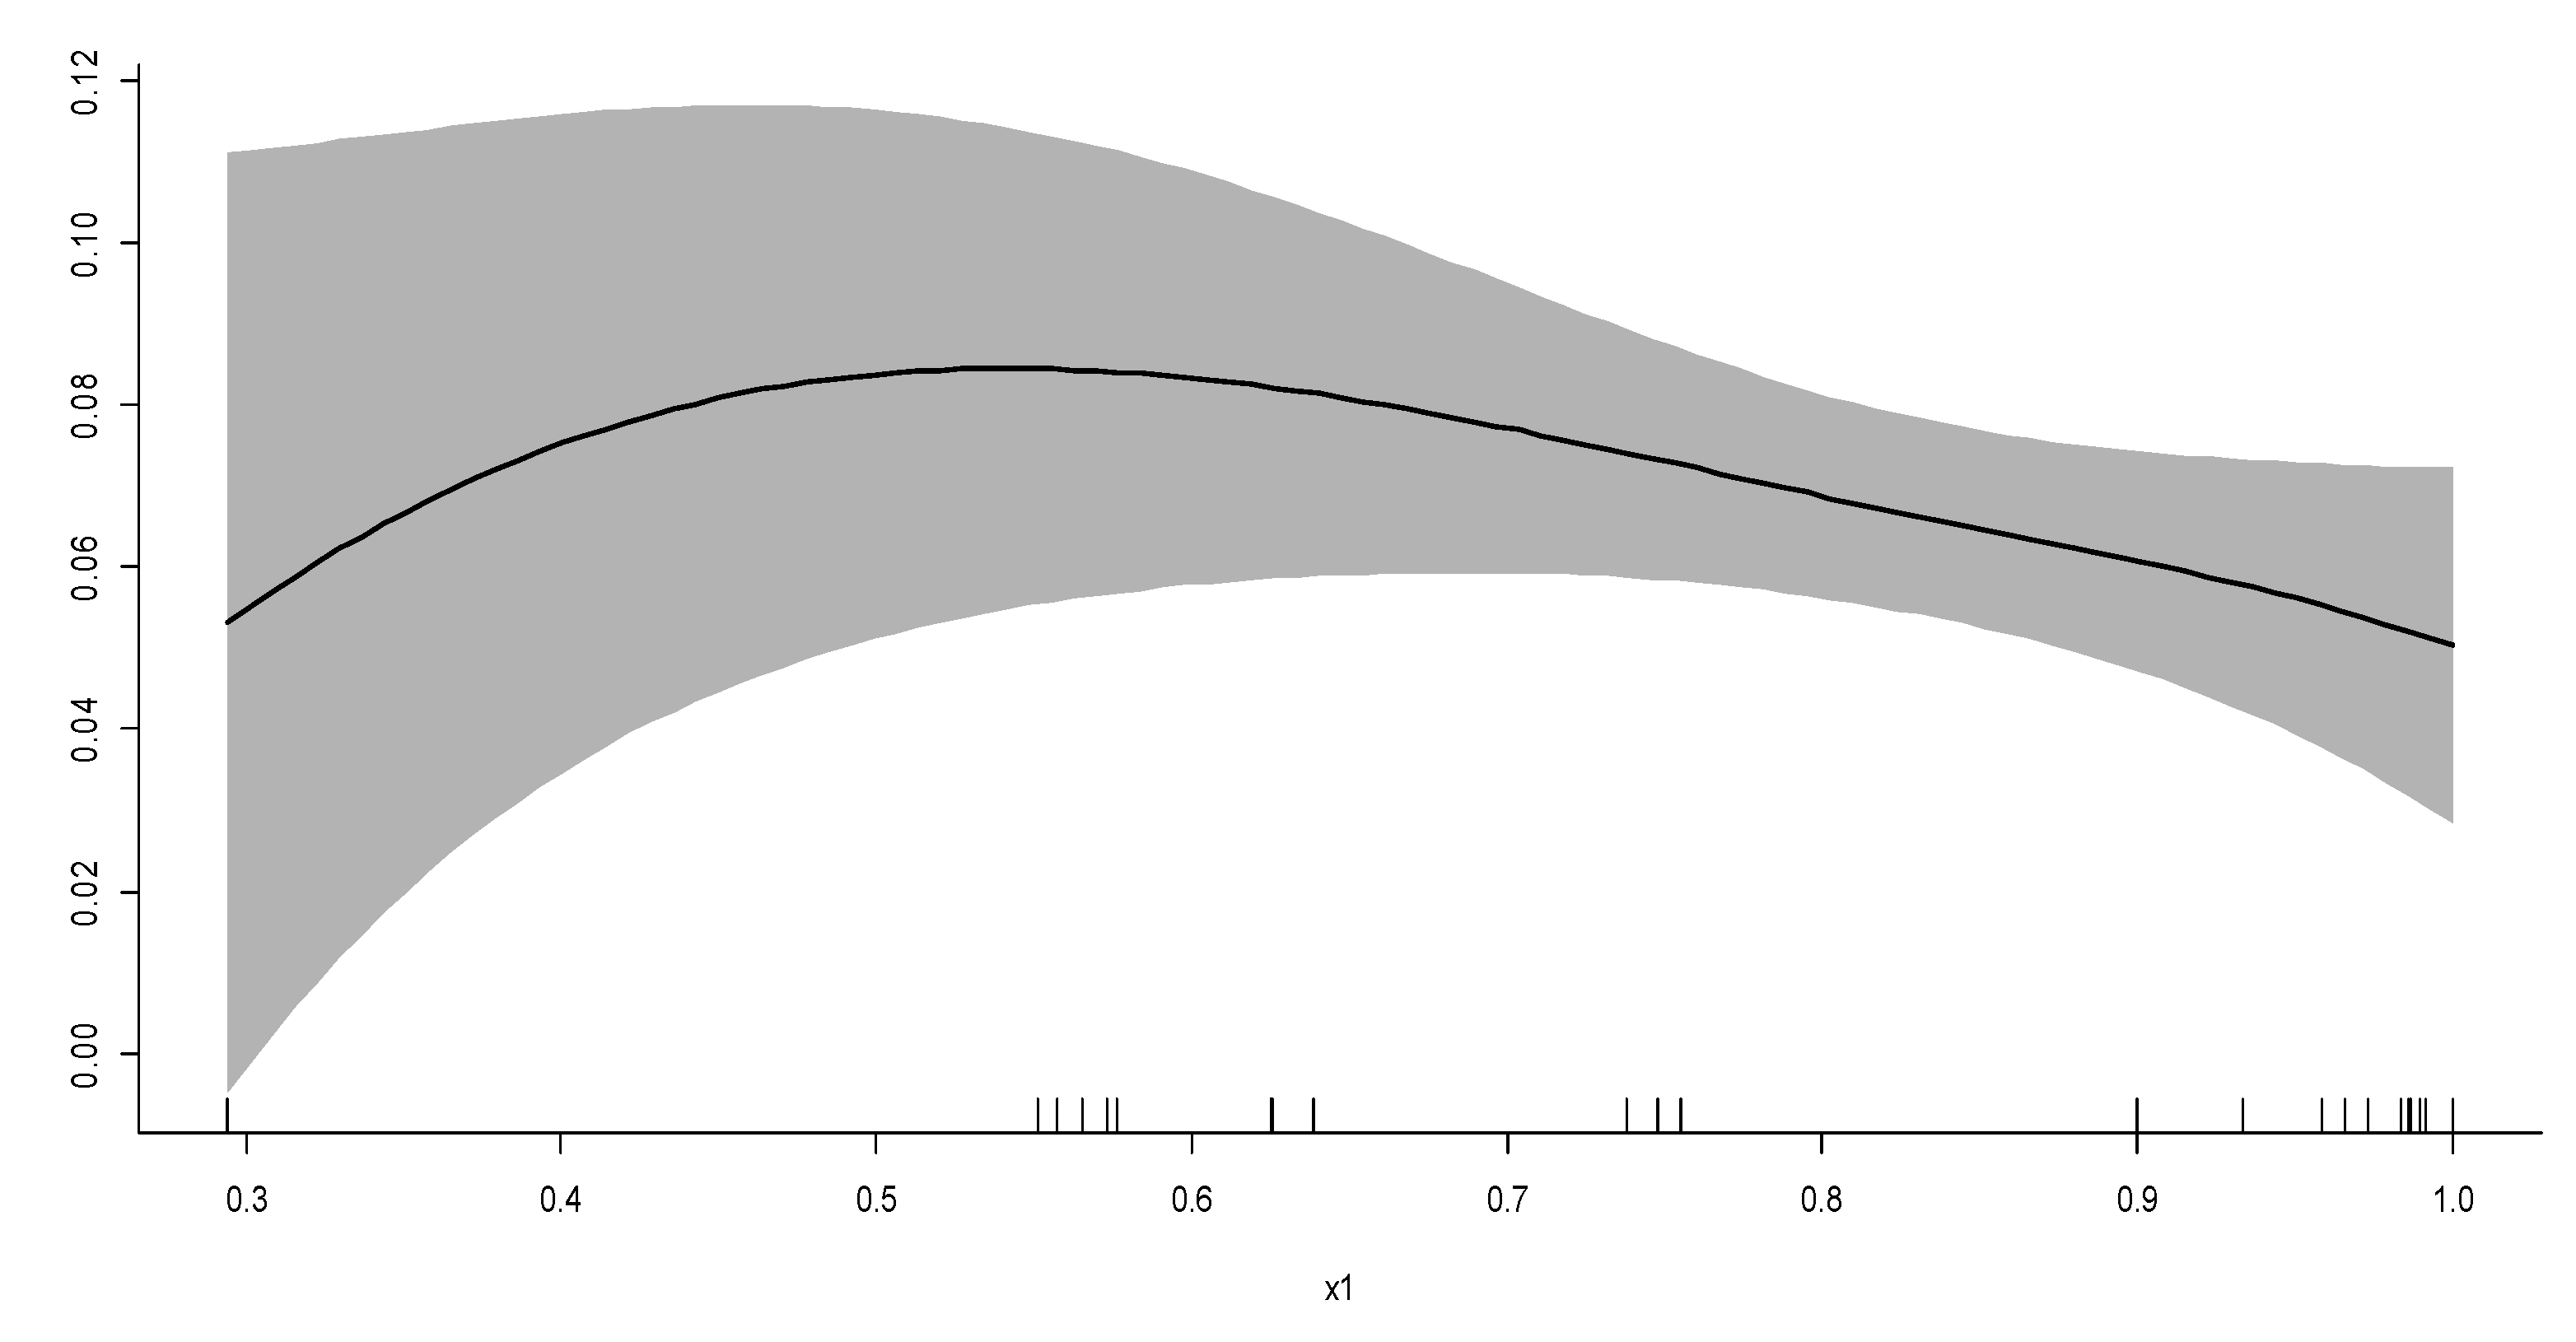
Figure 1; the fitting graph of the effect of environment-related rules and environment-related efficiency of mining industry is presented in
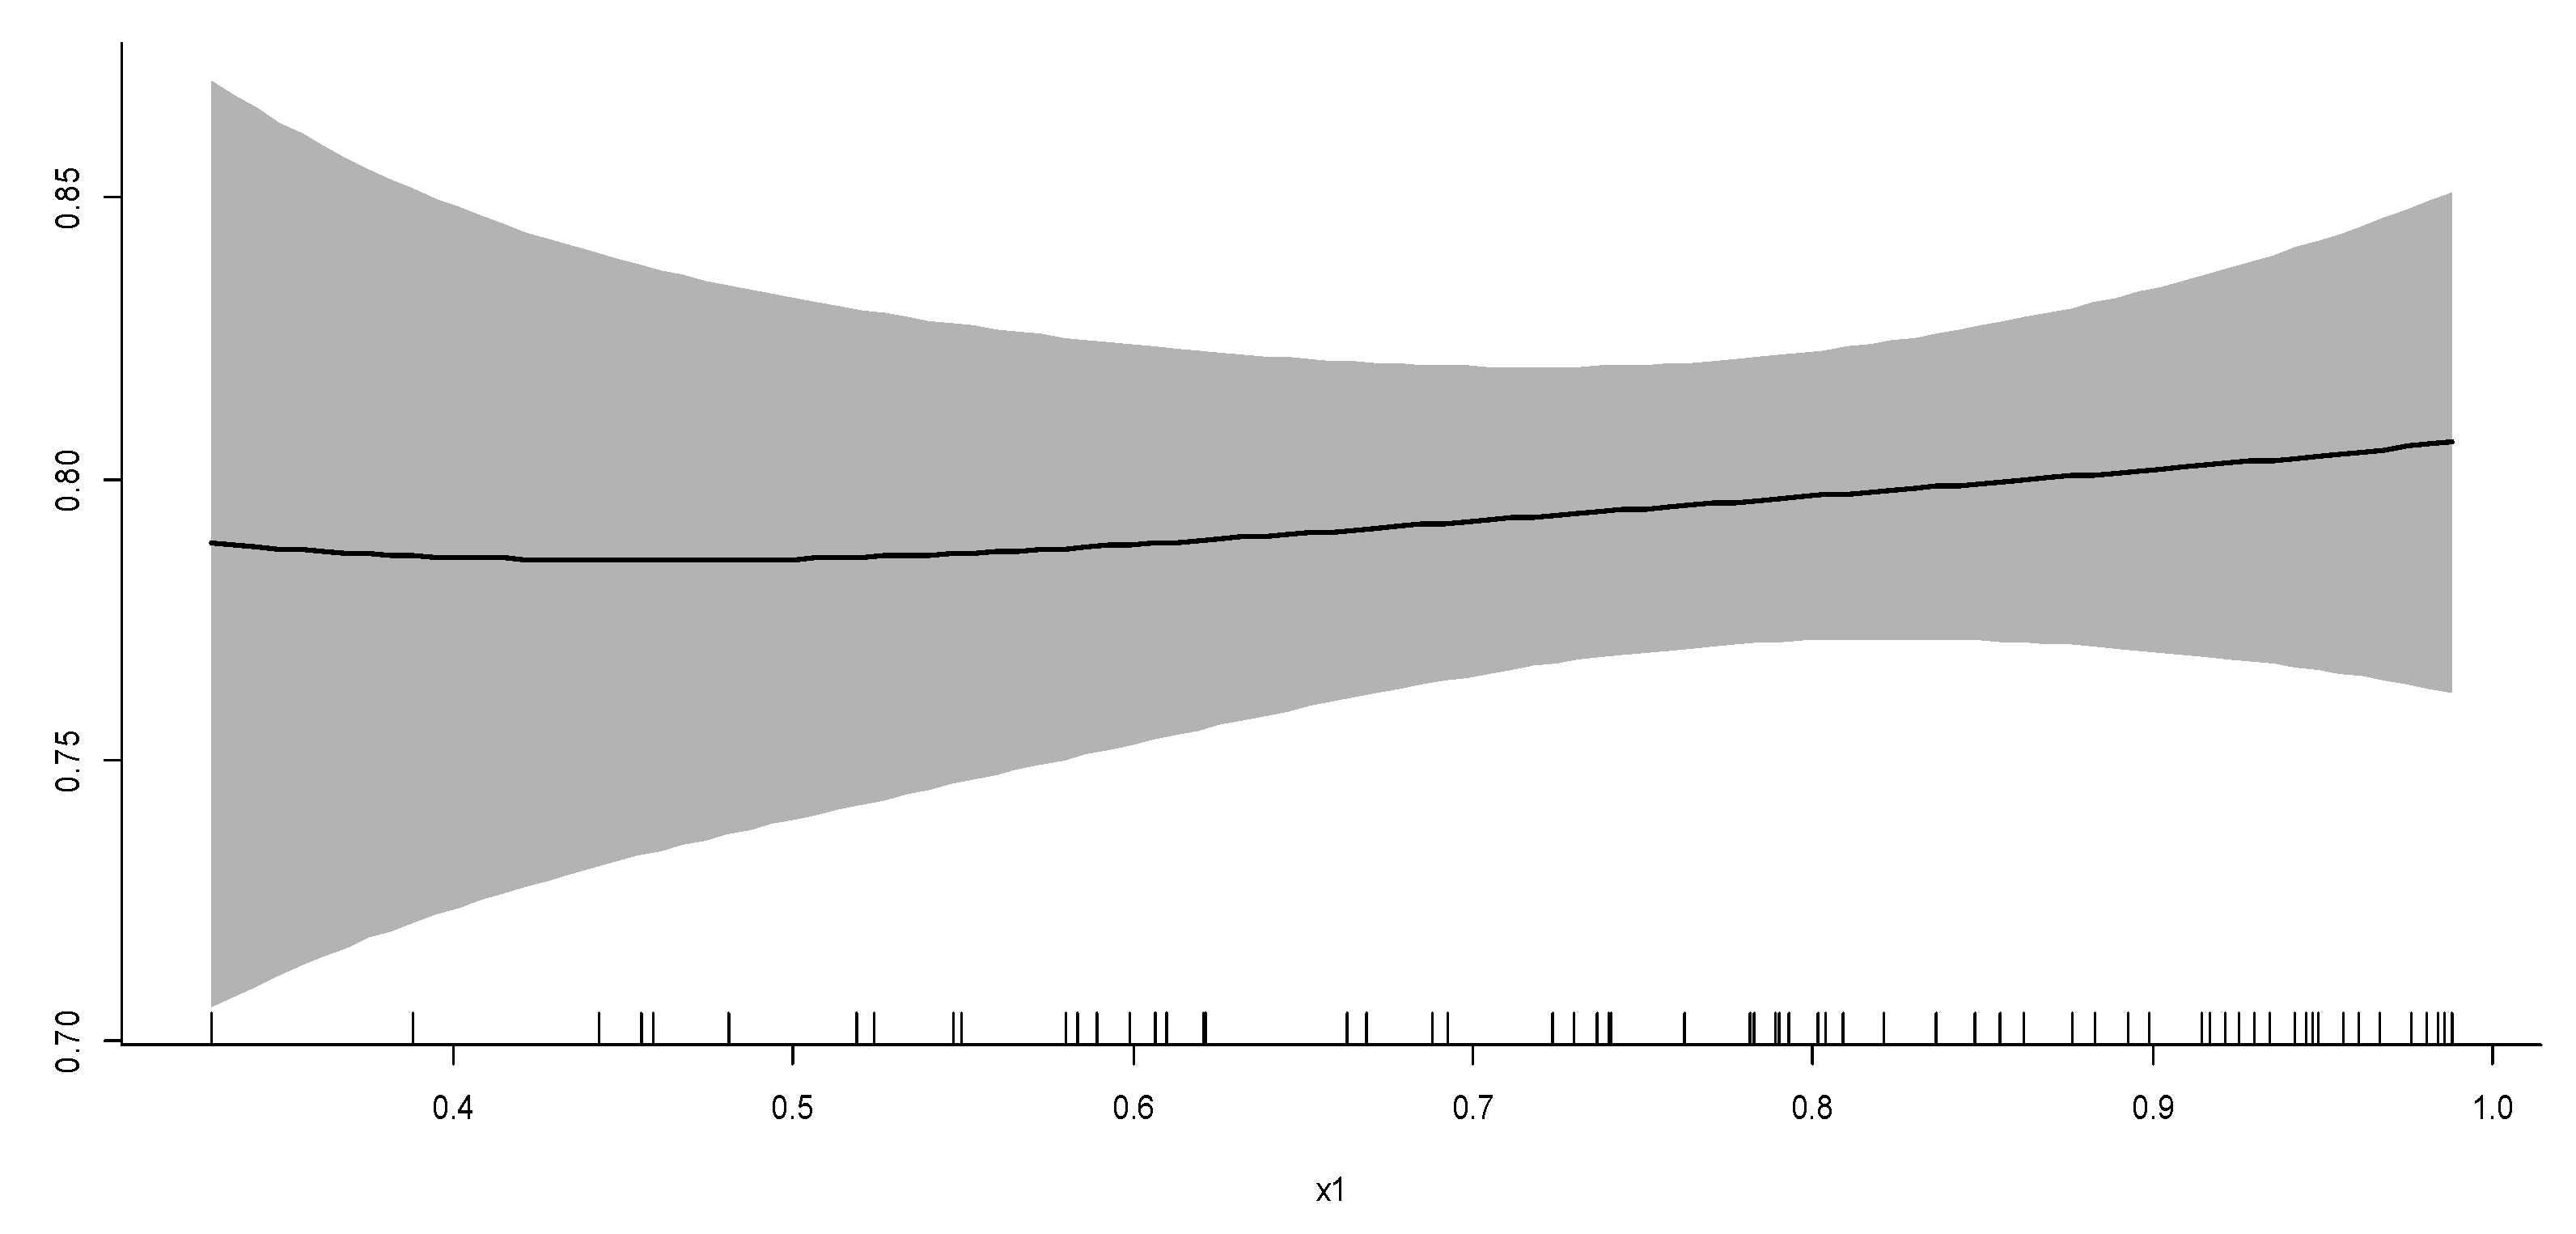
Figure 2; the fitting graph of the effect of environment-related rules and environment-related efficiency of manufacturing industry is presented in
Figure 3; the fitting graph showing the relation between the effect of environment-related rules and the environment-related efficiency of power, heat, gas and water production and supply industries is presented in
Figure 4; the fitting graph of the relationship between the effect of environment-related rules and environment-related efficiency of the construction industry is given in
Figure 5. According to
Figure 1, the relationships of the effect of environment-related rules and environment-related efficiency in the broader national industry is a U-curve, and a significant heterogeneity is identified between the effect of environment-related rules and environment-related efficiency in the four industries. Thus, it is essential to delve into the relationships of the effect of environment-related rules and environment-related efficiency in the four industries.
Figure 2 and
Figure 3 show that the relationships of the effect of environment-related rules and environment-related efficiency of mining and manufacturing industry are flat. The effect of the environment-related rules of mining and manufacturing industry slightly impacts the environment-related efficiency enhancements and should be strengthened.
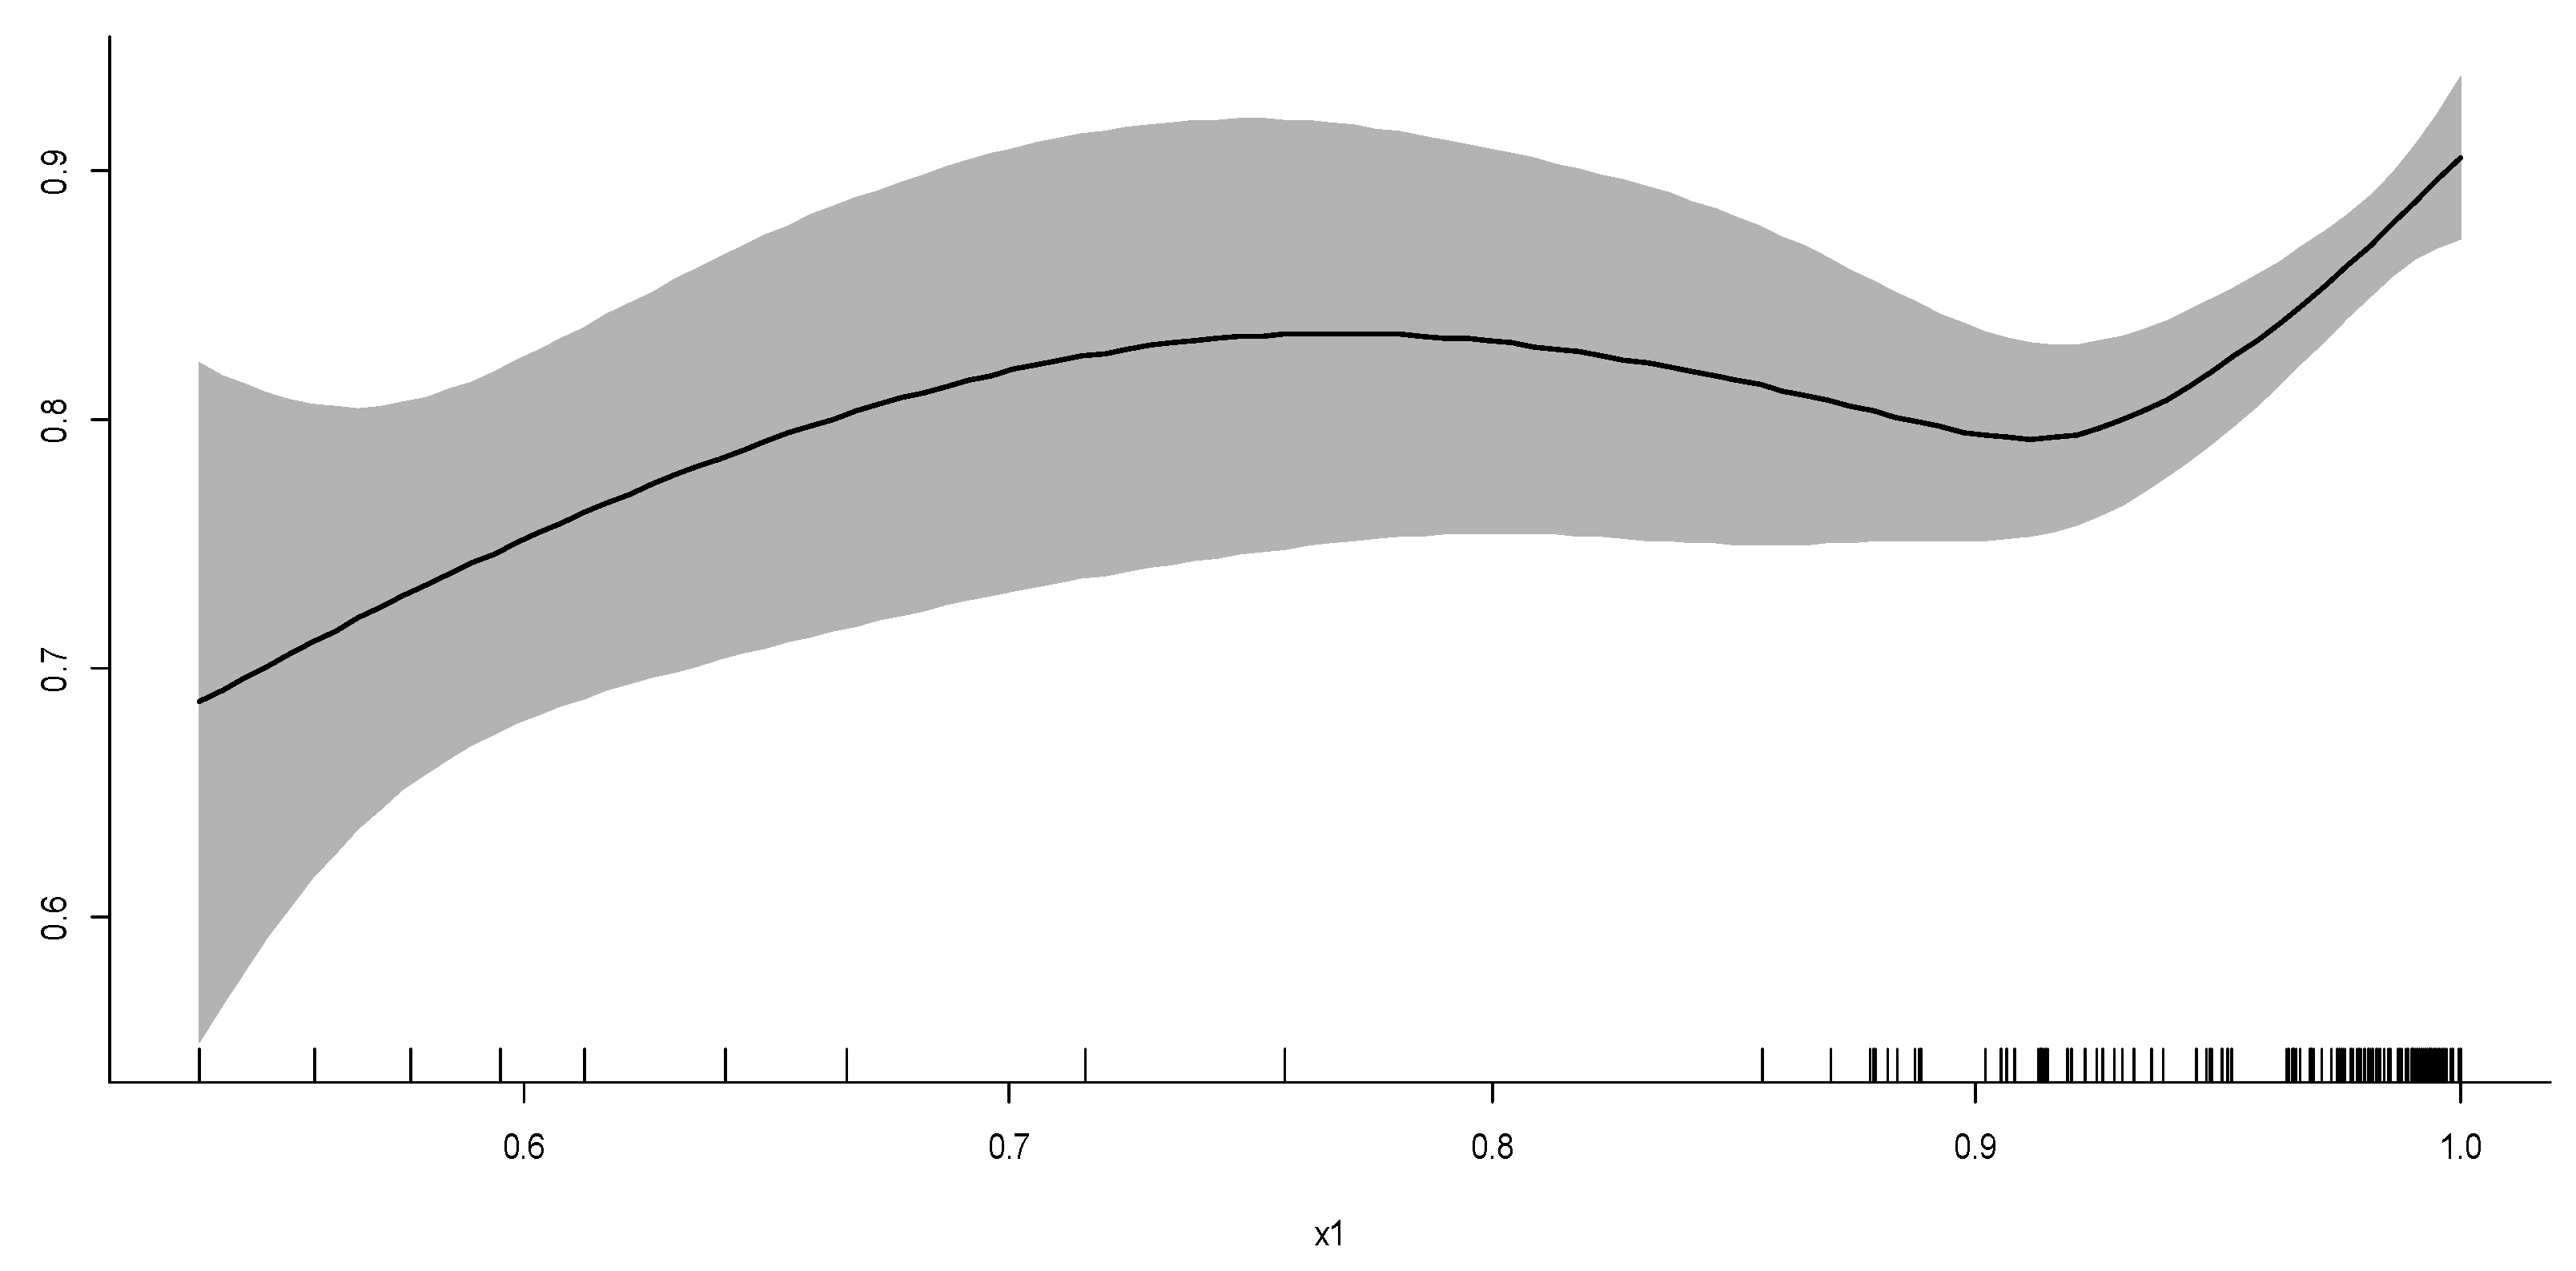
Figure 5 elaborates an increasing relationship between the effect of environment-related rules and environment-related efficiency of the construction industry, and the effect of environment-related rules of the construction industry has a certain impact on the environment-related efficiency enhancements.
Figure 4 presents that the relationships of the effect of environment-related rules and environment-related efficiency of power, heat, gas and water production and supply industries exhibit a N-shaped curve, i.e., with the rise in the effect of environment-related rule, environment-related efficiency is first up-regulated and subsequently down-regulated, and then it shows a rise. Accordingly, the government should adopt different policies for different industries, rationally use environment-related rule policies, and realize the optimal development of industry economy and environment.
Now, the environment-related efficiency is divided into two parts: the technical gap of environment-related efficiency and the potential of environment-related efficiency enhancements. Subsequently, the two parts and the effect of environment-related rules are econometrically measured and analyzed, respectively.
Table 7 lists the evaluated results of the self-adaptive semi-parametric panel model for the whole sample and the technological gap of environment-related efficiency in a range of industries. This shows the impact of technological progress on the technological gap of environment-related efficiency is positive, demonstrating that technological progress is conducive to the expansion of the technological gap of environment-related efficiency; the FDI dependency of the broader national industry, manufacturing and power, heat, water production and supply industries can obviously broaden the technological gap of environment-related efficiency; mining and construction industries can broaden the technological gap of environment-related efficiency. The FDI dependency of industries can effectively narrow the technological gap of environment-related efficiency. The industrial profit margin can obviously broaden the technological gap of environment-related efficiency; the capital labor structure of the broader national industry, manufacturing industry and power, heat, water production and supply industry can obviously broaden the technological gap of environment-related efficiency; the capital labor structure of the manufacturing industry and the construction industry can effectively narrow the technological gap of environment-related efficiency. The effect of the market concentration on the technological gap of environment-related efficiency is negative, only the market concentration degree of mining industry can effectively narrow the technological gap of environment-related efficiency; the nationalization rate of the four major industries can obviously broaden the technological gap of environment-related efficiency, whereas the effect of the market concentration degree of the broader national industry on the technological gap of environment-related efficiency is positive.
Fitting graphs of the technical gap between effect of environment-related rules and environment-related efficiency of the broader national industry are presented in
Figure 6; the fitting graph of the technical gap between the effect of environment-related rules and the environment-related efficiency of the mining industry is presented in
Figure 7; the fitting graph of the technical gap between the effect of environment-related rules and the environment-related efficiency of the manufacturing industry is presented in
Figure 8; the fitting graph of the technical gap between the effect of environment-related rules and environment-related efficiency in power, heat, gas and water production and supply industries is presented in
Figure 9; the fitting graphs between the effect of environment-related rules and the technical gap of environment-related efficiency in the construction industry is presented in
Figure 10. From
Figure 6 to
Figure 10, there is an upward relationship between the effect of environment-related rules and the technical gap of environment-related efficiency in the broader national industry. The relationships of the effect of environment-related rules and the technical gap of environment-related efficiency in the mining industry comply with a U-shaped curve, and the relationships of the two are basically upward in the mining sample data. A decreasing relationship was identified between the effect of environment-related rules and environment-related efficiency technology gap in the mining industry. The production and supply of electricity, heat, gas and water and the technical gap between the effect of environment-related rules and environment-related efficiency in the construction industry are all increasing.
The evaluated results of the self-adaptive semi-parametric panel model for the whole sample and the potential environment-related efficiency enhancements in various industries are listed in
Table 8. As can be seen from
Table 8, the technological progress of the broader national industry, mining and manufacturing industries can elevate the potential of environment-related efficiency enhancements, while the production and supply of electricity, heat, gas and water and construction industries have a negative impact on the potential of environment-related efficiency enhancements; the FDI dependency of the broader national industry, the production and supply of electricity, heat and water and the construction industry adversely affect the potential of environment-related efficiency enhancements; the FDI dependence of the mining industry and manufacturing industry can elevate the potential of environment-related efficiency enhancements; industrial profit margin adversely affects the potential of environment-related efficiency enhancements, and only the industrial profit margin of mining industry can boost the potential of environment-related efficiency enhancements; capital and labor structure boosts the potential of environment-related efficiency enhancements; market concentration adversely affects the potential of environment-related efficiency enhancements; the nationalization rate of the broader national industry, mining industry and manufacturing industry adversely affects the potential of environment-related efficiency enhancements. The impacts of the nationalization rate of electricity, heat, gas and water production and the supply industries and construction industries on the potential of environment-related efficiency enhancements is positive.
Fitting graph of the relationship between the effect of environment-related rules and the potential of environment-related efficiency enhancements of the broader national industry is presented in
Figure 11; the fitting graph of the relationship between the effect of environment-related rules and the potential of environment-related efficiency enhancements of the mining industry is presented in
Figure 12; the fitting graph of the relationship between the effect of environment-related rules and the potential of environment-related efficiency enhancements is given in
Figure 13; the fitting graph of the relationship between the effect of environment-related rules and the potential of environment-related efficiency enhancements of power, heat, gas and water production and supply industries is given in
Figure 14; the fitting graph of the relationship between the effect of environment-related rules and the potential of environment-related efficiency enhancements in the construction industry is given in
Figure 15.
Figure 11,
Figure 12,
Figure 13,
Figure 14 and
Figure 15 show that there is a W-shaped curve relationship between the effect of environment-related rules and the potential of environment-related efficiency enhancements in the broader national industry. However, considering the four industries of mining, manufacturing, electricity, heat, gas and water production and supply—and construction separately—the relationships between the effect of environment-related rules and the potential of environment-related efficiency enhancements are decreasing. As fueled by the optimization of the effect of environment-related rule, the potential of environment-related efficiency enhancements in the manufacturing industry largely decreases, while the potential of environment-related efficiency enhancements in power, heat, gas and water production and supply industries decreases slightly.
8. Conclusions
This study used the adaptive semi-parametric panel model to estimate the results and divided them into five dimensions: the broader national industry; mining; manufacturing; power, heat, gas and water production and supply industry; and the construction industry, to analyze how the effect of environment-related rules affects environment-related efficiency. The following conclusions were drawn: (1) The relationships between the effect of environment-related rules and environment-related efficiency of the broader national industry comply with a U-shaped curve; the relationships between effect of environment-related rules and environment-related efficiency of mining industry and manufacturing industry are flat; the relationships between the effect of environment-related rules and environment-related efficiency of power, heat, gas and water production and supply industry comply with an N-shaped curve. The relationships of the effect of environment-related rules and environment-related efficiency of the construction industry are rising; (2) An upward relationship was identified between the effect of environment-related rules and the technical gap of environment-related efficiency in the broader national industry, and a U-shaped curve relationship between the effect of environment-related rules and the technical gap of environment-related efficiency in the mining industry. The relationships of the two are basically an upward one in the mining sample data; the technical gap between the effect of environment-related rules and environment-related efficiency in the mining industry. A downward relationship was identified between them, while an upward relationship was revealed between the effect of environment-related rules and the technical gap of environment-related efficiency between the production and supply of electricity, heat, gas and water and the construction industry; (3) A W-shaped curve relationship was identified between the effect of environment-related rules and the potential of environment-related efficiency enhancements in the broader national industry, whereas the four industries of mining, manufacturing, power, heat, gas and water production and supply, and construction are separated. The relationships of the effect of environment-related rules and the potential of environment-related efficiency enhancements are declining. With the improvement of the effect of environment-related rule, the potential of environment-related efficiency enhancements in the manufacturing industry decreases the most, while the potential of environment-related efficiency enhancements in the power, heat, gas and water production and supply industries decreases less; (4) The government is required to apply different environment-related rule policies to different industries and their different stages of development, fully exploit such environment-related rule policies as industries and technologies, optimize the environment-related rule system, and achieve the coordinated development of industry economy and environment. From the empirical results, it is critical to enhance the effect of environment-related rules in the mining and manufacturing industries, elevate their technical level, and make the effect of environment-related rules have a positive relationship with the environment-related efficiency enhancements; (5) Environment-related rules exert a threshold effect on environment-related efficiency. When the effect of environment-related rules is lower than the optimal range, environment-related rule policies do not play their due role. When the effect of environment-related rules is higher than the optimal range, the effect of environment-related rules is too strong, thereby exceeding the extent that the industry can bear and distorts the development of the industry. According to the sample data, the optimal range of the effect of environment-related rules between pollution-intensive industries and cleaner production industries is relatively close, demonstrating that the existing environment-related rule policies do not differentiate between pollution-intensive industries and cleaner production industries, and future environment-related rule policies should differentiate between them.
Given the aforementioned conclusions, the following policy suggestions are proposed. (1) According to different industries and their different development stages, the government should implement different environment-related rule policies, comprehensively employ environment-related rule policies (e.g., industries and technologies), improve the environment-related rules system, and develop the industrial economy and environment in a coordinated manner. The empirical results suggest that it was particularly necessary to strengthen the environment-related rules’ intensity of mining and manufacturing industries and improve their technical level, enabling a positive relationship between the environment-related rules’ intensity and the improvement of environment-related efficiency. (2) For the environment-related policies, pollution-intensive industries and clean production industries should be treated differently, while the optimal range of environment-related rules in different industries should be considered as an attempt to ensure the steady improvement of the industrial production technologies.


