1. Introduction
Human mobility is often observed following natural disasters and extreme weather events such as hurricanes or drought. This movement can result in adverse health outcomes for the displaced and for populations in both the sending and receiving communities [
1,
2]. Further, mobility may put significant strain on infrastructure, natural resources, and international politics [
1]. An increasing number of empirical studies have examined this relationship. Much of this work focuses either on single extreme events such as Hurricane Katrina or Hurricane Sandy in the United States [
3,
4] or on the association between changes in weather (e.g., temperature and precipitation) and changes in migration patterns [
5,
6,
7,
8]. However, little research has specifically examined individual-level differences between those who move after environmental exposures and those who do not move.
These individual-level differences may inform our understanding of who is most likely to relocate because of environmental disruptions, and which populations are most in need of public services. This has important policy implications for disasters in the present day and also the future, as climate change has the potential to cause major environmental degradation and the movement of millions of people over the next century. There is no clear consensus regarding how many people are at risk, with estimates ranging between 10 and 300 million by 2050 [
9]. However, the uncertainty of these estimates restricts their utility, as does the limitation that single estimates are unable to encompass heterogeneity among movers. In order to develop successful policies to alleviate the potential impact of this mobility, scientific evidence is needed on the different types of people who move following environmental disruptions, where they move to and from, and how the environment interacts with other drivers of mobility [
9].
Indonesia is an important case study for environmental mobility. It is the fourth most populous country in the world and has a long history of internal mobility. Pre-colonial mobility was centered on migration to cities in the inland kingdoms of central Java and the smaller, coastal kingdoms in Java and Sumatra [
10]. By 1930, while Indonesia was under Dutch rule, at least 11.5% of the population reported living outside of their district of birth, representing around 3.3 million internal migrants (this number roughly doubled by 2000) [
11]. Mobility during the colonial era was largely associated with exploitation of laborers as Javanese workers were recruited to farm Dutch plantations on the less populated Outer Islands [
10]. In the early 20th century, this outward mobility was compounded by Dutch policy to incentivize movement away from the heavily populated island of Java to the Outer Islands [
11]. However, internal migration to Java continued as colonial activities centered on the island led to increased economic activity, largely in and around the capital city of Jakarta (formally Batavia) [
10]. Urbanization grew in the post-war era (after Indonesia gained independence), due in part to the high number of internally-displaced persons after the war [
10]. The population remains highly mobile today and urbanization continues rapidly [
12].
Relevant to this study, Indonesia also has a history of mobility specific to the environment. Sudden-onset disasters, including volcanic eruptions, have repeatedly resulted in the displacement of large swaths of the population (e.g., 85,000 people displaced by the 1963 eruption of Mt. Agung; 30,000 displaced by the 1982 eruption of Mt. Galunggung) [
10]. There is also evidence of circular migration strategies being employed to adapt to gradual environmental degradation: the Makianese people in eastern Indonesia, for example, have experienced soil degradation resulting from frequent volcanic eruptions and have utilized mobility as an adaptive strategy for centuries [
13]. This environmental mobility continues today as landslides, tsunamis, and earthquakes regularly displace populations across the archipelago [
14]. Major displacements in recent history occurred in 2004 following the Indian Ocean earthquake and tsunami (resulting in more than 500,000 displaced persons in Indonesia), and in 2018 following the earthquake in Lombok (resulting in 445,000 displaced persons in Indonesia) [
14].
This study builds on previous studies of environmental mobility in Indonesia [
7,
15]. Existing work has focused on understanding the association between migration and changes in environmental factors (including rainfall and temperature) [
7,
15]. Bohra-Mishra et al. [
15] investigated the impact of climactic factors on household-level permeant mobility in Indonesia, while Thiede and Gray [
7] assessed individual-level mobility and also considered how associations varied across sociodemographic characteristics. In contrast to these high-level approaches, this paper contributes to the understanding of environmental migration by using self-reported data (i.e., data in which the movers themselves specify the reason for the move) and employing methodologies to explore individual-level heterogeneities comparing environmental movers to non-movers.
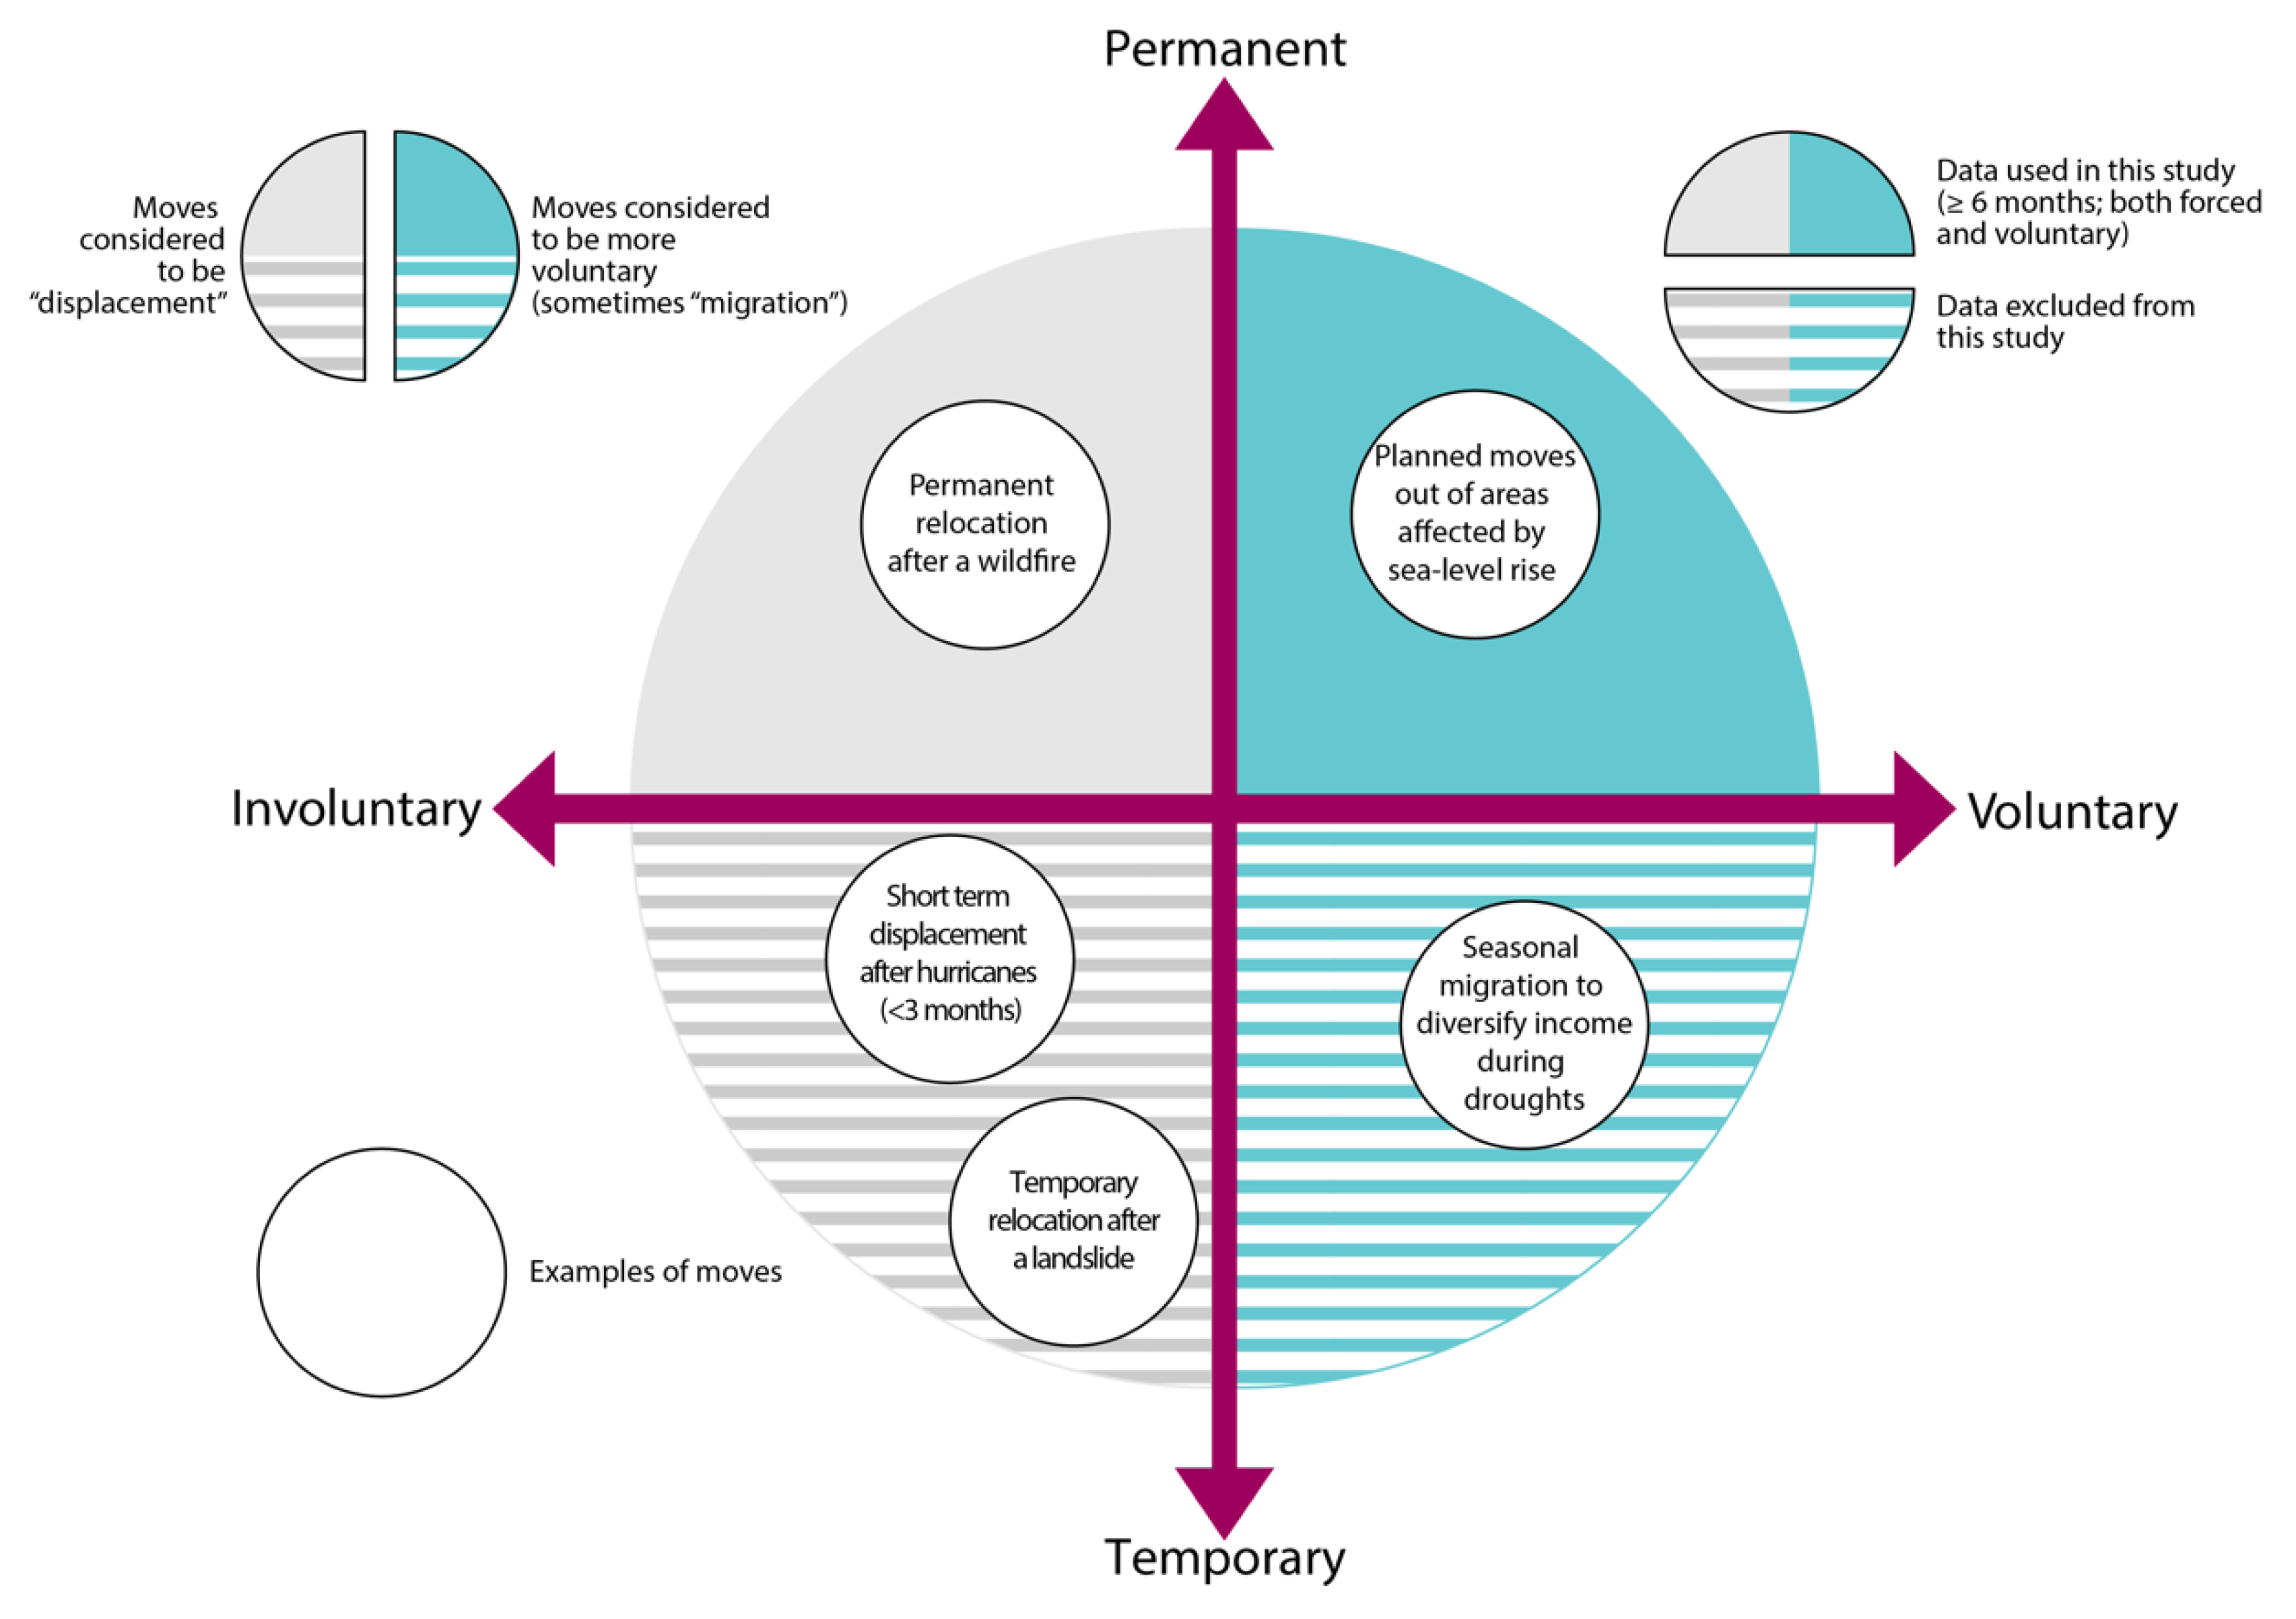
In this study, we first describe the theoretical background for the project by presenting a conceptual framing for understanding both heterogeneities across different types of relocations (migrations vs. displacements) and across different groups of environmental movers. We then use household-level survey data from the Indonesian Family Life Survey (IFLS) to investigate differences in demographics and socioeconomic status (SES) between those who did and those who did not relocate after an environmental exposure. Throughout this paper we use the phrases “environmental exposure” or “environmental disruption” to refer to any changes to an ecosystem (including biological, physical, or chemical) that render it unsuitable to support human life (either temporarily or permanently) [
16]. This definition encompasses both sudden- and slow-onset environmental disasters (e.g., tropical cyclones and sea-level rise, respectively).
We hypothesized that those who move due to environmental disruptions have different sociodemographic characteristics from those who stay in place. Innovative aspects of this study include the use of self-reported reasons for migration, which allows us to directly evaluate moves made for environmental reasons based on the movers’ own perceptions of the reason for their move, and the application of a novel case-control approach that matches environmental movers to non-movers based on location and date. This epidemiological method allowed us to compare those who moved because of an environmental disruption to those who likely experienced the same event but did not move. Matching also has the advantage of helping to control for unmeasured confounders and to improve statistical efficiency [
17,
18].
3. Materials and Methods
3.1. The Indonesian Family Life Survey
In this project, we used data from the IFLS, an on-going longitudinal survey that was conducted five times (referred to as five “waves”) between 1993 and 2018 by the RAND Corporation. The IFLS was designed to be a multipurpose survey and since the first round of data collection has included household- and community-level information about demographics, health, and economics [
32]. Accordingly, a wide range of researchers have used IFLS data since the mid-1990s to assess nutrition and food security [
33,
34,
35], economic status and development [
36,
37,
38], health and healthcare [
39,
40,
41], and education [
42], among others. The survey is divided into “books” that are subdivided into modules. For this study we focused on Book 3A, which contains individual-level data for adult respondents, including demographic factors and SES, as well as health status of respondents. Importantly for our purposes, the IFLS also asked detailed questions about mobility. This project focused on IFLS4 (conducted in 2007/2008) and IFLS5 (conducted in 2014/2015) [
43,
44]. In IFLS4, Book 3A was completed (in part or in full) by 29,059 interviewees and in IFLS5, Book 3A was completed (in part or in full) by 34,458 interviewees. Between both IFLS4 and IFLS5, this resulted in 40,636 adults who responded to Book 3A. IFLS4 and IFLS5 were selected because they asked the question: “What was the main purpose/reason for your move to (DESTINATION)?” (“Apa maksud/alasan utama Ibu/Bapak/sdr pindah ke (TEMPAT TUJUAN)?”) and allowed the same set of responses for both waves [
43]. Throughout this paper, we use the translation “reason for move” to be consistent with previous literature [
45]. Earlier IFLS waves also asked about the reason for a respondent’s move, but differences in the allowed responses reduce comparability of this specific question across waves. Because of this, we restricted our analysis to pooled cross-sectional data from IFLS4 and IFLS5.
We used variables for: the date of move, location (province and regency of origin and destination; or province and regency of residence for non-movers), demographics (sex and age based on date of birth), marital status, and level of education. Age, marital status, and education level are time-varying covariates and were calculated at the time of the move for movers and at the time of the matched-pair move for non-movers (the matching procedure is detailed in
Section 3.3).
The use of IFLS data is an important strength of this study because sample selection is a common challenge for research focused on mobile populations. A number of studies have sampled displaced persons following climate- and weather-related disasters; however, these may be extreme cases that are not necessarily representative of the scope of environmental moves [
46]. In contrast, the IFLS is representative of ~83% of Indonesia and thus our study included some environmental moves that were not associated with major natural disasters. Another approach used by other studies is to sample sending communities; however, this may miss entire households that have relocated [
47]. By using IFLS data, our study was not restricted to sending communities and we were able to capture whole households that had relocated. Finally, we were able to include non-movers and non-environmental moves as a comparison groups in our analyses.
3.2. Inclusion Criteria
Our primary hypothesis was that demographic characteristics are associated with whether an individual moved for environmental purposes or did not move at all. The unit of analysis was individuals (within households). We began by identifying individuals interviewed in IFLS4 and IFLS5 who had complete data for demographic variables (age, sex, marital status, and level of education), and for province, regency, or district of residency. We next excluded those in marriages with multiple wives (<1% of study participants), as well as those who had been married more than once (<1%) because we did not have complete information about when each marriage started and ended. We also removed records that did not have full end dates for marriages, which may have skewed our sample towards those who are still married or who were never married. However, prior to this exclusion, <5% of respondents were separated or divorced. Education status was coded based on years of education (<12, 12, or >12). This cutoff was selected because 12 years of education marks the end of senior secondary school for both secular and religious schools in Indonesia (after which some students would continue on to higher education) and reflects the current level of compulsory education [
48]. We also removed those who reported in IFLS5 that they had not moved since IFLS4 but who had different places of residency between the two waves, as these were considered errors.
We identified “non-movers” as participants who reported not moving, either since their last interview (if they participated in earlier IFLS waves) or since age 12 if they were a new interviewee. The result was 19,519 non-movers with complete data meeting the inclusion criteria. These are treated as “controls.” We identified “environmental movers” as the subset of movers who reported ever moving for environmental reasons in their migration histories. Moves made for environmental reasons (“environmental moves”) included those with a main purpose identified as either “dry season/drought” or “natural and other disasters” (excluding social conflict). Finally, for environmental movers, we applied an additional exclusion criterion to remove records with missing values for date of move (month and year). The result was 42 environmental movers (“cases”) that met the inclusion criteria. These 42 movers were unique adults from different households. Of these respondents, 38.1% moved because of floods, 33.3% because of tsunamis, 11.9% because of dry season/droughts, 11.9% because of unspecified environmental reasons, and 4.8% because of landslides.
3.3. Analyses
We matched environmental movers (cases) to non-movers (controls) who lived in the same district, regency, and province in the same month and year. This approach allowed us to match on the environmental exposure, assuming that if a case and control live in the same location at the same time, and a case experienced an environmental disruption, the control was also exposed (i.e., experienced the environmental disruption). For example, a case who moved from the Banuhampu district in the Agam regency in West Sumatra due to a drought in May 2008 would be matched to all non-movers who were residing in Banuhampu in 2008. This matching procedure helps control for potential unmeasured confounders related to place of residence, such as severity of exposure. One limitation of this approach is that matching and the assumption of exposure to the event might be more effective for larger-scale events such as droughts or floods than for more localized events such as landslides. The majority of environmental movers in our dataset moved because of flooding, tsunamis, or drought/dry season (83.3%), which are often non-localized and may cover the district-level scale.
We then randomly selected two controls per case from the possible matched controls, and identified demographic characteristics at the time of the environmental move (e.g., level of education for both the case and controls in the month and year of the environmental disruption). This resulted in 84 controls, each matched 2:1 to a case. Finally, we used a conditional logistic regression on the matched pairs to model whether demographic characteristics were associated with whether an individual moved for environmental purposes, while controlling for other demographic characteristics as covariates.
4. Results
We calculated the demographic characteristics of environmental movers and their matched controls (
Table 1). The level of education differed significantly between environmental movers and non-movers, but age, marital status, and sex did not. Overall, environmental movers were more educated than their matched non-moving counterparts.
We then used a conditional logistic regression to model whether demographic characteristics were associated with whether an individual, when exposed to an environmental disruption, would relocate for these environmental reasons or would not relocate, controlling for other demographic characteristics as covariates and for place and time through matching. These results are presented in
Table 2.
These findings show that individuals with 12 years of education at the time of an environmental disruption were 3.93 (95% confidence interval (CI): 1.38, 11.20) times more likely to move for environmental reasons than those with <12 years of education. In contrast, we found that sex, age and marital status were not associated with whether or not an individual moved when exposed to an environmental disruption. Those in the highest education category (>12 years) were not statistically different from the other education groups (<12 or 12 years) in terms of their likelihood of moving, but the central estimate was most similar to those with low education (<12).
Next, we performed a sensitivity analysis in which we selected one instead of two random controls for each case. Results were consistent with the findings from our main analysis of
Table 2. Only level of education, 12 years versus <12 years, was identified as having a statistically significant association with whether a participant moved for environmental reasons or did not move. Using the 1:1 case to control ratio, individuals with 12 years of education were 5.77 (1.37, 24.32) times more likely to move for environmental reasons than those with <12 years of education (
Table 3).
Due to data limitations, we are unable to evaluate directly whether individuals were
exposed to specific environmental disruptions. Therefore, the primary assumption used in this analysis is that if one person reported moving for an environmental reason in a given location (case), then a different person also living in that location at the same time (control) was also exposed to the same event. For this assumption to be true, environmental disruptions had to be large enough (i.e., non-localized) to have impacted more than the individual person who reported moving. We tested this assumption using government records to cross-validate the environmental exposures. If an environmental disruption was reported by only one person, and the same type of event was not recorded in the Badan Nasional Penanggulangan Bencana (National Board for Disaster Management, BNPB) database during the same year and season, the disaster might have been hyper-local, suggesting a violation of our assumption that other people in the same location and time period were exposed [
49]. As an additional sensitivity analyses, we created a new dataset that excluded all un-validated entries. We also excluded records that did not report the specific type of environmental exposure as we were unable to validate these events. The resulting dataset had 30 environmental movers, as compared to the 42 in the original dataset. We then followed the same procedure for matching and data analysis using this reduced dataset. Again, only level of education, 12 years versus <12 years, was statistically different between environmental movers and non-movers. Those who moved for environmental reasons were 3.35 (1.06, 10.54) times more likely to have 12 years of schooling than those who did not move (
Table 3). Thus, results from this cross-validated dataset were broadly consistent with the main results.
5. Discussion
While we know that the environment affects mobility, far less is known regarding which groups within a population will be likely to move due to environmental disruptions [
50]. Our study addressed this gap by exploring which demographic characteristics were associated with whether an individual moved for environmental reasons. We found that individuals with more education (12 years vs. <12 years) at the time of an environmental disruption were more likely to move, although those with the highest education (>12 years) did not move more often than the other two groups, and their likelihood of moving was most similar to those with <12 years education. Education is commonly used as an approximation for SES [
51] and using this proxy, our findings support the hypothesis that environmental mobility may follow an inverted U-shape in relation to SES [
51]. In this conceptual framework, those with the lowest SES are less likely to move because of the high cost associated with relocation and those with the highest SES are less likely to move because they have the capacity to adapt in-situ [
52]. Therefore, those in the middle SES brackets are most likely to move because they may be able to afford to relocate, but may not have access to sufficient capital to adapt in ways that would allow them to stay [
52].
This reflects the concept that lower SES communities may be “trapped” and unable to move, potentially due to a lack of resources [
8]. These findings are consistent with those of other studies: following drought in Kenya, for example, the poorest herders were unable to relocate, while middle-income residents were able to move away temporarily, and the richest households did not need to relocate [
31]. However, as noted in
Section 2.2, other studies in different locations have found no differences in environmental mobility between high- and low-income households [
27] Therefore, while this paper adds empirical evidence to the literature on trapped populations, it also indicates the need for continued research to better understand who leaves and who stays behind after environmental disruptions.
These findings are also important in the context of environmental justice. The most vulnerable groups, often lower SES communities or communities of color, may live in the areas that are most exposed to extreme environmental disruptions [
53]. If these individuals are less likely to relocate after environmental exposures (as is indicated by our findings), the effects of environmental disruptions will not be felt uniformly across the population, with the highest burden placed on the already vulnerable (i.e., those unable to move and left in the wake of the disaster). In this way, we can view environmentally-driven mobility as an issue of environmental justice, both in terms of which groups are exposed to disasters and thus are faced with a possible need to relocate, and which subgroups among the exposed lack the resources to move away from disaster-prone areas.
In contrast with other studies, we did not find differences in environmental-mobility by age or sex. These findings may again reflect the place-specific nature of environmental-mobility. In some cases, for example, women may be more likely to remain in place after environmental disruptions [
8]. For example, Mueller et al. [
6] found that men in rural Pakistan appeared to be more likely to respond to heat stress through migration than women. In other contexts, environmental disruptions appear to drive women’s migration either via impacts on environmental resources that women are traditionally responsible for [
26], or through increases in marriage-related moves in times of economic distress [
5]. Contributing to this contradicting body of literature, we found that the odds of environmental moves were slightly higher for females compared to males (though not significantly different). Given the range of ways in which the environment affects sex-specific mobility, it is likely that we would need to disaggregate the dataset by environmental disruption in order to fully understand this relationship. This was not possible for this study due to data limitations and warrants further investigation.
A primary limitation of this study is its small sample size: out of 21,282 moves with complete data, 65 moves were attributed to environmental reasons (and 42 of those 65 had matched pairs of non-movers who experienced the environmental event). This may be surprising given the degree to which Indonesia experiences environmental disruptions, as well as historical instances of environmental mobility. One explanation for the small number of environmental moves is that temporary (short-term and circular) moves would not have been captured in this study [
13]. A second explanation is that as moves are often the result of a combination of factors and these factors can be interrelated, it is possible that many environmental moves were not viewed by the respondent as having a primary environmental cause. This may be more likely in situations of slow-onset disasters, such as drought, in which the respondent may have felt that other drivers (e.g., economic) were more significant to their move (even if environmental causes played a role). In such cases a move would not be captured as environmental because survey respondents were permitted to select only one cause of the move. Thus, our findings may not be generalizable to temporary environmental moves, or moves in which the environment was a distal cause of mobility. The small sample size also increases the risk of a Type II error and the possibility that age, sex or marital status may have been associated with relocation after environmental exposures in a larger data set, but the null hypothesis was not rejected in this study. Future work should include larger sample sizes of self-reported movers.
An additional limitation of this project is that, because the IFLS was not intended to collect data on environmental disruptions, we were unable to assess housing damage or personal injury, which may be associated with relocation after disasters [
46]. Future studies should continue to utilize self-report as a way to identify whether moves are environmentally driven and capture the perceptions of the movers themselves. When possible, surveys should be expanded to allow respondents to identify multiple reasons for their move (and perhaps rank order their choices), which would better reflect how migration decisions are made as a function of multiple factors. Surveys should also include more details on the environmental-drivers, including whether movers sustained housing damage or personal injury following environmental exposures.
Despite these limitations, this research provides important insight into who is most likely to relocate after environmental disruptions, contributing to our understanding of a highly important group and opening new directions for future research. The use of national-level IFLS data allowed us to capture a range of different environmental disruptions, which may be more representative of the majority of environmental movers in Indonesia, compared to those who were displaced after extreme climate- and weather-related disasters as are typically investigated in earlier studies that focused on a single severe event. To the best of our knowledge, this is among the first studies to use self-reported reasons for moves to examine who is most likely to relocate after environmental exposures (allowing participants to select the environment from a list of possible reasons for relocation). This marks a methodological contribution that improves on earlier efforts and can inform future research approaches. While the results of this study may not be generalizable outside of environmental movers in Indonesia, our methodology could be applied in different contexts in future studies. Lastly, though our sample size was limited, the robustness of our findings was supported by two sensitivity analyses, which yielded consistent results. The findings presented here support the need for further research to better understand the complexities of environmental mobility and immobility. While the potential for trapped populations has been discussed at length in conceptual (and increasingly in empirical) literature, there remains a need to assess the pathways through which a group or subgroup might become immobile [
28]. This work should focus on identifying at-risk populations who may need additional support after exposure to climate- and weather-related disasters, using intersectional and systems thinking approaches to understand the ways in which vulnerability (and resiliency) operate at both individual and structural levels. This could help us better understand whether persons have the ability (via economic, social, or other resources) to choose to stay in a place and adapt or if they are trapped in a place and would want to leave if they had the opportunity.


