Article

Sustainable Streetscape and Built Environment Designs around BRT Stations: A Stated Choice Experiment Using 3D Visualizations

1
Department of Architecture, Katholieke Universiteit Leuven, 3001 Leuven, Belgium
2
Instituut Voor Mobiliteit, Universiteit Hasselt, 3590 Diepenbeek, Belgium
*
Author to whom correspondence should be addressed.
Sustainability 2021, 13(12), 6594; https://0-doi-org.brum.beds.ac.uk/10.3390/su13126594
Submission received: 30 April 2021 / Revised: 1 June 2021 / Accepted: 7 June 2021 / Published: 9 June 2021
(This article belongs to the Special Issue Healthy Urban Design)

Abstract

:
The incompatibility between the microscale-built environment designs around mass transit stations and stakeholders’ preferences causes dissatisfaction and inconvenience. The lack of a pedestrian-friendly environment, uncontrolled development patterns, traffic and parking issues make the street life vulnerable and unattractive for users, and affect the mass transit usage. How to design the streetscapes around mass transit stations to provide a user-friendly street environment is a crucial question to achieve sustainable transit-oriented development goals. To recognize the specific attributes of streetscape environment relevant in local context of BRT Lahore, this paper presents the results of a visual preference experiment in which nine attributes of built environment were systematically varied across choice sets. Multinomial logit models were set up to identify the preferences of three target groups: BRT users, commercial building users and residents at different locations. The research indicates that not only the road-related factors (bike lane and sidewalk widths, crossings facilities, street greenery) have a significant influence on people’s preference but also that building heights, and the typology of buildings and housing projects around BRT corridor have shaped these preferences. When planning and designing urban design projects around mass transit projects, these significant attributes should be considered.

1. Introduction

During the last decade, state-of-the-art mass transit systems have been developed in Pakistan in the form of Bus Rapid Transit (BRT) systems in order to provide efficient means of transportation. During the planning and development of these projects, micro-level environment designs on the scale of the streetscape have not gained much consideration. While making huge investments in the transport infrastructure, no attention has been given to the streetscape features and principles of Transit-Oriented Development. TOD is a core strategy for the effective integration of transport infrastructure and surrounding urban fabric in order to create livable, walkable, accessible, cyclable and mixed-use compact neighborhoods with a great mix of people of different social backgrounds, promoting sustainable urban development with economic, social and cultural efficacy [1,2]. TOD is a term which summarizes the process of focusing employment, housing, public services and activity sites around high-quality and efficient public transport service [3,4]. The concept of TOD is mainly branded by the two main features: (1) a functional relationship with, and proximity to, the transit terminals and service provision through high-quality mass transit systems; (2) compact developments and mixed-use neighborhoods and buildings that, because of their attractive urban design features, inspire cycling and walking and use of public transit service by shoppers, residents, visitors and employees [5]. However, we argue that there is a need to shift the focus from a ‘one-size-fits-all’ TOD to a locally embedded sustainable conception of TOD, where stakeholders around transit stations can define optimal streetscapes, density, land use mix and transit system functions according to the local requirements.
In the high-density urban setting of Lahore, the poor condition of streetscapes has made transit stations hard to reach. Moreover, pedestrians and cyclists are sharing the same road space [6,7] creating unsafe situations for the road users. Furthermore, key infrastructures such as parking facilities, crossing facilities, street greenery, sidewalks are either poorly designed or absent around metro stations. Similarly, no attention has been given to connecting the infrastructure to the surrounding urban fabric of metro stations. Lack of pedestrian-friendly environment, poor connectivity, parking issues, and the absence of specialized zoning plans are barricades to sustainable transit-oriented development. A well-planned and executed streetscape design in the mass transit projects leverages sustainable TOD and brings together diverse users and functions, whereas poor urban design implementation can wind up with no positive change in the urban environment and perhaps even a detriment to the surroundings of transit stations. There are many cities in the developed world where transport infrastructure investments have been smartly used to create user-friendly streetscape and built environment designs and these investments had a very positive impact on the surrounding urban fabric in case of Copenhagen [8], Stockholm, Hong Kong SAR [9], Seoul [10], Madrid [11] and Washington DC metropolitan area. There are many design, planning, institutional and financial approaches that are used to foster sustainable transit-oriented development in these cities. In case of developing countries, BRT system in Curitiba is the best example, whereby proper consideration has been given to the streetscape-built environment designs around BRT stations and TOD zoning plans have been formulated. The primary design element that is being used in Curitiba is the trinary parallel roadways with compatible buildings heights and land uses. Building height reduces as the distance from the BRT corridor is increased. Urban design and zoning ordinance promote the pedestrians and transit ridership productivity [5].
To create user-friendly streetscape designs on a micro scale around BRT stations for sustainable TOD, an understanding of the neighboring building and BRT users’ preferences is critically relevant. There are many studies where the relationship between the street features and users’ behavior has been explored at various spatial scales [12,13,14,15,16,17], as well as studies where the relationship between streetscape-built environment features and transport infrastructures have been discussed [18,19,20]. However, less attention has been given to the users’ perspectives and preferences about planning and designing of microscale streetscape environment for sustainable transit-oriented development around transit stations. There is still a dearth of studies in which multiple stakeholders’ perspectives and preferences about street-level infrastructure designs have been studied quantitatively in relation to the principles of TOD. To facilitate the focused research on the design of urban streetscapes, more specifically in the spaces around transit stations, more knowledge is needed on the small-scale streetscape elements from the perspective of various stakeholders (commercial building users, residents and BRT users). Multiple stakeholders can answer various questions, for example on what kind of streetscape features, densities and mixture of land use patterns support the locational efficiency under specific character of the transit station, which are crucial to a successful implementation of TOD policies. For instance, the increase of densities without considering the sustainable urban design and streetscape features may have the potential to increase the transit ridership, but at the same time it can degrade the quality of living and social equity [21,22]. Moreover, studies of this nature are mostly focused on developed countries where the nature of built environment and culture is different and, therefore, their results cannot be generalized for the developing world.
In this research, 3D visualizations for the streetscape-built environment are used to quantify the preferences between different designs. To study the quantitative relationships between the attributes of streetscape-built environment and local users’ preferences, a discrete choice experiment is developed. This method aligns with participatory planning approaches that aim to expand community involvement in the planning and designing processes and hence foster the stronger recognition of sustainable planning objectives [23,24,25]. Many researchers have recognized that visual information enables the participatory planning process and in fact serves as a universal language for all the key stakeholders engaged in the planning process [26,27,28]. Computer-aided 3D models have been used in urban planning and design studies in the past decade and 3D visualizations have led to a substantial increase in the conception of design and planning information as compared to text-based information [29,30]. Therefore, one of the crucial aims of this research was to involve the local users actively in the process by showing them visual choice sets.
In the discrete choice experiments, the stated preference data are collected from the individuals who choose their most preferred option from a range of design alternatives [31,32]. Extracting the individual stated preference in the participatory planning process has an advantage as data do not get biased by the well-organized groups of stakeholders. The authors of [33] used the visualized stated preference approach to analyze the exasperation from visual and noise impact on landscape aesthetics in the wind parks of Switzerland. In [29], the virtual reality and text-only attributes offered in the choice experiment were compared, concluding that virtual reality models surpassed the text-only models. There are few studies in the developed world where the relationship between streetscape design attributes and user preferences has been explored and actual users were asked to rank or rate the existing and hypothetical streets [34,35,36,37]. Comprehensive analysis of existing literature confirms that the stated preference method can be effectively used to explore different streetscape design interventions and to prioritize the investment and maintenance decisions regarding the streetscape infrastructure [38].
In this paper, the presentation of our research is structured as follows: Section 2 discusses the design of the stated preference experiments and the data collection, after which Section 3 presents the results of the model estimation and focuses on a general discussion of the research results. Finally, Section 4 presents the conclusion and policy implications of this research.

2. Materials and Methods

2.1. Attributes

In order to explore the relationship between preference, configurations and elements of microscale streetscape built environment, we designed a stated preference experiment based upon the certain attributes of the streetscape. [18] describes the term streetscape as built and natural fabric of the street and it includes the street surface, buildings, pavements, as well as the fittings and fixtures that facilitates it use, from planting schemes to bus shelters.
For creating the streetscape designs, we selected two main types of streetscape elements that include spatial and non-spatial elements. Based upon conceptual considerations of local identities and the comprehensive literature review, we selected attributes of SC experiment. Before finalizing the attributes of the SC experiment, we had an open discussion with building users, road users and building owners about the state of the current streetscape and the problems they faced after the implementation of the mass transit project. Literature studies show that, for the planning and designing of microscale streetscapes, not only the street-related attributes (e.g., sidewalk width, presence of crossings, side walk presence, presence of traffic lights) but also the building types and heights and presence of street greenery have to be taken into account [39,40,41,42,43,44].
Based upon the discussions and conceptual considerations of local environment, we have also included few attributes in the SC experiment which are not widely discussed in the literature. For instance, we included one attribute related to the marked spaces for informal sellers, as locals believe that around many stations, presence of the informal sellers is an essential element of the street space. Relevant literature is listed in a column of Table 1. Finally, nine attributes and each with three levels were chosen to embody the microscale streetscape environment. All of these attributes are described in the Table 1.

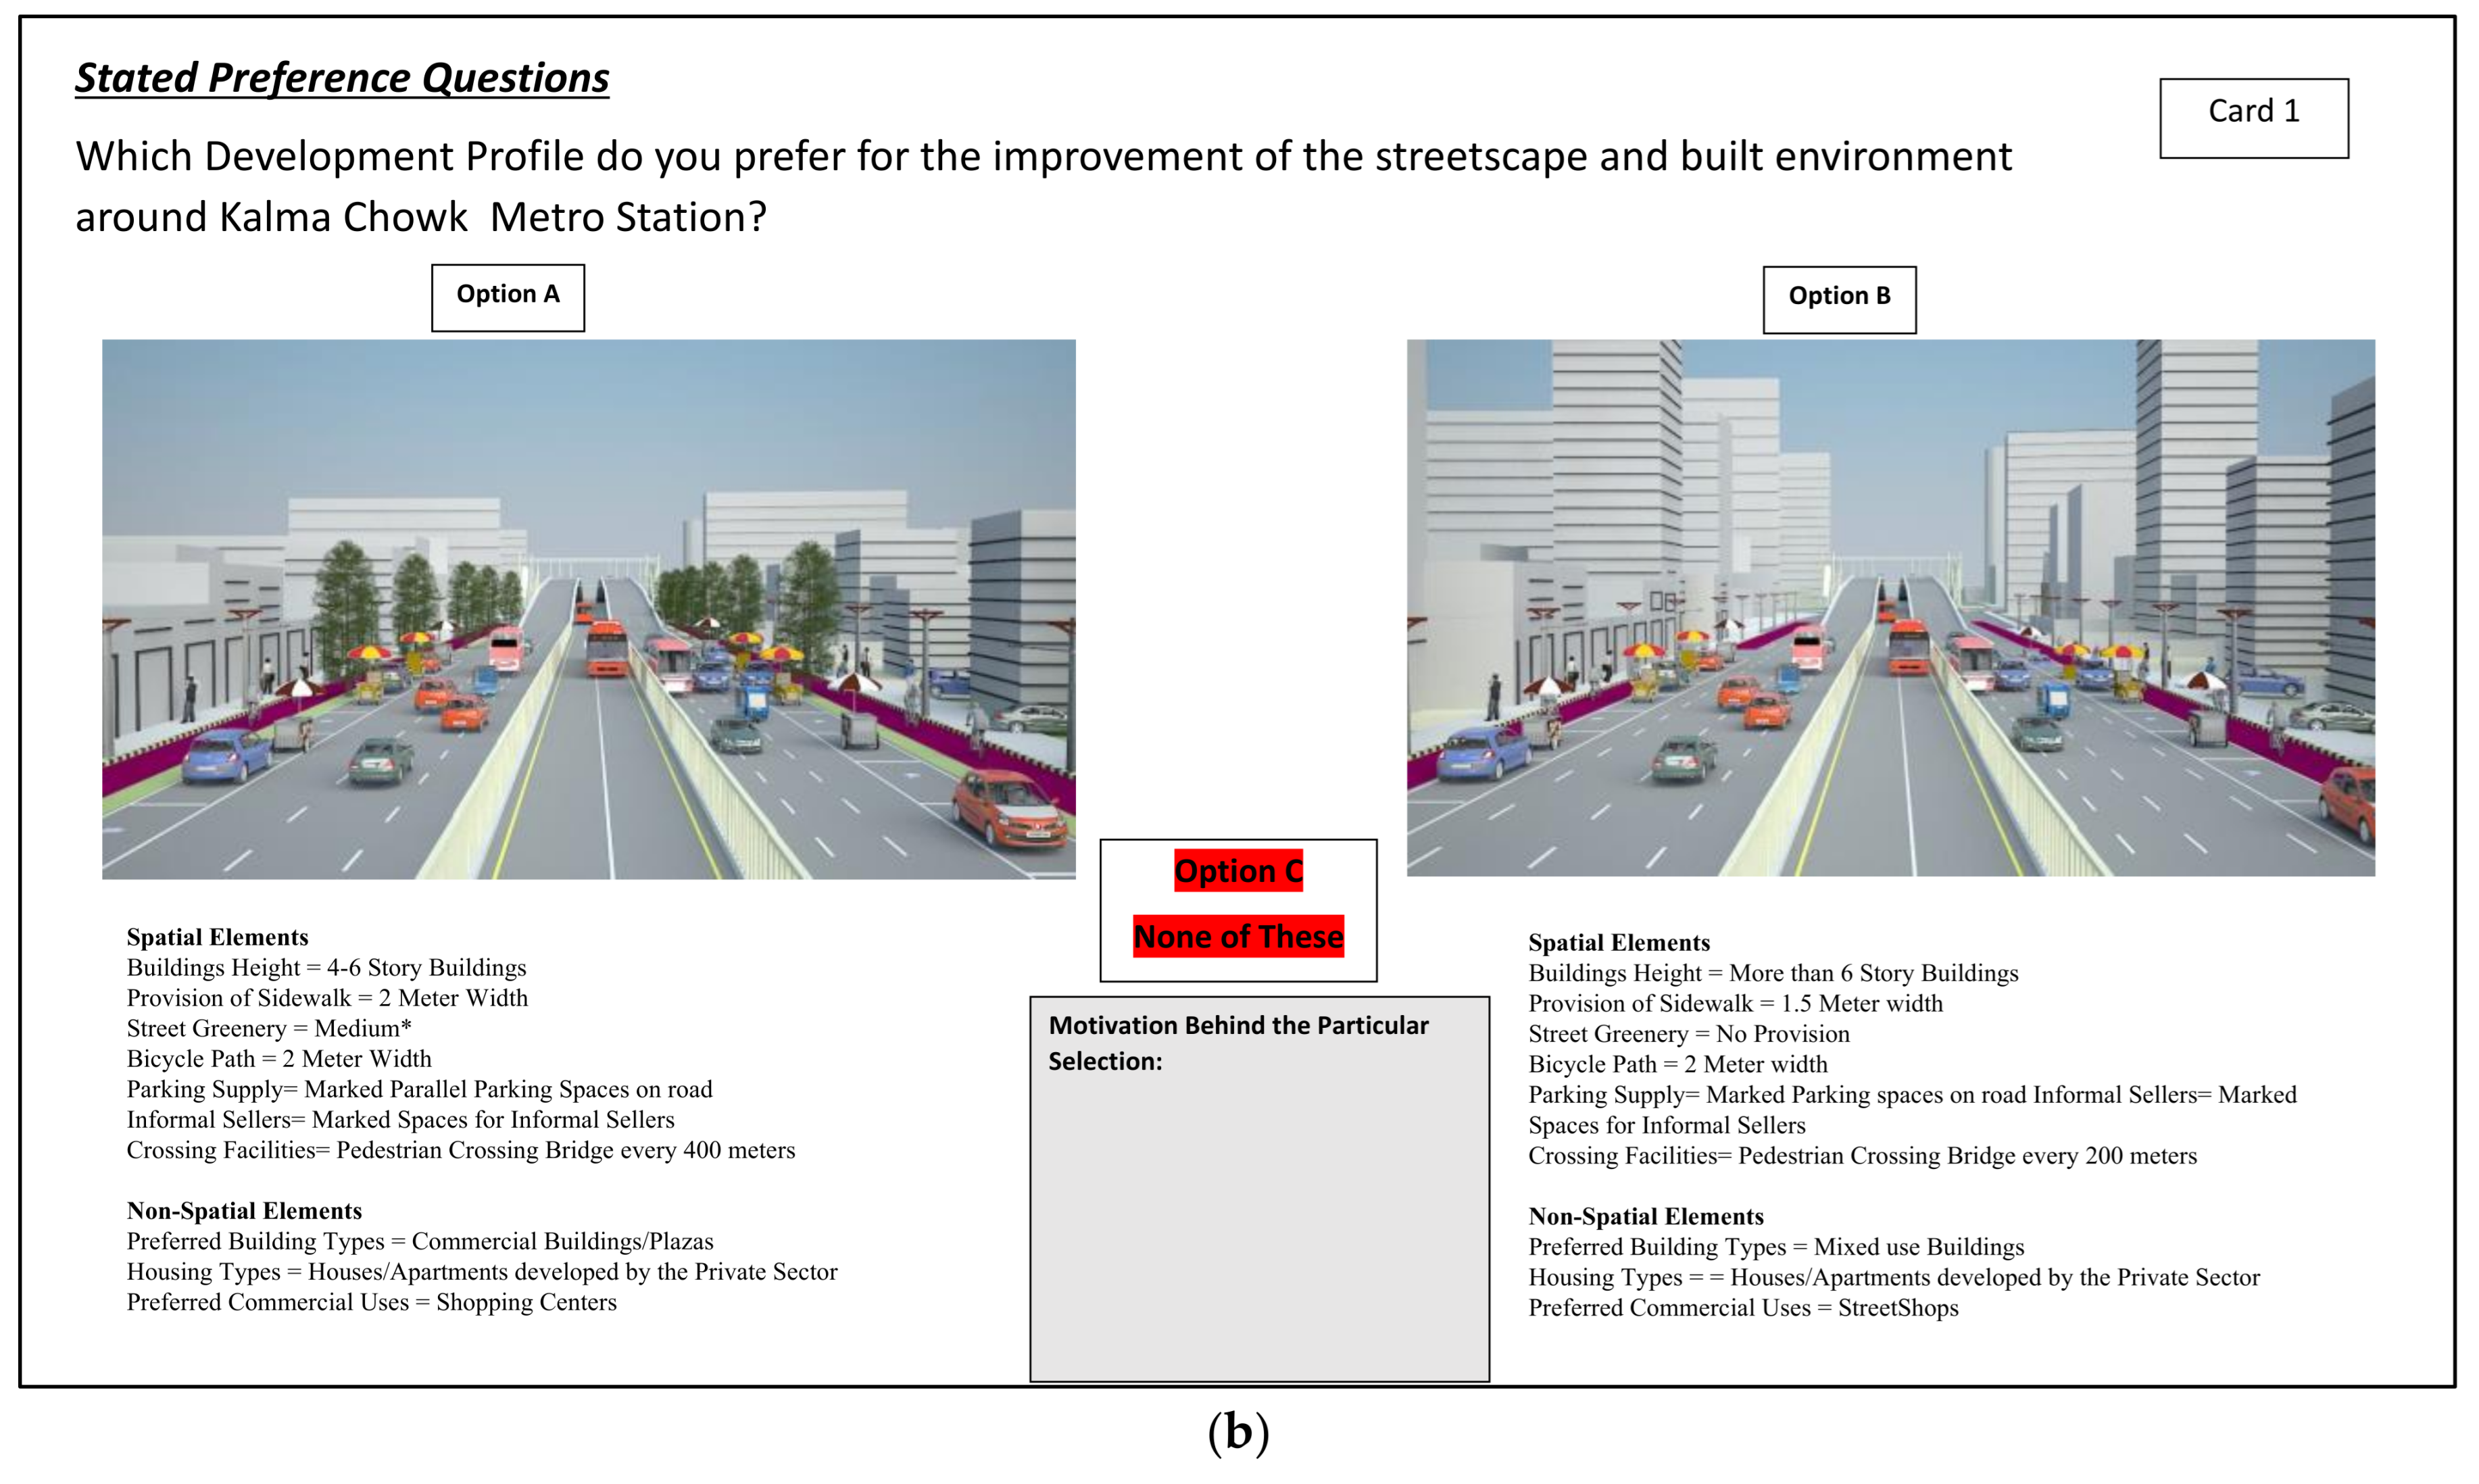
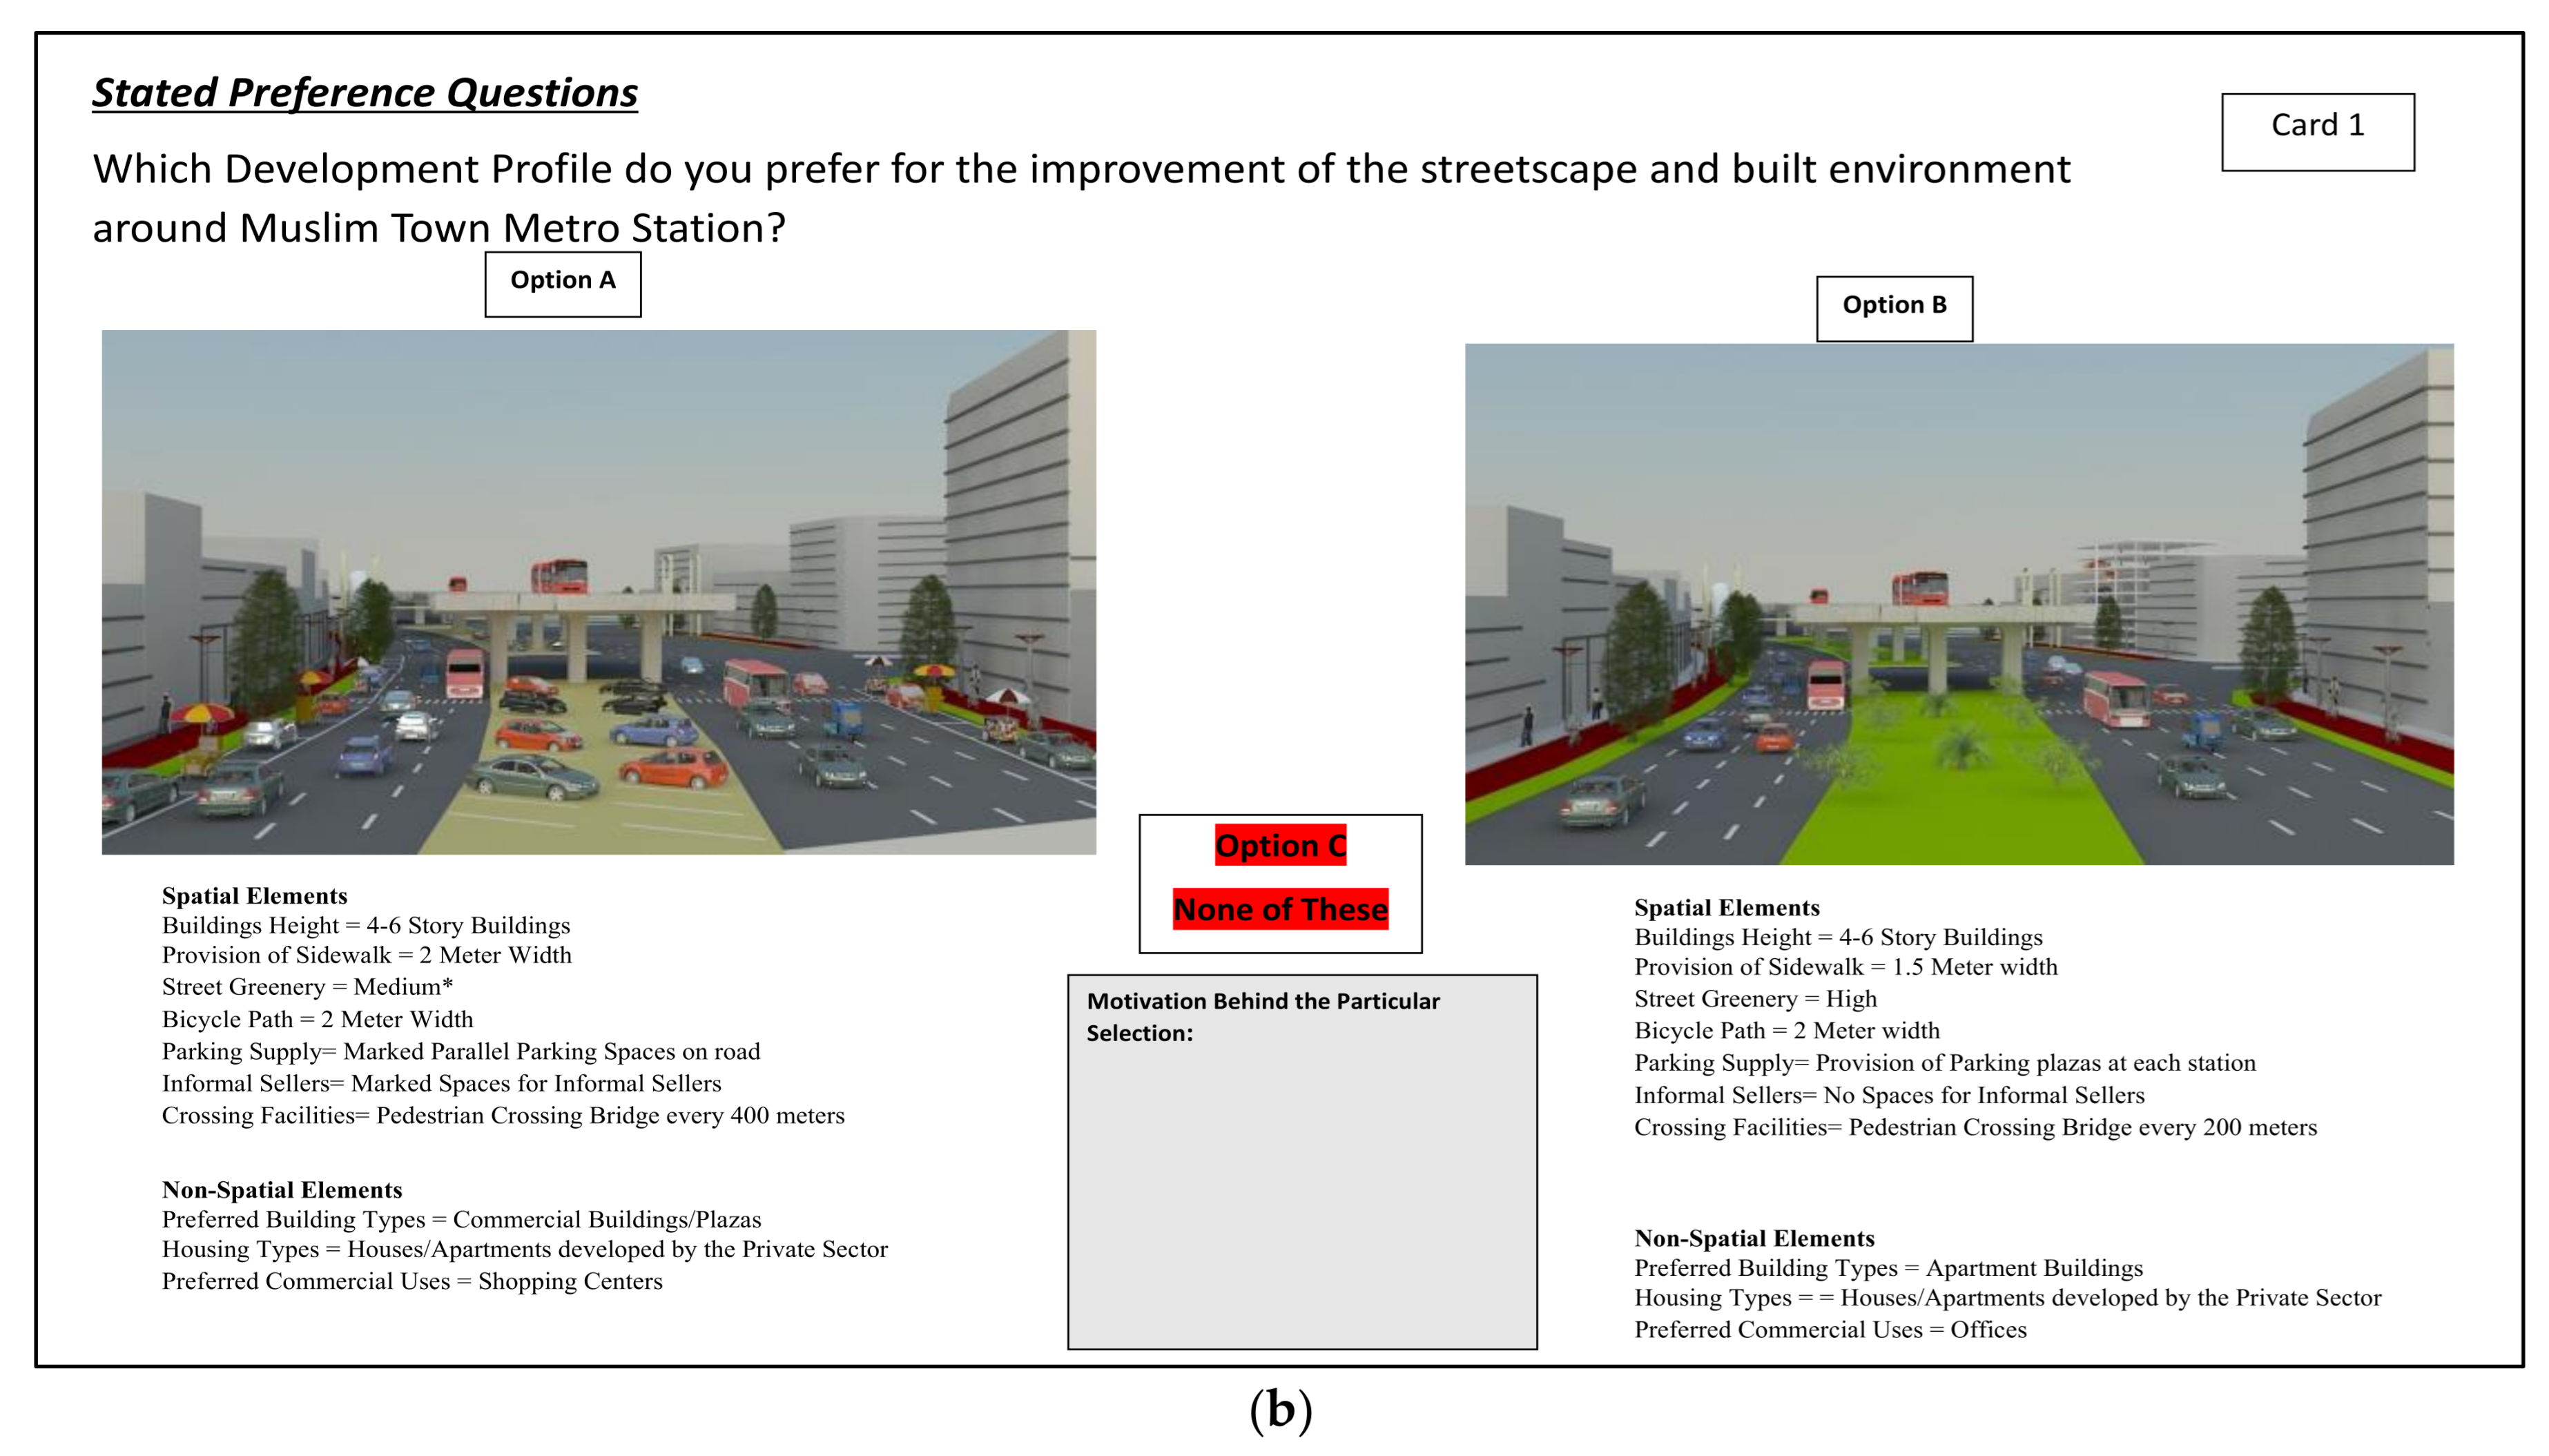
2.2. Experimental Design

The application of discrete-choice experiments involves the combination of attribute levels in the form of choice sets. In this research, there are ten attributes, six attributes having three levels, three attributes having four levels and one attribute having two levels. This will result in 43 × 36 × 21 possible scenarios in a full factorial design that entails all the likely combinations of attribute levels. Because it was not possible to prepare 3D visualization for all possible scenarios, an orthogonal factional factorial design was selected that involved a subset of 32 scenarios/3D visualizations for each transit station. We conducted the survey around 4 selected BRT stations in Lahore, resulting in 128 graphical scenarios in total. CAD choice sets were produced by a random combination of these 32 scenarios. A third option, ‘none of these’, was also added in the survey questionnaire to allow the participants to make their choice if none of the presented scenarios fulfilled their expectations. The 32 choice scenarios were then arranged into 16 blocks of 2 choice sets. Each participant of the survey was presented with 8 blocks to choose from each choice set the best microscale street profile according to their expectations. Example of the choice set are shown in Figure 1 and Figure 2.

2.3. Questionnaire Design Case Study Areas

At the start of the questionnaire, a short introduction and the motivation behind the research were presented and the term ‘stated preference’ was defined in an explicit way. The questionnaire comprised two parts. In part one, we focused on the collection of socio-demographic information and asked about how the interviewee uses the BRT. The socio-demographic information involved questions related to gender, age, level of education, residence, and status. The second part of the questionnaire was focused on the stated choice questions. In the eight stated choice questions, respondents were asked about their preferences regarding streetscape environment.
In this survey, we focused on three different groups of target population that includes building users/building owners, road users and BRT users. As already mentioned, the attributes of the survey were selected based upon the extensive literature review as well as the discussion with these target groups. It is necessary to analyze their preferences separately to obtain better insights about the case study area and propose sustainable streetscape designs. The survey was administered around four metro stations (Ichra, Chungi Amarsidhu, Kalma Chowk, Muslim Town) along the BRT corridor of Lahore, Pakistan, as shown in Figure 3. Around BRT stations, lack of attention to the streetscape environment, concrete infrastructures, has made street life vulnerable and unattractive for the pedestrians and cyclists and residents. Many shopkeepers have moved out, occupying the entire space of sidewalks. Figure 4 presents some of the areal and street images of these BRT Station Areas.
Because preferences are shaped according to the experiences with the BRT infrastructure, the target groups of the survey were chosen based on their relationship to this infrastructure and the built environment surrounding it. The survey was administered within a 500 m radius around these BRT stations. The students of University of Engineering and Technology, Lahore, were trained to conduct face-to-face interviews with the respondents. The respondents were selected randomly on the selected streets through GIS. The researcher in charge of the project checked the completed questionnaires on a daily basis. A total of 811 persons started the questionnaire, of whom 59 persons quit in the process because of personal reasons. Overall, 752 complete questionnaires were received within a period of 2 months.

2.4. Sample Characteristics

The distributions of the sociodemographic characteristics of the respondents are shown in Table 2. According to the data of the Punjab Bureau of Statistics, 59.96% of the population is below the age of 25 [61], but our sample underrepresented the young people. In our sample, there are more males than females, which is consistent with our expectations, as females are usually reluctant to give interview because of personal issues. The education level of the sample is not much higher than the average population, and we could not find many respondents with university degrees. As one of the target groups of our survey was BRT users, surveyors had to go inside the BRT stations to interview people. Most of the respondents, however, are building users/building owners who were not using BRT as a mode of transport, instead using their personal motorbike or cars for transportation.

2.5. Data Analysis

The strategy of this stated preference experiment was based upon the notion that underlying user preferences and selected choices of microscale streetscape designs can be captured in terms of a multinomial logit model and linear-additive utility function. The random utility theory provides the basis of the multinomial logit model and it presumes that error terms of the utility function are identically and independently Gumbel distributed [62]. Model estimation was based upon the maximum likelihood [63]. As the alternatives which are used in our choice experiment are unlabeled, most of the researchers do not estimate the alternative specific constant (ASC) in this case.

2.5.1. Basic Analytical Model

The basic analytical model for the analysis of discrete choice data adheres to a random utility framework [64]. It is assumed that an individual q (q = 1.…, Q) in a sample is offered with j (j = 1, ……., J) alternatives in the form of choice sets (in our case, two alternatives as Option 1 and Option 2 and one ‘none of these’ option 3), and then that individual q chooses the alternative with highest utility (U). The utility (U) is drawn by and individual from any presented alternative in the choice sets and it is a function of stochastic error component (εjq) and systematic component (Vjq). The stochastic error component (εjq) has zero mean and it is a random term which is identically and independently distributed (IID) [65].
Ujq = Vjq(X) + εjq
All the measurable characteristics which are presented to individual q in alternative j are there in systematic utility component Vjq [66]. X represents the attributes and in our research study these are the attributes of microscale streetscape built environment including sidewalk widths, crossings facilities, building heights, parking and others, as mentioned in Table 1.
Ujq = α 1 + β1xjq+ β2xjq+ β3xjq + ……+ βmxjqi + εjq
Betas in the equation provide the quantitative information about the strength of the preference for each level of the alternative. Finally, the probability of choosing a particular alternative is specified using the logit model, as defined in the following equation.
P i   =   e x p V i J = 1 N e x p ( V j )

2.5.2. Data Coding

Dummy coding was used to code the levels of microscale streetscape built environment attributes. For example, for an attribute with four levels, four dummy variables were created. Each indicator level corresponds to one of the categories coded as 1 and remaining categories are coded as zero. For example, for the attribute of street greenery, three levels are presented to the respondents, that is, high, medium and low. If we associate SG1 (dummy coded variable) with high level of street greenery, SG2 (dummy coded variable) is associated with medium level of street greenery and SG3 (dummy coded variable) with low level of street greenery. Each time a respondent is presented with high level of street greenery, we put 1 in the column of SG1 and all others are zero in this case.

3. Model Results and Discussion

The results of the analysis and model estimation are presented in the Table 3. During our research, we targeted three population groups in our sample so that we could analyze the differences in their preferences. These three groups have their own personal interests and it was necessary to estimate the models for each group separately. Although we collected the data from four different BRT stations, they can be subdivided in two groups: ICHRA and Chungi Amarsidhu metro station areas have similar existing streetscape characteristics with high population density and low level of affluence among property users, Kalma Chowk and Muslim town metro station areas share the same features with low population density and high level of affluence among property users, so we examined the data based upon two location groups. For location group 1 (ICHRA and Chungi Amarsidhu), the values of McFadden’s pseudo rho squared for residents, commercial building users and BRT users are 0.352, 0.344 and 0.323, respectively. For the location group 2 (Kalma Chowk and Muslim Town), the values of McFadden’s pseudo rho squared for residents, commercial building users and BRT users are 0.369, 0.346 and 0.302, respectively. All of these measures show a good model fit. As a rule of thumb, values of McFadden’s pseudo rho squared ranging from 0.2 to 0.4 show a good model fit [64,67].

3.1. Interpretation of Attribute Levels (Location Group 1 and Location Group 2)

In this section, the model estimation results for the stated preferences of the residents, commercial building users and BRT users of location group 1 (Ichra and Chungi Amarsidhu) and location group 2 (Kalma Chowk and Muslim Town) BRT stations are discussed in detail.

3.1.1. Residents

As presented in Table 3, the estimated part-worth utilities for the three levels of building height show that residents of location group 1 preferred low-rise buildings (1–3 stories) as compared to moderately high-rise buildings (4–6 stories) and high-rise buildings (more than 6 stories). The parameter value for low-rise buildings (1–3 stories) has the highest and significant value (2.61, t = 3.4) as compared to the parameters of other two levels of building height. This result is in line with the findings of [30] where the respondents of stated preference survey preferred low-density urban developments. During the survey we also collected some qualitative information and asked people about their motivation for certain selections. Most of the residents believe that the infrastructure capacity of Ichra and Chungi Amarsidhu is not enough to bear high-rise constructions, and therefore they prefer 1–3 story buildings. Some of the residents also brought up privacy issues.
In comparison, the estimated part-worth utilities for building height attribute levels of location group 2 show different patterns, that residents of Kalma Chowk and Muslim Town prefer moderately high-rise buildings (4–6 stories) and this result is in line with the findings of [68] where locals preferred moderately high-rise buildings around metro stations. The estimated part-worth utility for this level of building height has the value of (1.56, t = 3.45) and it is significantly higher than the other two levels. Generally, the residents of Kalma Chowk and Muslim town believe that these locations are attractive and access roads have enough capacity to accommodate moderately high-rise constructions. Some of the residents also discussed the issues of traffic volumes generated by high-rise constructions.
For location group 1, the estimated part-worth utilities for the attribute of width of sidewalk show that residents prefer wider sidewalks with 2-meter width. The parameter value for the first level of sidewalk (2-meter width) is highest (2.17, t = 3.93) and it is significant at conventional confidence interval. In the current scenario, residents complained that sidewalks exist at some road segments around Ichra and Chungi Amarsidhu stations, but these collective spaces are totally occupied either by the shop owners or by the parking of motorbikes. The preference for wider sidewalks is also rational in the era of Covid-19 pandemic. During the discussions, residents often mentioned that it is very difficult to pass from station areas as a pedestrian. For the location group 2, the estimated part-worth utilities for attribution of sidewalk width showed the same patterns as residents of location group 1.
The estimated part-worth utilities for the four levels of street greenery show that residents of location group 1 prefer more greenery around metro stations. The parameter for the high level of street greenery (horizontal + vertical green) has the highest value (1.69, t = 2.92) with 1% significance level as compared to all the lower levels of street greenery. Furthermore, the utilities for the other two levels of street greenery (medium and low) are both significantly higher as compared to the base level (no greenery); the values of all the effects are positive, which shows that residents of Ichra and Chungi Amarsidhu do not prefer a BRT corridor without greenery. In the current scenario, Ichra and Chungi Amarsidhu metro stations are flooded by concrete infrastructures and one can hardly see a tree or green space around these metro stations. In comparison, the residents of location group 2 also preferred the first level of street greenery (high greenery). The estimated part-worth utilities show that the first level of street greenery has the highest and most significant parameter value (1.31, t = 3.28).
For residents of location group 1, only the effect of a second level of parking (parking at the multistory parking plazas) was significant and positive (1.72, t = 3.3). Ichra and Chungi Amarsidhu are old established urban settings and on-street car parking facilities along the BRT corridor are not preferred by the residents as they feel that these facilities can disturb the whole carriageway and traffic flows, causing congestion problems. For the location group 2, estimation of part-worth utilities for the residents of Kalma Chowk and Muslim Town showed different patterns, the effect of first level of parking (marked on-street parking spaces) is significant and positive (0.109, t = 2.75). The neighborhoods around Kalma Chowk and Muslim Town metro stations have greater street widths and the carriageway of BRT corridor is also wider as compared to Ichra and Chungi Amarsidhu, therefore, on-street parking facilities are preferred.
The residents of location group 1 prefer more and closer crossing facilities around BRT corridor as the estimation of part-worth utilities showed that the parameter value for first level of crossing facilities (pedestrian crossing bridge every 200 m) is higher and significant across all other levels. The estimation of part-worth utilities for the first level of crossing facilities has the parameter value (2.42, t = 2.13) and it is significant at 5% confidence level. In fact, the parameters for the other two levels of crossing facilities are negative and non-significant. The BRT infrastructure has fragmented the city and it seems very difficult to cross the BRT corridor from one side to the other side without a car. Many residents of Ichra and Chungi Amarsidhu mentioned this problem of fragmentation. The residents of location group 2 also preferred the closer crossing facilities as the model results show that only the first level of crossing facilities (pedestrian crossing bridge every 200 m) is significant. Many residents of Kalma Chowk and Muslim Town also mentioned that the crossing facilities in the form of underpasses would be much better as compared to the pedestrian crossing bridges.
The estimated part-worth utilities for the residents of location group 1 revealed that they preferred the first level (clearly marked spaces on the street for informal sellers) instead of removing them from the streetscape. The parameter value for the first level of ‘informal sellers’ was significantly higher (2.81, t = 2.97) than the base level (no spaces for informal sellers). Discussions revealed that informal seller operate in these areas because there are potential buyers. Most people do not a have high level of affluence and they prefer buying from informal sellers rather than going to the big stores. These informal sellers cannot be eliminated, and it is a sustainable solution to mark clear spaces on the road for informal sellers. In comparison, the model shows different results for the residents of location group 2, as the parameter value for the first level (clearly marked spaces on the street for informal sellers) is negative. The residents of Kalma Chowk and Muslim Town have a higher level of affluence and discussions revealed that most of them go to big shopping malls to buy goods, which is why they did not prefer the presence of informal sellers.
Results further show that first two levels of bicycle path widths (1.5 m and 2 m) are preferred by residents of location group 1 as compared to the base level (no bicycle path). The bicycle path width of 2 m has the highest parameter (2.01, t = 2.88) at 1% significance level. In this pandemic era, preference for the sufficient infrastructure for the non-motorized means of transport is quite rational. The residents of location group 2 preferred the first level of bicycle path width (1.5 m) as model results showed that first level of bicycle path width has the highest parameter value (1.41, t = 3.48) and it is significant at 1% confidence level. Generally, the discussions revealed that the residents of location group 2 do not use bicycles as a mode of transport as these are the car-based localities.
Results further showed that residents of location group 1 have preferred mixed-use buildings over other two level of building types (apartment buildings and commercial plazas). The estimated part-worth utilities showed that the utility for second level of building type (mixed used buildings) is significantly higher than the average utility across all other levels of building type with a parameter value of (1.34, t = 3.35) and the parameter values for the other two levels of building types are non-significant. TOD also emphasizes the mixed land uses around stations areas where the first two floors are used for retail activities and upper floors are used for residential purposes. During the discussions, it was noticed that many residents were actually the owners of their properties, and their preference for mixed-use buildings can be linked to the fact that they want to redevelop their residencies into multi-story mixed-use buildings to gain financial benefits. The residents of location group 2 also preferred mixed-use buildings and apartment buildings as the parameter value (1.45, t = 2.68) for the second level of building type is significantly positive. At the same time, the parameter value for the first level of building type (apartment buildings) is also positive and significant (1.34, t = 3.04).
Among three levels of housing projects, residents of location group 1 preferred social housing projects as the parameter value for the first level of housing provision (social housing) was significantly positive (3.22, t = 2.62) at 1% confidence interval as compared to the other levels of housing provision. In the current scenario, developments have been totally left to market forces and no social housing projects have been planned around the metro stations of Ichra and Chungi Amarsidhu. For the residents of location group 2, the estimated part-worth utilities showed the same patterns and social housing projects were preferred. The residents of location group 2 mentioned that if housing projects were developed by private sector, then it would become impossible for the lower-income groups to have residences near metro stations because they usually put the prices so high.
The estimated part-worth utilities for the three levels of ‘preferred commercial use’ reveal that residents of location group 1 preferred street shops instead of commercial centers and office buildings. Generally, the plot sizes in Ichra and Chungi Amarsidhu are very small and residents have a low level of affluence and they believe that the development of big commercial centers will affect the local identities. However, the residents of location group 2 preferred commercial uses in the form of commercial plazas as the parameter value for the second level of ‘preferred commercial use’ is significantly higher (2.68, t = 6.43) among all other levels.

3.1.2. Commercial Building Users

For commercial building users of location group 1, the patterns of part-worth utilities for the attribute levels of building height show that they prefer moderately high-rise buildings (4–6 stories). The parameter of moderately high-rise buildings has the highest value (3.93, t = 3.21) and it is significant at 1% confidence interval. During the discussions, it was noticed that commercial property owners want more financial gains through high-rise constructions as these structures generate more rental yields. Yet at the same time many commercial building users voiced their opinion about the old established character of Ichra and Chungi Amarsidhu and they believe that high-rise construction of more than six stories can be very problematic in future. For commercial building users of location group 2, the effects of first the two levels of building height are negative, which shows that commercial building users of these locations do not prefer low-rise and moderate low-rise buildings. Many commercial property owners mentioned that only few parts of Lahore have the potential to bear high-rise constructions and these two locations are suitable for the construction of buildings with more than six stories.
For the commercial building users of location group 1, the estimated part-worth utilities for the attribute levels of sidewalk width also showed the preference for wider sidewalks as the parameter value for the 2-meter width of sidewalk is highest (1.97, t = 4.2) among all other levels of sidewalk widths. However, here the reasons of the preference of wider sidewalks are somehow different. It is a local norm in Ichra and Chungi Amarsidhu station areas that shop keepers display their goods outside of their shops. Many shop owners mentioned that wider sidewalks can be marked with different colors, so half of the width of sidewalk could be used by pedestrians and half of the width could act as a platform for the presentation of the shop goods as it is the local custom. The commercial building users of location group 2 also preferred wider sidewalks as the estimated part-worth utilities for the first level of sidewalk width (2 m) has the highest parameter value (2.02, t = 3.07) as compared to other levels.
For the commercial building users of location group 1, the estimated part-worth utilities for the four levels of street greenery show that commercial building users also prefer the highest level of street greenery (high greenery). As shown in graphical scenarios, a high level of street greenery refers to the presence of tree lining on both sides of BRT corridor on horizontal green belt segregating the motorized and non-motorized traffic. The parameter for high level of street greenery is positive with a value 1.53 and it is significant at 1% confidence interval. Commercial building users/owners believed that adding urban greening along the BRT corridor will add more value to their properties. The commercial building users of location group 2 also preferred the first level of street greenery with a parameter value of (1.25, t = 2.60) and mentioned that high levels of street greenery will have very positive impacts on urban environment.
Most commercial building users of location group 1 mentioned that the poor car parking situation around BRT station often blocks the accessibility of their shops and it is also clear in the model results that as commercial building users do not prefer on-street car parking, the parameter value for on-street car parking is negative and non-significant. The parameter for parking a multistorey parking plaza is positively significant (1.54, t = 2.54) at 5% confidence interval. In comparison, the commercial building users of location group 2 preferred the level 3 of parking facilities (parking plazas + on-street parking) as for the other two levels of parking facilities, the parameter values are negative. The commercial buildings of Kalma Chowk and Muslim Town metro stations attract a lot of car traffic on a daily basis, therefore, commercial property users preferred more car parking facilities.
Commercial property users of location group 1 preferred pedestrian crossings every 400 m as the utility for the second level of crossing facilities is highest and significant (1.18, t = 3.14). Overall, commercial building users claimed that crossing bridges affect the visual accessibility of shops and that is why they do not prefer a lot of pedestrian bridges. For the commercial building users of location group 2, the patterns of part-worth utilities were different, and they preferred first level of crossing facilities with significant parameter value (0.846, t = 2.75). During the discussions, it was revealed that many commercial building suers prefer underpass crossing facilities instead of pedestrian bridges.
Many commercial building users of location group 1 mentioned that informal sellers often stand in front of shops and they keep on moving all day and disturb traffic flows quite badly, causing serious congestions. Commercial building users preferred clearly marked spaces on the street for the informal sellers and they agreed that it is not a sustainable solution to remove them from Ichra and Chungi Amarsidhu. In the past, local governments have tried to remove them but they keep returning. Allocating space for informalities is a sustainable solution. In comparison, the commercial building users of location group 2 did not prefer the presence of informal sellers as the value of parameter for the first level (clearly marked spaces for informal sellers) is negative.
Similar to the residents of location group 1, the commercial building users preferred moderately wider bicycle paths as the estimated part-worth utilities for the second level of bicycle path width (2 m) are higher across all utilities. The second level of bicycle path width has the parameter value (1.82, t = 2.24) and it is significant at 5% confidence interval. For the commercial building users of location group 2, the estimation of part-worth utilities showed that first level (1.5 m width of bicycle path) has the highest significant parameter value (1.41, t = 3.48). Modal shift from private motorized transport to cycling requires provision of sufficient and well-connected cycling infrastructure and it will have a very positive impact on the urban environment of Lahore.
Commercial building users of location group 1 have also preferred mixed-use buildings as the parameters for the other two levels of building types (apartment buildings and commercial buildings) are negative and non-significant. The patterns of part-worth utilities are quite different for the commercial building users of Kalma Chowk and Muslim Town. They preferred commercial plazas instead of mixed-use buildings and apartment buildings as the values of parameters are negative for first two levels of building type. During discussions, commercial building users mentioned that the multi-story commercial plazas yield more profit than apartment buildings.
For commercial building users of location group 1, the estimated part-worth utilities for the three levels of housing provision reveal that the second level of housing provision (social housing) has been more preferred with parameter value of (2.97, t = 2.71), as it is significantly higher at 1% confidence interval. The parameter value for the second level of housing provision (provision of affordable housing on installments) is also positive and significant. For location group 2, the estimated part-worth utilities for the attribute levels of housing provision reveal that the utility for the first level of housing provision (social housing) is significantly higher across all other levels. It was also observed during the discussions that the private sector is not interested in the development of housing projects around metro stations. Hence, government intervention is vital to achieve the goals of sustainable transit-oriented development. The estimated part-worth utilities for the three levels of ‘preferred commercial use’ reveal that the commercial building users of both location group 1 and location group 2 preferred commercial uses in the form of commercial centers instead of street shops and office buildings.

3.1.3. BRT Users

BRT users of location group 1 preferred moderately high-rise buildings; the patterns of part-worth utilities show that the moderately high-rise building height has the highest parameter value (1.97, t = 4.2) and it is significant at the 1% confidence level as compared to the other levels of building height. Many BRT users mentioned the aesthetics associated with moderately high-rise buildings. They stated that moderate high-rise constructions can make Ichra and Chungi Amarsidhu station areas more attractive and pleasing to the eye. In comparison, the BRT users of location group 2 have the same point of view as commercial building users of Kalma Chowk and Muslim Town presented, they preferred high-rise constrictions of more than six stories as the effects of other two levels of building height are also negative for them.
For location group 1, the estimated part-worth utilities for the attribute of width of sidewalk showed the same patterns similar to the residents and commercial building users as the parameter value for the 2-meter width of sidewalk is highest (2.05, t = 3.45) and significant. BRT users raised concerns about the poor pedestrian environment around metro stations and complained that due to the unavailability of the sidewalks, they have to walk on the carriageway along with other traffic, which raises many safety issues. These safety issues disturb the pedestrian accessibility at metro stations, hence affecting the BRT usage. In comparison, the BRT users of location group 2 also preferred wider sidewalks as the parameter value for first level of sidewalk width is highest (2.52, t = 3.09) and significant. During the discussions, BRT users of Kalma Chowk and Muslim Town mentioned safety issues because of the car dominance in these areas and they asked for the better connection between the pedestrian infrastructure.
The estimated part-worth utilities for the four levels of street greenery showed that BRT users of location group 1 do not prefer lower levels of street greenery as the value of the parameter for the lowest levels of street greenery are not significant. Only the high level of street greenery is significant at the 1% confidence interval with a parameter value of (1.12, t = 2.53). In the graphical scenarios, BRT users acknowledged that adding the street greenery to the BRT corridor will not only increase the aesthetic sense of the area but pedestrian safety problems can also be resolved by the segregation of motorized and non-motorized means of transport. BRT users of location group 2 mentioned that severe temperatures and metaled roads make it very difficult to walk around the BRT stations and they also preferred the high levels of street greenery with the significant parameter value of (1.54, t = 4.38).
Results further showed that BRT users of location group 1, also preferred car parking facilities in the form of parking plazas, as the second level of parking facilities has the highest parameter value (0.937, t = 2.06) and it significant at conventional confidence interval. The parameters for other levels of parking facilities are non-significant. During the discussions, BRT users of location group 1 also mentioned having on-street safe parking places for cycles so that they can easily access BRT stations. In comparison, for the BRT users of location group 2, the effects of first two levels of parking are both negative as compared to the base level (parking plazas + on-street parking) which means that a third level of parking facilities is preferable.
The results further showed that BRT users of both location group 1 and location group 2 preferred closer crossing facilities as the parameter for ‘pedestrian crossing bridge at 200 meters’ has the highest significant value in both cases. During the discussions, it was repeatedly mentioned by BRT users that sometimes they have to walk more than 2 km to cross the road which makes it quite difficult for them. Many BRT users of location group 1 mentioned that they buy goods from the informal sellers of Ichra and Chungi Amarsidhu and they also preferred ‘marked spaces for informal sellers’ with parameter (2.32, t = 2.57). The parameter values for the other level ‘no spaces for informal sellers’ are negative. For the BRT users of location group 2, the estimated part-worth utilities showed a different result from location group 1 and they did not prefer the presence of informal sellers as the parameter value is negative for the first level.
For BRT users of location group 1, only the first level of bicycle path width (1.5 m) is significant and preferred. Estimated part-worth utilities showed that the first level of bicycle path width has the highest and significant parameter value (1.22, t = 2.91). For the BRT users of location group 2, the model estimation showed the same result. Many BRT users also discussed the presence of safe docking stations for bicycles along with the bicycle infrastructure.
BRT users have shown greater preference for apartment buildings with parameter value (1.16, t = 2.48) and it is significant at 5% confidence level. During the discussions, it was also noticed that many BRT users belong to the working class, they have a low level of affluence and they desire lower-income housing projects to be developed around the metro stations of Ichra and Chungi Amarsidhu so that longer travelling distances can be avoided. In case of BRT Ahmadabad, India, 10% of land has been reserved by the government for the development of social housing projects around BRT stations [5]. Considering the similar social context, local development authorities can play a vital role in developing housing projects around BRT stations. The model results showed different patterns for the BRT users of location group 2, as they preferred commercial plazas, the parameter values for first two levels of building type are negative.
For the BRT users of location group 1, the estimated part-worth utilities for three levels of housing provision reveal that the utility for the first level of housing provision (social housing provided by the government) is significantly higher across all other levels. BRT users of location group 2 also preferred social housing provision by the government. Like other stakeholders, BRT users do believe that the housing provided by the private sector is unaffordable for lower-income classes. The estimated part-worth utilities for the three levels of ‘preferred commercial use’ reveal that BRT users of both location group 1 and location group 2 preferred commercial uses in the form of commercial centers instead of street shops and office buildings. It is the responsibility of the local government agencies to channelize the commercial uses according to the principles of sustainable TOD and ensure mixed-use developments through various incentive programs.
Overall, the model results showed that there are few attributes of the streetscape for which many stakeholders have similar preferences such as preference for wider sidewalks/bicycle paths, more greenery and more crossing facilities and these results are in line with the findings in [69,70]. Similarly, the preferences of the stakeholders vary for some specific streetscape and built environment features such as building densities/heights, building typologies and parking facilities.

4. Conclusions and Policy Implications

The aim of this research study was to gain insight into multiple stakeholders’ preferences related to the streetscape and built environment designs. It was observed that not only the road-related factors (bike lane and sidewalk widths, crossings facilities, street greenery) have a significant influence on people’s preference but also building heights, typology of buildings, and housing projects around BRT corridor have shaped their preferences. It was also noticed that all stakeholders prefer better functional environments and amenities around BRT stations. The government has invested huge amounts of money in the development of transport infrastructures but now there is a need to emphasize the making and management of collective spaces around BRT stations. Similarly, there is a need to channelize the development patterns around according to the local requirements and infrastructure capacities. Transit service is just a means to help the creation of desirable urban development. It is figuratively and literally a mass transit service connecting people to places, thus conducive to the conception of kinds of neighborhoods in which local stakeholders want to work, live, play and interact. The local urban planners and designers of Lahore must translate their visions of TOD through area-sensitive master plans which are socially inclusive, market-sensitive and rooted in fiscal realities. Considering the varying character of different transit stations around BRT Lahore, there is a need to build a typology of TODs, and mass transit station environments backed up by the illustrative streetscape designs and more realistic market assessments. A diverse portfolio of layouts and plans is more likely to reflect the local conditions and stakeholders’ preference than a homogeneous one-size-fits-all approach of TOD. Based upon the comprehensive analysis of the existing situation and users’ preferences, it is crucial to introduce the prototypes as a way to test the waters in both political and market terms.
In the case of BRT Lahore, stakeholders of the discussed metro stations have different views on the urban densities, typology of developments, walking and cycling environments and housing preferences. Developing a TOD typology and adapting general themes of compact development, land use mix and walkable neighborhoods to the local conditions can bring together a wide array of stakeholders (residents, BRT users, local urban planners, commercial building users) at different scales to improve sustainability. Categorization of TODs into various typologies enriches their design, planning and operational activities in many ways. For instance, common factors within a certain TOD will allow the stakeholders and policymakers to create a collective set of strategies to improve the overall performance of the system [71,72], for example, issues of gentrification can be tackled in a systematic way. The authors of [73] argue that each TOD type must have an optimal streetscape and built environment design, land use mix, density, transit system function and connectivity, and hence the typology supports the planning and designing of an optimum development pattern.
Results indicated that around ICHRA and Chungi Amarsidhu metro stations, residents prefer low-rise buildings and the residents of Kalma Chowk and Muslim Town prefer moderate high-rise buildings, therefore, local urban planners should assess the situation according to the local needs and develop transit-oriented zoning plans accordingly. The functionality of the street environment is enhanced by the street greenery and active transport infrastructures. Green hedges, tree linings, wider sidewalks and bicycle paths are strongly recommended along both sides of the BRT corridor. Leveraging sustainable TOD policies will not only reduce the vehicular miles travelled by private cars but it will form social inclusion and lower-income groups can enjoy the benefits of mass transit systems. If sustainable TOD policies are not implemented and development patterns are still left to market forces, then with the passage of time all the lower-income groups have to leave the surroundings of the mass transit stations due to the effects of gentrification and these lower-income groups will not be left with any other option but to move to the periphery of the city. The findings of this research can be helpful in preparing urban design guidelines around BRT stations. Sustainable transit-oriented development requires that preference should be given to the active modes of transportation and their preferences are explored in this study. Streetscape designs for active modes of transport have become more important in this pandemic situation. A cogent vision of the city’s future is required for the sustainable development of built environment and streetscapes. In the case of Lahore, a well-articulated vision is required in achieving the area-sensitive TOD forms followed by the continuous efforts of multiple stakeholders and local urban planners. A restricted range of identified attributes is presented in the stated choice experiments which is a potential limitation of this study. In the MNL model, linear utility is assumed to be the representative of a compensatory decision process. Future research can focus on the relative performance of the choice models.

Author Contributions

Conceptualization: A.A., B.N., A.Y., K.S. and J.S. Analyses: A.A., Literature Review: A.A., Writing—review and Supervision: A.A., B.N., A.Y., K.S. and J.S. All authors have read and agreed to the published version of the manuscript.

Funding

This research was funded by HIGHER EDUCATION COMMISSION, Pakistan, grant number ISLNEW-2299-031937 and The APC was funded by KU LEUVEN, BELGIUM.

Informed Consent Statement

Informed consent was obtained from all subjects involved in the study.

Data Availability Statement

Data will be available upon suitable demand.

Acknowledgments

We are grateful to the officials of LDA, a local development authority for the support and officials of Pakistan Urban Unit for the assistance with this research.

Conflicts of Interest

The authors declare no conflict of interest.

References

  1. Chen, J.-H.; Nguyen, H.; Chou, C.-C.; Wang, J.-P.; Wang, T.-K. Transit-Oriented Development: Exploring Citizen Perceptions in a Booming City, Can Tho City, Vietnam. Sustainability 2021, 13, 1370. [Google Scholar] [CrossRef]
  2. Zhang, Y.; Song, R.; Van Nes, R.; He, S.; Yin, W. Identifying Urban Structure Based on Transit-Oriented Development. Sustainability 2019, 11, 7241. [Google Scholar] [CrossRef] [Green Version]
  3. Curtis, C. Transitioning to transit-oriented development: The case of Perth, Western Australia. Urban Policy Res. 2012, 30, 275–292. [Google Scholar] [CrossRef]
  4. Cervero, R.; Wu, K.-L. Sub-centring and commuting: Evidence from the San Francisco Bay area, 1980–1990. Urban Stud. 1998, 35, 1059–1076. [Google Scholar] [CrossRef]
  5. Suzuki, H.; Cervero, R.; Iuchi, K. Transforming Cities with Transit: Transit and Land-Use Integration for Sustainable Urban Development; The World Bank: Washington, DC, USA, 2013. [Google Scholar]
  6. Batool, I.; Hussain, G.; Kanwal, N.; Abid, M. Identifying the factors behind fatal and non-fatal road crashes: A case study of Lahore, Pakistan. Int. J. Inj. Control Saf. Promot. 2018, 25, 401–407. [Google Scholar] [CrossRef]
  7. Imran, M.; Low, N. Time to change the old paradigm: Promoting sustainable urban transport in Lahore, Pakistan. World Transp. Policy Pract. 2003, 9, 32–39. [Google Scholar]
  8. Knowles, R.D. Transit oriented development in Copenhagen, Denmark: From the finger plan to Ørestad. J. Transp. Geogr. 2012, 22, 251–261. [Google Scholar] [CrossRef]
  9. Cervero, R.; Murakami, J. Rail and Property Development in Hong Kong: Experiences and Extensions. Urban Stud. 2009, 46, 2019–2043. [Google Scholar] [CrossRef]
  10. Cervero, R.; Kang, C.D. Bus rapid transit impacts on land uses and land values in Seoul, Korea. Transp. Policy 2011, 18, 102–116. [Google Scholar] [CrossRef] [Green Version]
  11. Mejia-Dorantes, L.; Paez, A.; Vassallo, J.M. Transportation infrastructure impacts on firm location: The effect of a new metro line in the suburbs of Madrid. J. Transp. Geogr. 2012, 22, 236–250. [Google Scholar] [CrossRef] [Green Version]
  12. Saelens, E.B.; Handy, S.L. Built environment correlates of walking: A review. Med. Sci. Sports Exerc. 2008, 40 (Suppl. S7), S550. [Google Scholar] [CrossRef] [Green Version]
  13. Ewing, R.; Cervero, R. “Does compact development make people drive less?” The answer is yes. J. Am. Plan. Assoc. 2017, 83, 19–25. [Google Scholar] [CrossRef]
  14. Ewing, R.; Cervero, R. Travel and the built environment: A meta-analysis. J. Am. Plan. Assoc. 2010, 76, 265–294. [Google Scholar] [CrossRef]
  15. Ewing, R.; Handy, S. Measuring the unmeasurable: Urban design qualities related to walkability. J. Urban Des. 2009, 14, 65–84. [Google Scholar] [CrossRef]
  16. Ewing, R.; Hajrasouliha, A.; Neckerman, K.M.; Purciel-Hill, M.; Greene, W. Streetscape Features Related to Pedestrian Activity. J. Plan. Educ. Res. 2016, 36, 5–15. [Google Scholar] [CrossRef] [Green Version]
  17. Sun, G.; Zacharias, J.; Ma, B.; Oreskovic, N.M. How do metro stations integrate with walking environments? Results from walking access within three types of built environment in Beijing. Cities 2016, 56, 91–98. [Google Scholar] [CrossRef]
  18. Rehan, R.M. Sustainable streetscape as an effective tool in sustainable urban design. HBRC J. 2013, 9, 173–186. [Google Scholar] [CrossRef] [Green Version]
  19. Chang, A.; Miranda-Moreno, L.; Cao, J.; Welle, B. The effect of BRT implementation and streetscape redesign on physical activity: A case study of Mexico City. Transp. Res. Part A Policy Pract. 2017, 100, 337–347. [Google Scholar] [CrossRef]
  20. Harvey, C.W. Measuring Streetscape Design for Livability Using Spatial Data and Methods. Master’s Thesis, University of Vermont, Burlington, VT, USA, 2014. [Google Scholar]
  21. Belzer, D.; Autler, G. Transit Oriented Development: Moving from Rhetoric to Reality; Brookings Institution Center on Urban and Metropolitan Policy: Washington, DC, USA, 2002. [Google Scholar]
  22. Lin, J.-J.; Gau, C. A TOD planning model to review the regulation of allowable development densities around subway stations. Land Use Policy 2006, 23, 353–360. [Google Scholar] [CrossRef]
  23. Caldeira, T.; Holston, J. Participatory urban planning in Brazil. Urban Stud. 2015, 52, 2001–2017. [Google Scholar] [CrossRef] [Green Version]
  24. Kallus, R. Citizenship in action: Participatory urban visualization in contested urban space. J. Urban Des. 2016, 21, 616–637. [Google Scholar] [CrossRef]
  25. Stauskis, G. Development of methods and practices of virtual reality as a tool for participatory urban planning: A case study of Vilnius City as an example for improving environmental, social and energy sustainability. Energy Sustain. Soc. 2014, 4, 7. [Google Scholar] [CrossRef] [Green Version]
  26. Lorenz, S.L.; Kolb, B. Involving the public through participatory visual research methods. Health Expect. 2009, 12, 262–274. [Google Scholar] [CrossRef] [Green Version]
  27. Gubrium, A.; Harper, K.; Otañez, M. Participatory Visual and Digital Research in Action; Routledge: Abingdon, UK, 2016. [Google Scholar]
  28. Reinwald, F.; Berger, M.; Stoik, C.; Platzer, M.; Damyanovic, D. Augmented reality at the service of participatory urban planning and community informatics–a case study from Vienna. J. Community Inform. 2014, 10. [Google Scholar] [CrossRef]
  29. Patterson, Z.; Darbani, J.M.; Rezaei, A.; Zacharias, J.; Yazdizadeh, A. Comparing text-only and virtual reality discrete choice experiments of neighbourhood choice. Landsc. Urban Plan. 2017, 157, 63–74. [Google Scholar] [CrossRef]
  30. Rid, W.; Haider, W.; Ryffel, A.; Beardmore, B. Visualisations in choice experiments: Comparing 3d film-sequences and still-images to analyse housing development alternatives. Ecol. Econ. 2018, 146, 203–217. [Google Scholar] [CrossRef]
  31. Greene, H.W.; Hensher, D.A. Modeling Ordered Choices: A Primer; Cambridge University Press: Cambridge, UK, 2010. [Google Scholar]
  32. Davies, A.; Laing, R. Images and stated preference: Do people need to be told what the attributes are or do they notice them anyway. In Proceedings of the 3rd Environmental Psychology in the UK Conference, Aberdeen, UK, 23–25 June 2003. [Google Scholar]
  33. Manyoky, M.; Hayek, U.W.; Klein, T.M.; Pieren, R.; Heutschi, K.; Grêt-Regamey, A. Concept for collaborative design of wind farms facilitated by an interactive GIS-based visual-acoustic 3D simulation. In Proceedings of the Digital Landscape Architecture, Bernburg, Germany, 1 May–2 June 2012. [Google Scholar]
  34. Adkins, A.; Dill, J.; Luhr, G.; Neal, M. Unpacking walkability: Testing the influence of urban design features on perceptions of walking environment attractiveness. J. Urban Des. 2012, 17, 499–510. [Google Scholar] [CrossRef]
  35. Tiemann, T.K.; Scott, A.C.; Atkins, K.N. Sidewalks, Streets and Walkability. Spaces Flows Int. J. Urban Extra Urban Stud. 2012, 2, 41–50. [Google Scholar]
  36. Li, X.; Santi, P.; Courtney, T.K.; Verma, S.K.; Ratti, C. Investigating the association between streetscapes and human walking activities using Google Street View and human trajectory data. Trans. GIS 2018, 22, 1029–1044. [Google Scholar] [CrossRef]
  37. Kelly, C.E.; Tight, M.; Hodgson, F.; Page, M. A comparison of three methods for assessing the walkability of the pedestrian environment. J. Transp. Geogr. 2011, 19, 1500–1508. [Google Scholar] [CrossRef]
  38. Weiss, A.; Hasnine, S.; Martinson, R.; Jadoun, F.; Habib, K.N. Measuring Pedestrians Perceptions of Walkability (breakout presentation). J. Transp. Health 2017, 7, S62–S63. [Google Scholar] [CrossRef]
  39. Zhu, W.; Sun, Y.; Kurka, J.; Geremia, C.; Engelberg, J.K.; Cain, K.; Conway, T.; Sallis, J.F.; Hooker, S.P.; Adams, M.A. Reliability between online raters with varying familiarities of a region: Microscale Audit of Pedestrian Streetscapes (MAPS). Landsc. Urban Plan. 2017, 167, 240–248. [Google Scholar] [CrossRef]
  40. Sun, G.; Webster, C.; Chiaradia, A. Objective assessment of station approach routes: Development and reliability of an audit for walking environments around metro stations in China. J. Transp. Health 2017, 4, 191–207. [Google Scholar] [CrossRef]
  41. Guo, Z.; Loo, B.P. Pedestrian environment and route choice: Evidence from New York City and Hong Kong. J. Transp. Geogr. 2013, 28, 124–136. [Google Scholar] [CrossRef]
  42. González, F.; Melo-Riquelme, C.; de Grange, L. A combined destination and route choice model for a bicycle sharing system. Transportation 2016, 43, 407–423. [Google Scholar] [CrossRef]
  43. Kemperman, A.; Timmermans, H. Influences of built environment on walking and cycling by latent segments of aging population. Transp. Res. Rec. 2009, 2134, 1–9. [Google Scholar] [CrossRef]
  44. Alfonzo, M.; Guo, Z.; Lin, L.; Day, K. Walking, obesity and urban design in Chinese neighborhoods. Prev. Med. 2014, 69, S79–S85. [Google Scholar] [CrossRef] [PubMed]
  45. Clifton, J.K.; Smith, A.D.L.; Rodriguez, D. The development and testing of an audit for the pedestrian environment. Landsc. Urban Plan. 2007, 80, 95–110. [Google Scholar] [CrossRef]
  46. Ye, Y.; Richards, D.; Lu, Y.; Song, X.; Zhuang, Y.; Zeng, W.; Zhong, T. Measuring daily accessed street greenery: A human-scale approach for informing better urban planning practices. Landsc. Urban Plan. 2019, 191, 103434. [Google Scholar] [CrossRef]
  47. Lu, Y.; Sarkar, C.; Xiao, Y. The effect of street-level greenery on walking behavior: Evidence from Hong Kong. Soc. Sci. Med. 2018, 208, 41–49. [Google Scholar] [CrossRef]
  48. Wang, R.; Helbich, M.; Yao, Y.; Zhang, J.; Liu, P.; Yuan, Y.; Liu, Y. Urban greenery and mental wellbeing in adults: Cross-sectional mediation analyses on multiple pathways across different greenery measures. Environ. Res. 2019, 176, 108535. [Google Scholar] [CrossRef] [Green Version]
  49. Jiang, B.; Chang, C.-Y.; Sullivan, W.C. A dose of nature: Tree cover, stress reduction, and gender differences. Landsc. Urban Plan. 2014, 132, 26–36. [Google Scholar] [CrossRef]
  50. Weber, F.; Kowarik, I.; Säumel, I. A walk on the wild side: Perceptions of roadside vegetation beyond trees. Urban For. Urban Green. 2014, 13, 205–212. [Google Scholar] [CrossRef]
  51. Todorova, A.; Asakawa, S.; Aikoh, T. Preferences for and attitudes towards street flowers and trees in Sapporo, Japan. Landsc. Urban Plan. 2004, 69, 403–416. [Google Scholar] [CrossRef]
  52. Vergel-Tovar, E.C.; Rodriguez, D.A. The ridership performance of the built environment for BRT systems: Evidence from Latin America. J. Transp. Geogr. 2018, 73, 172–184. [Google Scholar] [CrossRef]
  53. Cervero, R.; Kockelman, K. Travel demand and the 3Ds: Density, diversity, and design. Transp. Res. Part D Transp. Environ. 1997, 2, 199–219. [Google Scholar] [CrossRef]
  54. Tiwari, G.; Jain, D. Accessibility and safety indicators for all road users: Case study Delhi BRT. J. Transp. Geogr. 2012, 22, 87–95. [Google Scholar] [CrossRef]
  55. Rodríguez, A.D.; Brisson, E.M.; Estupiñán, N. The relationship between segment-level built environment attributes and pedestrian activity around Bogota’s BRT stations. Transp. Res. Part D Transp. Environ. 2009, 14, 470–478. [Google Scholar] [CrossRef]
  56. Dewi, I.D.; Rakhmatulloh, A.R. Connectivity between Pedestrian Ways and BRT Shelter in Banyumanik and Pedurungan, Semarang. Jurnal Teknik Sipil dan Perencanaan 2018, 20, 56–64. [Google Scholar] [CrossRef] [Green Version]
  57. Bocarejo, P.J.; Portilla, I.; Pérez, M.A. Impact of Transmilenio on density, land use, and land value in Bogotá. Res. Transp. Econ. 2013, 40, 78–86. [Google Scholar] [CrossRef]
  58. Duarte, F.; Ultramari, C. Making Public Transport and Housing Match: Accomplishments and Failures of Curitba’s BRT. J. Urban Plan. Dev. 2012, 138, 183–194. [Google Scholar] [CrossRef]
  59. Zhang, M.; Meng, X.; Wang, L.; Xu, T. Transit development shaping urbanization: Evidence from the housing market in Beijing. Habitat Int. 2014, 44, 545–554. [Google Scholar] [CrossRef]
  60. Xu, T.; Zhang, M.; Aditjandra, P.T. The impact of urban rail transit on commercial property value: New evidence from Wuhan, China. Transp. Res. Part A Policy Pract. 2016, 91, 223–235. [Google Scholar] [CrossRef] [Green Version]
  61. Bureau of Statistics. Punjab Development Statistics; Bureau of Statistics: Amritsar, Pakistan, 2017.
  62. Hausman, J.; McFadden, D. Specification Tests for the Multinomial Logit Model. Econom. J. Econom. Soc. 1984, 52, 1219–1240. [Google Scholar] [CrossRef] [Green Version]
  63. Hensher, D.A.; Rose, J.M.; Greene, W.H. Applied Choice Analysis: A Primer; Cambridge University Press: Cambridge, UK, 2005. [Google Scholar]
  64. McFadden, D.; Train, K. Mixed MNL models for discrete response. J. Appl. Econom. 2000, 15, 447–470. [Google Scholar] [CrossRef]
  65. Greene, W.H.; Hensher, D.A. A latent class model for discrete choice analysis: Contrasts with mixed logit. Transp. Res. Part B Methodol. 2003, 37, 681–698. [Google Scholar] [CrossRef]
  66. Lancaster, K.J. A new approach to consumer theory. J. Political Econ. 1966, 74, 132–157. [Google Scholar] [CrossRef]
  67. McFadden, D. Quantitative Methods for Analyzing Travel Behavior of Individuals: Some Recent Developments; Institute of Transportation Studies, University of California Berkeley: Berkeley, CA, USA, 1977; Volume 474. [Google Scholar]
  68. Liu, Y.; Yang, D.; Timmermans, H.J.; De Vries, B. Analysis of the impact of street-scale built environment design near metro stations on pedestrian and cyclist road segment choice: A stated choice experiment. J. Transp. Geogr. 2020, 82, 102570. [Google Scholar] [CrossRef]
  69. Rodríguez, D.A.; Merlin, L.; Prato, C.G.; Conway, T.L.; Cohen, D.; Elder, J.P.; Evenson, K.R.; McKenzie, T.L.; Pickrel, J.L.; Veblen-Mortenson, S. Influence of the built environment on pedestrian route choices of adolescent girls. Environ. Behav. 2015, 47, 359–394. [Google Scholar] [CrossRef] [Green Version]
  70. Rossetti, T.; Saud, V.; Hurtubia, R. I want to ride it where I like: Measuring design preferences in cycling infrastructure. Transportation 2017, 46, 697–718. [Google Scholar] [CrossRef]
  71. Jenks, C. Transit-Oriented Development: Developing a Strategy to Measure Success. Research Results Digest 294; Transportation Research Board of the National Academies: Washington, DC, USA, 2005. [Google Scholar]
  72. Reusser, D.E.; Loukopoulos, P.; Stauffacher, M.; Scholz, R.W. Classifying railway stations for sustainable transitions–balancing node and place functions. J. Transp. Geogr. 2008, 16, 191–202. [Google Scholar] [CrossRef]
  73. Zemp, S.; Stauffacher, M.; Lang, D.J.; Scholz, R.W. Classifying railway stations for strategic transport and land use planning: Context matters! J. Transp. Geogr. 2011, 19, 670–679. [Google Scholar] [CrossRef]
Figure 1. (a) Choice card example for ICHRA; (b) Choice card example for Kalma Chowk.
Sustainability 13 06594 g001aSustainability 13 06594 g001b
Figure 2. (a) Choice card example for Chungi Amarsidhu; (b) Choice card example for Muslim town.
Sustainability 13 06594 g002aSustainability 13 06594 g002b
Figure 3. Case study areas around BRT Corridor; Ichra, Muslim Town, Kalma Chowk, Chungi Amarsidhu.
Sustainability 13 06594 g003
Figure 4. Streetscape environment of case study areas around BRT Corridor: Ichra, Muslim Town, Kalma Chowk, Chungi Amarsidhu.
Sustainability 13 06594 g004
Table 1. Attributes and Attribute Levels for Stated Choice Experiment.
AttributeRelated LiteratureExplanationLevels
Spatial Preferences
Building heights/average number of building floors on street sides [40]
[44]
The average height of the buildings on the sides of streetsLevel 1 = 1–3 floors
Level 2 = 4–6 floors
Level 3 = More than 6 floors
Width of the sidewalk [39]
[41]
[45]
The real width of the pedestrian space as discussed with local stakeholdersLevel 1 = 1 m
Level 2 = 1.5 m
Level 3 = 2 m
Level 4 = No provision
Street greenery [46]
[47]
[48]
[49]
[50]
[51]
The trees and plants along the street including green hedgesLevel 1 = High (horizontal + vertical green)/grass +large trees on both sides of the street and
plants/light trees along the metro line
Level 2 = Medium (horizontal + vertical
green)/grass + light trees on both sides of the
street
Level 3 = Low (horizontal green)/grass on both
sides of the street
Level 4 = No greenery
Parking [52]
[53]
Provision of adequate parking spaces for smoother traffic flowsLevel 1 = Marked parking places on the street
Level 2 = Parking at the multistory parking plazas
Level 3 = Parking plazas + on-street parking
Crossing facilities [54]
[55]
[56]
Mass transit infrastructures like BRT has fragmented the city. Crossing facilities are very importantLevel 1 = Pedestrian crossing bridge every 200 m
Level 2 = Pedestrian crossing bridge every 400 m
Level 3 = Pedestrian crossing Bridge every 600 m
Bicycle path width-Infrastructure for active modes of transport has a vital role in fostering sustainable TODLevel 1 = Bicycle path width: 1.5 m
Level 2 = Bicycle path width: 2 m
Level 3 = Bicycle path width: 2.5 m
Level 4 = Bicycle path: no provision
Spaces for informal sellers-There is demand for informal sellers around most of the transit stationsLevel 1 = Clearly marked spaces on the street for
informal sellers
Level 2 = No spaces
Non-Spatial Preferences
Building type [10]
[57]
The type of land use revitalization users wants to see in the areaLevel 1 = Apartment building
Level 2 = Commercial building
Level 3= Mixed-use building
Preferred housing [58]
[59]
The type of housing projects that could be developed for sustainable Transit-Oriented DevelopmentLevel 1 = Social housing provided by government
(subsidized rents)
Level 2 = Provision of affordable houses on
installments
Level 3 = Houses/apartments developed by the private sector
Preferred commercial use [60]The type of commercial use locals want to see in the areaLevel 1 = Street shops
Level 2 = Shopping centers
Level 3 = Offices
Table 2. Sample Characteristics.
CategoryNumberPercentage
GenderMale55173.27%
Female20126.73%
AgeUnder 2515720.8%
26–3518624.73%
36–4532643.35%
46 or above8311.03%
EducationHigh School/Technical School or below58978.32%
University/College14118.75%
Master’s degree or higher222.92%
Place of ResidenceCity46862.23%
Suburb17122.73%
Rural area11315.02%
Current Status around BRT StationProperty owner (commercial building user)11114.7%
Tenant (commercial building user)14118.75%
Resident (residential building user)25233.51%
Only BRT user visitor/customer24832.97%
Table 3. Model Estimation Results.
ICHRA and Chungi Amar Sidhu Station Kalma Chowk and Muslim Town Station
ResidentsCommercial Building UsersOnly BRT UsersCommercial Building UsersResidentsOnly BRT Users
Parameter
(Robust t-Value)
Parameter
(Robust t-Value)
Building Height: 1–3 floors2.61 **
(3.4)
0.84 **
(2.68)
1.38 *
(2.29)
−0.967
(−1.61)
−1.13 *
(−2.05)
−1.58 **
(−2.67)
Building Height: 4–6 floors1.11 *
(2.52)
3.93 **
(3.21)
1.97 **
(4.2)
−2.513 **
(−3.06)
1.56 **
(3.45)
−1.36 **
(−2.42)
Building Height: More than 6 floors(−3.72)(−4.77)(−3.35)(3.12)(−0.43)(2.94)
Sidewalk Width = 2 m2.28 **
(3.12)
1.97 **
(2.78)
2.05 **
(3.45)
2.02 **
(3.07)
2.17 **
(3.93)
2.52 **
(3.09)
Sidewalk Width = 1.5 m1.64 **
(3.15)
1.47 **
(2.76)
1.22 **
(3.43)
1.28 *
(1.97)
1.41 **
(2.53)
1.67
(1.17)
Sidewalk Width: 1 m1.73 *
(2.15)
1.55 *
(2.41)
−0.034
(0.32)
0.415
(0.186)
0.0381
(0.187)
−0.0509
(0.277)
Sidewalk = No provision(−5.65)(−4.99)(−3.27)(−3.715)−(3.618)(−4.18)
Street Greenery: High (horizontal + vertical green)/grass + large trees on both sides of the street and plants/light trees along the metro line1.69 **
(2.92)
1.53 **
(2.70)
1.12 **
(2.53)
1.25 **
(2.60)
1.31 **
(3.28)
1.54 **
(4.38)
Street Greenery: Medium (horizontal + vertical
green)/grass + light trees on both sides of the street
1.46 *
(2.19)
1.33 *
(1.96)
0.971
(1.64)
0.813 *
(2.07)
0.895 **
(2.58)
1.03 *
(2.27)
Street Greenery = Low (horizontal green)/grass on both sides of the street0.74 **
(1.97)
0.744
(1.69)
0.045
(0.254)
0.348
(0.201)
0.035
(0.184)
0.0486
(0.291)
Level 4 = No greenery(−3.89)(−3.66)−2.136(−2.411)(−2.24)(−2.61)
Parking: Marked parking places on the street1.31
(1.74)
−1.18
(−1.58)
0.128
(0.604)
−1.16
(0.373)
0.109 **
(2.75)
−0.15
(−0.683)
Parking: Parking at the multistory parking plazas1.72 **
(3.3)
1.54 *
(2.54)
0.937 *
(2.06)
−1.42
(0.64)
0.857
(1.64)
−0.984
(−5.78)
Parking: Parking plazas + on-street parking(−4.03)(0.36)(−1.065)(2.58)(−0.966)(1.134)
Crossings = Pedestrian crossing bridge every 200 m2.42 *
(2.13)
1.11
(1.87)
1.03 **
(3.95)
0.846 **
(2.75)
0.929 **
(3.26)
1.08 **
(4.74)
Crossings = Pedestrian crossing bridge every 400 m−1.24 *
(−1.67)
1.18 **
(3.14)
0.034
(0.321)
0.041
(0.186)
0.0381
(0.187)
0.0509
(0.277)
Crossings = Pedestrian crossing bridge every 600 m(−3.66)(−3.49)(−1.064)−0.887(−0.967)(−1.130)
Level 1 = Clearly marked spaces on the street for informal sellers2.81 *
(2.97)
2.58 *
(2.48)
2.32 *
(2.57)
−2.59 *
(−2.75)
2.79 **
(3.82)
−0.705 *
(−2.10)
Level 2 = No spaces−2.81(−2.58)(−2.32)(2.59)(−2.79)(0.705)
Bicycle Path Width: 1.5 m1.71 **
(2.13)
1.54 **
(2.82)
1.22 **
(2.91)
1.28 **
(2.60)
1.41 **
(3.48)
1.67 *
(2.43)
Bicycle Path Width: 2 m2.01 **
(2.88)
1.82 **
(2.24)
0.0798
(1.11)
0.076
(0.625)
0.0738
(0.272)
0.995
(0.396)
Bicycle Path Width: 2.5 m0.941
(1.33)
0.912
(1.32)
0.937
(0.59)
0.771
(1.64)
0.857
(1.84)
0.984
(1.78)
Bicycle Path: No provision(−4.661)(−4.272)(−2.236)(−2.127)(−2.34)(−3.649)
Building Type = Apartment building0.97
(1.08)
0.874
(0.784)
1.16 **
(2.48)
−2.04 *
(−2.44)
1.34 **
(3.04)
−1.59 **
(−3.84)
Building Type = Mixed-use building1.34 **
(3.35)
1.26 *
(1.98)
−1.06
(−2.51)
−1.32 *
(−2.06)
1.45 **
(2.68)
−1.72 **
(−3.71)
Building Type = Commercial building(-2.31)(-2.13)(-0.10)(3.36)(-2.79)(3.31)
Housing Provision = Social housing provided by government (subsidized rents)3.22 **
(2.62)
2.97 **
(2.71)
3.15 **
(2.78)
3.18 *
(2.16)
3.39 **
(2.79)
3.97 **
(3.35)
Housing Provision = Provision of affordable houses on installments0.96
(0.831)
1.865 *
(2.57)
-0.329
(-0.159)
0.177
(1.36)
0.247
(0.196)
0.295
(0.242)
Housing Provision = Houses/apartments developed by the private sector(−4.18)(−3.83)(0.014)(−3.35)(−3.637)(−4.265)
Preferred Commercial Use = Street shops2.45 **
(3.34)
1.12
(0.991)
0.346
(0.903)
−0.057
(0.0519)
0.394
(0.657)
0.496
(1.16)
Preferred Commercial Use = Shopping centers1.23
(1.17)
2.23 **
(2.991
2.70 **
(7.56)
3.28 **
(4.03)
2.68 **
(6.43)
3.46 **
(8.34)
Preferred Commercial Use = Offices(−3.68)(−3.35)−3.046(−3.233)(−3.074)−3.95
Note: t-value in parentheses. ** indicates significance at the 1% level. * indicates significance at the 5% level.
Publisher’s Note: MDPI stays neutral with regard to jurisdictional claims in published maps and institutional affiliations.

