Article

Hybrid Forecasting Methodology for Wind Power-Photovoltaic-Concentrating Solar Power Generation Clustered Renewable Energy Systems

1
Department of Electrical Engineering, College of Electrical Engineering, Sichuan University, Chengdu 610000, China
2
State Grid Gansu Electric Power Company, Lanzhou 730000, China
*
Author to whom correspondence should be addressed.
Sustainability 2021, 13(12), 6681; https://0-doi-org.brum.beds.ac.uk/10.3390/su13126681
Submission received: 14 April 2021 / Revised: 14 May 2021 / Accepted: 29 May 2021 / Published: 11 June 2021
(This article belongs to the Special Issue Advances in Sustainable Electrical Engineering)

Abstract

:
Forecasting of large-scale renewable energy clusters composed of wind power generation, photovoltaic and concentrating solar power (CSP) generation encounters complex uncertainties due to spatial scale dispersion and time scale random fluctuation. In response to this, a short-term forecasting method is proposed to improve the hybrid forecasting accuracy of multiple generation types in the same region. It is formed through training the long short-term memory (LSTM) network using spatial panel data. Historical power data and meteorological data for CSP plant, wind farm and photovoltaic (PV) plant are included in the dataset. Based on the data set, the correlation between these three types of power generation is proved by Pearson coefficient, and the feasibility of improving the forecasting ability through the hybrid renewable energy clusters is analyzed. Moreover, cases study indicates that the uncertainty of renewable energy cluster power tends to weaken due to partial controllability of CSP generation. Compared with the traditional prediction method, the hybrid prediction method has better prediction accuracy in the real case of renewable energy cluster in Northwest China.

1. Introduction

As the energy crisis intensifies, renewable energy sources such as wind and solar energy as have been widely concerned. According to statistics, the world’s wind power generation in 2020 reached 733 GW which increased by 17.8% over 2019. The world’s solar power generation in 2020 reached 714 GW and increased by 21.6% over last year [1]. In fact, both wind and photovoltaic (PV) power generation are fluctuant and intermittent. High renewable energy penetrated power systems bring severe challenges to security and economy of the power grid [2]. As a result, under the premise of ensuring the economic and stable operation of the power grid, we should improve the ability of the power grid to penetrate more renewable energy.
In order to meet this requirement, on the one hand, energy storage devices can be installed on the grid side, such as concentrating solar power (CSP) with heat storage [3,4]. On the other hand, according to the complementary and smoothness of wind and solar energy [5,6], it is also an effective means to raise the renewable energy penetration by bundling multiple types of renewable energy in the same region [
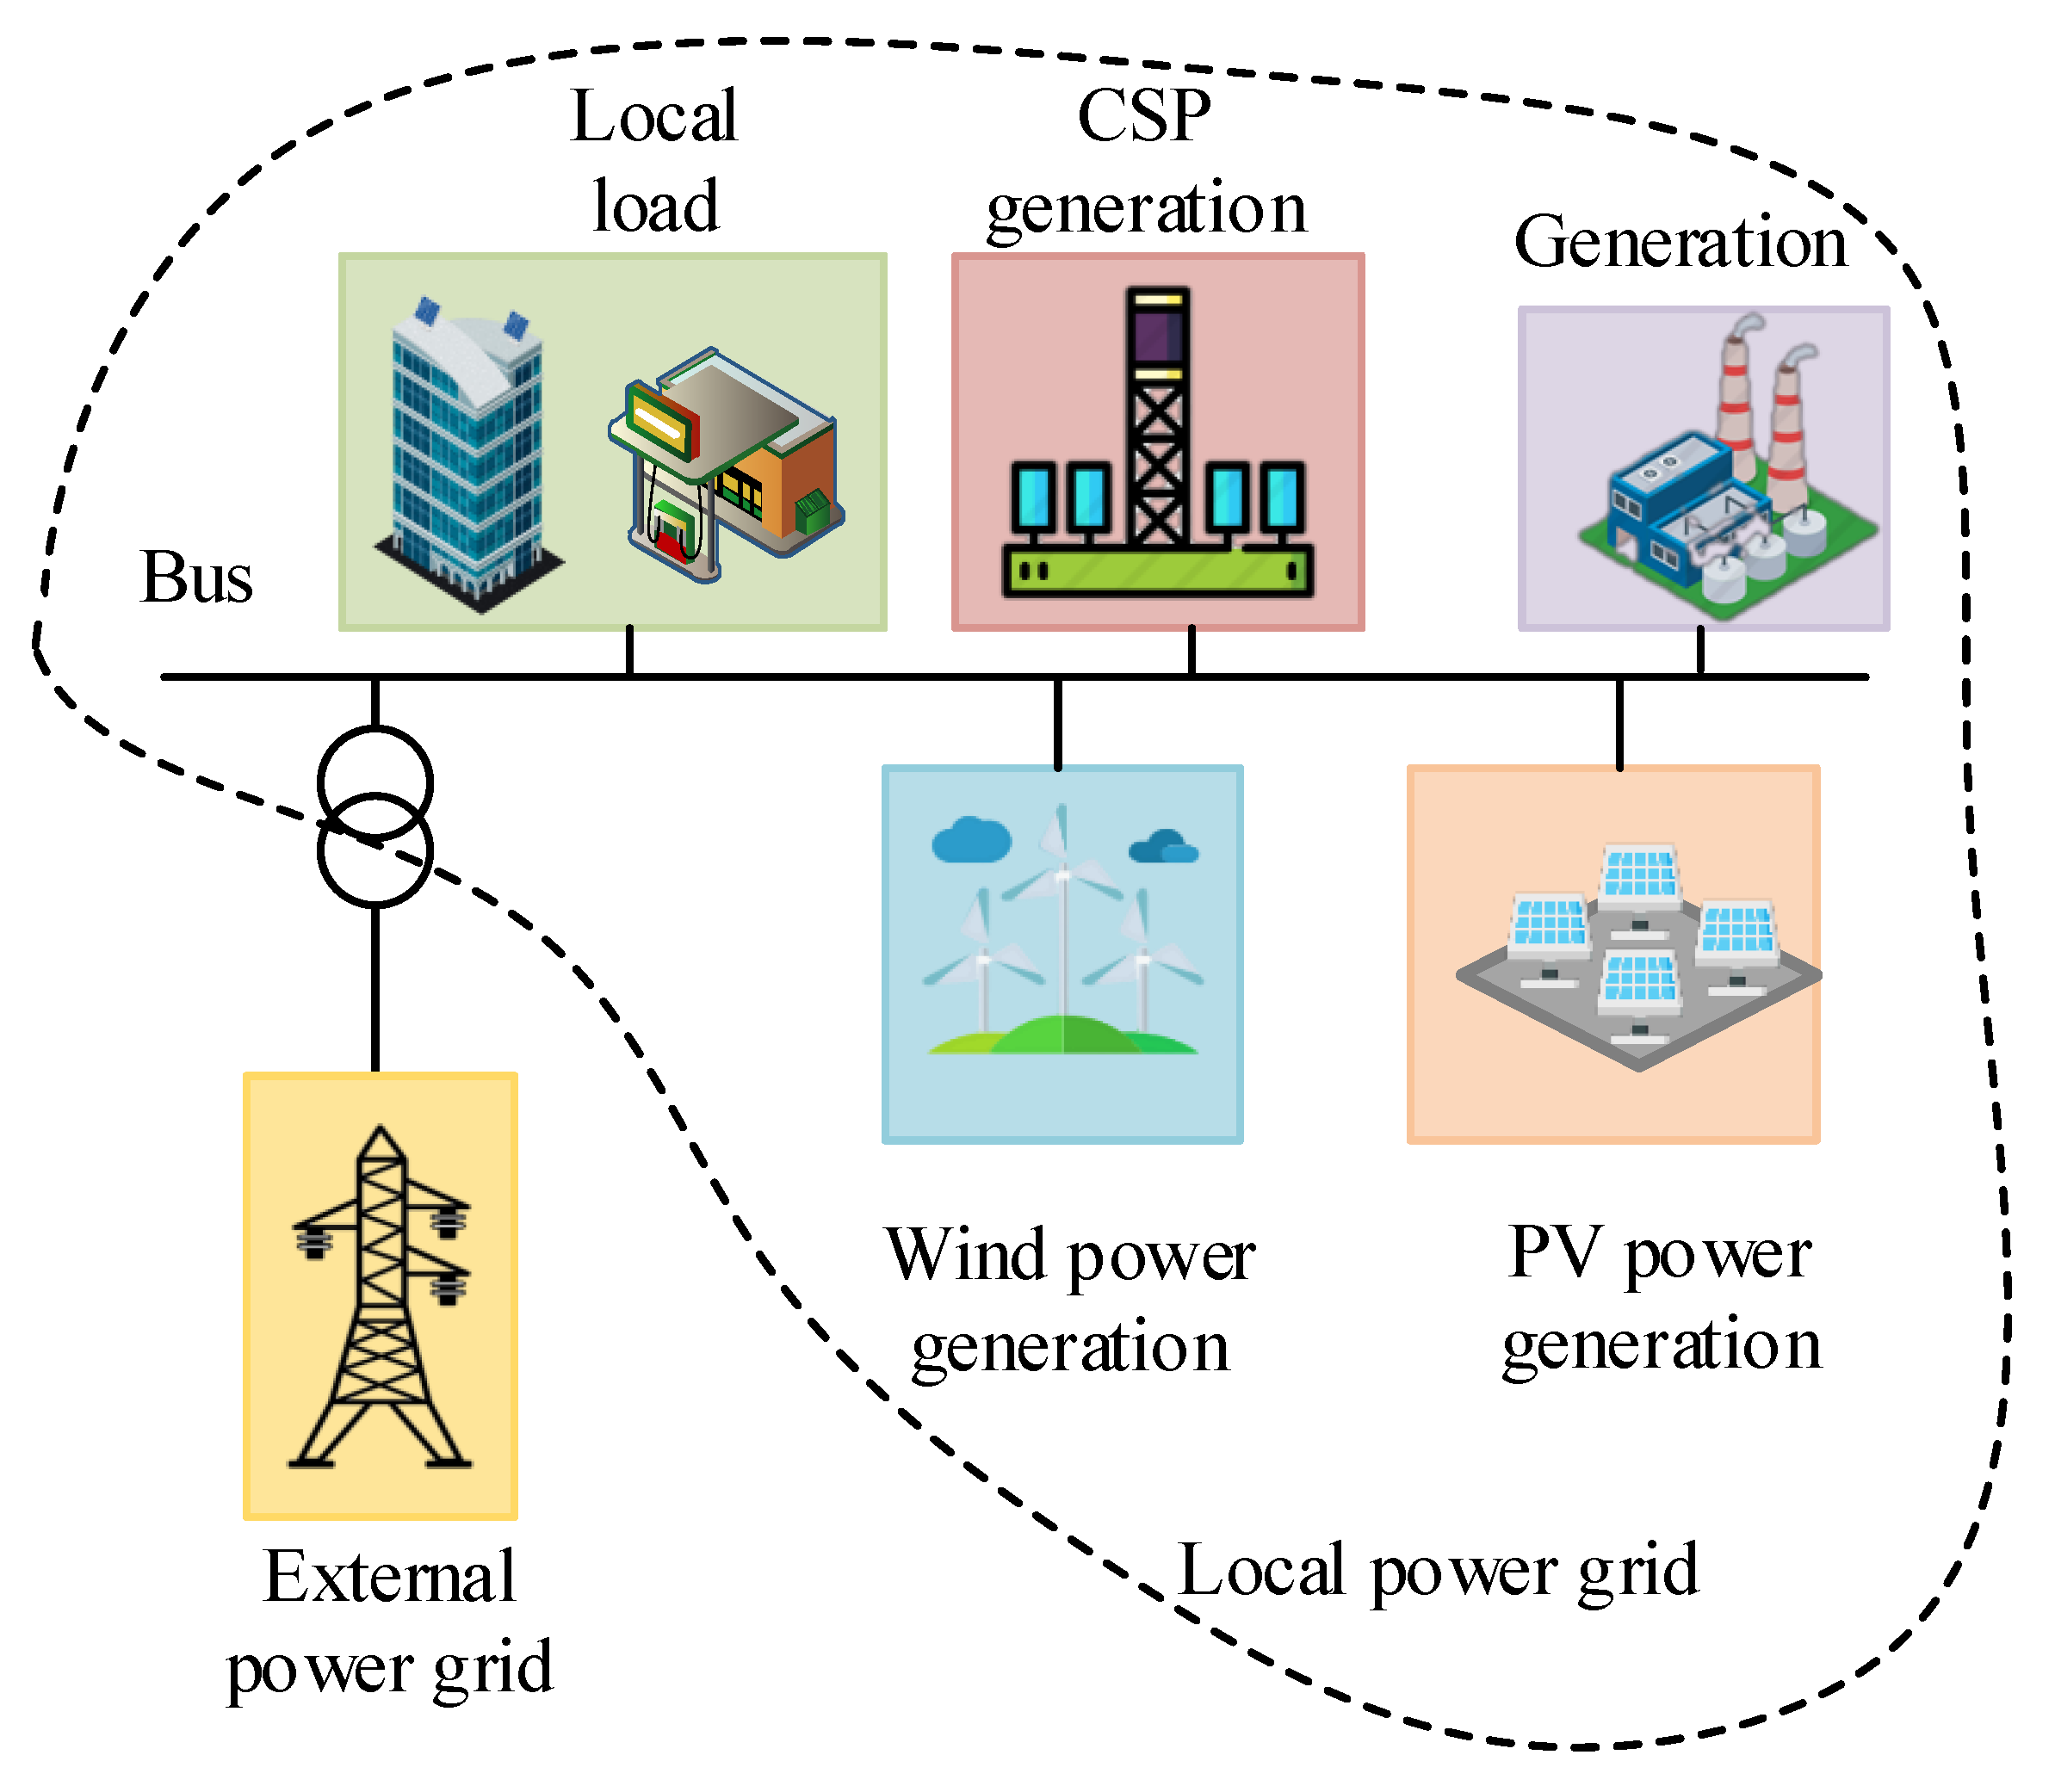
7]. Nevertheless, CSP and bundling grid connection methods cannot guarantee the stability of renewable energy generation. Moreover, CSP, wind power and PV power are intermittent, random, and difficult to predict accurately, which lead to more complex uncertainty of power generation cluster and more obvious time and space complementary of power generation. In the context of large scale and multi-types renewable energy clusters, it is necessary to explore the change regularities of regional renewable generation and forms a power forecasting method which is suitable for wind power, PV power and CSP cluster.
With the improvement of computer operation speed, more machine learning and artificial intelligence approaches have been used in forecasting. Normally, compared with the statistical and physical forecasting approaches, machine learning approaches can get better results [8,9,10]. However, machine learning needs a large amount of data in the training process, and the model with large fluctuation of training data is easy to over fit [11,12,13]. Ahmed et al. [14] summarize the recent photovoltaic power forecasting (PVF) methods including physical, statistical, artificial intelligence, ensemble and hybrid approaches, the results show that the ensembles of artificial neural network (ANN) is most suitable for short-term PVF. Ding [15] summarizes and compares several common forecasting methods of wind power generation (WPG) such as the autoregressive integrated moving average (ARIMA) model, Kalman filter (KF), support vector machine (SVM) and ANN. The main advantage of ANN is its ability to study and deal with nonlinearity in WPG data. In order to find a more suitable power generation forecasting method, Sharifzadeh et al. [
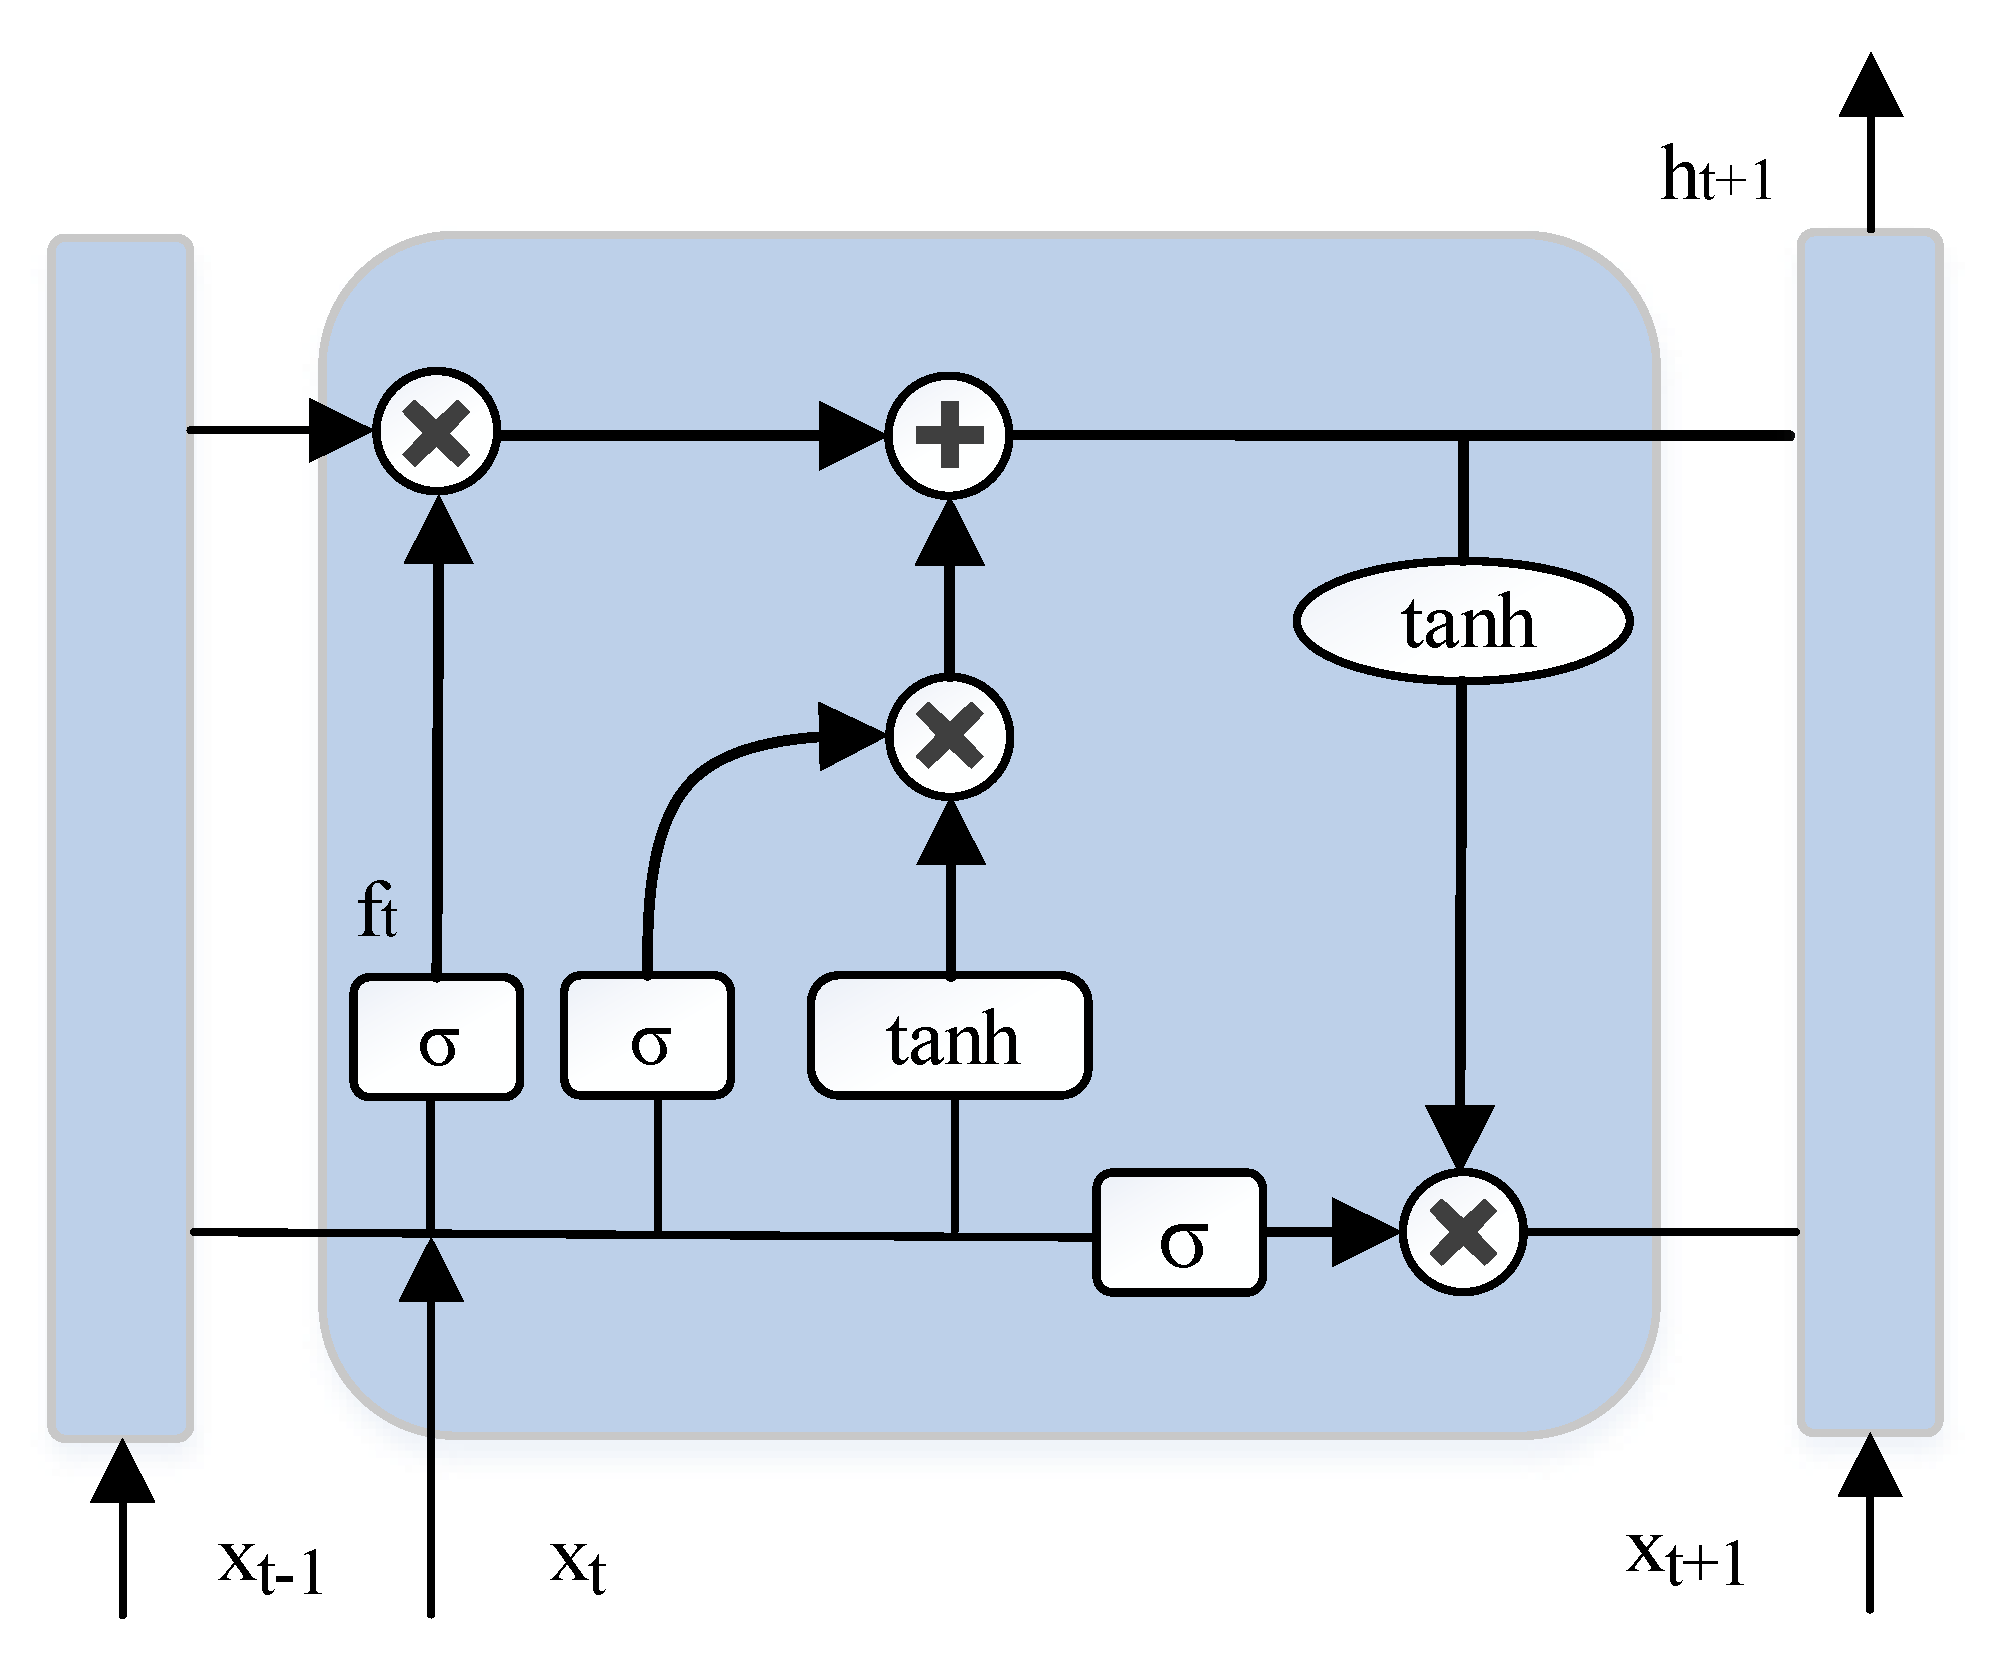
16] compared ANN, SVM and Gaussian process regression. All these models can forecast wind and solar power, but only the ANN can successfully consider the electricity demand. Although ANN can analyze time series data, when the time series is too long, the forecast accuracy is low. In order to solve this problem, a long short-term memory (LSTM) based on gating unit is proposed [17]. Because of its unique structural characteristics, LSTM has great advantages in processing long time series such as renewable energy generation data. Considering that LSTM can extract and learn the correlation in hours of solar data and even longer term information, Wang et al. [18] proposed a hybrid forecasting strategy which combines LSTM with Gaussian process regression. The results show that this method is better than SVM and other methods in WPG forecasting. Besides, renewable energy may have great changes in different seasons and weather conditions. When the data set is insufficient, the change of weather and season is often ignored in renewable energy forecasting [9]. For example, if the model is trained with the data in summer, the forecasting performance of the model may be better in summer, but it is not sure that the model has the same performance in winter [19]. That’s why we should consider the applicability of the LSTM model. Nevertheless, these methods independently forecast one type of power generation such as PV or WPG. The authors in [20] propose that ANN can be used to forecast hybrid renewable energy systems. By comparison, LSTM has better performance than multi-layer perceptron (MLP) and other simple ANN in forecasting of hybrid renewable energy systems.
In traditional regional prediction models, most of them are renewable energy generation predictions of the same power generation type [21]. The combined prediction of multiple units greatly improves the accuracy of the prediction model [22]. Consider the application scenarios of renewable energy clusters with multiple power generation types are common in these days [23]. The wind power and PV power generation can be predicted separately, and then the regional power can be obtained by simple accumulation. Because of the complementary between solar and wind energy, when wind turbines and photovoltaic power plants are built in a power plant or region, the combined use of wind and solar data can improve the accuracy of prediction [24,25]. When there is CSP in the area, there is a strong trend correlation between CSP and PV power generation [26]. Due to the flexibility of CSP power generation, the uncertainty of photovoltaic power generation and wind power can be weakened to a certain extent [27,28]. With this just the opposite is, the nonlinear relationship between CSP generation and the other two types of renewable energy power generation is more complicated. For renewable energy clusters including CSP generation, the applicability of typical statistical method and cumulative method cannot be guaranteed.
In view of the above concerns, this paper proposes a short-term hybrid prediction model based on LSTM neural network. In this way, the spatial and temporal complementary characteristics of different units are deeply explored. The advantages and disadvantages of bundling prediction of various types of renewable energy are compared with the traditional independent prediction. Finally, a short-term hybrid prediction model based on LSTM is established. The research work shows that the method can effectively describe the complex uncertainty of the large-scale and multiple types renewable energy, which has great advantages in renewable energy cluster forecasting. The rest of this paper is summarized as follows: The second part introduces the renewable power generation cluster including CSP generation and the structure of LSTM neural network. Part III describes the construction process of short-term hybrid prediction model based on LSTM neural network. In the fourth part, through the measured data of a certain region in China, the method proposed in this paper is compared with traditional independent prediction method. Finally, the main contributions are summarized in Part V.

2. Materials and Methods

2.1. Wind Power-Photovoltaic-Concentrating Solar Power Cluster

In CSP, wind power and PV power cluster, according to the local power characteristics and climate complementation, the establishment of wind and photovoltaic power cluster can effectively realize the complementary of wind and solar energy [29]. Wind speed and direct normal irradiance (DNI) are meteorological data, which have generating fluctuation in day-night and seasonal cycle. Thus, wind power and photovoltaic power generation are complementary in time. In the hybrid power generation cluster, integrated energy complementary power generation can effectively improve the new energy consumption capacity of power system [30].
At the same time, the CSP generation with adjustable power is mixed in the cluster, which can greatly improve the stability and smoothness of the hybrid cluster power [28]. In the daytime, in addition to normal power generation according to the electricity demand, CSP generation also stores the remaining heat of power generation through the heat storage device, and then generates power by the heat storage device in the case of no sunshine at night, rainy days, etc. This makes the CSP generation units can maintain continuous and stable power supply, which is better than wind power generation and PV power generation. The increase of the proportion of CSP generation will alleviate the negative impact of the renewable energy penetrate to the grid.
A wind power-photovoltaic-concentrating solar power (Wind-PV-CSP) generation cluster will still have a certain impact on the grid, because the integration of a variety of renewable energy brings more complex uncertainty. Although the uncertainty between different renewable energy sources can be offset to reduce the uncertainty after the cluster, it is difficult to judge the uncertainty after the cluster. Part of the uncertainty is offsets and part of the uncertainty is further enhanced. As a result, it is more difficult to predict the power of hybrid generation cluster. The operation of this type of hybrid generation cluster is shown in Figure 1.
In renewable energy cluster, photovoltaic power generation, wind power generation are generally regulated by CSP generation whose power is partially controllable [31], so it is rare to make independent prediction of CSP generation. In fact, the generation of CSP always changes with the generation of other renewable energy. Therefore, when considering the power prediction of renewable energy cluster including CSP, there is a certain correlation between the generation of CSP and other renewable energy generation types. Different from the traditional independent prediction, the new input data of spatial location relationship is included in the hybrid prediction of renewable energy cluster. The spatial location relationship between different renewable energy power generations can be expressed mathematically by the Pearson coefficient.

2.2. LSTM Network

LSTM forms the repeating module through three gates (forge gate, input gate, output gate) and a memory unit (cell). The structure of LSTM is shown in Figure 2. The following part gives a brief introduction to the structure of long-term memory and short-term memory.
  • Short-term memory
In terms of bionics, forgotten gate plays an important role in the model’s short-term memory. It can “forget” the unimportant information in time series data processing. Like our short term memory, these useless data are quickly forgotten by the LSTM. From the viewpoint of mathematics, forgotten gate is the reduction of xt and ht-1. If xt contains important information, the value of σ and ft are both close to 0. On the contrary, the value of σ and ft are both close to 1:
f t = σ ( W f × [ h t - 1 , x t ] + b f )
where xt is the input of LSTM at time t, ht−1 is the output of LSTM at time t − 1, ft is the output of forgotten gate at time t, the square brackets indicate that two vectors are joined together, Wf is the weight matrix of the gate layer that is forgotten, σ is the sigmoid function, and bf is the bias term of the forgotten gate layer.
  • Long-term memory
From the viewpoint of bionics, input gate and memory unit give LSTM the ability of long-term memory. Unlike the forgotten gate, the function of input gate and memory unit is “remember”. Some important information is stored in the memory unit through the input gate. Like humans’ long-term memory, these useful data have been stored in LSTM for a long time. Input gate determines how much xt of the network is saved in the memory unit Ct. If the input xt has no useful information, the value of σ and it are close to 0. Conversely, the value of σ and it are close to 1. The mathematical Equation (2) of the input gate is as follows:
i t = σ ( W i × [ h t - 1 , x t ] + b i )
where it is the input of input gate at time t, Wi is the weight matrix of the first part, and bi is the input gate layer bias terms.
The old information Ct−1 and the new information Ct are stored in memory unit. The mathematical Equation (3) of memory unit is as follows:
C t = f t × C t - 1 + i t × C ˜ t
LSTM has great advantages in forecasting WPG or PV power generation, which has been confirmed by many ways [32,33]. Nevertheless, there are few studies on hybrid forecasting by LSTM.

3. Analysis and Models

3.1. Hybrid Forecasting of Different Generation Types

A special case of PV-CSP complementary generation system is given to prove the advantage of LSTM in hybrid forecasting. It is assumed that the CSP model has enough energy storage capacity. In order to balance the intermittent and fluctuation of PV generation, CSP plant with heat storage device stores energy during the day and releases energy at night. The power generation of CSP plant in one day is shown in Figure 3. Where, blue curve and red curve show the DNI and PV power generation during the day respectively. The yellow curve represents the power generated by CSP when it is independently generated, and the purple curve represents the power generated by CSP in complementary generation system.
It is clear that the power of CSP in the complementary generation system has a long time lag, which is often has a serious impact on the short-term forecast. Because of the short-term memory, recurrent neural network (RNN) cannot get enough effective components from the daytime DNI. In this case, a complex artificial intelligence model is not even as effective as the simple physical model. Actually, the LSTM network has achieved good results in processing long time series. LSTM network can “remember” enough information from the input data in the daytime, and forecast the power of CSP at night.

3.2. Data and Correlation Analysis

The model proposed in this paper takes the renewable hybrid generation system in the northwest of China as the research object. Hybrid generation in the region consists of a PV plant, a CSP plant and a wind farm. Their capacities are 40 MW, 20 MW and 100 MW, respectively. The data set used in Section III and IV are all from this region. This data set includes not only the power data of each unit, but also some meteorological parameters including wind speed and DNI. All the data in the data set reserves a decimal fraction while recording, and the temporal resolution is one hour. The time scale of this data set is one year, so the data set can be considered seasonal. Through reasonable arrangement of training samples and test samples, the applicability of the method in different seasons can be proved.
Descriptive statistics is used to reflect the basic situation of each member variable in the data set and recorded in Table 1, such as maximum value (MAX) and minimum value (MIN), average (AVE), standard deviation (STD). MAX and MIN are used to represent the upper and lower limits of the member variables. AVE is used to describe the average level by each type of data in the year. STD is used to describe the degree of dispersion.
Before modeling, correlation among different variables should be analyzed [34]. Compared with meteorological variables, we are more concerned about whether there is significant correlation among different types of power generation. Based on a large number of actual data, the correlation analysis method of Pearson coefficient is used to analyze the correlation among three types of power generation and meteorological variables. Record the obtained results in Table 2. The calculation method of Pearson coefficient is shown in the following:
P C C = i = 1 N ( X i - X a v e ) ( Y i - Y a v e ) i = 1 N ( X i - X a v e ) 2 i = 1 N ( Y i - Y a v e ) 2
where PCC is the Pearson correlation coefficient among different data types, Xi and Yi are two different data types at the i moment, Xave and Yave are the mean values of Xi and Yi respectively, and N is the length of the series.
According to the results in Table 2, it is quite obvious that PV and DNI have a high degree of correlation, and the Pearson coefficient between them is more than 0.9. Significant correlation is also found between WPG and wind. There is a certain correlation among the three types of power generation. The correlation coefficient between PV and WPG was 0.42, that between CSP and PV was 0.38, and that between CSP and WPG was 0.11. The reasons for the correlation are as follows:
(1)
Because wind speed and DNI are correlated meteorological variables, there is a weak correlation between WPG and PV. During the day, the DNI is high and the wind speed is often weak. After the sun sets at night, the wind speed is strengthened because of the great change of the surface temperature. Besides, the wind speed is often higher on rainy days than on sunny days. What’s more, In China’s monsoon climate region, generally, wind speed and DNI are complementary in season. In short, it is precisely because of these meteorological correlations that WPG and PV power generation show a certain correlation.
(2)
DNI is the main meteorological variable determining PV and CSP power generation, so there is a trend correlation between PV and CSP. The correlation is very strong when there is no power compensation.
(3)
In the hybrid power generation system, CSP is used to compensate for the fluctuation of PV and WPG generation, so there is a certain negative correlation between the generation of CSP and the other two types of generation.
(4)
The three types of power generation may be affected by temperature, air pressure, humidity and other meteorological factors at the same time. There is a certain coupling relationship among the three types of power generation.
All in all, we believe that there are complex but close correlations among the three types of power generation. We think that the hybrid forecasting of different generation types can make good use of these correlations, so as to improve the forecasting ability of the model.

3.3. Modeling Process

The modeling process of the hybrid forecasting method based on LSTM is shown in Figure 4. The modeling process is mainly composed of preprocessing, modeling, testing and evaluating, which will be introduced in the following.
The data set including meteorological data and power data cannot be directly used for power forecasting, which means it is necessary to perform some preprocessing operations on the dataset, such as normalization and correction. Correction is mainly used to identify and eliminate the influence of abnormal data. Suppose data P(t) represents the value of dataset P at time t. On the one hand, the missing data P(t) is completed by interpolation. On the other hand, if the value of P(t) is not in the range [1.5 × P(t − 1) − 0.5 × P(t + 1), 1.5 × P(t + 1) − 0.5 × P(t − 1)], P(t) is considered as an outlier. Outliers are removed and replaced by interpolation. Besides, data normalization should be performed. After data normalization, the neural network is easier to converge to the optimal solution in the training process. From the mathematical point of view, normalization is a linear transformation of the original data. In this way, the original data is mapped to the interval [0,1]. The normalization formula is as follows:
x ' = x A m i n A m i n m a x
where Amax and Amin are the maximum and minimum values of data type A, x is the original value of A, x’ is the normalized value of x.
Correlation of generation power in renewable energy cluster is related to spatial location and temporal change [35], in order to describe input data from two aspects of time scale and spatial dimension, spatial panel data can be used for modeling. The normalized data are directly used to form spatial panel data and spatial panel data is used to train neural network. The training data is mainly used to train the parameters of LSTM. Validation data is actually a set of samples that used to verify the performance of different models. The different models here are mainly refer to the different super parameters. It can also be said that the role of validation data is to adjust the model parameters. Usually, LSTM will not use all the data in network training and parameters adjusting. Instead, part of the data that does not participate in the training are used to the network testing. For this data set, 11 months of data are used to model and 1 month of data are used to test the effect of the proposed method.
For a trained LSTM, test set is used to objectively evaluate the performance of the network. Nevertheless, the results are not convincing if we only use the data from a certain season. We cannot guarantee the model will have the same effect in other test samples, for example, in different seasons. Cross validation is used to ensure that the model has sufficient applicability. It can objectively judge the compliance degree of LSTM to the data outside the training set. The core idea of cross validation is to use different months to test and the remaining months to train LSTM. The specific arrangement is shown in Table 3.
Generally, there are three standards for evaluate, including root mean squared error (RMSE), mean absolute error (MAE) and mean absolute percentage error (MAPE). RMSE is used to measure the deviation between the forecasting value and the true value. MAE can avoid the problem of offsetting the positive and negative errors, so it can accurately reflect the actual forecasting error. In this paper, we only consider the RMSE of the forecast results when evaluating the results. Because each error in RMSE is square and the outliers have a greater impact on the RMSE. The reason why MAPE is not selected in this paper is that some data in the dataset is equal to 0 and MAPE is not available. As an evaluation index, RMSE can guarantee the forecasting accuracy of the forecasting model in special weather. The Equation for PRMSE is as follows:
P R M S E = i = 1 N ( P M i - P P i ) 2 n
where PMi is the observed power of i time, PPi is forecasting power of i time, n is the number of samples.
Because of different generation capacity, the true value is not comparable. To solve this problem, we calculate the unit value of RMSE, which called PRMSE%:
P R M S E % = P R M S E P N
where PN is the rated power of renewable energy power generation.

4. Experimental Results and Analysis

4.1. Case Setup

In addition to theoretical analysis, the effectiveness of the method needs to be verified by cases. Section 3.2 analyzes the correlation among the three types of power generation, and it should be proved by an example that the forecasting efficiency can be significantly improved by hybrid forecasting among the generation types with correlation. On this basis, Wind-PV-CSP hybrid generation bundled into the power system are superior is verified by the evaluation of hybrid forecasting, partial hybrid forecasting and independent forecasting. Finally, the correctness of Section 2 theory should be proved by comparative experiments. In the hybrid forecasting of multiple renewable energy sources, LSTM network do better than the traditional RNN network.
(1)
Case 1
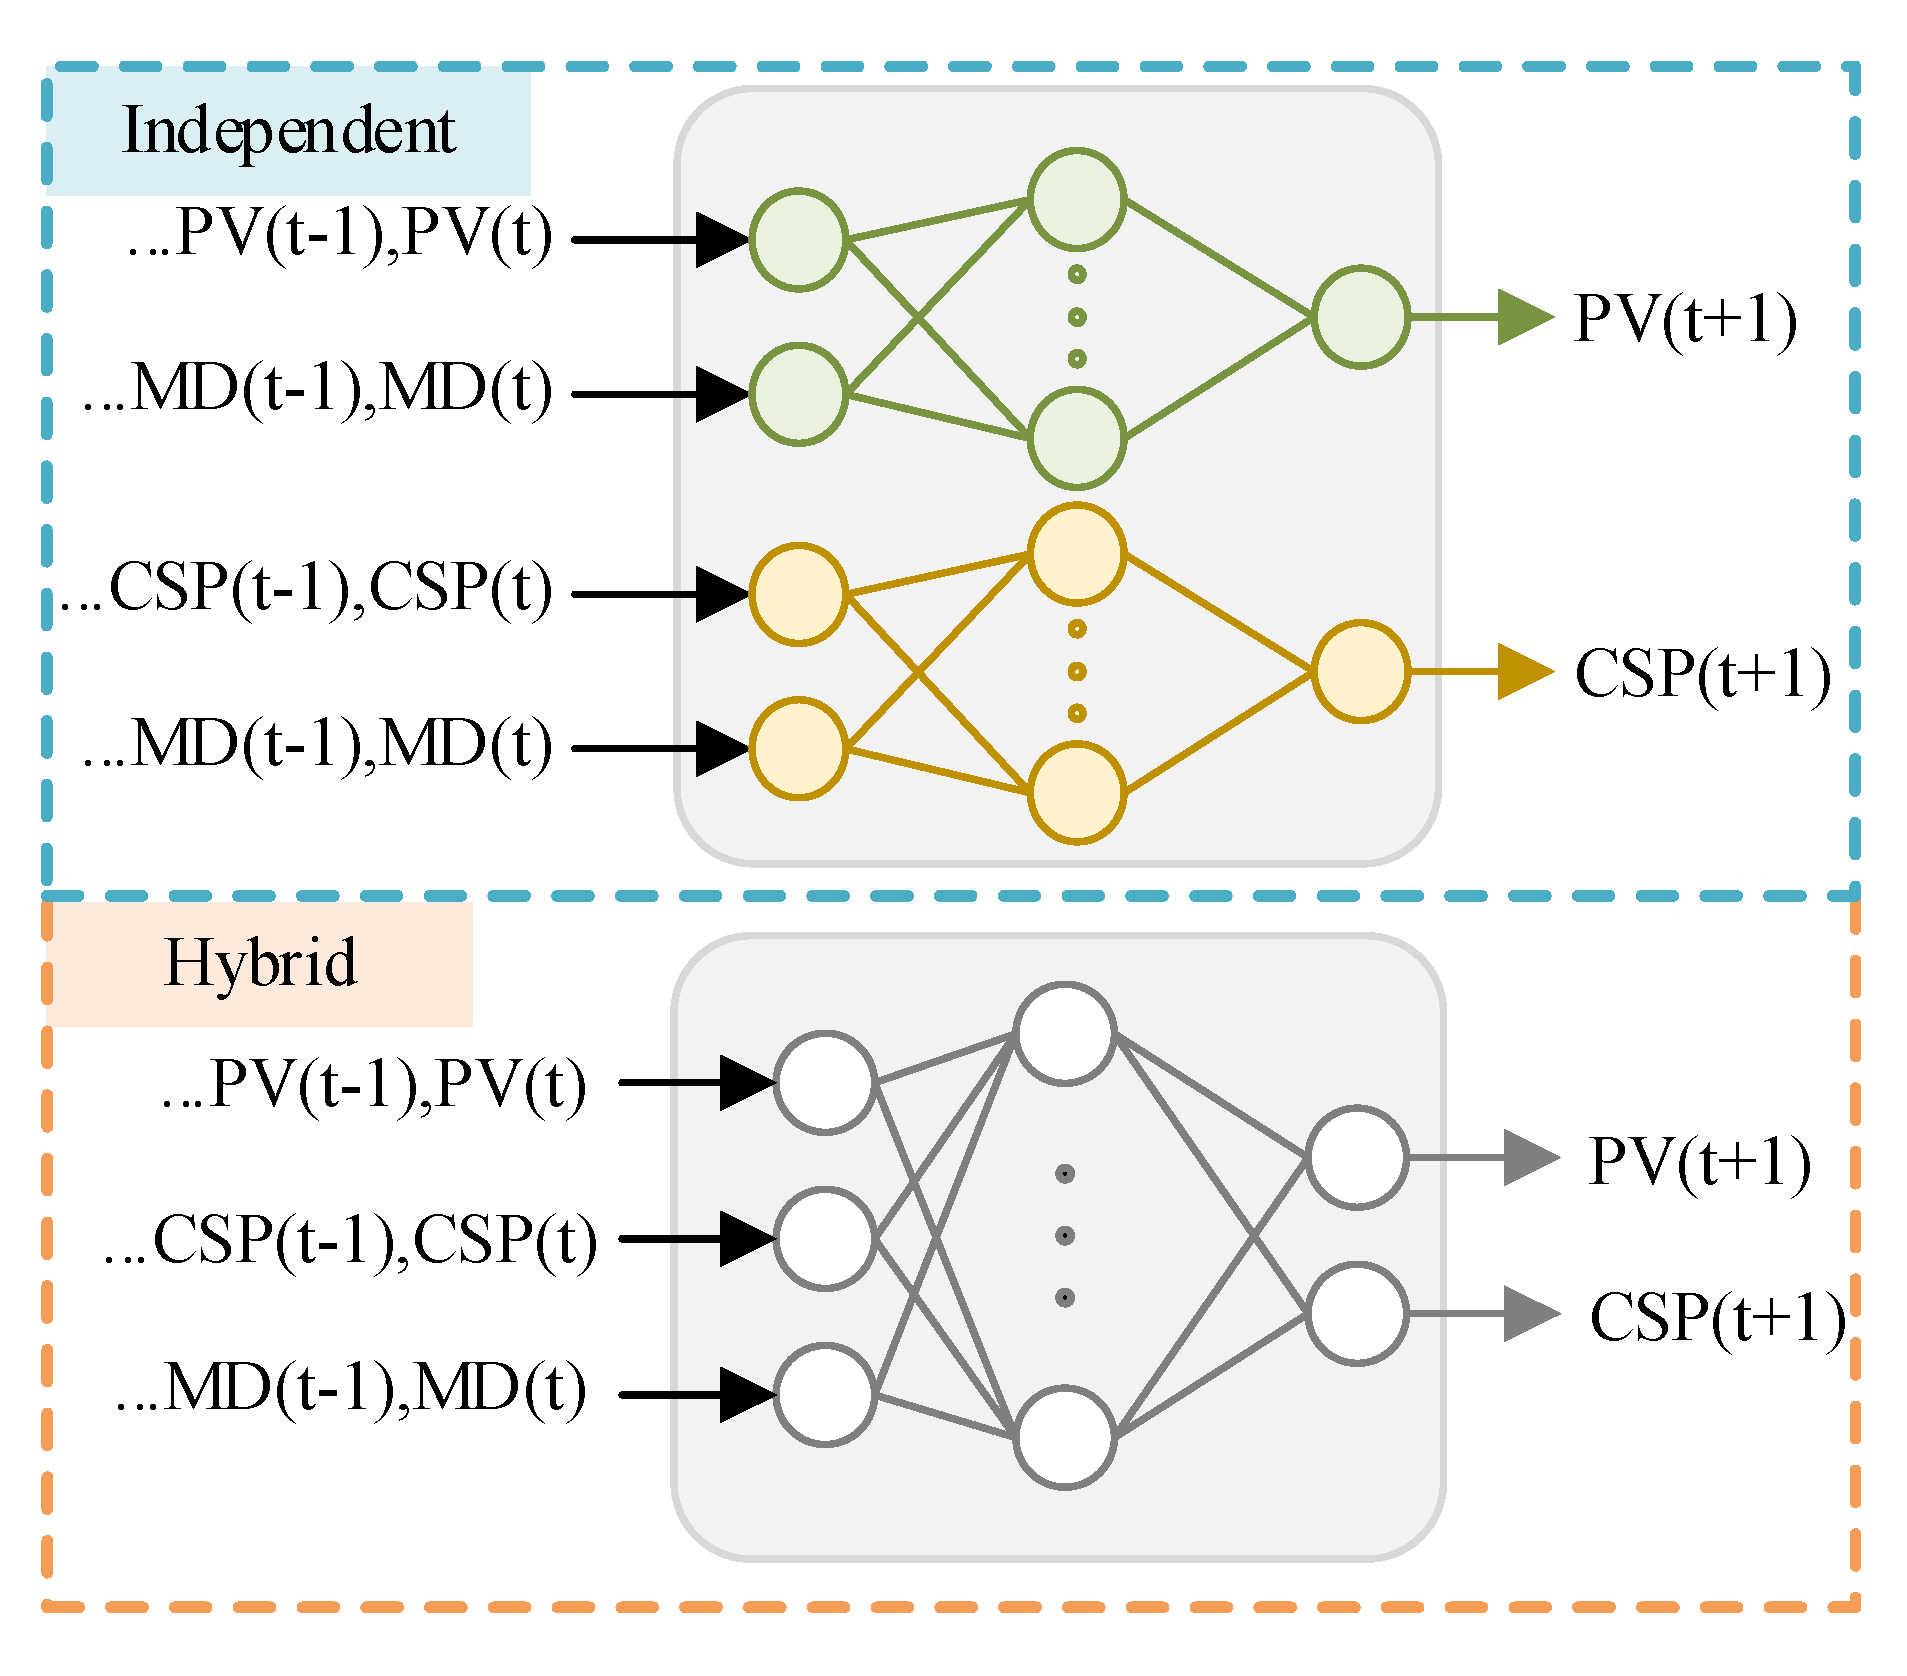
In case 1, a hybrid forecasting scheme for CSP and PV power generation is modeled. As a contrast, a scheme for independent forecasting of CSP and PV power generation is established. The main purpose of case 1 is to prove that the hybrid forecasting between PV and CSP with significant correlation can effectively improve the forecasting accuracy. For hybrid forecasting, the power of regional PV and CSP can be obtained directly. The difference is that for independent forecasting, the sum of CSP and PV generation in the region can be obtained by accumulation. The input data of these two models include historical power data and meteorological data (MD). The meteorological data include wind speed and DNI. We record more detailed information about each scheme in Table 4. The models of these two forecasting schemes are shown in Figure 5.
Although PV was significantly correlated with CSP, WPG had a weak correlation with CSP and PV. In order to prove whether the hybrid forecasting between generation types with weak correlation can improve the forecasting accuracy, we established the hybrid forecasting of WPG and PV and the hybrid forecasting of WPG and CSP. The details are recorded in Table 4.
(2)
Case 2
Based on correlation analysis, hybrid generation bundled into the power system are superior is verified by the evaluation of hybrid forecasting, partial hybrid forecasting and independent forecasting. A total of five experimental groups were set up and recorded in Table 5. Independent forecast details are recorded in group 1. Details of the partial hybrid forecasts are recorded in groups 2, 3, and 4. Details of the hybrid forecasting are recorded in group 5.
The differences of the above five prediction models in structure can be expressed more intuitively by mathematics. The mathematical expressions of group 1 to group 5 are expressed by Equations (8)–(12) respectively:
P Σ ( t + 1 ) = f ( V , P W P G ) + g ( D , P C S P ) + h ( D , P P V )
P Σ ( t + 1 ) = f ( V , D , P W P G , P P V ) + g ( D , P C S P )
P Σ ( t + 1 ) = f ( V , D , P W P G , P C S P ) + g ( D , P P V )
P Σ ( t + 1 ) = f ( D , P P V , P C S P ) + g ( V , P W P G )
P Σ ( t + 1 ) = f ( V , D , P W P G , P C S P , P P V )
where: P is the total output of the new energy cluster at t + 1 time, V is the row vector of historical wind speed, D is the row vector of historical DNI, PWPG is the historical power data of wind power plant, PPV is the historical power data of PV power plant, and PCSP is the historical power data of CSP plant.
The length of time series input into LSTM is 24, then two sets of historical meteorological data and three sets of historical output data are expressed by Equations (13)–(17):
V = [ V ( t ) , V ( t - 1 ) , V ( t - 2 ) , , V ( t - 23 ) ]
D = [ D ( t ) , D ( t - 1 ) , D ( t - 2 ) , , D ( t - 23 ) ]
P W P G = [ P W P G ( t ) , P W P G ( t - 1 ) , P W P G ( t - 2 ) , , P W P G ( t - 23 ) ]
P P V = [ P P V ( t ) , P P V ( t - 1 ) , P P V ( t - 2 ) , , P P V ( t - 23 ) ]
P C S P = [ P C S P ( t ) , P C S P ( t - 1 ) , P C S P ( t - 2 ) , , P C S P ( t - 23 ) ]
(3)
Case 3
In case 3, it is verified that the hybrid forecasting model based on a LSTM neural network is superior to other forecasting algorithms. It has been proved that LSTM can extract more effective information from historical data which could be used to forecast future power, the LSTM with long-term memory can be used to analyze the data with obvious time lag. Although Section 2.2 analyze the theory through LSTM models. But in reality, the model becomes extremely complex. We hope to prove the correctness of this theory through the experiment of real data. The specific arrangement of case 3 is shown in Table 6.
By changing the length of time series, it is proved that the “long-term memory” ability of LSTM network can effectively improve the forecasting accuracy of hybrid forecasting model. The length of time series is 24 h, 12 h and 3 h respectively. Besides, the other three kinds of forecasting model are also used in this hybrid forecasting method, they are ARIMA, MLP neural network and RNN. Their forecasting performance is compared with LSTM network.

4.2. Result Analysis

  • Case 1
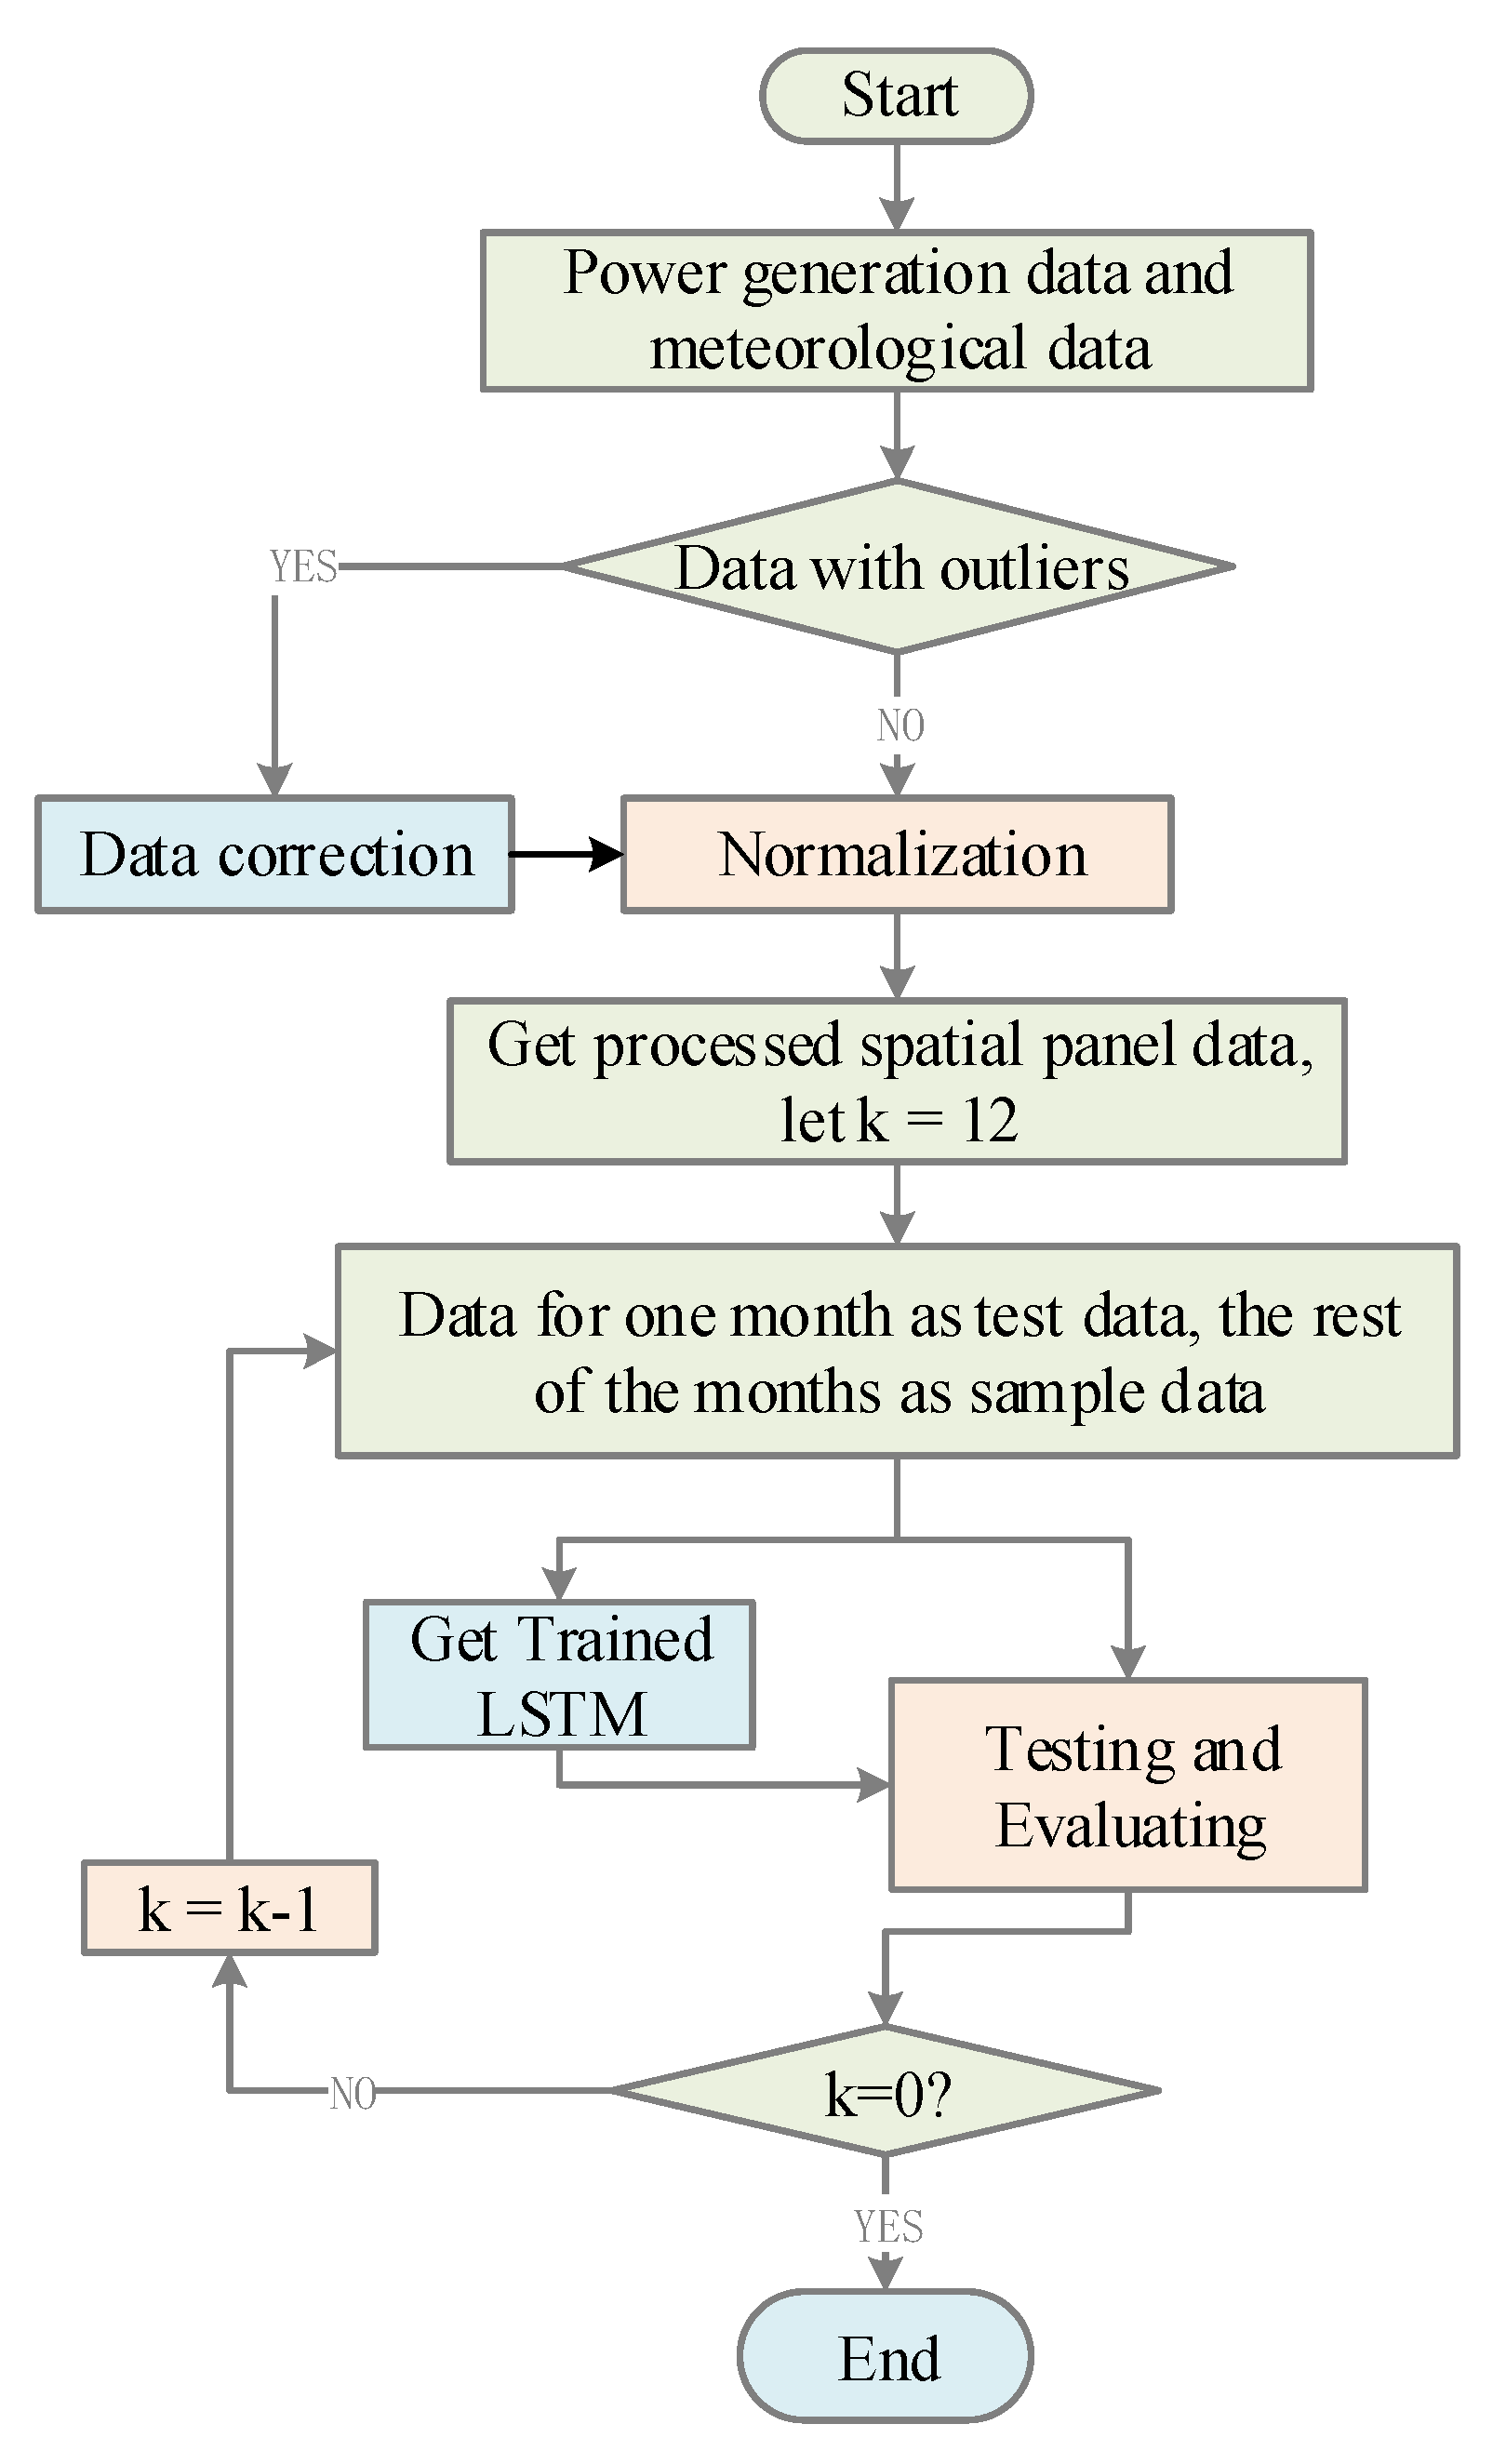
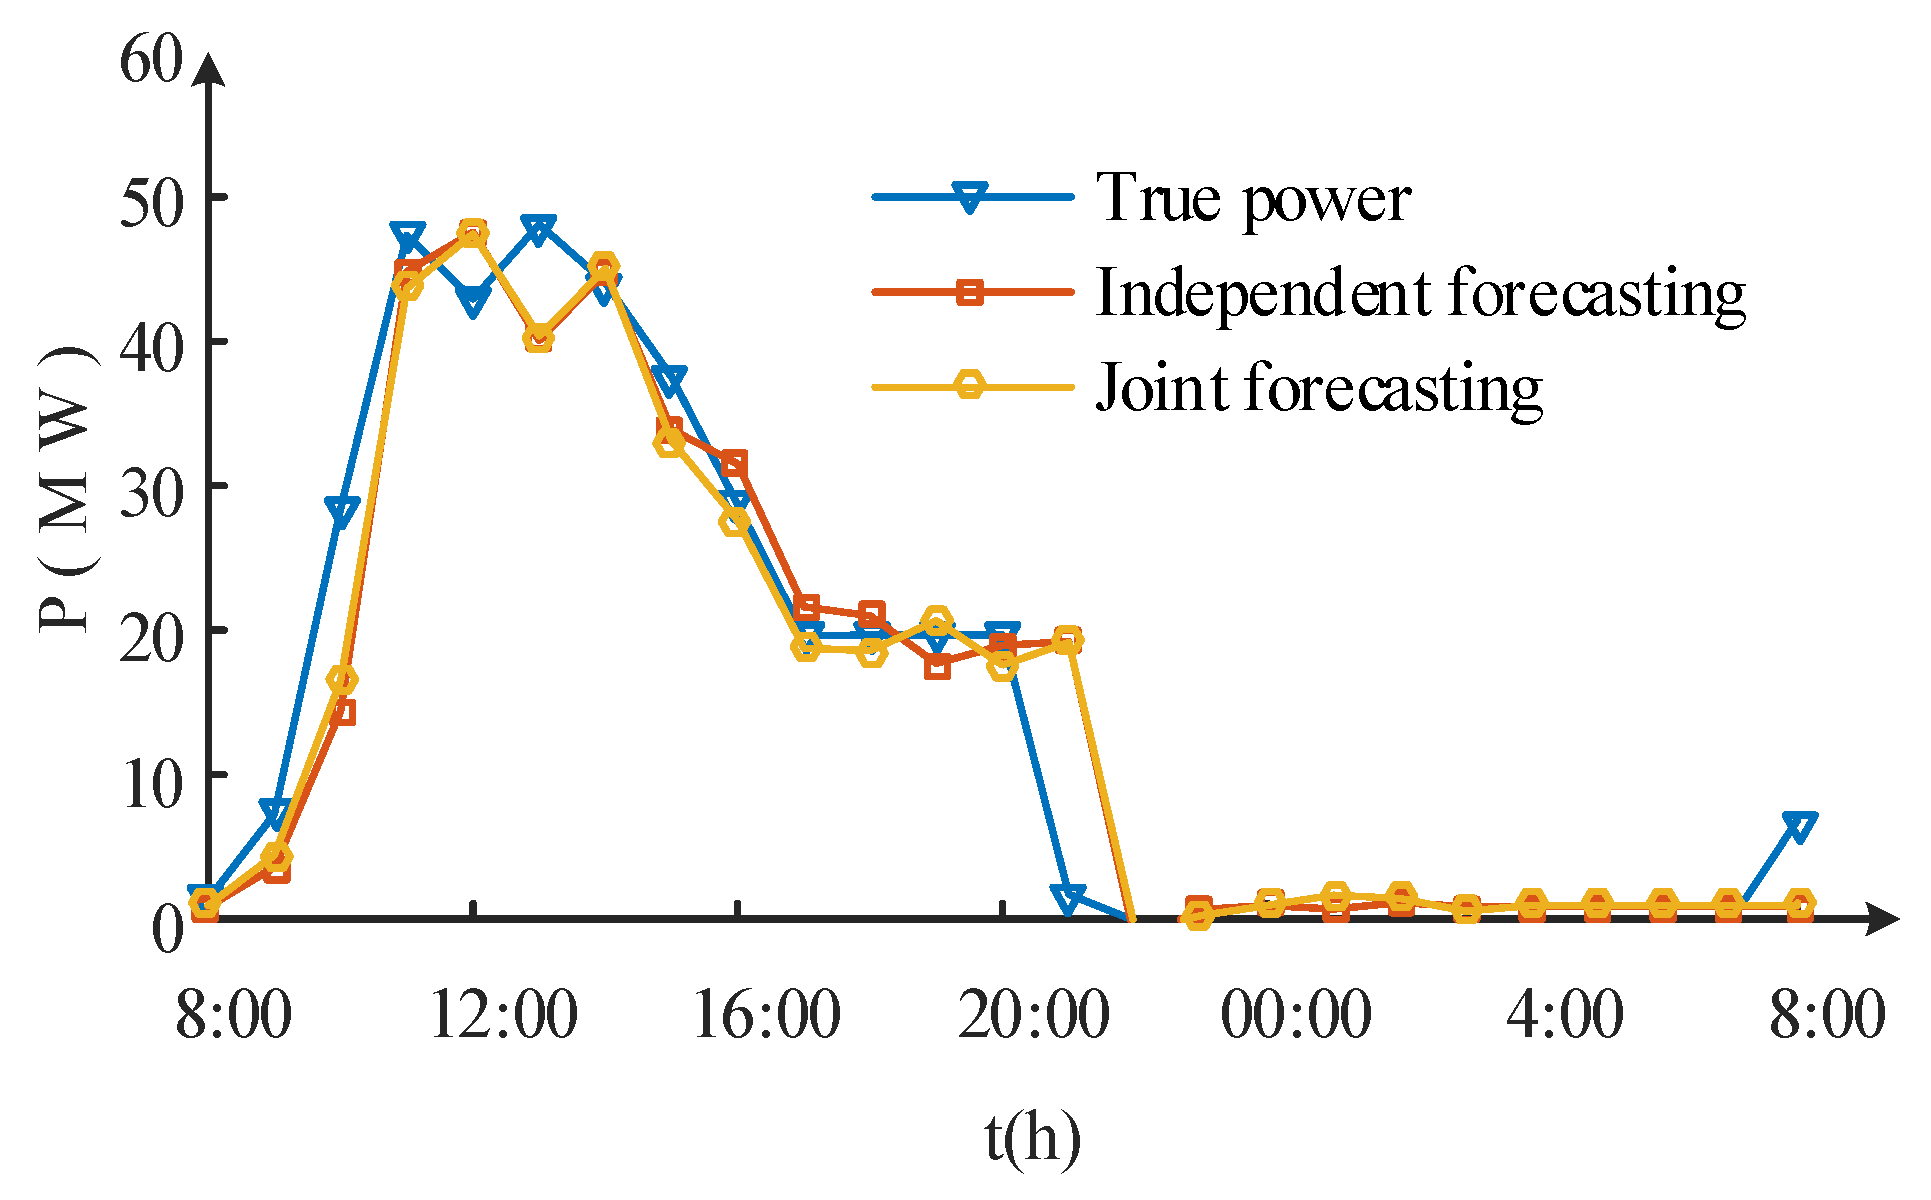
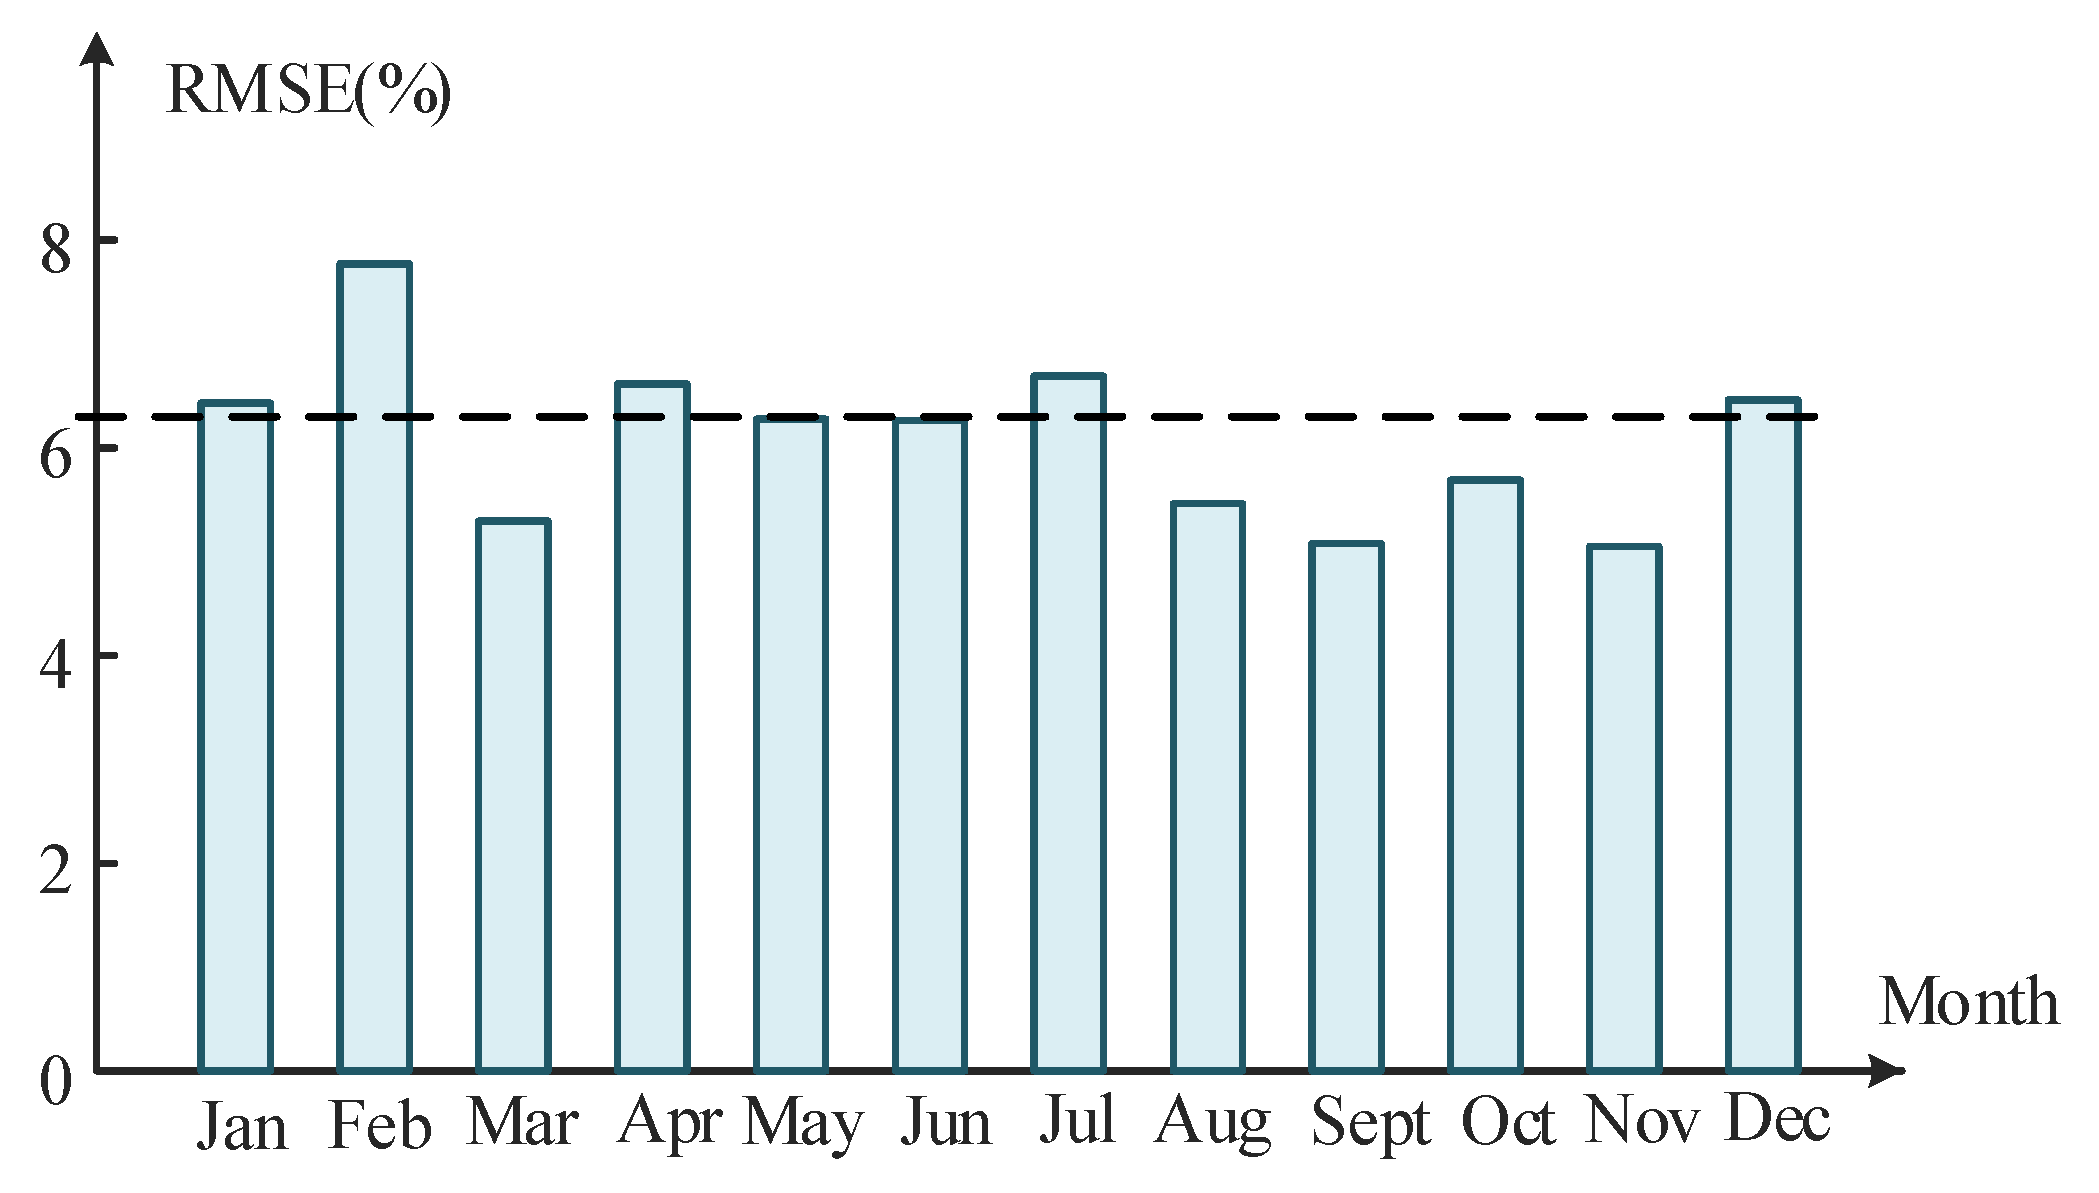
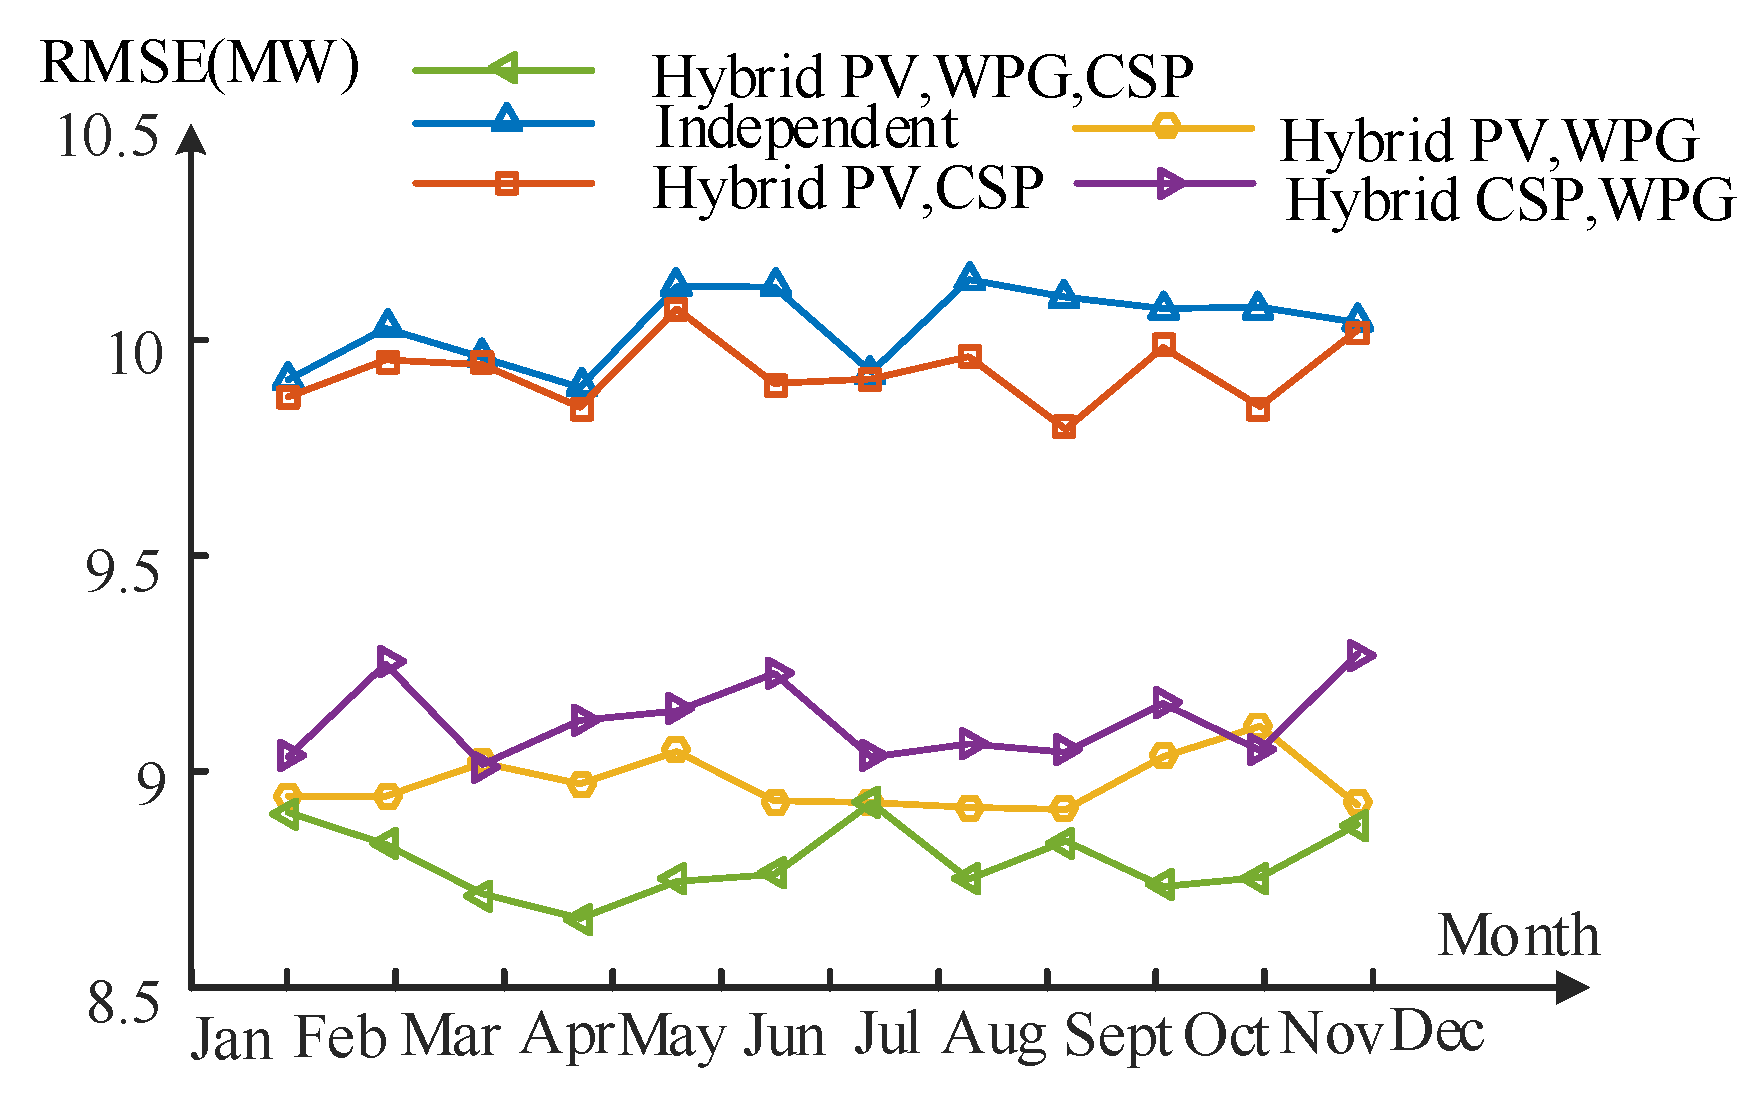
Figure 6 shows the actual and forecast power of PV and CSP in December. The RMSE% of hybrid and independent forecasting are 7.09% and 6.46%, respectively. It is obvious that the power of PV and CSP can be forecast by the hybrid forecasting method, which gives better results. It is clear that the result is unconvincing, which because of the same results cannot be guaranteed out of the sample. Twelve-fold cross validation is used to prove the generality and universality of the model. The monthly RMSE obtained by cross validation is recorded in Figure 7. Compared with the forecasting results in December, the hybrid forecasting model based on LSTM still has good forecasting in the other 11 groups of samples. Similar to the hybrid forecasting of PV and CSP, the other two groups have the same process. In order to record the forecast results more clearly, the average RMSE and RMES% obtained by cross validation are recorded in Table 7.
For any two renewable energy sources among WPG, PV and CSP, the RMSE% of hybrid forecasting is lower than RMSE% of independent forecasting. The simulation results show that the hybrid forecasting between the two types of power generation with correlation can greatly improve the forecasting accuracy.
2
Case 2
In Case 1, we know that any two combinations of PV, CSP, WPG is better than independent forecasting. We are still curious whether the hybrid forecasting among PV, CSP and WPG can improve the forecasting accuracy. In this case, we have done five comparative groups to test that theory. The groups of case 2 are shown in Table 5, where group 1 is an independent forecasting, groups 2 to 4 are partial hybrid forecasting, and group5 are hybrid forecasting. Their results were added together and the statistical indicators were recorded in Table 8.
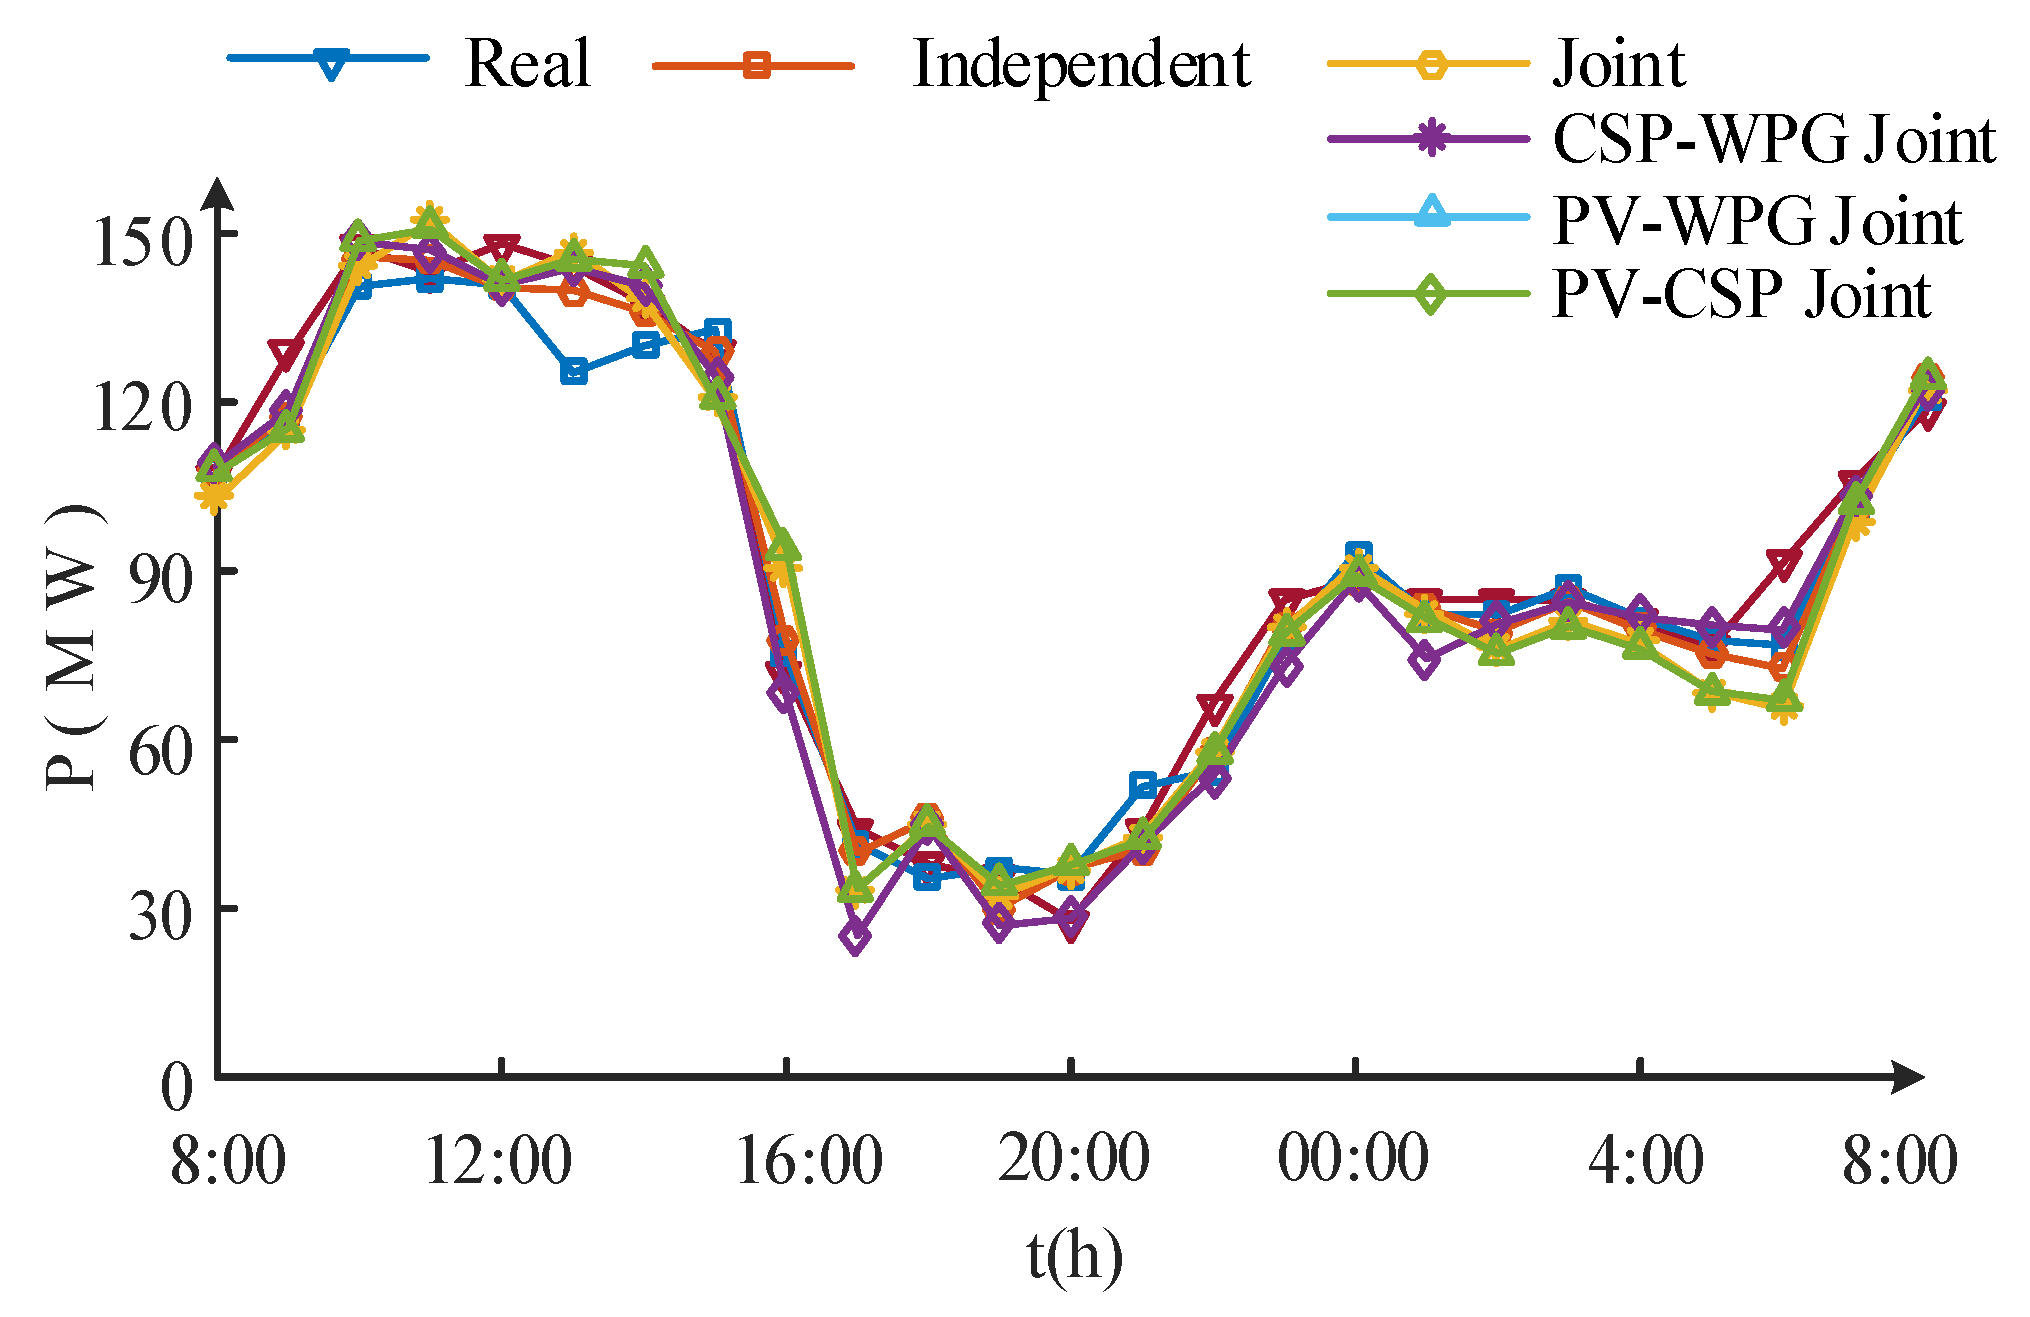
Figure 8 records the forecast results of five prediction schemes on a day in December. For better comparison, we recorded the annual average of RMES and RMSE% in descending order in Table 8 and Figure 9. Obviously, the RMSE% of independent forecasting is less than that of partial hybrid forecasting, and the RMSE% of hybrid forecasting model is the smallest. Finally, we believe that hybrid forecasting among PV, CSP and WPG can improve the forecasting accuracy. The effect of hybrid forecasting is best because of the following reasons.
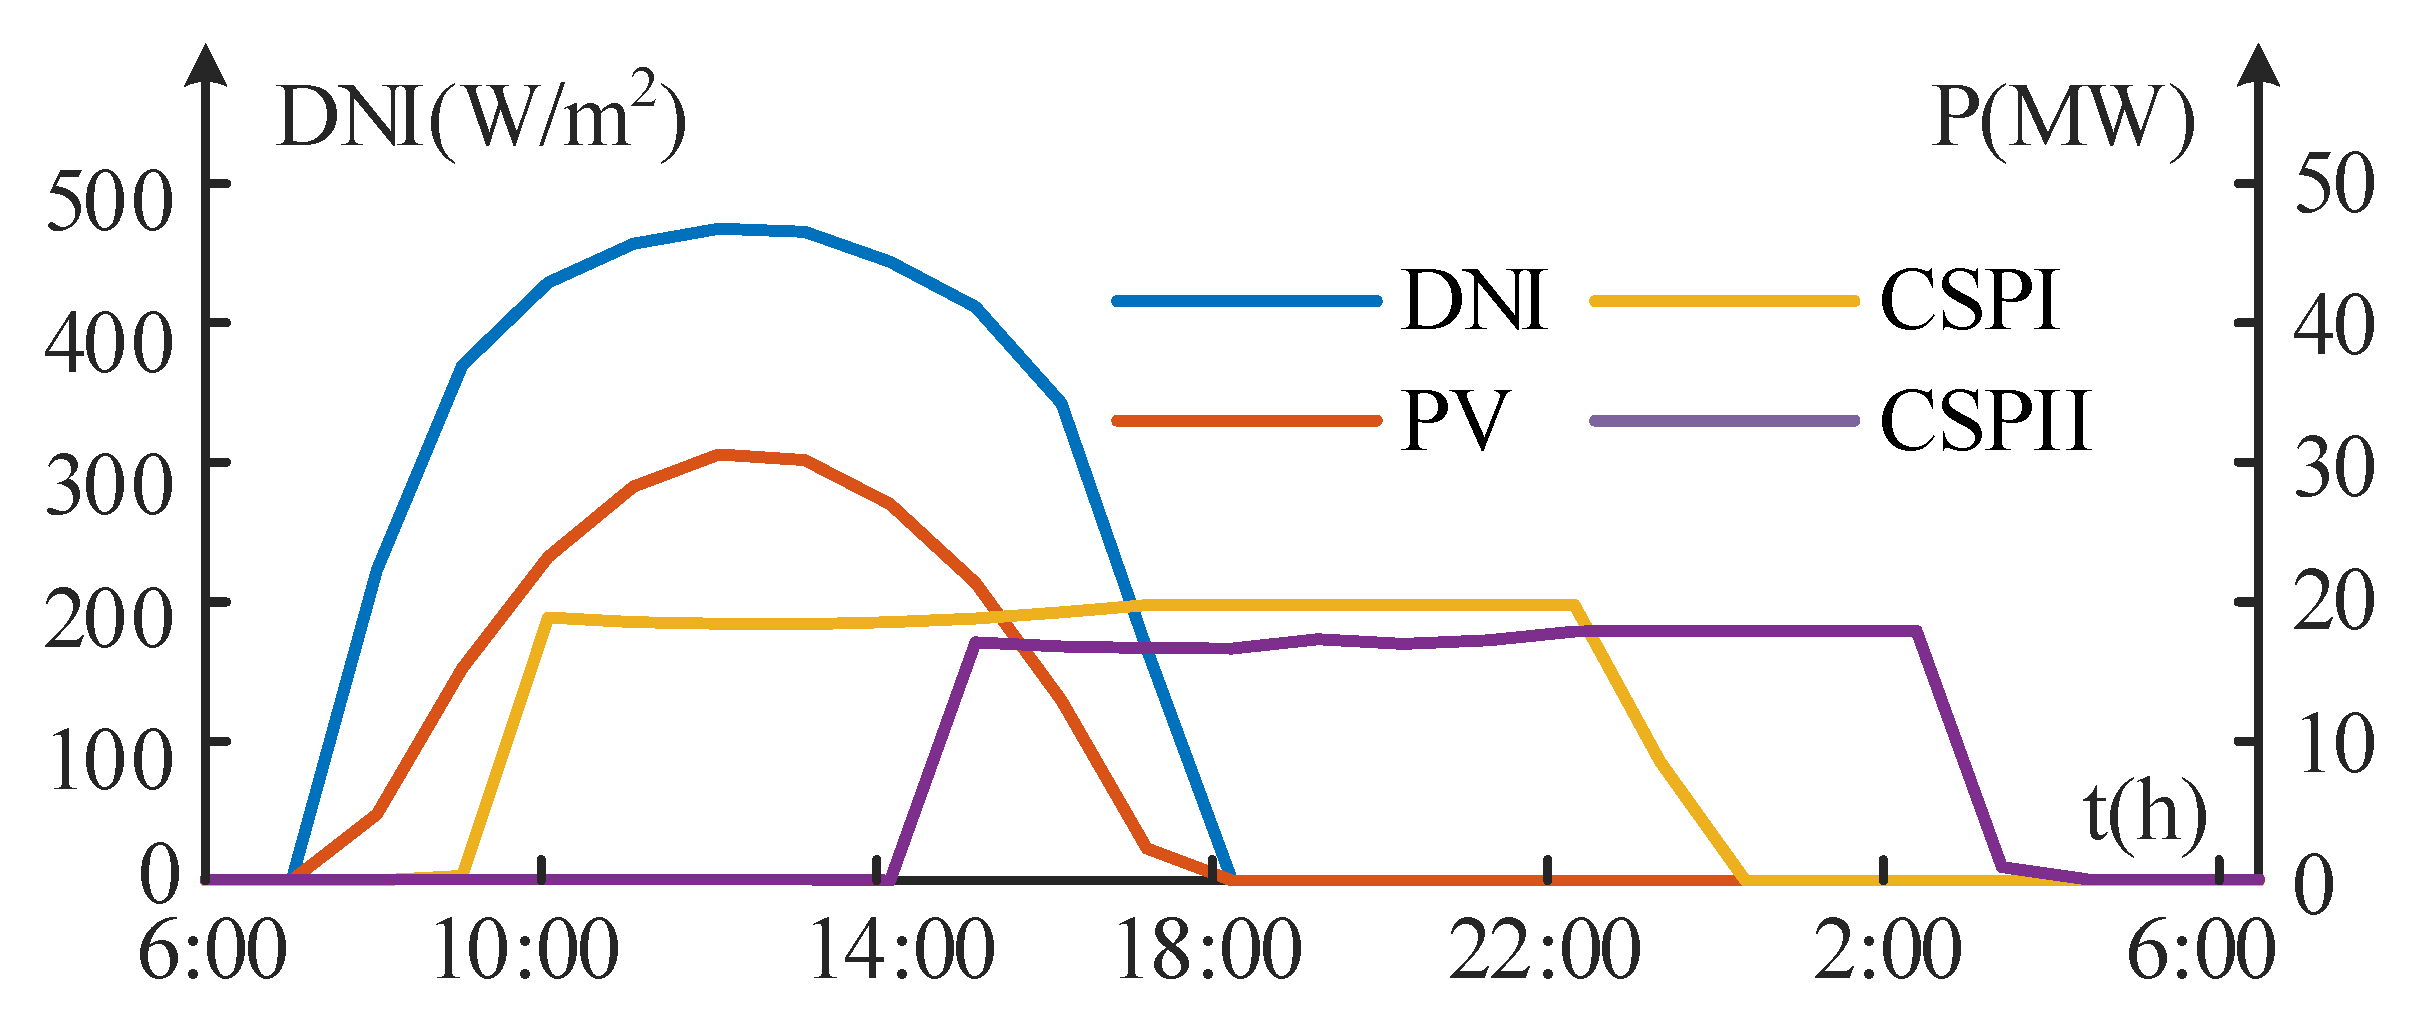
First of all, because wind speed and DNI are correlated meteorological variables, there is a weak correlation between WPG and PV. During the day, the DNI is high and the wind speed is often weak. After the sun sets at night, the wind speed is strengthened because of the great change of the surface temperature difference. Besides, the wind speed is often higher on rainy days than on sunny days. What is more, In China’s monsoon climate region, generally, wind speed and DNI are complementary in season. In short, it is precisely because of these meteorological correlations that WPG and PV power generation show a certain correlation. Besides, DNI is the main meteorological variable determining PV and CSP power generation, so there is a trend correlation between PV and CSP. The correlation is very strong when there is no power compensation. What is more, in the hybrid power generation system, CSP is used to compensate for the fluctuation of PV and WPG generation, so there is a certain negative correlation between the generation of CSP and the other two types of generation. Finally, the three types of power generation may be affected by temperature, air pressure, humidity and other meteorological factors at the same time. There is a certain coupling relationship among these types of power generation.
3
Case 3
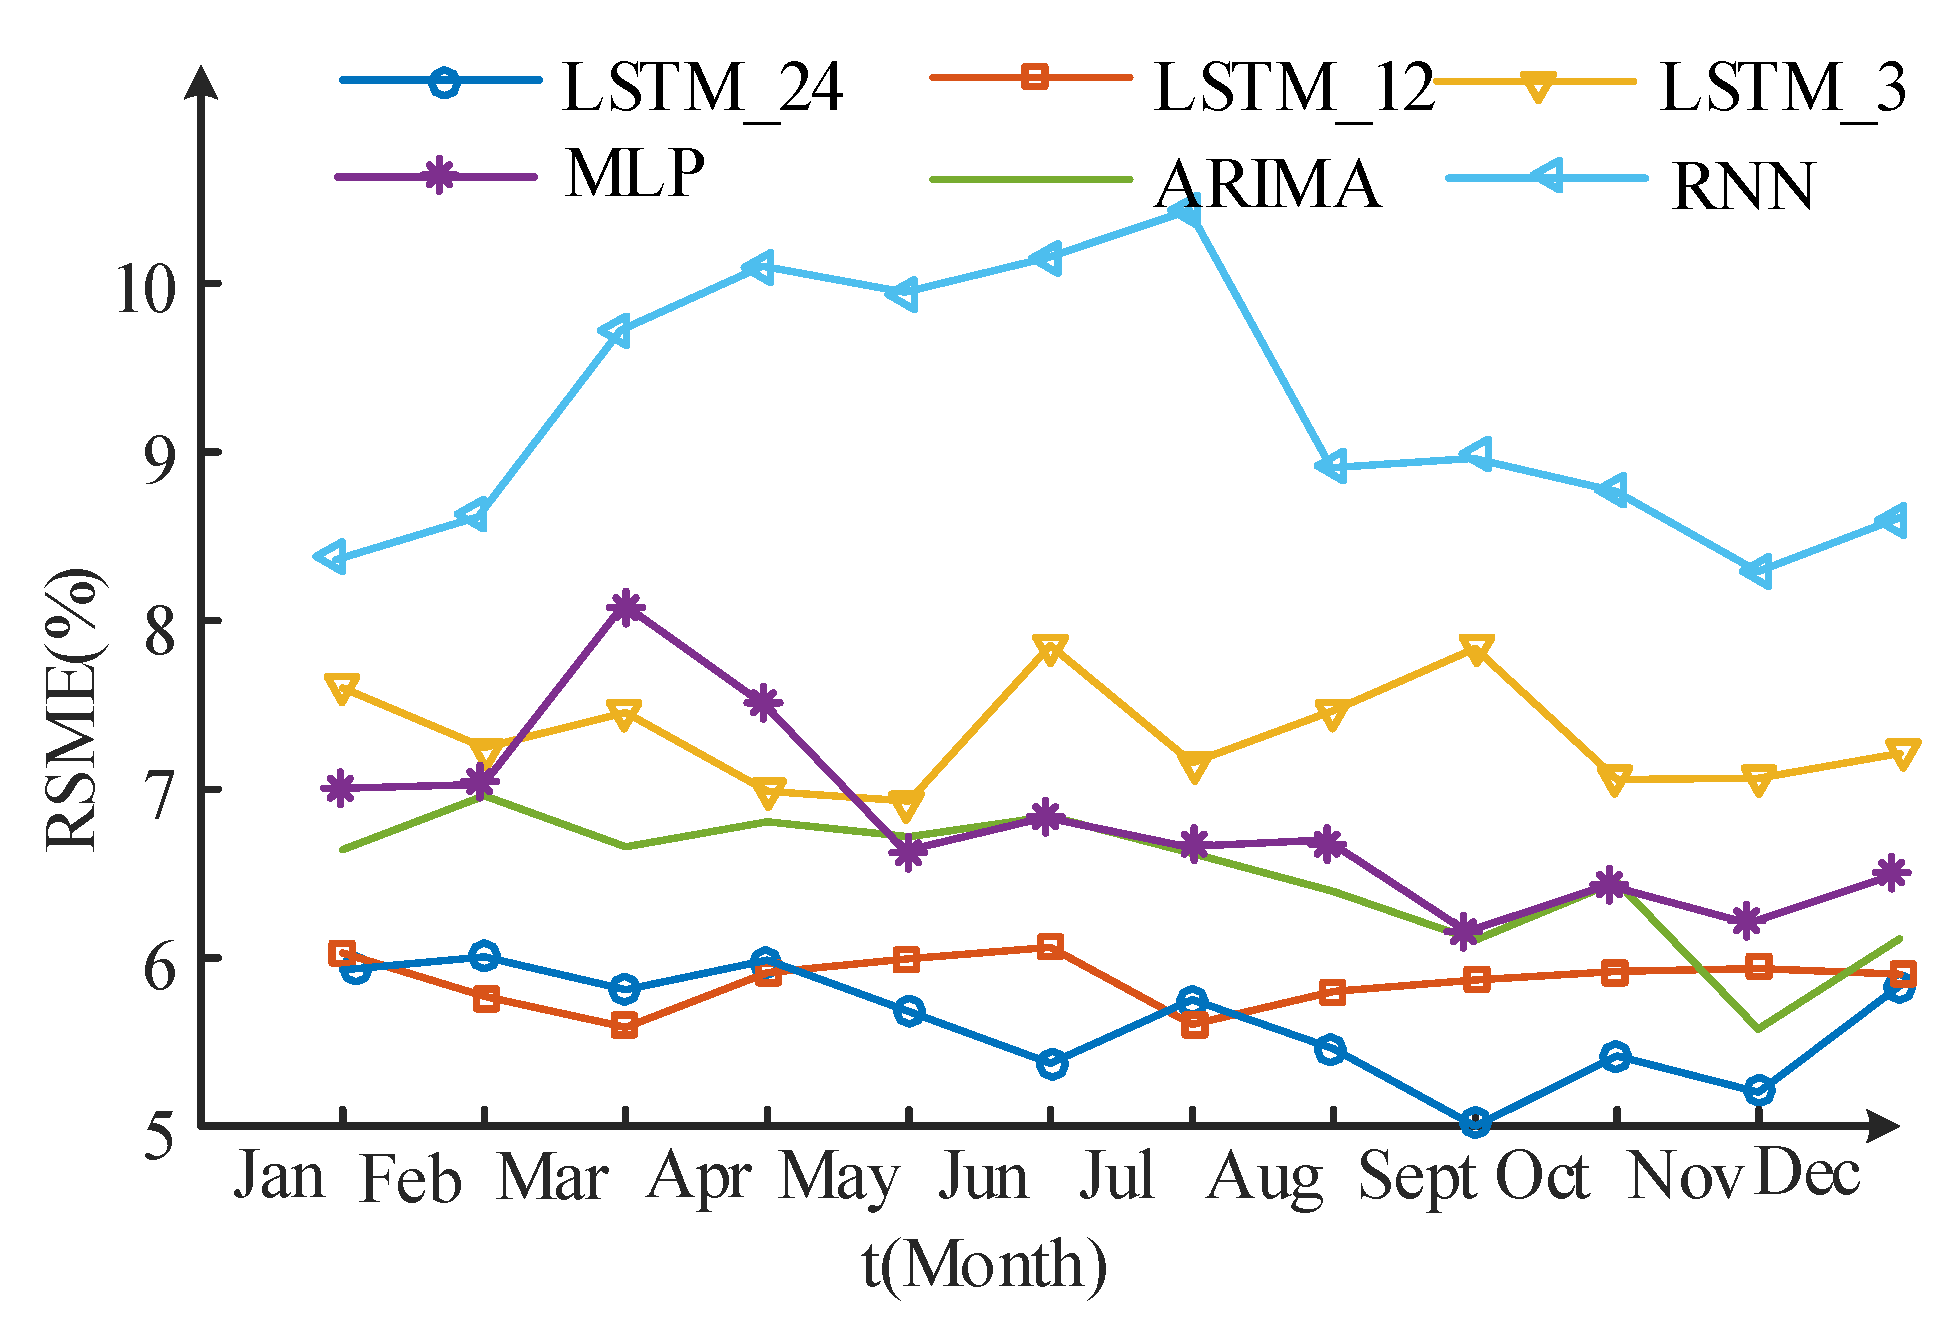
The Wind-PV-CSP hybrid forecasting was repeated by changing the time series length of LSTM neural network. The forecasting results show that with the shortening of time series, the value of RMSE% becomes larger and the forecasting accuracy becomes worse, which because the important information is lost by LSTM. The RMSE% of the LSTM forecasting model under different time series lengths are recorded in Table 9 and Figure 10.
In addition to changing the time series length of LSTM neural network, the hybrid forecasting model of Wind-PV-CSP by other three forecasting model are also modeled, and the RMSE% of these three forecasting models are recorded in Table 9 and Figure 10. The results show that the LSTM method with long-term memory has a higher forecasting accuracy in the hybrid forecasting of Wind-PV-CSP generation.

5. Conclusions

High proportion of renewable energy clusters connected to the power grid are expected to be an important trend in the future. Improving the forecasting accuracy of these hybrid generation clusters is a great challenge and a difficult task. This paper proposes a short-term forecasting method based on LSTM for hybrid generation cluster composed of three types of renewable energy power generation, namely wind power, photovoltaic power and CSP. A series of conclusions can be drawn from the results of this study.
The generation cluster of CSP and photovoltaic power generation can reduce the uncertainty of renewable energy generation, so that the hybrid forecasting of CSP and PV generation has higher forecast accuracy than the independent forecasting. Besides, complementarity between wind and solar energy is also used for the forecasting of hybrid generation cluster. The hybrid forecasting improves the forecast accuracy of Wind-PV-CSP generation cluster. Additionally, LSTM can make better use of the correlation and long time series data among different types of power generation. The memory function makes LSTM perform better in hybrid forecasting than that of ARIMA, MLP and RNN.
For future works, on the one hand, the structure of the hybrid forecasting is relatively simple and we are considering the ensemble method based on LSTM. On the other hand, for renewable energy cluster, only one group of PV, wind power and CSP data is used. The next step is increasing the number of power plants for each type of power generation.

Author Contributions

Methodology, S.P., Z.Z.; validation, S.P., Z.Z., F.L., X.X., L.X.; writing, S.P., Z.Z.; funding acquisition, F.L., L.X.; resources, L.X.; data curation, F.L. All authors have read and agreed to the published version of the manuscript.

Funding

This research was funded by the Science and Technology Project of State Grid Gansu Electric Power Company, of grant number 52273120004R.

Institutional Review Board Statement

Not applicable.

Informed Consent Statement

Not applicable.

Data Availability Statement

The data is available upon request from the corresponding author.

Conflicts of Interest

The authors declare no conflict of interest.

References

  1. IRENA. 2021 Renewable Capacity Statistics; IRENA: Abu Dhabi, United Arab Emirates, 2021. [Google Scholar]
  2. Notton, G.; Nivet, M.L.; Voyant, C.; Paoli, C.; Darras, C.; Motte, F.; Fouilloy, A. Intermittent and stochastic character of renewable energy sources: Consequences, cost of intermittence and benefit of forecasting. Renew. Sust. Energ. Rev. 2018, 87, 96–105. [Google Scholar] [CrossRef]
  3. Du, E.; Zhang, N.; Hodge, B.; Wang, Q.; Kang, C.; Kroposki, B.; Xia, Q. The role of concentrating solar power towards high renewable energy penetrated power systems. IEEE Trans. Power Syst. 2018, 33, 6630–6641. [Google Scholar] [CrossRef]
  4. Du, E.; Zhang, N.; Hodge, B.; Kang, C.; Kroposki, B.; Xia, Q. Economic justification of concentrating solar power in high renewable energy penetrated power systems. Appl. Energy 2018, 222, 649–661. [Google Scholar] [CrossRef]
  5. Miglietta, M.M.; Huld, T.; Monforti-Ferrario, F. Local complementarity of wind and solar energy resources over Europe: An assessment study from a meteorological perspective. J. Appl. Meteorol. Climatol. 2017, 56, 217–234. [Google Scholar] [CrossRef]
  6. Monforti, F.; Huld, T.; Bódis, K.; Vitali, L.; D'Isidoro, M.; Lacal-Arántegui, R. Assessing complementarity of wind and solar resources for energy production in Italy. A Monte Carlo approach. Renew. Energy 2014, 63, 576–586. [Google Scholar] [CrossRef]
  7. Khare, V.; Nema, S.; Baredar, P. Solar–wind hybrid renewable energy system: A review. Renew. Sust. Energ. Rev. 2016, 58, 23–33. [Google Scholar] [CrossRef]
  8. Wang, H.Z.; Li, G.Q.; Wang, G.B.; Peng, J.C.; Jiang, H.; Liu, Y.T. Deep learning based ensemble approach for probabilistic wind power forecasting. Appl. Energy 2017, 188, 56–70. [Google Scholar] [CrossRef]
  9. Zeineb, A.; Rashid, A.M.A.; Adel, G. Review of policies encouraging renewable energy integration & best practices. Renew. Sust. Energ. Rev. 2015, 45, 249–262. [Google Scholar]
  10. Zheng, Z.W.; Chen, Y.Y.; Huo, M.M.; Zhao, B. An Overview: The Development of Prediction Technology of Wind and Photovoltaic Power Generation. Energy Procedia 2011, 12, 601–608. [Google Scholar] [CrossRef] [Green Version]
  11. Hippert, H.S.; Pedreira, C.E.; Souza, R.C. Neural networks for short-term load forecasting: A review and evaluation. IEEE Trans. Power Syst. 2001, 16, 44–55. [Google Scholar] [CrossRef]
  12. Hong, T.; Wang, P. Fuzzy interaction regression for short term load forecasting. Fuzzy Opt. Decis. Mak. 2014, 13, 91–103. [Google Scholar] [CrossRef]
  13. Chapagain, K.; Kittipiyakul, S.; Kulthanavit, P. Short-Term Electricity Demand Forecasting: Impact Analysis of Temperature for Thailand. Energies 2020, 13, 2498. [Google Scholar] [CrossRef]
  14. Ahmed, R.; Sreeram, V.; Mishra, Y.; Arif, M.D. A review and evaluation of the state-of-the-art in PV solar power forecasting: Techniques and optimization. Renew. Sust. Energ. Rev. 2020, 124, 109792. [Google Scholar] [CrossRef]
  15. Ding, Y. Data Science for Wind Energy; Chapman & Hall/CRC Press: Boca Raton, FL, USA, 2019; Chapters 2–4. [Google Scholar]
  16. Sharifzadeh, M.; Sikinioti-Lock, A.; Shah, N. Machine-learning methods for integrated renewable power generation: A comparative study of artificial neural networks, support vector regression, and Gaussian Process Regression. Renew. Sust. Energ. Rev. 2019, 108, 513–538. [Google Scholar] [CrossRef]
  17. Hochreiter, S.; Schmidhuber, J. Long short-term memory. Neural. Comput. 1997, 9, 1735–1780. [Google Scholar] [CrossRef] [PubMed]
  18. Wang, Y.; Feng, B.; Hua, Q.-S.; Sun, L. Short-Term Solar Power Forecasting: A Combined Long Short-Term Memory and Gaussian Process Regression Method. Sustainability 2021, 13, 3665. [Google Scholar] [CrossRef]
  19. Gao, M.; Li, J.; Hong, F.; Long, D. Day-ahead power forecasting in a large-scale photovoltaic plant based on weather classification using LSTM. Energy 2019, 187, 115838. [Google Scholar] [CrossRef]
  20. Rahman, M.M.; Shakeri, M.; Tiong, S.K.; Khatun, F.; Amin, N.; Pasupuleti, J.; Hasan, M.K. Prospective Methodologies in Hybrid Renewable Energy Systems for Energy Prediction Using Artificial Neural Networks. Sustainability 2021, 13, 2393. [Google Scholar] [CrossRef]
  21. Liu, Z.; Jiang, P.; Zhang, L.; Niu, X. A combined forecasting model for time series: Application to short-term wind speed forecasting. Appl. Energy 2020, 259, 114137. [Google Scholar] [CrossRef]
  22. Medina, S.V.; Ajenjo, U.P. Performance improvement of artificial neural network model in short-term forecasting of wind farm power output. J. Mod. Power Syst. Clean Energy 2020, 8, 484–490. [Google Scholar] [CrossRef]
  23. Liu, W.F.; Zhu, F.L.; Zhao, T.T.; Wang, H.; Lei, X.H.; Zhong, P.A.; Fthenakis, V. Optimal stochastic scheduling of hydropower-based compensation for combined wind and photovoltaic power outputs. Appl. Energy 2020, 276, 115501. [Google Scholar] [CrossRef]
  24. Heydari, A.; Garcia, D.A.; Keynia, F.; Bisegna, F.; De Santoli, L. A novel composite neural network based method for wind and solar power forecasting in microgrids. Appl. Energy 2019, 251, 113353. [Google Scholar] [CrossRef]
  25. Han, S.; Qiao, Y.H.; Yan, J.; Liu, Y.Q.; Li, L.; Wang, Z. Mid-to-long term wind and photovoltaic power generation prediction based on copula function and long short term memory network. Appl. Energy 2019, 239, 181–191. [Google Scholar] [CrossRef]
  26. Li, F.; Li, C.; Sun, K.; Zhang, J.; Li, H. Capacity configuration of hybrid CSP/PV plant for economical application of solar energy. Proc. CSEE 2020, 6, 19–29. [Google Scholar] [CrossRef]
  27. Chen, R.; Sun, H.; Guo, Q.; Li, Z.; Deng, T.; Wu, W.; Zhang, B. Reducing generation uncertainty by integrating CSP with wind power: An adaptive robust optimization-based analysis. IEEE Trans. Sustain. Energy 2015, 6, 583–594. [Google Scholar] [CrossRef]
  28. Xu, T.; Zhang, N. Coordinated Operation of Concentrated Solar Power and Wind Resources for the Provision of Energy and Reserve Services. IEEE Trans. Power Syst. 2016, 2, 1260–1271. [Google Scholar] [CrossRef]
  29. Sanjari, M.J.; Gooi, H.B.; Nair, N. Power Generation Forecast of Hybrid PV-Wind System. IEEE Trans. Sustain. Energy 2019, 11, 703–712. [Google Scholar] [CrossRef]
  30. Feng, L.; Zhang, J.; Li, G.; Zhang, B. Cost reduction of a hybrid energy storage system considering correlation between wind and PV power. PCMP 2016, 1, 11. [Google Scholar] [CrossRef] [Green Version]
  31. Islam, M.T.; Huda, N.; Abdullah, A.B.; Saidur, R. A comprehensive review of state-of-the-art concentrating solar power (CSP) technologies: Current status and research trends. Renew. Sust. Energ. Rev. 2018, 91, 987–1018. [Google Scholar] [CrossRef]
  32. Kong, W.C.; Dong, Z.Y.; Jia, Y.W.; Hill, D.J.; Xu, Y.; Zhang, Y. Short-Term Residential Load Forecasting Based on LSTM Recurrent Neural Network. IEEE Trans. Smart Grid 2019, 10, 841–851. [Google Scholar] [CrossRef]
  33. Hong, Y.Y.; Rioflorido, C.L.P.P. A hybrid deep learning-based neural network for 24-h ahead wind power forecasting. Appl. Energy 2019, 250, 530–539. [Google Scholar] [CrossRef]
  34. Croonenbroeck, C.; Stadtmann, G. Renewable generation forecast studies-Review and good practice guidance. Renew. Sust. Energ. Rev. 2019, 108, 312–322. [Google Scholar] [CrossRef]
  35. Sun, M.C.; Feng, C.; Zhang, J. Conditional aggregated probabilistic wind power forecasting based on spatio-temporal correlation. Appl. Energy 2019, 256, 113842. [Google Scholar] [CrossRef]
Figure 1. Hybrid generation cluster.
Sustainability 13 06681 g001
Figure 2. Structure of LSTM network.
Sustainability 13 06681 g002
Figure 3. PV-CSP complementary generation system.
Sustainability 13 06681 g003
Figure 4. Flow chart of modeling procedure.
Sustainability 13 06681 g004
Figure 5. Two forecasting schemes of PV and CSP.
Sustainability 13 06681 g005
Figure 6. Actual power and forecast power of case1.
Sustainability 13 06681 g006
Figure 7. Monthly RMSE obtained by cross validation.
Sustainability 13 06681 g007
Figure 8. Actual power and forecast power of case 2.
Sustainability 13 06681 g008
Figure 9. Monthly RMSE of case 2.
Sustainability 13 06681 g009
Figure 10. Monthly RMSE of case 3.
Sustainability 13 06681 g010
Table 1. Descriptive Statistics.
Data TypeMINMAXAVESTD
WPG (MW)099.730.936.3
PV (MW)039.89.512.7
CSP (MW)019.711.38.9
Wind (m/s)0.330.96.84.3
DNI (W/m2)01015.0319.5388.9
Table 2. Correlation Coefficients among Different Types of Data.
TypePVCSPWPGWindDNI
PV1.000.380.420.410.93
CSP0.381.000.110.110.38
WPG0.420.111.000.920.39
Wind0.410.110.921.000.37
DNI0.930.380.390.371.00
Table 3. 12-Cross Validation Method.
Group123456789101112
Test data121234567891011
Training dataOther months
Table 4. Grouping of Prediction Model in Case 1.
GroupTypeScheme
1CSP and PVIndependent
2CSP and PVHybrid
3WPG and PVIndependent
4WPG and PVHybrid
5WPG and CSPIndependent
6WPG and CSPHybrid
Table 5. Grouping of Prediction Models in Case 2.
GroupWPGPVCSP
1IndependentIndependentIndependent
2HybridHybridIndependent
3HybridIndependentHybrid
4IndependentHybridHybrid
5HybridHybridHybrid
Table 6. Grouping of Prediction Models in Case 3.
GroupMethodTime Series
1LSTM network24
2LSTM network12
3LSTM network3
4ARIMA-
5MLP-
6RNN12
Table 7. Statistics of Indexes of Two Models in Case 1.
TypeMethodRMSE(MW)RMSE%
PV + WPGIndependent9.606.85
Hybrid8.586.13
PV + CSPIndependent4.016.69
Hybrid3.866.43
CSP + WPGIndependent9.507.92
Hybrid8.587.15
Table 8. Statistics of Indexes in Case 2.
TypeRMSERMSE%
Independent10.006.25
Hybrid PV,CSP9.946.21
Hybrid PV,WPG9.055.66
Hybrid CSP,WPG9.145.71
Hybrid PV,WPG,CSP8.795.50
Table 9. Statistics of Indexes in Case 3.
GroupTime SeriesRMSE%
LSTM network245.59
LSTM network125.82
LSTM network37.37
ARIMA-6.34
MLP-6.58
RNN129.13
Publisher’s Note: MDPI stays neutral with regard to jurisdictional claims in published maps and institutional affiliations.

