
Analysis of the Environmental Effects of the Clean Heating Policy in Northern China

1
Institutes of Science and Development, Chinese Academy of Sciences, Beijing 100190, China
2
University of Chinese Academy of Sciences, Beijing 100049, China
*
Author to whom correspondence should be addressed.
Sustainability 2021, 13(12), 6695; https://0-doi-org.brum.beds.ac.uk/10.3390/su13126695
Submission received: 30 May 2021
/
Revised: 5 June 2021
/
Accepted: 9 June 2021
/
Published: 12 June 2021
(This article belongs to the Special Issue Climate Change Mitigation, Air Pollution, and Health Impacts in the Heating System)
Abstract
:This article estimates the impact of the “Clean Heating Plan in Northern China (2017–2021)” on air quality improvement. It is a significant policy to promote the clean heating rate in Northern China, while there is limited research into its effects. We used a difference-in-difference model to qualify the effects of this policy on the “2 + 26” cities. For this, we controlled factors such as economy, energy use, afforestation level, and weather. We found that: (1) the clean heating plan makes the “2 + 26” cities’ AQI index, PM2.5, PM10, NO2, and O3 significantly decrease; (2) the concentrations of SO2 and CO increase. After adjusting the treatment group and control group, the results are still robust. We believe that the rise of SO2 is due to the shortage of natural gas supply in the 2017–2018 heating season in China, which led to the blockage of clean heating. Therefore, in promoting clean heating in Northern China, it is necessary to strengthen the estimation of heating demand, fully consider the energy structures of different regions, and implement the “reform by gas”.
1. Introduction
By the end of 2016, the total heating area in Northern China was about 20.6 billion square meters, and it has maintained rapid growth [1]. The concentration of air pollutants in Northern China increased with the heating area [2,3,4]. It shows that the average building carbon emission per capita in northern heating areas was about twice the non-heating. Furthermore, residential buildings’ average carbon emission intensity in northern urban heating areas is four times the non-heating areas [5]. In addition, the air pollution caused by winter heating affects not only the northern region but also the rest of China [6,7]. In order to control air pollution, the government has issued a series of clean heating policies [8]. At the end of 2017, China’s National Development and Reform Commission and nine other government agencies issued the “Clean Heating Plan for Winter in the Northern Region (2017–2021)”, which vigorously promoted natural gas and other clean energy to replace coal for heating.
Using natural gas instead of coal as a fuel for heating reflects the adjustment and transformation of the energy use structure in China. The earliest “coal-to-gas” project in our country can be traced back to 1997. In 2013, the “coal-to-gas” project was further accelerated with the introduction of the “Air Pollution Prevention and Control Action Plan” [9]. By 2017, the National Development and Reform Commission and nine other ministries and commissions jointly issued the “Northern Region Clean Heating Plan 2017–2021”. The overall objectives of this plan were that the clean heating rate should reach 50% by 2019 and 70% by 2021. At the same time, higher goals were proposed for the “2 + 26” cities. The “2 + 26” cities refers to the cities located within the Beijing-Tianjin-Hebei air pollution transmission channel, which contains Beijing, Tianjin, and 26 other cities in Hebei Province, Shanxi, Shandong, and Henan. The region accounts for 16.64% of the national GDP, 13.75% of the national population, and 22.72% of the total national coal consumption [10]. The clean heating rate in the “2 + 26” cities should reach 90% or more in urban areas, 70% in urban fringe areas, 40% in rural areas by 2019. Furthermore, the rates should be 100%, 80% and 60% by 2021 [1].
Existing researches focus on the comprehensive policy of reducing air pollution, such as the “Air Pollution Prevention and Control Action Plan” in 2013 [9,11,12]. These researches aim to find a better way to reduce air pollution through multiple pathways, without systematic research on the clean heating policy itself. The heating policy aims to reduce coal consumption and shift energy consumption to the relatively clean natural gas. This shift in consumption will directly reduce coal use and reduce the pollutant emissions caused by burning coal [13]. Then some researchers began to identify the effects of the coal-to-gas policy implemented in China. The policies they researched were early ones, such as in 2010, or in a specific city such as Beijing [14,15]. There are some methods for analyzing clean air policies, such as the Bayesian approach, life cycle assessment, the pollutant emission intensity generated by heating, the slack-based measure-directional distance function, the computable general equilibrium model, and the quasi-natural experiment method [14,15,16,17,18,19,20,21]. The above methods need to carry out a sophisticated social and economic system modeling for the research object. Due to the complexity and uncertainty of the generation and emission mechanism of air pollutants, the difficulty of social system construction may increase and the support of data must be ensured. On this basis, the quasi-natural experiment method can reduce the complexity of system construction and better reflect the causal relationship between policy implementation and air pollution in this paper.
Researchers have conducted empirical analysis of some cities and believe that a clean heating policy can significantly reduce the concentration of air pollutants [8,22,23,24]. In addition, the implementation effect of the policy will also affect the residents’ willingness to accept or complain about the policy [25,26]. Therefore, it is imperative to carry out this research.
Some studies consider the “Air Pollution Prevention and Control Action Plan” policy as the yardstick for the implementation of “coal-to-gas” projects [12]. However, we believe that the natural gas shortage incident during the heating period of 2017–2018 could reflect the actual implementation of “coal-to-gas” projects better than in 2013 [27]. Therefore, we consider the “Clean Heating Plan in Winter in the Northern Region (2017–2021)” as the most suitable policy to research. This article will conduct an empirical study of the changes in the concentration of air pollutants after the implementation of this policy, and explore the governance effects of this policy using a difference-in-difference model. Moreover, we propose a hypothesis: the implementation of clean heating policies can significantly reduce the concentration of air pollutants in the “2 + 26” cities.
2. The Case Study of Northern China
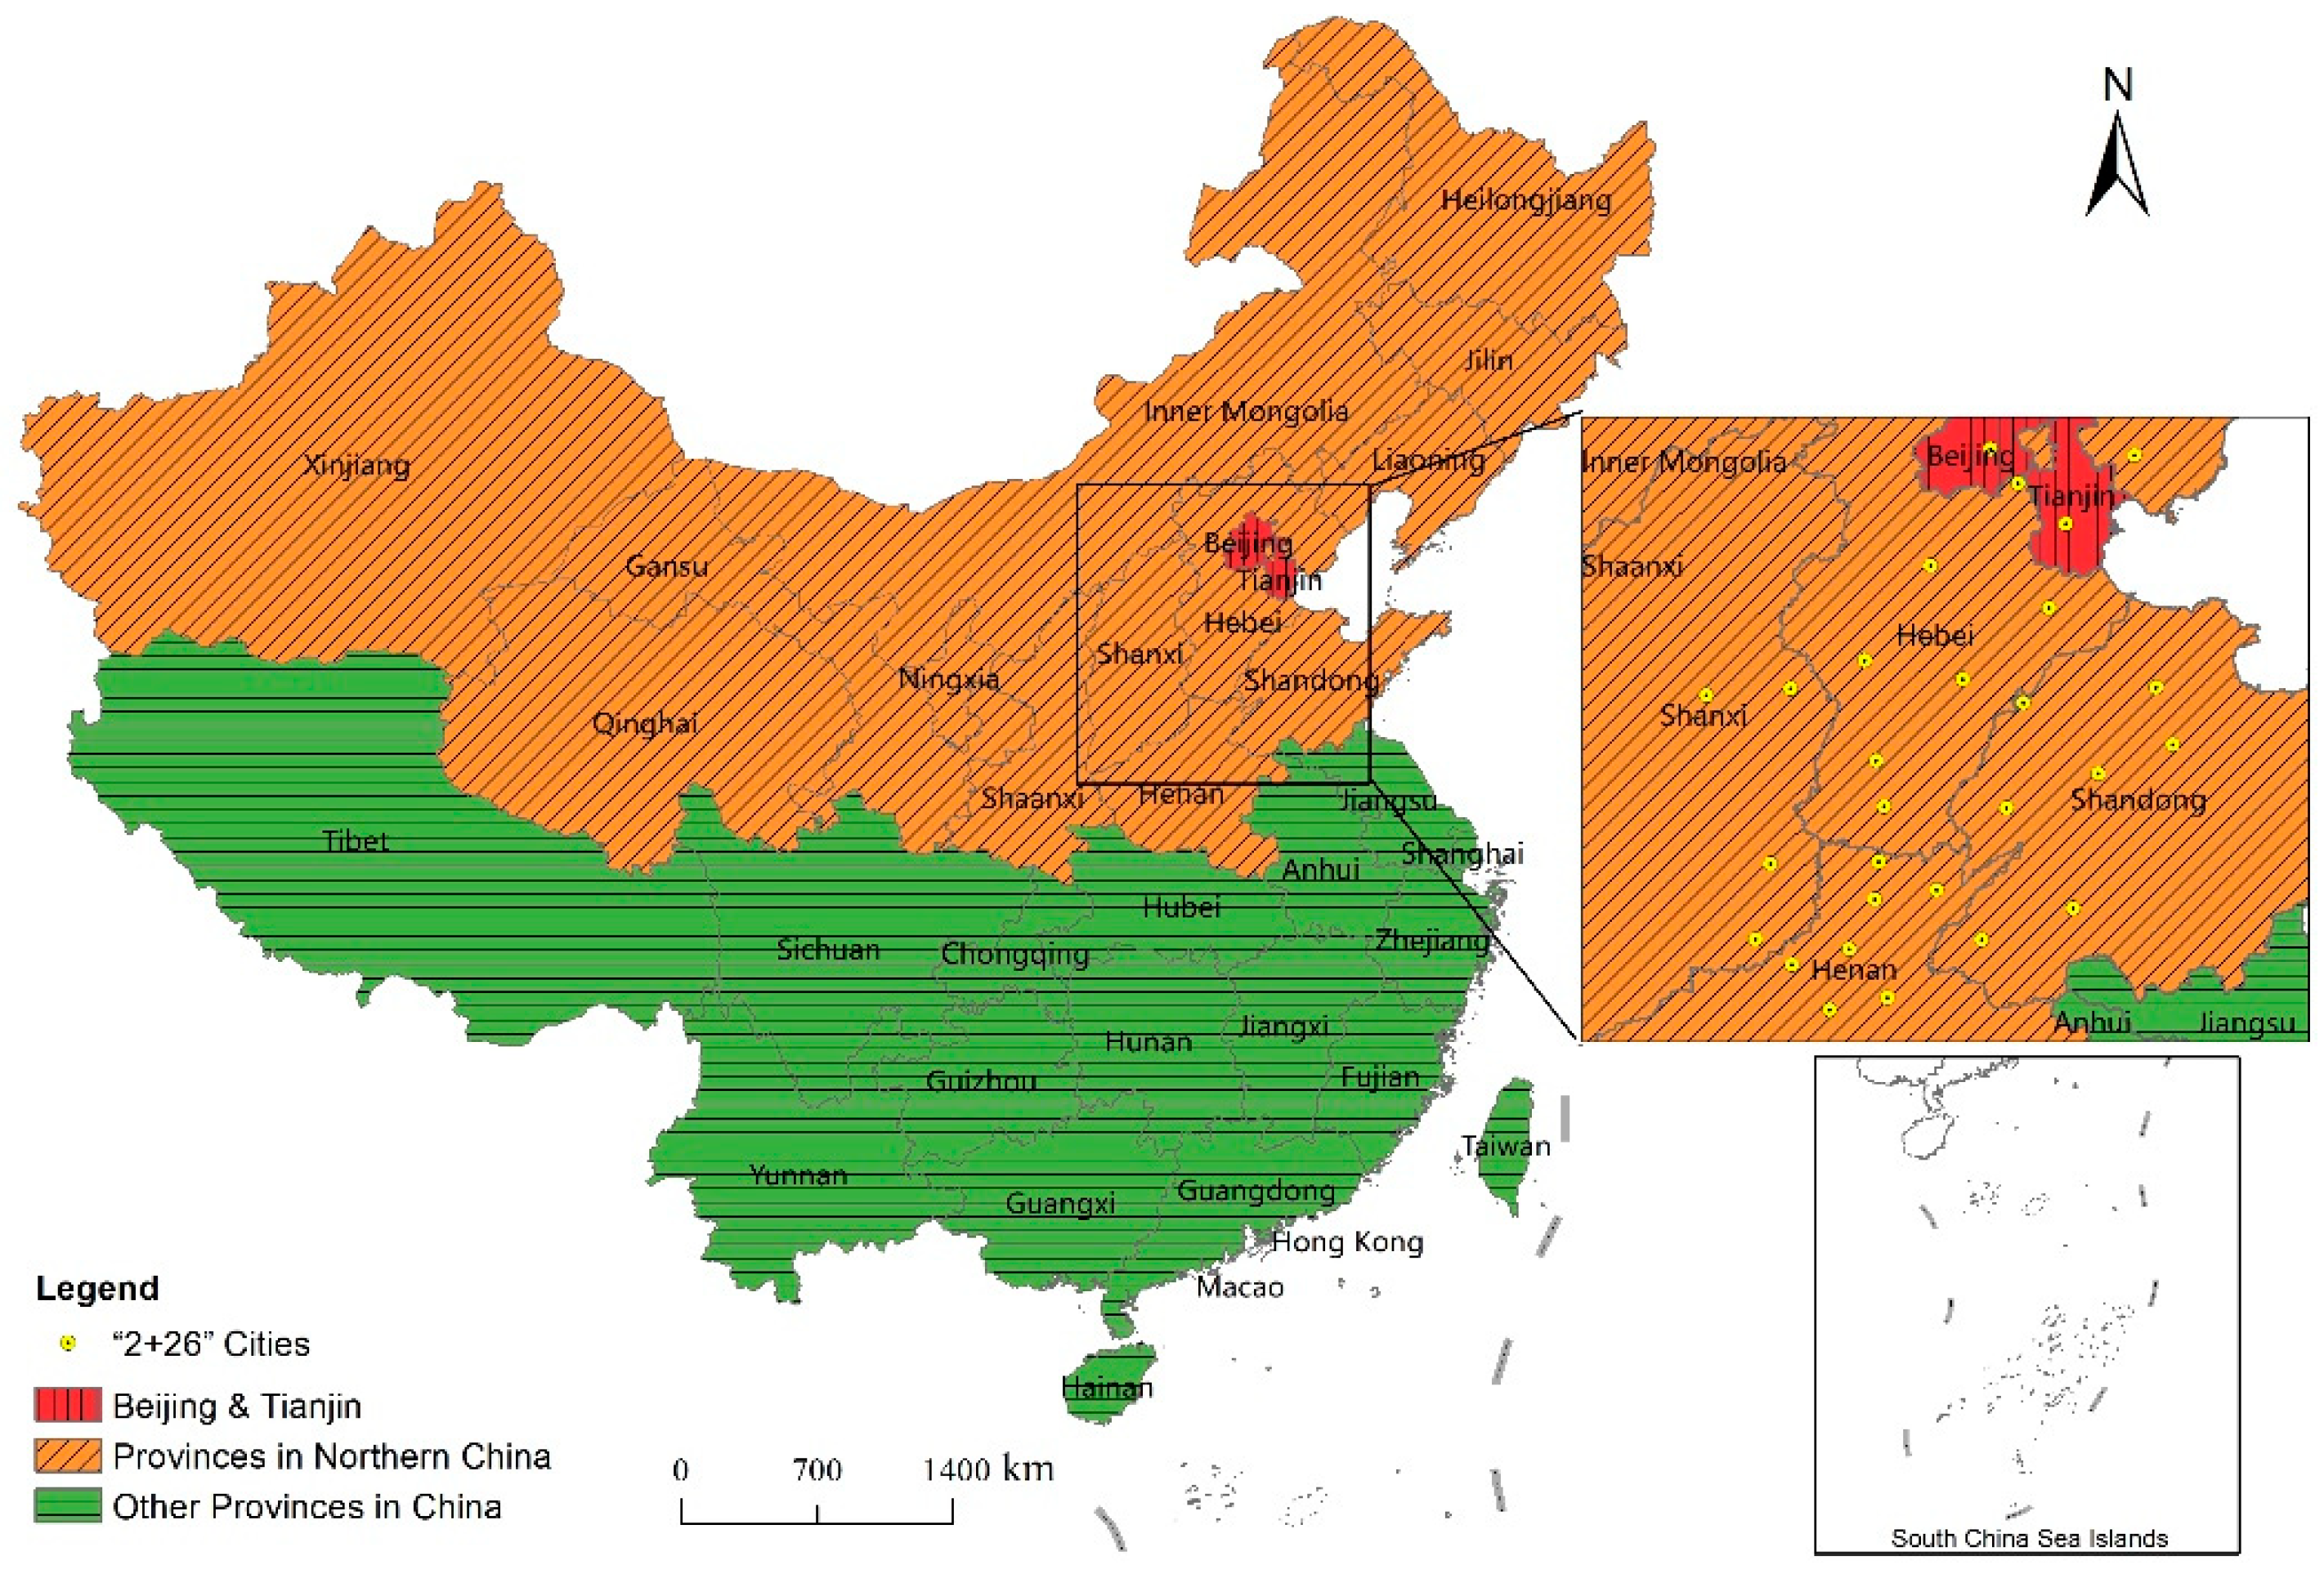
Affected by regional temperature differences, China’s winter heating is mainly distributed in the northern region. The northern provinces mentioned include Beijing, Tianjin, Hebei, Shanxi, Inner Mongolia, Liaoning, Jilin, Heilongjiang, Shandong, Shaanxi, Gansu, Ningxia, Xinjiang, Qinghai, and part of Henan. Moreover, the “2 + 26” cities are the most important ones: covering Beijing, Tianjin, and the other 26 cities in the air pollution transmission channel [28]. Figure 1 shows their geographical distribution.
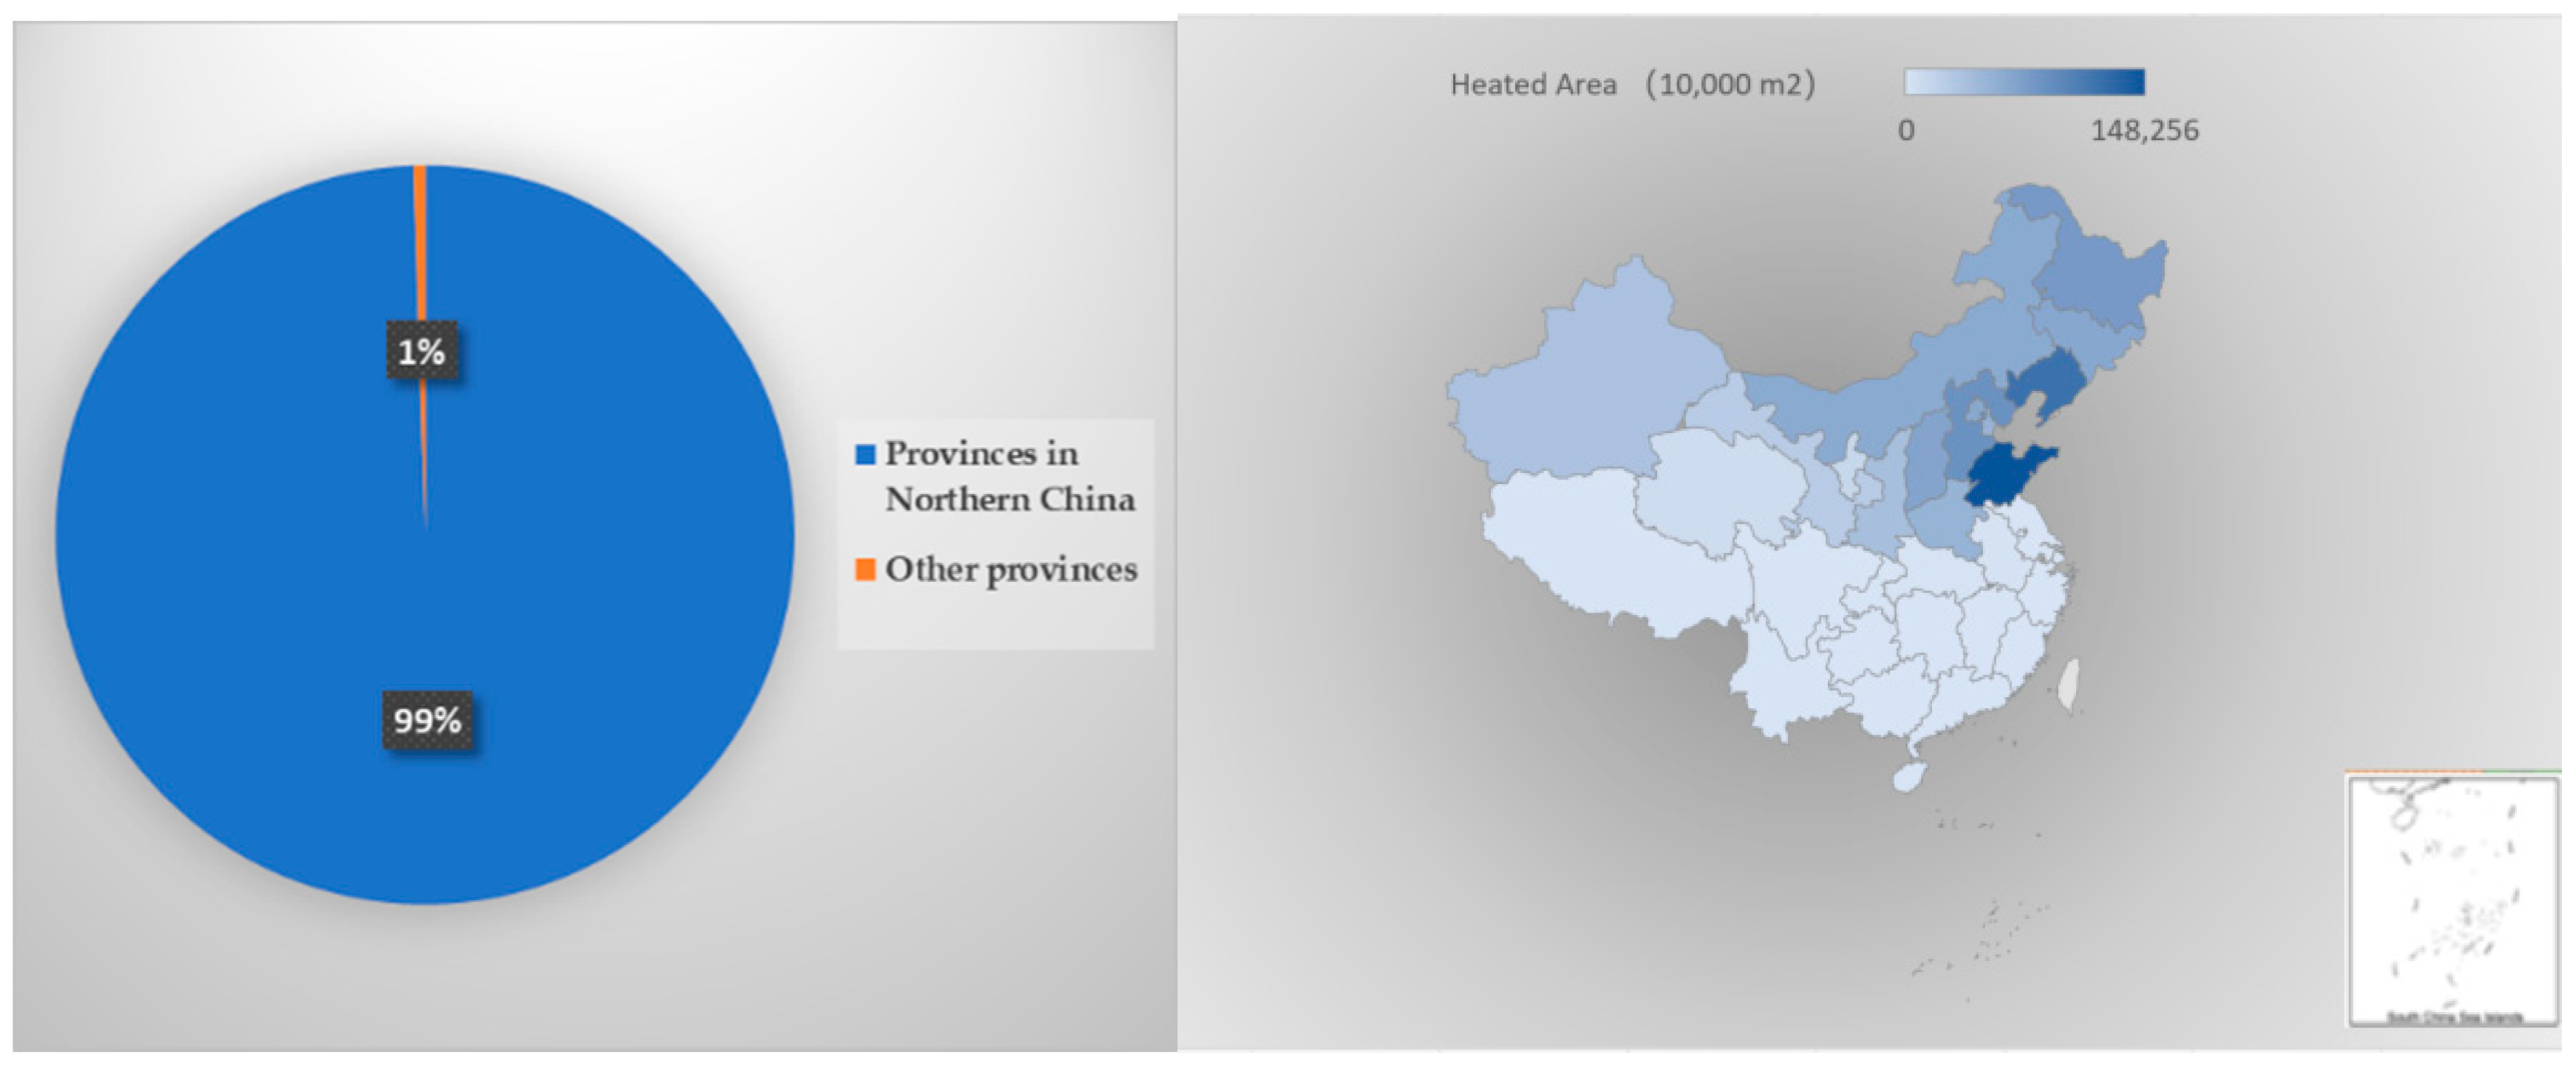
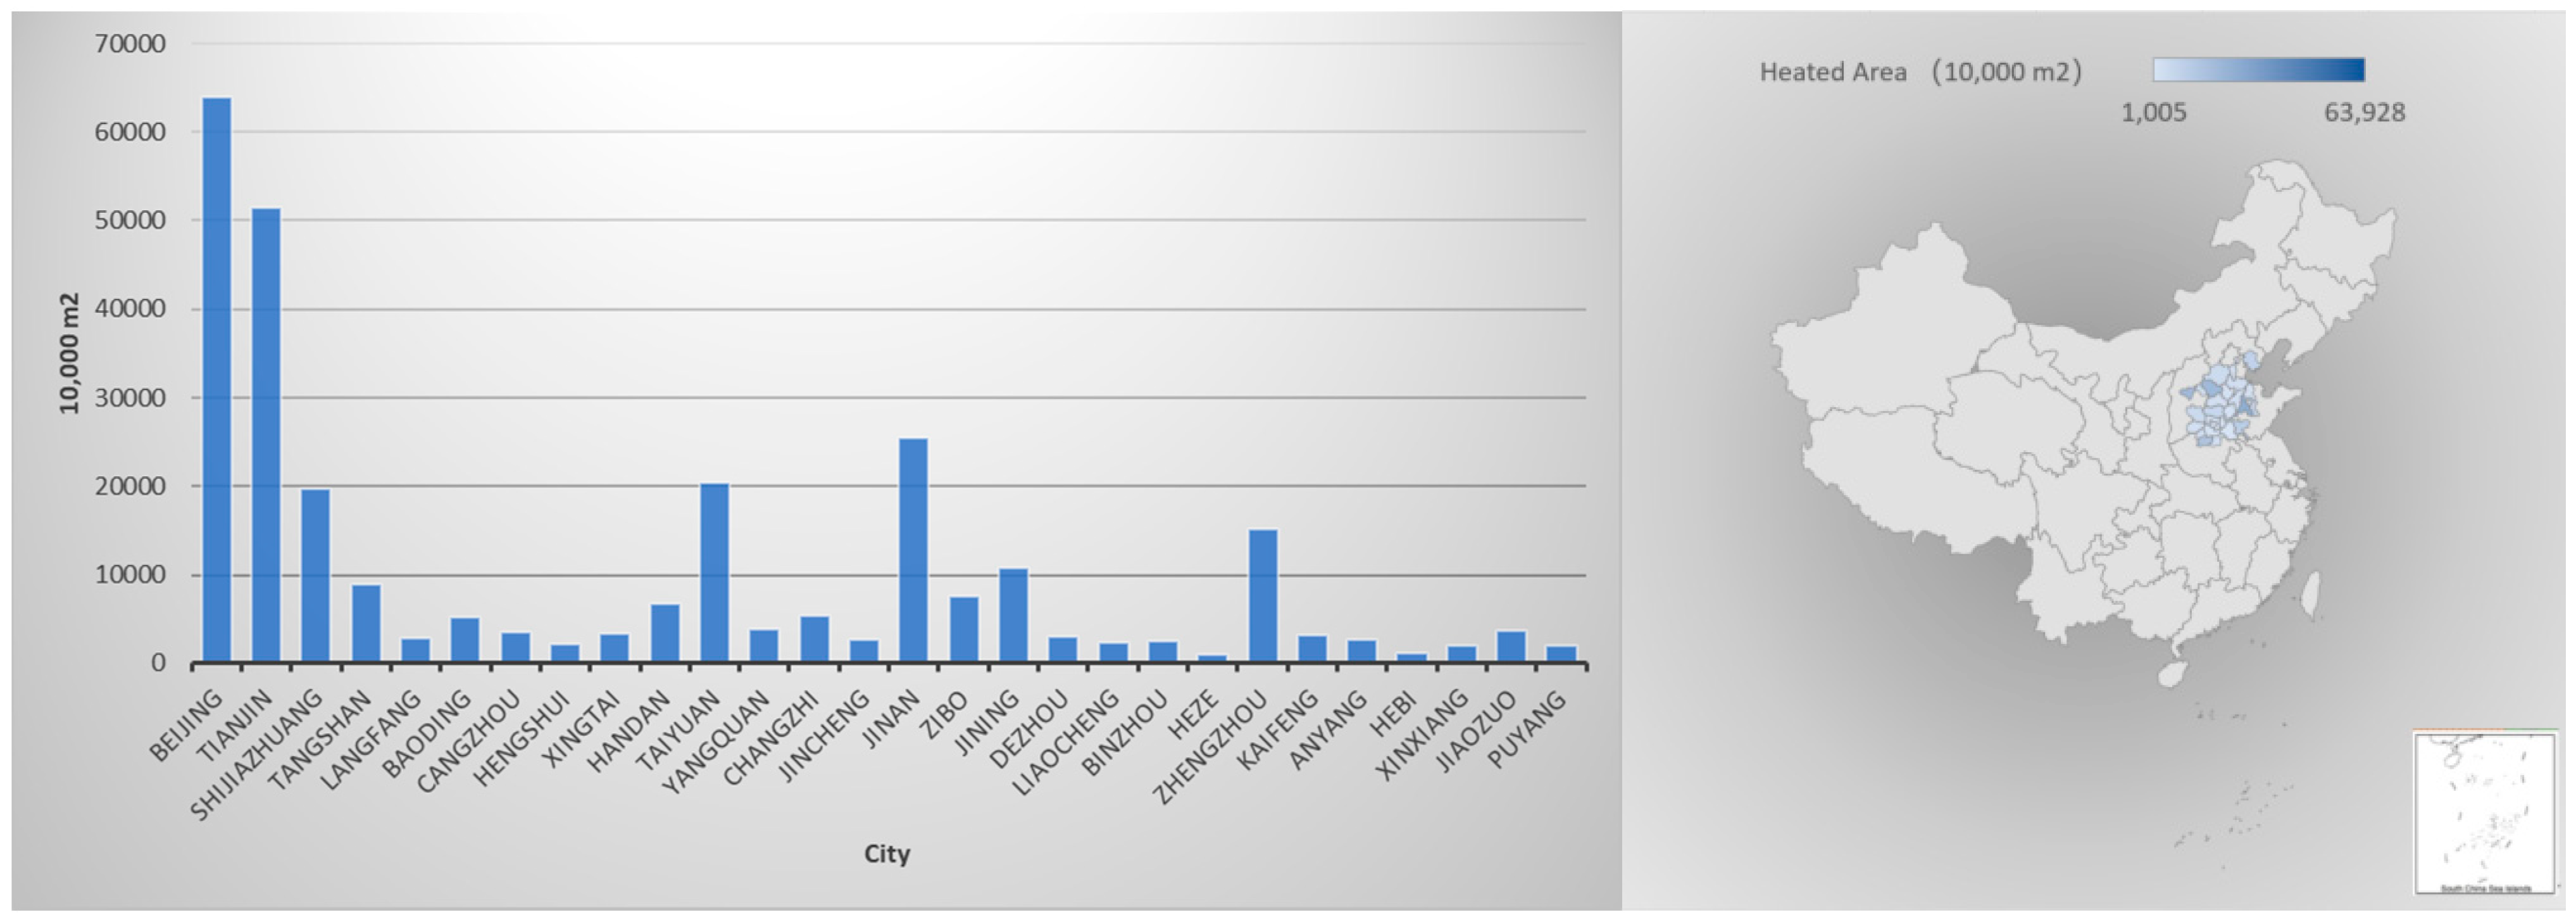
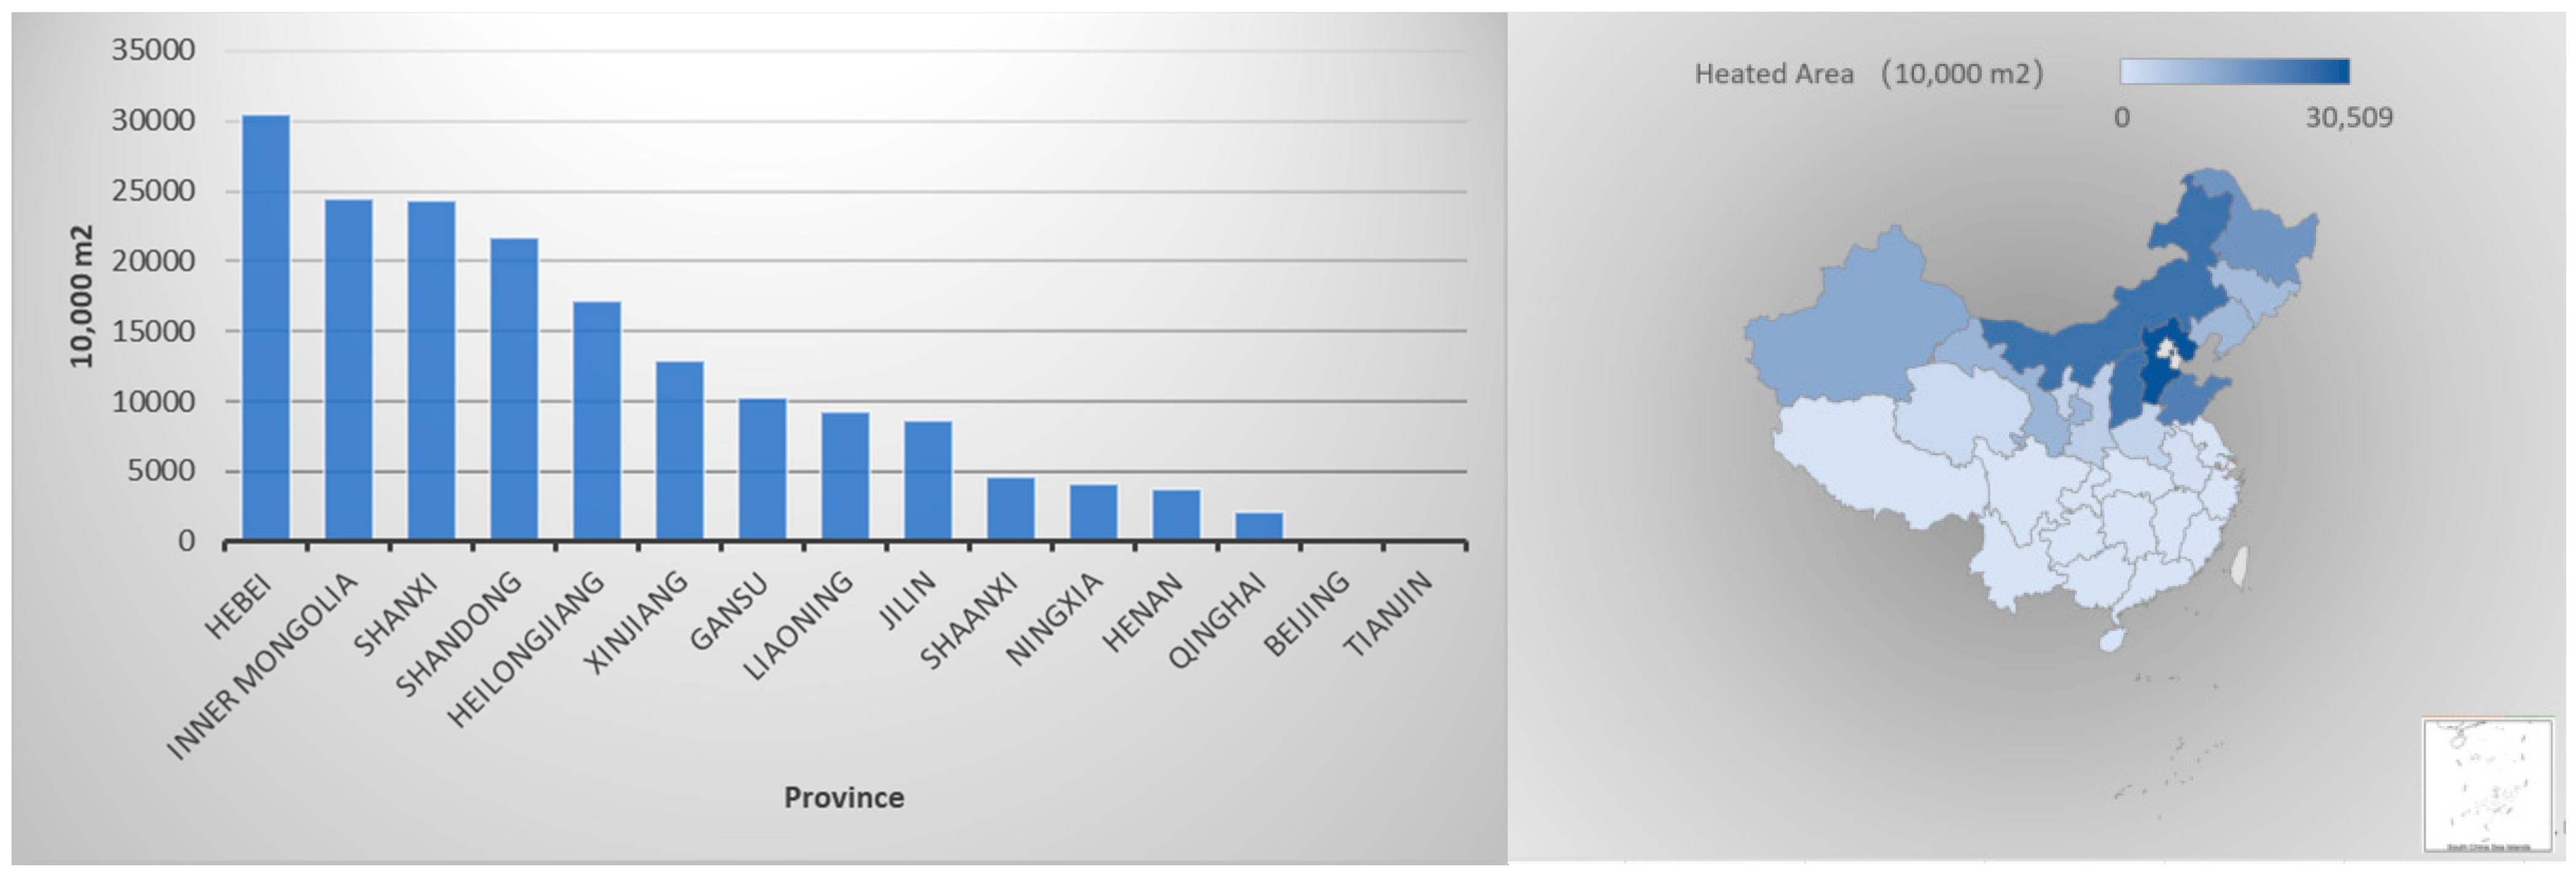
China’s heating mode can be divided into central heating and decentralized heating. In addition, researches report that central heating is a better way to promote clean heating due to its higher energy efficiency [29]. Figure 2, Figure 3 and Figure 4 show the distribution of central heating areas in urban and county seats, by province and city in 2019. Between Northern China and other provinces, there is a big gap in central heating areas.
3. Materials and Methods
Commonly used policy evaluation methods include the instrumental variable, difference-in-difference, matching, and regression discontinuity design [30,31,32,33,34]. At present, difference-in-difference and regression discontinuity design are used chiefly to analyze “coal-to-gas” and heating policies. Nevertheless, the regression discontinuity design reflects only partial effectiveness, and the difference-in-difference method is more suitable for this study. Thus, a difference-in-difference model was applied in this section to estimate the effects of the “Clean Heating Plan in Northern China (2017–2021)” on air pollutant concentration. Moreover, we chose the “2 + 26” cities as the treatment group and non “2 + 26” cities as the control group.
3.1. Difference-in-Difference Model
A difference-in-difference model was established to examine the impact of implementing the clean heating policy on improving local air quality.
yit = β0 + β1Treati ∗ Cgast + αZit + μi + ηt + εit
The subscript “i” represents the city; “t” represents date; “yit” represents urban daily average air pollutant concentration; “Treati” is dummy variable, “Treati = 1” represents treatment group, “Treati = 1” represents control group; “Cgast” represents dummy variables before and after policy implementation, “Cgast = 1” represents after the implementation of policy, “Cgast = 0” represents before the implementation of policy; “Zit” represents a set of control variables, including per capita GDP, the proportion of the secondary industry in the regional GDP, electricity consumption, total gas supply, green space coverage in built-up areas, and meteorological conditions (daily maximum temperature, daily minimum temperature, weather type, wind); “μi” represents urban fixed effect, “ηt” represents date fixed effect; and “εit” represents random error term. The estimated value of “β1” represents the net impact of the clean heating policy on air quality and is a vital part of the research results.
3.2. Measures
To complete the empirical analysis of the treatment and control groups using a difference-in-difference model, the dependent variables and control variables are shown in this part.
3.2.1. Treatment and Control Groups
This study used the “2 + 26” cities as the treatment group and non “2 + 26” cities as the control group. The publication date of the document was 5 December 2017, establishing the boundary of before and after the implementation of the policy. Then we changed the division of the treatment group and control group for the robustness test.
3.2.2. Air Pollutant Concentration
This study used the daily air quality index (AQI) of each city from 1 January 2016 to 31 December 2018 as the primary assessment index. In addition, the daily average concentrations of PM2.5, PM10, SO2, NO2, CO, and O3 reflect the effect of implementing the clean heating policy on the control of air pollutants. The data source was China’s air quality online monitoring and analysis platform.
3.2.3. Control Variables
In order to reflect the environmental effects, this paper controlled the main meteorological factors, economic society, and energy factors. The meteorological factors include the city’s daily maximum temperature, daily minimum temperature, weather type, wind direction, and wind force. The data came from the Tianqi.2345 network. The level of urban economic development, social structure, government investment, etc., will all affect the pollution status of a region. This study selected the per capita GDP, secondary industry as a proportion of the regional GDP, the electricity consumption, the total gas supply, and the green space coverage in built-up areas to control. The data came from the China City Statistical Yearbook. Part of the missing data was supplemented and improved according to each city’s annual statistical bulletin of national economic and social development. This article considers the control of green space coverage in built-up areas for the first time. This variable can reflect a city’s environmental conditions and governance goals to a certain extent, and is related to local air pollution. Due to the difficulty of obtaining city-level energy consumption data [12], the total annual coal and natural gas consumption at the provincial level was used for analysis. This study took into account the consistency of the data and referred to other studies, then selected the city-level electricity consumption for the whole society. It also supplemented the total gas supply. The total gas supply here refers to the total amount of gas supplied by city gas companies, including artificial and natural gas. Except for the dummy variables, the natural logarithm of other variables was taken for calculation.
3.2.4. Descriptive Statistics
Table 1 shows the descriptive statistical results of the main variables in this study. We collected more than 300,000 pieces of data from 2016 to 2018 in 274 cities. Among the pollutant concentrations, the average AQI was 79.747, and the average concentrations of PM2.5, PM10, SO2, NO2, CO, and O3 were 44.942 μg/m3, 79.469 μg/m3, 18.995 μg/m3, 31.296 μg/m3, 0.986 mg/m3, 91.505 μg/m3, respectively.
4. Results
Table 2 shows the results of the difference-in-difference regression, reflecting the causal effect of China’s clean heating policy on air pollution.
The results showed that after the implementation of the policy, the AQI index was significantly reduced by 7.0285; the daily average concentrations of PM2.5, PM10, NO2, and O3 were significantly reduced by 3.2130 μg/m3, 8.275 μg/m3, 1.539 μg/m3, 13.476 μg/m3, respectively; and SO2 and CO concentration increased. However, the increase in CO concentration is not significant; SO2 concentration increased by 3.817 μg/m3. From the above results, we find that the implementation of the clean heating policy significantly reduces the concentration of pollutants and improves air quality during the heating season.
In general, the AQI index, and PM2.5 and PM10 concentrations decreased significantly, indicating that the implementation of the policy can effectively improve winter air conditions in Northern China and its implementation is necessary.
5. Discussion
We also conducted a parallel trend test and robustness test to test the effectiveness of the results.
5.1. Parallel Trend Test
To ensure that the difference-in-difference regression result is valid, parallel trend testing is required. The treatment group and the control group should maintain parallel trends before implementing the policy. The reduction in air pollutant concentrations is the effect of the implementation of this policy. The regression equation is as Formula (2):
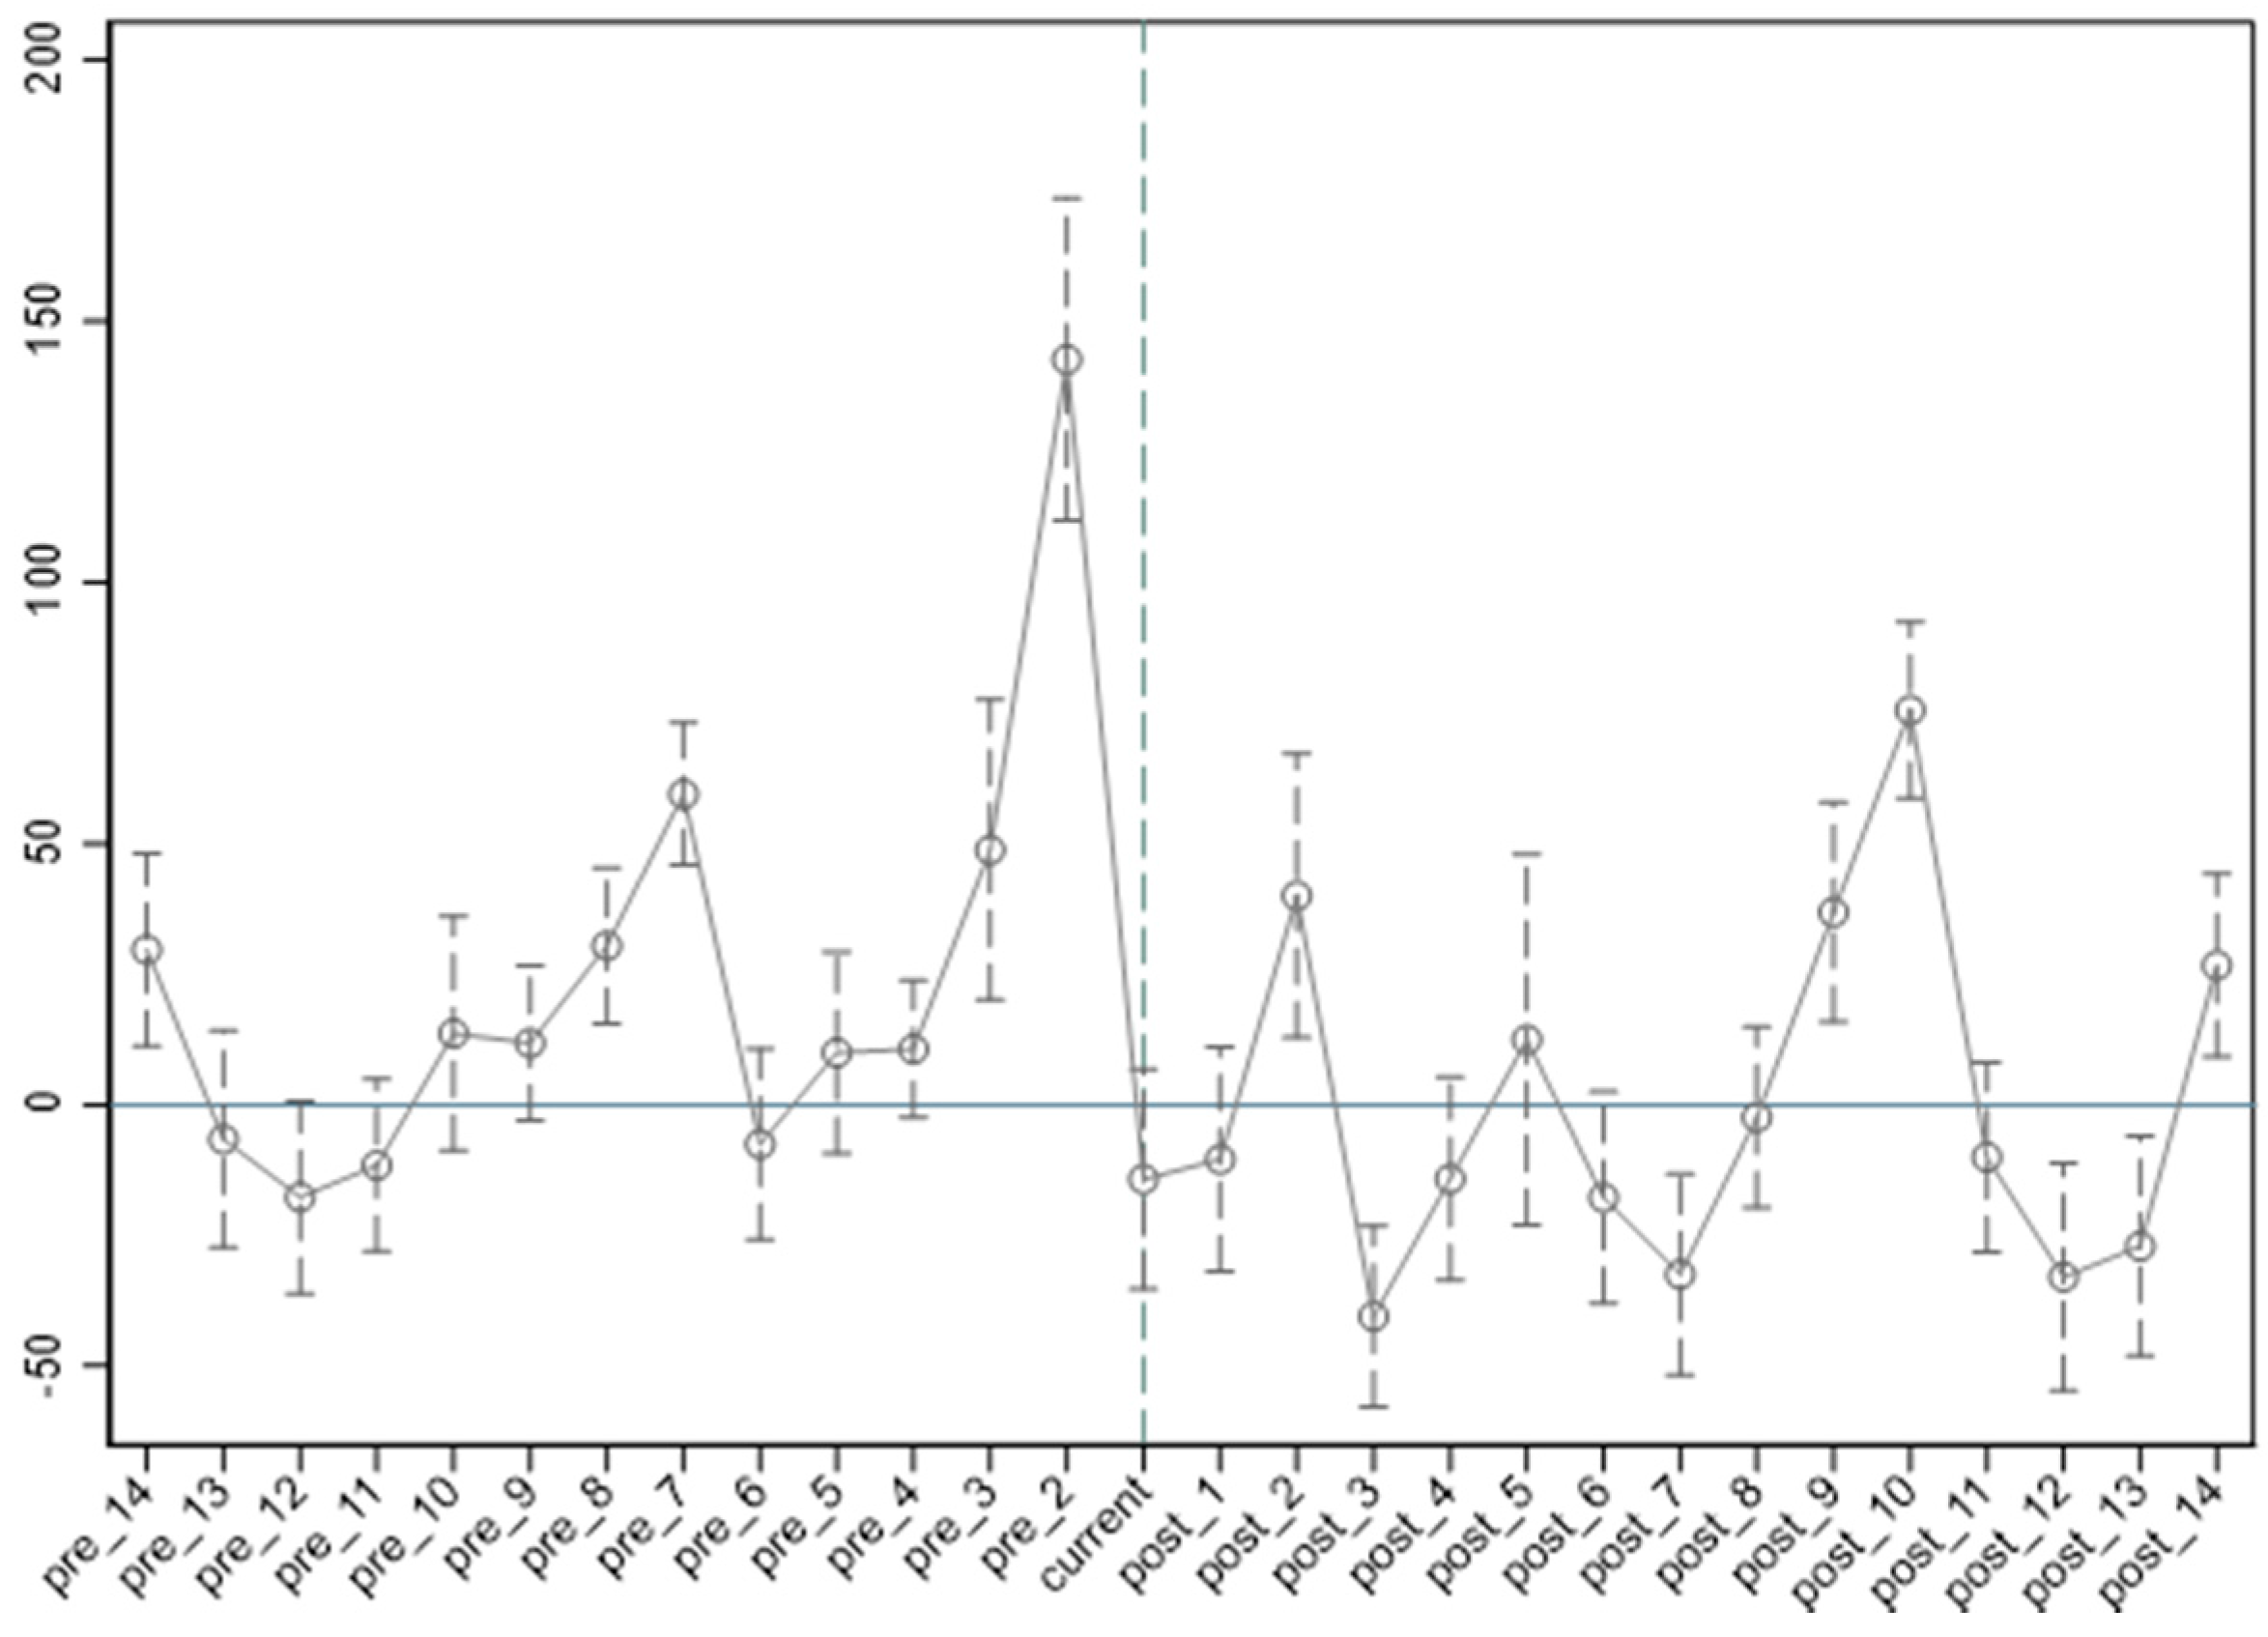
In the formula, “k” represents days before or after the policy implementation date (2017.12.05), “k < 0” represents k days before the policy implementation date, and “k > 0” represents k days after the policy implementation date. This article examines the trend of PM2.5 changes within the 14 days before and after implementing the policy.
Figure 5 shows the regression results. According to the position of the regression coefficient and the 95% confidence interval, it is easy to see that there is no significant difference between the treatment group and the control group (the 95% confidence interval was 0). The parallel trend assumption holds. There was a significant difference in the three days before the policy was released. This result may be because the Ministry of Environmental Protection issued a binding document on December 4 before the implementation date of the policy on December 5, proposing to adhere to the first principle of ensuring the warmth of the people through the winter. In the heating season, all projects or places that had not been completed would continue to use coal-fired heating methods or other alternative methods. The release of this document may have led to the increase in coal-fired heating and the concentration of air pollutants, causing this fluctuation; the most significant increase was on December 4. In [24], researchers believe that a possible reason is that the “2 + 26” cities themselves are areas with significant air pollution. The overall pollution situation is more substantial than in other cities. In general, before the introduction of this policy, the AQI index of the treatment group and the control group conformed to the parallel trend assumption.
5.2. Robustness Test
We also carried out a robustness test by adjusting the treatment group and the control group objects. First, since the policy was issued mainly for the northern winter heating problem, the control group was reduced to the winter centralized heating cities; secondly, the difference between centralized heating cities and non-centralized heating cities was considered. For comparison, the centralized heating cities were taken as the treatment group and non-centralized heating cities as the control group, to test the governance effects of this policy. The regression results are shown in Table 3 and Table 4, respectively.
After implementing the policy, with central heating cities as the control group, the AQI index of the “2 + 26” cities was significantly reduced by 7.235. The daily average concentrations of PM2.5, PM10, and O3 were significantly reduced by 3.408 μg/m3, 11.810 μg/m3, 10.808 μg/m respectively; the concentration of NO2 and CO decreased; and the concentration of SO2 increased, but not significantly. The results are consistent with the difference-in-difference and the result is robust. It shows that the clean heating policy has a more significant effect on improving air quality in the “2 + 26” cities, and the key points are prominent. Taking non-centralized heating cities as the control group, the centralized heating cities’ AQI index reduced significantly by 2.040, and the daily average concentrations of PM2.5, NO2, and O3 reduced significantly by 1.958 μg/m3, 1.610 μg/m3, 3.831 μg/m3, and PM10 by 1.200 μg/m3. However, SO2 and CO concentrations increased significantly by 3.068 μg/m3, 0.053 mg/m3, respectively. This result is consistent with the previous results both before and after implementing the policy and the result is stable, although the overall change is smaller than the “2 + 26” cities. This also reflects the current implementation process of the clean heating policy. Future planning can be based on each city’s energy structure and social and economic development conditions to further promote clean heating.
6. Conclusions and Implications
Based on the above analysis results, we drew corresponding conclusions and put forward three policy suggestions to improve the implementation effect of the clean heating policy. This section will show the conclusions and implications.
6.1. Conclusions
The empirical research results of this paper show that the implementation of the clean heating policy can reduce environmental pollution in the winter heating period in the north of our country and significantly reduce the concentration of major air pollutants such as PM2.5 and PM10. However, the policy has no significant effect on the reduction of SO2 concentration. Furthermore, the “gas shortage” problem for natural gas broke out during the 2017–2018 heating season. We believe that the main reason for this result is the failure to effectively estimate the new natural gas demand during the “coal-to-gas” process, which affected the policy’s implementation effect and resulted in the increase in the concentration of SO2.
6.2. Implications
In advancing the clean heating policy, the government should fully consider the state of energy use in our country. It should not be overly radical and adopt a one-size-fits-all approach to force all regions to switch. However, it should not shrink back from the implementation process and stick to the status quo of coal burning.
Firstly, a scientific estimate of the country’s winter heating demand should be made to avoid the “gas shortage” in the heating season of 2017–2018 in China, which hindered the promotion of the policy. Regardless of which energy source is used as a heat source, the basis and prerequisite for using a heating source remain to meet heating demand, primarily to ensure that people stay warm through the winter. Therefore, relevant departments and enterprises should scientifically estimate the year’s heating-season demand and make emergency plans to ensure people’s heating under extreme weather and meet the extreme contradiction between supply and demand.
Secondly, ensure the safety of the natural gas energy supply. In order to avoid the recurrence of the insufficient heating caused by the natural gas shortage, policy-making departments need to carry out the scientific modelling of natural energy demand, infrastructure, market pricing, and other aspects, in order to improve the emergency capability of the natural gas supply and implement gas sources before the transition. At the same time, the economic and social costs of “coal to gas” should be estimated, especially the acceptance of residents and the impact of local government financial subsidies. Improving supporting measures can help to smoothly pass the transition period and introducing market competition mechanisms can ensure the long-term sustainable development of clean heating.
Finally, improve the clean heating energy structure. Considering the natural energy resource endowment structure, energy production, and consumption, the local government should introduce the optimal combination of gas, electricity, renewable energy, and clean coal technology. At the same time, the scientific assessment of the energy structures of various regions is a problem that needs further research and discussion. Effective regulation and the dynamic adjustment of the standard and conversion quantity of “if gas is suitable for heating, use gas; if electricity is suitable for heating, use electricity” need to be carried out to avoid the problem of local government inaction or inadequacy. After the “2 + 26” cities promote the clean coal-burning project, the government should gradually implement the clean heating policy in batches and grades for the other central heating cities.
Author Contributions
Conceptualization, S.C. and H.C.; methodology, S.C.; software, S.C.; validation, S.C., H.C.; formal analysis, S.C.; investigation, S.C.; resources, H.C.; data curation, S.C.; writing—original draft preparation, S.C.; writing—review and editing, S.C., H.C.; visualization, S.C.; supervision, H.C.; project administration, S.C. All authors have read and agreed to the published version of the manuscript.
Funding
This research received no external funding.
Data Availability Statement
We use publicly available datasets in this study. Firstly, data of the AQI index and other concentrations of pollutants can be found here: https://www.aqistudy.cn/historydata/ (accessed on 10 February 2019). Secondly, data on weather can be found here: https://tianqi.2345.com/wea_history/71144.htm (accessed on 10 February 2019). Thirdly, data on economic and energy can be found in China’s urban statistical yearbook: http://www.stats.gov.cn/tjsj/tjcbw/202008/t20200824_1785460.html (accessed on 24 August 2020). Fourthly, central heating areas of Northern China and “2 + 26” cities at different levels can be found in the Statistical Yearbook of Urban and Rural Construction in 2019: http://www.mohurd.gov.cn/xytj/tjzljsxytjgb/jstjnj/ (accessed on 31 December 2020).
Conflicts of Interest
The author declares no conflict of interest.
References
- SDRC. Clean Heating Plan for Winter in the Northern Region (2017–2021). Available online: http://www.gov.cn/xinwen/2017-12/20/content_5248855.htm (accessed on 20 December 2017).
- Mao, X.Q.; Guo, X.R.; Chang, Y.G.; Peng, Y.D. Improving air quality in large cities by substituting natural gas for coal in China: Changing idea and incentive policy implications. Energy Policy 2005, 33, 307–318. [Google Scholar] [CrossRef]
- Deetjen, T.A.; Azevedo, I.L. Climate and Health Benefits of Rapid Coal-to-Gas Fuel Switching in the U.S. Power Sector Offset Methane Leakage and Production Cost Increases. Environ. Sci. Technol. 2020, 54, 11494–11505. [Google Scholar] [CrossRef] [PubMed]
- Li, N.; Zhang, X.; Shi, M.; Hewings, G.J. Does China’s air pollution abatement policy matter? An assessment of the Beijing-Tianjin-Hebei region based on a multi-regional CGE model. Energy Policy 2019, 127, 213–227. [Google Scholar] [CrossRef]
- China Association of Building Energy Efficiency. 2019 China Building Energy Consumption Research Report. Available online: https://www.cabee.org/site/content/23565.html (accessed on 10 April 2020).
- Xiao, Q.; Ma, Z.; Li, S.; Liu, Y. The impact of winter heating on air pollution in china. PLoS ONE 2015, 10. [Google Scholar] [CrossRef] [PubMed] [Green Version]
- Cai, S.; Wang, Y.; Zhao, B.; Wang, S.; Xing, C.; Hao, J. The impact of the “air pollution prevention and control action plan” on pm2.5 concentrations in jing-jin-ji region during 2012–2020. Sci. Total Environ. 2017, 580, 197–209. [Google Scholar] [CrossRef] [PubMed]
- Han, J.; Yu, J.; Niu, C. Study on the influence of natural gas substitution of coal in home heating in reducing air pollutant emission in Hebei. J. Saf. Environ. 2018. [Google Scholar] [CrossRef]
- Li, X.; Qiao, Y.; Shi, L. The aggregate effect of air pollution regulation on CO2 mitigation in China’s manufacturing industry: An econometric analysis. J. Clean. Prod. 2017, 142, 976–984. [Google Scholar] [CrossRef]
- Weng, Z.; Han, E.; Wu, Y.; Shi, L.; Ma, Z. Environmental and economic impacts of transitioning to cleaner heating in Northern China. Resour. Conserv. Recycl. 2021, 172. [Google Scholar] [CrossRef]
- Wang, H.; Zhao, L. A joint prevention and control mechanism for air pollution in the beijing-tianjin-hebei region in china based on long-term and massive data mining of pollutant concentration. Atmos. Environ. 2018, 174, 25–42. [Google Scholar] [CrossRef]
- Luo, Z.; Li, H. The impact of “atmosphere ten articles” policy on air quality in china. China Ind. Econ. 2018, 366, 138–156. [Google Scholar] [CrossRef]
- Shi, D.; Li, S. The Effect of Green Cooperative Development in Beijing-Tianjin-Hebei Region _ A Quasi-Natural Experiment Based on the Policy of “Coal-to-Gas /Electricity”. Res. Econ. Manag. 2018, 39, 64. [Google Scholar] [CrossRef]
- Yu, C.; Kang, J.; Teng, J.; Long, H.; Fu, Y. Does coal-to-gas policy reduce air pollution? Evidence from a quasi-natural experiment in China. Sci. Total Environ. 2021, 773, 144645. [Google Scholar] [CrossRef]
- Liu, Z.; Chen, X.; Cai, J.; Baležentis, T.; Li, Y. The Impact of “Coal to Gas” Policy on Air Quality: Evidence from Beijing, China. Energies 2020, 13, 3876. [Google Scholar] [CrossRef]
- Khan, M.R.; Sarkar, B. Change Point Detection for Diversely Distributed Stochastic Processes Using a Probabilistic Method. Inventions 2019, 4, 42. [Google Scholar] [CrossRef] [Green Version]
- Khan, M.R.; Sarkar, B. Change Point Detection for Airborne Particulate Matter (PM2.5, PM10) by Using the Bayesian Approach. Mathematics 2019, 7, 474. [Google Scholar] [CrossRef] [Green Version]
- Li, Y.; Yuan, X.; Tang, Y.; Wang, Q.; Ma, Q.; Mu, R.; Fu, J.; Hong, J.; Kellett, J.; Zuo, J. Integrated assessment of the environmental and economic effects of “coal-to-gas conversion” project in rural areas of northern China. Environ. Sci. Pollut. Res. 2020, 27, 14503–14514. [Google Scholar] [CrossRef]
- Chen, J.; Shan, M.; Xia, J.; Jiang, Y. Effects of space heating on the pollutant emission intensities in “2+26” cities. Build. Environ. 2020, 175, 106817. [Google Scholar] [CrossRef]
- Färe, R.; Grosskopf, S.; Pasurka, C.A., Jr. Accounting for air pollution emissions in measures of state manufacturing productivity growth. J. Reg. Sci. 2001, 41, 381–409. [Google Scholar] [CrossRef]
- Lin, B.; Jia, Z. Economic, energy and environmental impact of coal-to-electricity policy in China: A dynamic recursive CGE study. Sci. Total Environ. 2019, 698, 134241. [Google Scholar] [CrossRef] [PubMed]
- Ou, C.; Li, S.; Zhang, J.; Zhang, J.; Sun, J.; Song, F. Boiler Transforming from Using Coal into Using Natural Gas in Chongqing and Analysis of Its Environmental Benefits. J. Chongqing Univ. Nat. Sci. Ed. 2004, 027, 100–104. [Google Scholar]
- Liu, S.; Hua, S.; Wang, K.; Qiu, P.; Tian, H. Spatial-temporal variation characteristics of air pollution in Henan of china: Localized emission inventory, WRF/Chem simulations and potential source contribution analysis. Sci. Total Environ. 2017, 624, 396. [Google Scholar] [CrossRef]
- Wang, Q.; Zheng, S. Impact of joint prevention and control action on atmospheric pollutant concentration in ‘2 + 26’cities. China Popul. Resour. Environ. 2019, 29, 51–62. [Google Scholar]
- Liang, J.; He, P.; Qiu, Y.L. Energy transition, public expressions, and local officials’ incentives: Social media evidence from the coal-to-gas transition in China. J. Clean. Prod. 2021, 298, 126771. [Google Scholar] [CrossRef]
- Xie, W.; Chen, C.; Li, F.; Cai, B.; Yang, R.; Cao, L.; Wu, P.; Pang, L. Key Factors of Rural Households’ Willingness to Pay for Cleaner Heating in Hebi: A Case Study in Northern China. Sustainability 2021, 13, 633. [Google Scholar] [CrossRef]
- Zhang, Y.; Li, W.; Wu, F. Does energy transition improve air quality? Evidence derived from China’s Winter Clean Heating Pilot (WCHP) project. Energy 2020, 206. [Google Scholar] [CrossRef]
- Xu, S.; Ge, J. Sustainable shifting from coal to gas in North China: An analysis of resident satisfaction. Energy Policy 2020, 138, 111296. [Google Scholar] [CrossRef]
- Liu, G.; Kong, Z.; Dong, J.; Dong, X.; Jiang, Q.; Wang, K.; Li, J.; Li, C.; Wan, X. Influencing Factors, Energy Consumption, and Carbon Emission of Central Heating in China: A Supply Chain Perspective. Front. Energy Res. 2021, 9. [Google Scholar] [CrossRef]
- Nichols, A. Causal inference with observational data. Stata J. 2007, 7, 507–541. Available online: https://econpapers.repec.org/article/tsjstataj/v_3a7_3ay_3a2007_3ai_3a4_3ap_3a507-541.htm (accessed on 20 December 2017). [CrossRef] [Green Version]
- Urpelainen, J.; Yang, J.; Di, L. Power Sector Reforms and Technical Performance: Good News from an Instrumental Variable Analysis. Rev. Policy Res. 2018, 35. [Google Scholar] [CrossRef]
- Lange, I.; Moro, M.; Rahman, M.M. Cleaner Nudges? Policy Labels and Investment Decision-making. Energy J. 2018, 39, 27–51. [Google Scholar] [CrossRef]
- Omay, R.E. The relationship between environment and income: Regression spline approach. Int. J. Energy Econ. Policy 2013, 3, 52–61. [Google Scholar]
- Chang, H.H.; Mishra, A.K.; Livingston, M. Agricultural policy and its impact on fuel usage: Empirical evidence from farm household analysis. Appl. Energy 2011, 88, 348–353. [Google Scholar] [CrossRef]
Figure 1.
Geographical distribution of Northern China and the “2 + 26” cities. Source: Clean Heating Plan for Winter in the Northern Region 2017–2021 (http://www.gov.cn/xinwen/2017-12/20/content_5248855.htm (accessed on 20 December 2017)).
Figure 1.
Geographical distribution of Northern China and the “2 + 26” cities. Source: Clean Heating Plan for Winter in the Northern Region 2017–2021 (http://www.gov.cn/xinwen/2017-12/20/content_5248855.htm (accessed on 20 December 2017)).

Figure 2.
Urban central heating areas by province in China, in 2019. Source: Statistical Yearbook of Urban and Rural Construction in 2019 (http://www.mohurd.gov.cn/xytj/tjzljsxytjgb/jstjnj/ (accessed on 31 December 2020)).
Figure 2.
Urban central heating areas by province in China, in 2019. Source: Statistical Yearbook of Urban and Rural Construction in 2019 (http://www.mohurd.gov.cn/xytj/tjzljsxytjgb/jstjnj/ (accessed on 31 December 2020)).

Figure 3.
Urban central heating areas by city in the “2 + 26” cities, in 2019. Source: Statistical Yearbook of Urban and Rural Construction in 2019 (http://www.mohurd.gov.cn/xytj/tjzljsxytjgb/jstjnj/ (accessed on 31 December 2020)).
Figure 3.
Urban central heating areas by city in the “2 + 26” cities, in 2019. Source: Statistical Yearbook of Urban and Rural Construction in 2019 (http://www.mohurd.gov.cn/xytj/tjzljsxytjgb/jstjnj/ (accessed on 31 December 2020)).

Figure 4.
County seat central heating by province in China, in 2019. Source: Statistical Yearbook of Urban and Rural Construction in 2019 (http://www.mohurd.gov.cn/xytj/tjzljsxytjgb/jstjnj/ (accessed on 31 December 2020)).
Figure 4.
County seat central heating by province in China, in 2019. Source: Statistical Yearbook of Urban and Rural Construction in 2019 (http://www.mohurd.gov.cn/xytj/tjzljsxytjgb/jstjnj/ (accessed on 31 December 2020)).

Figure 5.
Results of the parallel trend test.


Table 1.
Descriptive statistics of main variables.
| Variable Name | Unit | Average Value | Standard Deviation | Minimum | Max |
|---|---|---|---|---|---|
| AQI index | μg/m3 | 79.747 | 45.115 | 10.000 | 500.000 |
| Daily average concentration of PM2.5 | μg/m3 | 44.942 | 36.109 | 1.000 | 704.000 |
| Daily average concentration of PM10 | μg/m3 | 79.469 | 60.901 | 4.000 | 2920.000 |
| Daily average concentration of SO2 | μg/m3 | 18.995 | 20.466 | 1.000 | 858.000 |
| Daily average concentration of NO2 | μg/m3 | 31.296 | 17.074 | 2.000 | 183.000 |
| Daily average concentration of CO | mg/m3 | 0.986 | 0.527 | 0.100 | 18.400 |
| Daily average concentration of O3 | μg/m3 | 91.505 | 43.654 | 1.000 | 586.000 |
| Highest daily temperature | °C | 20.515 | 10.802 | −32.000 | 41.000 |
| Lowest daily temperature | °C | 11.371 | 11.236 | −42.000 | 32.000 |
| The proportion of the secondary industry in the year | 0.446 | 0.091 | 0.177 | 0.729 | |
| The coverage rate of green space in the built-up area | 0.403 | 0.055 | 0.031 | 0.938 | |
| Log value of per capita GDP | 10.838 | 0.513 | 9.422 | 12.281 | |
| Log value of electricity consumption in the whole society | 13.899 | 1.018 | 10.079 | 16.567 | |
| Log value of total gas supply | 9.355 | 1.572 | 1.946 | 14.466 |
Table 2.
The impact of the clean heating policy on the concentration of air pollutants.
| (1) | (2) | (3) | (4) | (5) | (6) | (7) | |
|---|---|---|---|---|---|---|---|
| AQI | PM2.5 | PM10 | SO2 | NO2 | CO | O3 | |
| ddd | −7.029 *** | −3.213 ** | −8.275 *** | 3.817 *** | −1.539 ** | 0.028 | −13.476 *** |
| (1.563) | (1.314) | (1.972) | (0.863) | (0.689) | (0.029) | (1.425) | |
| Highest temperature | 2.8060 *** | 1.5133 *** | 3.5437 *** | 0.5644 *** | 0.8977 *** | 0.0119 *** | 3.4225 *** |
| (0.071) | (0.056) | (0.092) | (0.039) | (0.024) | (0.001) | (0.077) | |
| Lowest temperature | −1.294 *** | −0.791 *** | −2.276 *** | −1.005 *** | −0.730 *** | −0.008 *** | −1.172 *** |
| (0.086) | (0.066) | (0.102) | (0.056) | (0.029) | (0.001) | (0.096) | |
| Proportion of secondary industry | 4.528 | 0.473 | 11.658 | 25.967 *** | 7.373 | 0.631 *** | −0.432 |
| (10.084) | (9.675) | (13.672) | (6.557) | (5.754) | (0.209) | (11.663) | |
| Per capita GDP logarithm | 3.083 | 4.306 * | 4.413 | −1.525 | −0.824 | −0.094 ** | −1.093 |
| (2.102) | (2.293) | (3.089) | (1.037) | (1.055) | (0.044) | (2.405) | |
| Logarithmic power consumption | 1.669 *** | 0.853 * | 1.186 | 1.142 ** | 0.234 | 0.039 *** | 2.533 *** |
| (0.636) | (0.510) | (0.833) | (0.579) | (0.382) | (0.013) | (0.806) | |
| Greenland coverage | 2.808 | 7.961 *** | 7.568 | −8.552 *** | 4.246 * | 0.300 *** | 6.797 |
| (3.679) | (2.839) | (5.185) | (3.191) | (2.280) | (0.105) | (7.918) | |
| Log value of total gas supply | 0.342 | 0.674 * | 1.159 * | 0.310 | −0.102 | 0.020 ** | 0.562 |
| (0.499) | (0.409) | (0.666) | (0.378) | (0.210) | (0.009) | (0.630) | |
| Constant term | 92.275 | −8462.632 ** | 7579.075 *** | 8102.746 *** | 3573.643 *** | −46.186 ** | 15,543.189 *** |
| (1870.9144) | (3346.3371) | (1668.2010) | (1635.0929) | (1091.9893) | (18.1785) | (1662.7290) | |
| Number of observations | 300,304 | 300,304 | 300,304 | 300,304 | 300,304 | 300,304 | 300,304 |
| R2 | 0.388 | 0.455 | 0.421 | 0.499 | 0.625 | 0.536 | 0.581 |
| Date fixed effect | YES | YES | YES | YES | YES | YES | YES |
| Urban fixed effect | YES | YES | YES | YES | YES | YES | YES |
Note: *, **, *** indicate significance levels of 10%, 5%, and 1%, respectively.
Table 3.
Robustness test: control group shrinks to other centralized heating cities.
| (1) | (2) | (3) | (4) | (5) | (6) | (7) | |
|---|---|---|---|---|---|---|---|
| AQI | PM2.5 | PM10 | SO2 | NO2 | CO | O3 | |
| ddd | −7.235 *** | −3.408 ** | −11.810 *** | 0.902 | −1.000 | −0.033 | −10.808 *** |
| (1.582) | (1.413) | (2.145) | (1.011) | (0.778) | (0.032) | (1.785) | |
| Number of observations | 123,848 | 123,848 | 123,848 | 123,848 | 123,848 | 123,848 | 123,848 |
| R2 | 0.343 | 0.484 | 0.414 | 0.528 | 0.640 | 0.568 | 0.671 |
| Date fixed effect | YES | YES | YES | YES | YES | YES | YES |
| Urban fixed effect | YES | YES | YES | YES | YES | YES | YES |
Note: ** and *** indicate significance levels of 5% and 1%, respectively.
Table 4.
Robustness test: treatment group relaxes for centralized heating cities.
| (1) | (2) | (3) | (4) | (5) | (6) | (7) | |
|---|---|---|---|---|---|---|---|
| AQI | PM2.5 | PM10 | SO2 | NO2 | CO | O3 | |
| ddd | −2.040 ** | −1.958 ** | −1.200 | 3.068 *** | −1.610 *** | 0.053 *** | −3.831 *** |
| (0.984) | (0.847) | (1.271) | (0.595) | (0.427) | (0.018) | (1.328) | |
| Number of observations | 300,304 | 300,304 | 300,304 | 300,304 | 300,304 | 300,304 | 300,304 |
| R2 | 0.388 | 0.455 | 0.421 | 0.499 | 0.625 | 0.536 | 0.581 |
| Date fixed effect | YES | YES | YES | YES | YES | YES | YES |
| Urban fixed effect | YES | YES | YES | YES | YES | YES | YES |
Note: ** and *** indicate significance levels of 5% and 1%, respectively.
Publisher’s Note: MDPI stays neutral with regard to jurisdictional claims in published maps and institutional affiliations. |
© 2021 by the authors. Licensee MDPI, Basel, Switzerland. This article is an open access article distributed under the terms and conditions of the Creative Commons Attribution (CC BY) license (https://creativecommons.org/licenses/by/4.0/).
Share and Cite
MDPI and ACS Style
Chen, S.; Chi, H. Analysis of the Environmental Effects of the Clean Heating Policy in Northern China. Sustainability 2021, 13, 6695. https://0-doi-org.brum.beds.ac.uk/10.3390/su13126695
AMA Style
Chen S, Chi H. Analysis of the Environmental Effects of the Clean Heating Policy in Northern China. Sustainability. 2021; 13(12):6695. https://0-doi-org.brum.beds.ac.uk/10.3390/su13126695
Chicago/Turabian StyleChen, Siyu, and Hong Chi. 2021. "Analysis of the Environmental Effects of the Clean Heating Policy in Northern China" Sustainability 13, no. 12: 6695. https://0-doi-org.brum.beds.ac.uk/10.3390/su13126695
Note that from the first issue of 2016, this journal uses article numbers instead of page numbers. See further details here.