
Biogas Production Potential from Livestock Manure in Pakistan


 ,
,  , , ,
, , ,  ,
, 
Abstract
:1. Introduction
2. Methodology
2.1. Calculation of Livestock Population
2.2. Calculation and Measurement of Total Amount of Livestock Manure in Pakistan
2.3. Calculation of Total Potential of Biogas Production from Livestock Manure
2.4. Calculation of Potential of Methane and Electricity Production from Livestock Manure
3. Results and Discussion
3.1. Livestock Population and Potential of Biodigester Technology
3.2. Suitability of Livestock Manure as a Potential Substrate for Biodigester Technology
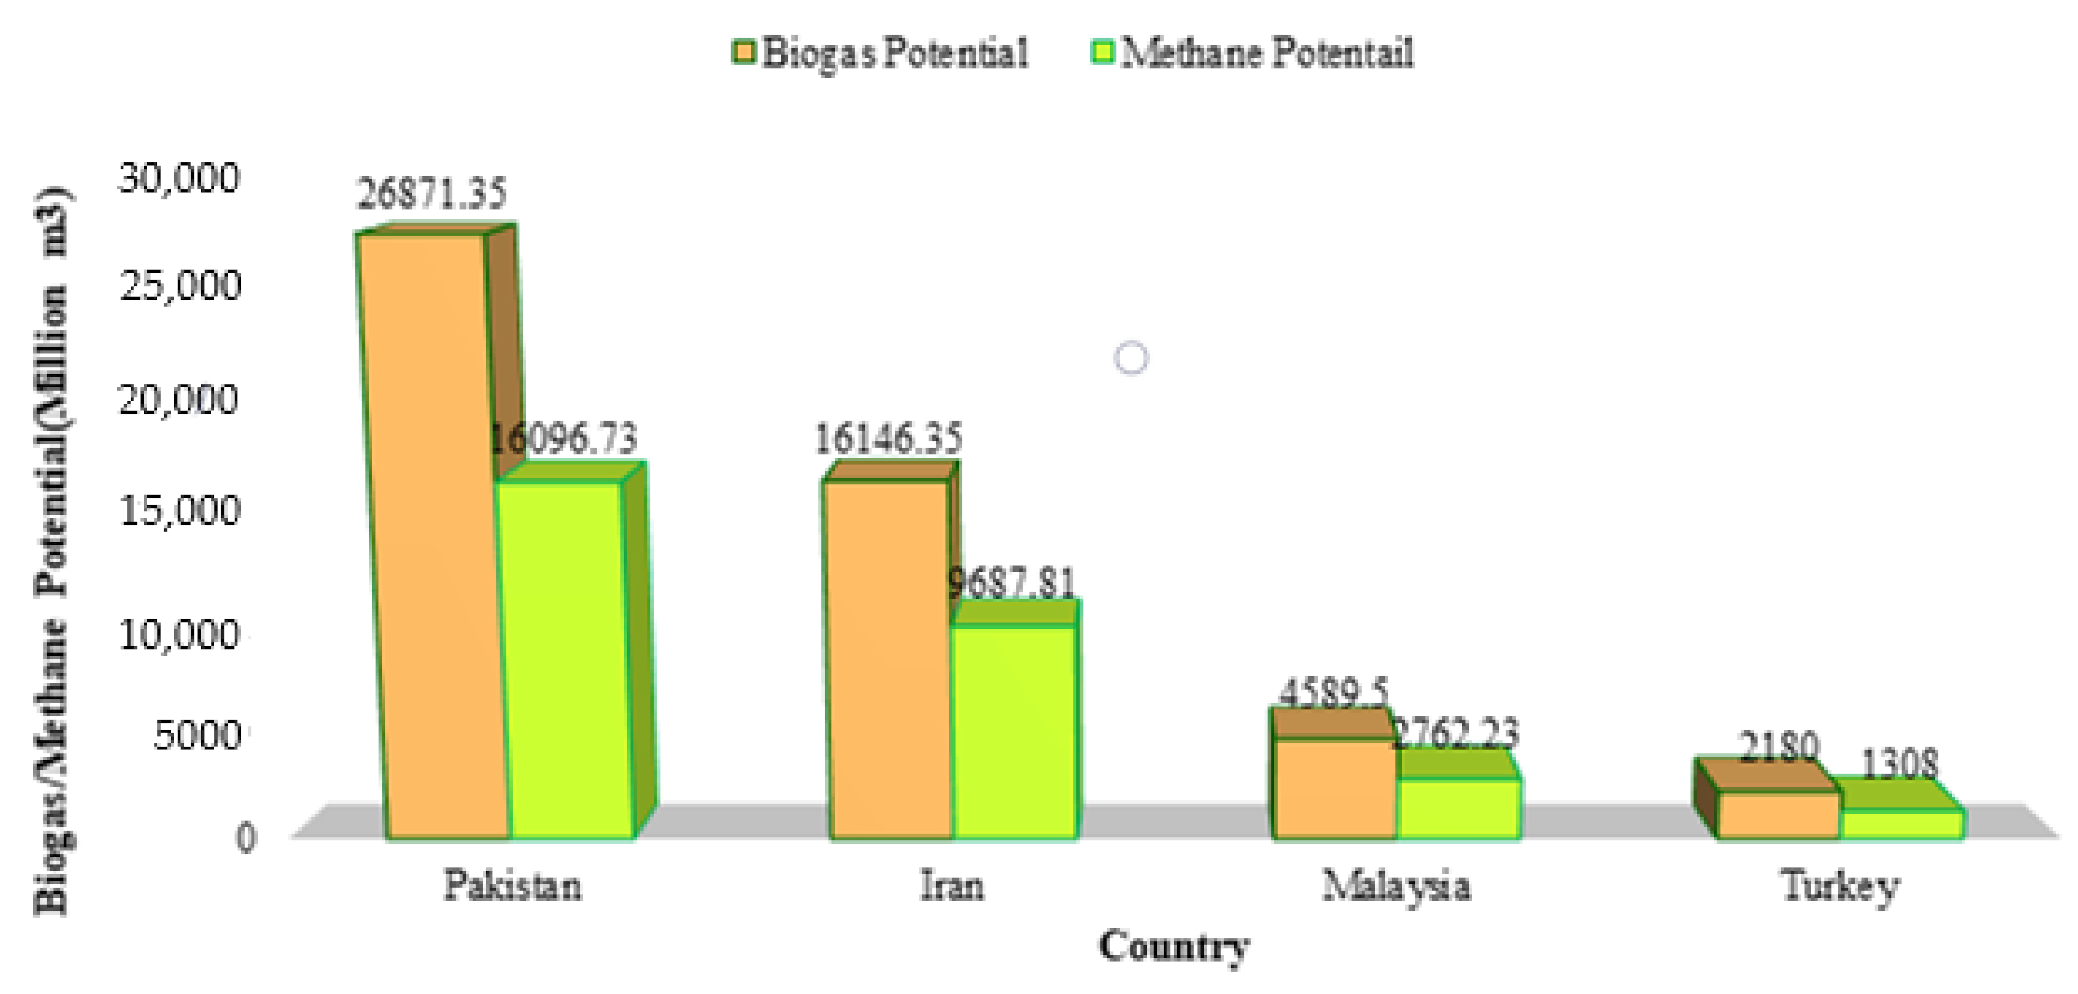
3.3. Potential of Biogas Production from the Utilization of Biodigester Technology
3.4. Potential of Methane Production from the Utilization of Biodigester Technology
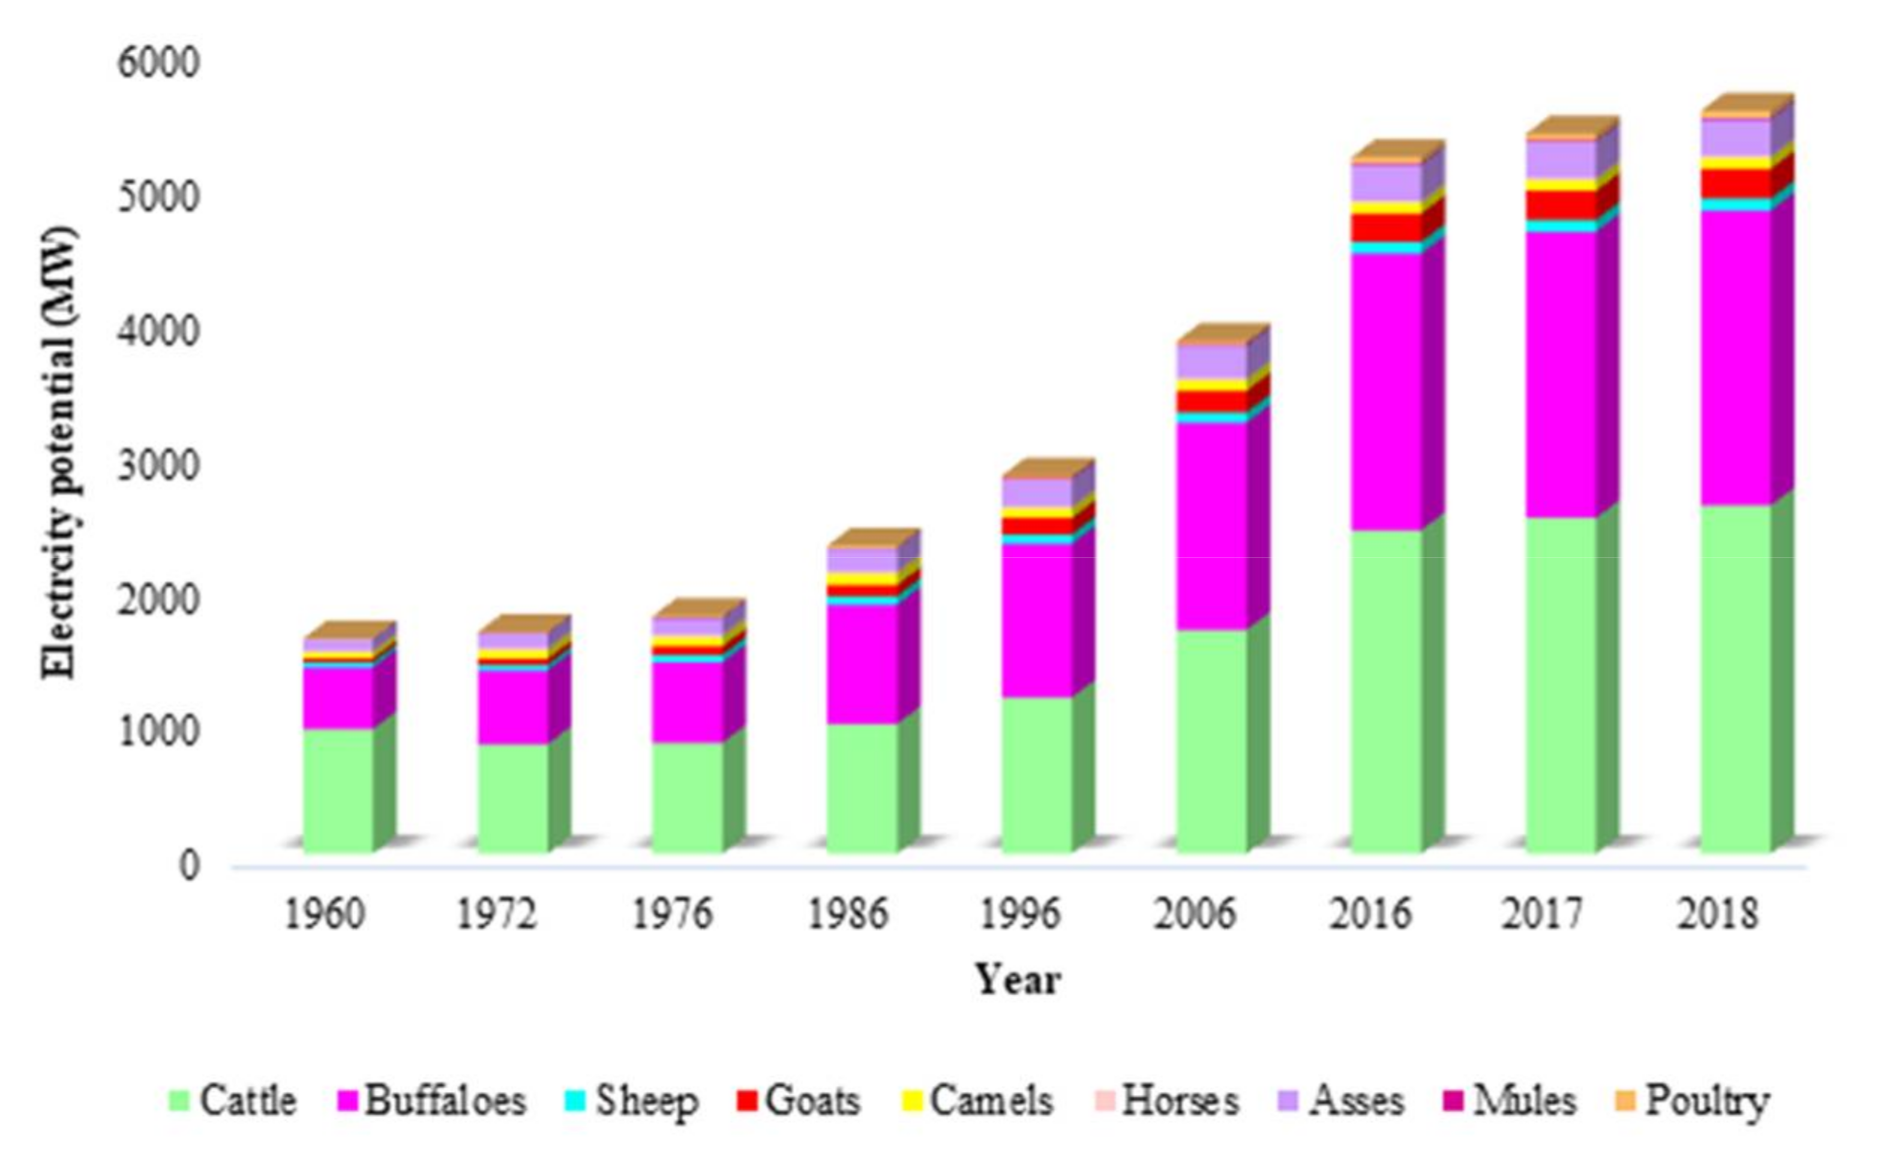
3.5. Potential of Heat Energy and Electricity Production from Biodigester Technology
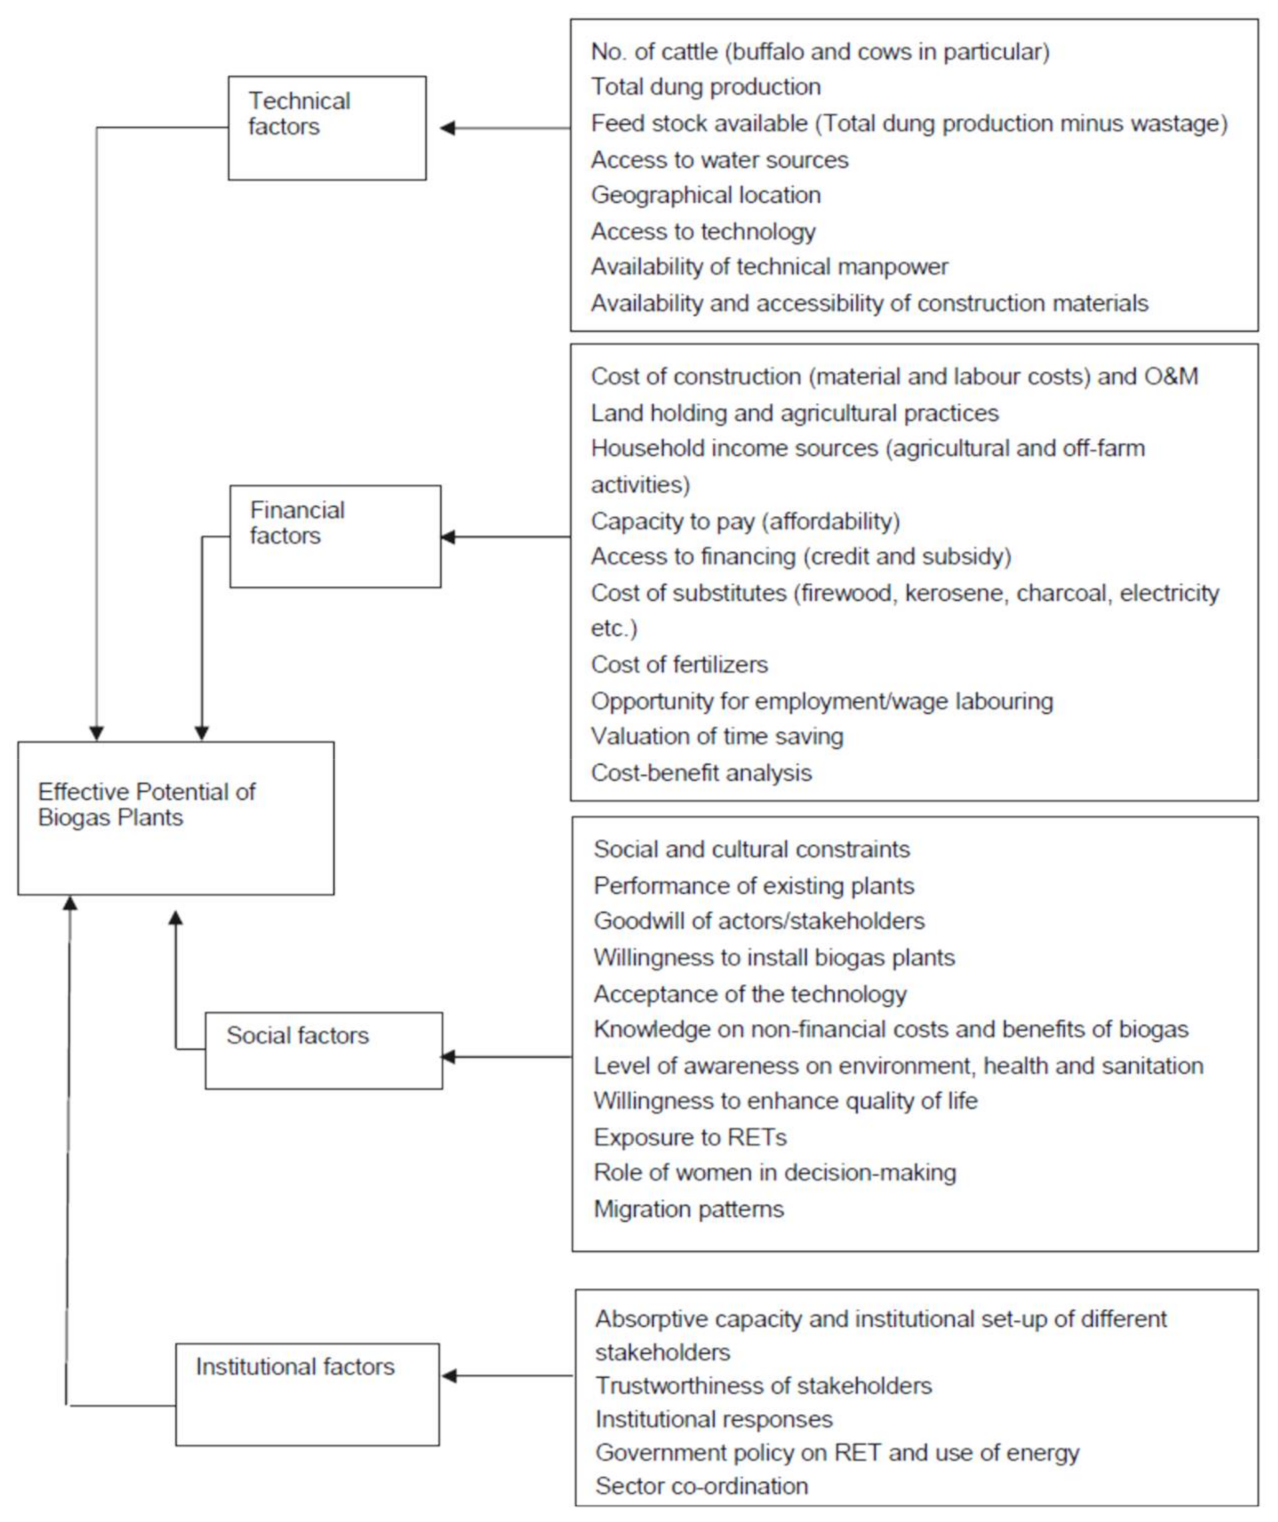
3.6. Feasibility and Suitability of Biodigester Technology in Pakistan
4. Conclusions
Author Contributions
Funding
Institutional Review Board Statement
Data Availability Statement
Acknowledgments
Conflicts of Interest
References
- Uddin, W.; Zeb, K.; Haider, A.; Khan, B.; Islam, S.U.; Ishfaq, M.; Khan, I.; Adil, M.; Kim, H.J. Current and future prospects of small hydro power in Pakistan: A survey. Energy Strat. Rev. 2019, 24, 166–177. [Google Scholar] [CrossRef]
- Shakeel, S.R.; Takala, J.; Shakeel, W. Renewable energy sources in power generation in Pakistan. Renew. Sustain. Energy Rev. 2016, 64, 421–434. [Google Scholar] [CrossRef]
- Younas, U.; Khan, B.; Ali, S.; Arshad, C.; Farid, U.; Zeb, K.; Rehman, F.; Mehmood, C.A.; Vaccaro, A. Pakistan geothermal renewable energy potential for electric power generation: A survey. Renew. Sustain. Energy Rev. 2016, 63, 398–413. [Google Scholar] [CrossRef]
- Kessides, I.N. Chaos in power: Pakistan’s electricity crisis. Energy Policy 2013, 55, 271–285. [Google Scholar] [CrossRef]
- Grainger, C.A.; Zhang, F. Electricity shortages and manufacturing productivity in Pakistan. Energy Policy 2019, 132, 1000–1008. [Google Scholar] [CrossRef]
- Baloch, M.H.; Chauhdary, S.T.; Ishak, D.; Kaloi, G.S.; Nadeem, M.H.; Wattoo, W.A.; Younas, T.; Hamid, H.T. Hybrid energy sources status of Pakistan: An optimal technical proposal to solve the power crises issues. Energy Strat. Rev. 2019, 24, 132–153. [Google Scholar] [CrossRef]
- Arshad, N.; Ali, U. An analysis of the effects of residential uninterpretable power supply systems on Pakistan’s power sector. Energy Sustain. Dev. 2017, 36, 16–21. [Google Scholar] [CrossRef]
- Hou, Y.; Iqbal, W.; Shaikh, G.M.; Iqbal, N.; Solangi, Y.A.; Fatima, A. Measuring Energy Efficiency and Environmental Performance: A Case of South Asia. Processes 2019, 7, 325. [Google Scholar] [CrossRef] [Green Version]
- Aslam, W.; Soban, M.; Akhtar, F.; Zaffar, N.A. Smart meters for industrial energy conservation and efficiency optimization in Pakistan: Scope, technology and applications. Renew. Sustain. Energy Rev. 2015, 44, 933–943. [Google Scholar] [CrossRef]
- Naqvi, S.R.; Jamshaid, S.; Naqvi, M.R.; Farooq, W.; Niazi, M.B.; Aman, Z.; Zubair, M.; Ali, M.; Shahbaz, M.; Inayat, A.; et al. Potential of biomass for bioenergy in Pakistan based on present case and future perspectives. Renew. Sustain. Energy Rev. 2018, 81, 1247–1258. [Google Scholar] [CrossRef] [Green Version]
- Khan, M.A.; Abbas, F. The dynamics of electricity demand in Pakistan: A panel cointegration analysis. Renew. Sustain. Energy Rev. 2016, 65, 1159–1178. [Google Scholar] [CrossRef]
- Shahzad, K.; Bajwa, S.U.; Ansted, R.B.; Mamoon, D.; Rehman, K.-U. Evaluating human resource management capacity for effective implementation of advanced metering infrastructure by electricity distribution companies in Pakistan. Util. Policy 2016, 41, 107–117. [Google Scholar] [CrossRef]
- Sher, H.; Murtaza, A.F.; Addoweesh, K.E.; Chiaberge, M. Pakistan’s progress in solar PV based energy generation. Renew. Sustain. Energy Rev. 2015, 47, 213–217. [Google Scholar] [CrossRef]
- Wasti, S. Economic Survey of Pakistan 2014–2015; Government of Pakistan: Islamabad, Pakistan, 2015. [Google Scholar]
- Rehman, S.A.U.; Cai, Y.; Fazal, R.; Das Walasai, G.; Mirjat, N.H. An integrated modeling approach for forecasting long-term energy demand in Pakistan. Energies 2017, 10, 1868. [Google Scholar] [CrossRef] [Green Version]
- Qazi, U.; Jahanzaib, M.; Ahmad, W.; Hussain, S. An institutional framework for the development of sustainable and competitive power market in Pakistan. Renew. Sustain. Energy Rev. 2017, 70, 83–95. [Google Scholar] [CrossRef]
- Zuberi, M.J.S.; Torkmahalleh, M.A.; Ali, S.H. A comparative study of biomass resources utilization for power generation and transportation in Pakistan. Int. J. Hydrogen Energy 2015, 40, 11154–11160. [Google Scholar] [CrossRef]
- Kamran, M. Current status and future success of renewable energy in Pakistan. Renew. Sustain. Energy Rev. 2018, 82, 609–617. [Google Scholar] [CrossRef]
- Uddin, W.; Khan, B.; Shaukat, N.; Majid, M.; Mujtaba, G.; Mehmood, C.A.; Ali, S.; Younas, U.; Anwar, M.; Almeshal, A.M. Biogas potential for electric power generation in Pakistan: A survey. Renew. Sustain. Energy Rev. 2016, 54, 25–33. [Google Scholar] [CrossRef]
- Rahut, D.B.; Ali, A.; Mottaleb, K.A.; Aryal, J.P. Wealth, education and cooking-fuel choices among rural households in Pakistan. Energy Strat. Rev. 2019, 24, 236–243. [Google Scholar] [CrossRef]
- Malik, S.N.; Sukhera, O.R. Management of natural gas resources and search for alternative renewable energy resources: A case study of Pakistan. Renew. Sustain. Energy Rev. 2012, 16, 1282–1290. [Google Scholar] [CrossRef]
- Imran, M.; Özçatalbaş, O.; Bakhsh, K. Rural household preferences for cleaner energy sources in Pakistan. Environ. Sci. Pollut. Res. 2019, 26, 22783–22793. [Google Scholar] [CrossRef]
- Yasmin, N.; Grundmann, P. Adoption and diffusion of renewable energy—The case of biogas as alternative fuel for cooking in Pakistan. Renew. Sustain. Energy Rev. 2019, 101, 255–264. [Google Scholar] [CrossRef]
- Ashraf, S.; Luqman, M.; Hassan, Z.Y.; Yaqoob, A. Determinants of Biogas Technology Adoption in Pakistan. Pak. J. Sci. Ind. Res. Ser. A Phys. Sci. 2019, 62, 113–123. [Google Scholar] [CrossRef]
- Levin, D.B.; Zhu, H.; Beland, M.; Cicek, N.; Holbein, B.E. Potential for hydrogen and methane production from biomass residues in Canada. Bioresour. Technol. 2007, 98, 654–660. [Google Scholar] [CrossRef]
- Kafle, G.K.; Kim, S.H. Effects of chemical compositions and ensiling on the biogas productivity and degradation rates of agricultural and food processing by-products. Bioresour. Technol. 2013, 142, 553–561. [Google Scholar] [CrossRef]
- TR, Y.S.S.; Kohli, S.; Rana, V. Enhancement of biogas production from solid substrates using different techniques. J. Bioresour. Technol. 2004, 95, 1–10. [Google Scholar] [CrossRef]
- Mushtaq, K.; Zaidi, A.A.; Askari, S.J. Design and performance analysis of floating dome type portable biogas plant for domestic use in Pakistan. Sustain. Energy Technol. Assess. 2016, 14, 21–25. [Google Scholar] [CrossRef]
- Khan, M.U.; Ahring, B.K. Improving the biogas yield of manure: Effect of pretreatment on anaerobic digestion of the recalcitrant fraction of manure. Bioresour. Technol. 2021, 321, 124427. [Google Scholar] [CrossRef]
- Khan, M.U.; Ahring, B.K. Anaerobic Digestion of Digested Manure Fibers: Influence of Thermal and Alkaline Thermal Pretreatment on the Biogas Yield. BioEnergy Res. 2020, 1–10. [Google Scholar] [CrossRef]
- Lee, J.T.; Khan, M.U.; Dai, Y.; Tong, Y.W.; Ahring, B.K. Influence of wet oxidation pretreatment with hydrogen peroxide and addition of clarified manure on anaerobic digestion of oil palm empty fruit bunches. Bioresour. Technol. 2021, 332, 125033. [Google Scholar] [CrossRef] [PubMed]
- Khan, M.U.; Ahring, B.K. Anaerobic digestion of biorefinery lignin: Effect of different wet explosion pretreatment conditions. Bioresour. Technol. 2020, 298, 122537. [Google Scholar] [CrossRef]
- Amjid, S.S.; Bilal, M.Q.; Nazir, M.S.; Hussain, A. Biogas, renewable energy resource for Pakistan. Renew. Sustain. Energy Rev. 2011, 15, 2833–2837. [Google Scholar] [CrossRef]
- Raheem, A.; Hassan, M.Y.; Shakoor, R. Bioenergy from anaerobic digestion in Pakistan: Potential, development and prospects. Renew. Sustain. Energy Rev. 2016, 59, 264–275. [Google Scholar] [CrossRef]
- Shaukat, N.; Khan, B.; Khan, T.; Younis, M.N.; ul Faris, N.; Javed, A.; Iqbal, M.N. A comprehensive review of biogas sector for electric power generation in Pakistan. PSM Biol. Res. 2016, 1, 43–48. [Google Scholar]
- Pakistan Livestock Census. Pakistan Bureau of Statistics, Government of Pakistan. 2006. Available online: https://www.pbs.gov.pk/content/pakistan-livestock-census-2006 (accessed on 10 June 2019).
- Livestock Census Report 2006, Ministry of National Food Security & Research, Ismamabad. 2006. Available online: https://phkh.nhsrc.pk/sites/default/files/2019-06/All%20Pakistan%20Report%20Livestock%20Census%2006.pdf (accessed on 9 June 2019).
- Ministry of Finance, Government of Pakistan. Pakistan Economic Survey 2016–2017. Available online: http://www.finance.gov.pk/survey_1617.html (accessed on 10 June 2019).
- Avcioğlu, A.O.; Türker, U. Status and potential of biogas energy from animal wastes in Turkey. Renew. Sustain. Energy Rev. 2012, 16, 1557–1561. [Google Scholar] [CrossRef]
- Vedrenne, F.; Béline, F.; Dabert, P.; Bernet, N. The effect of incubation conditions on the laboratory measurement of the methane producing capacity of livestock wastes. Bioresour. Technol. 2008, 99, 146–155. [Google Scholar] [CrossRef]
- Liu, G.; Zhang, R.; El-Mashad, H.M.; Dong, R. Effect of feed to inoculum ratios on biogas yields of food and green wastes. Bioresour. Technol. 2009, 100, 5103–5108. [Google Scholar] [CrossRef]
- Cornejo, C.; Wilkie, A.C. Greenhouse gas emissions and biogas potential from livestock in Ecuador. Energy Sustain. Dev. 2010, 14, 256–266. [Google Scholar] [CrossRef]
- Nasir, I.M.; Ghazi, T.I.M.; Omar, R.; Idris, A. Anaerobic digestion of cattle manure: Influence of inoculums concentration. Int. J. Eng. Technol. 2013, 10, 22–26. [Google Scholar]
- Igliński, B.; Buczkowski, R.; Cichosz, M. Biogas production in Poland—Current state, potential and perspectives. Renew. Sustain. Energy Rev. 2015, 50, 686–695. [Google Scholar] [CrossRef]
- Rahimnejad, M.; Adhami, A.; Darvari, S.; Zirepour, A.; Oh, S.-E. Microbial fuel cell as new technology for bioelectricity generation: A review. Alex. Eng. J. 2015, 54, 745–756. [Google Scholar] [CrossRef] [Green Version]
- Maghanaki, M.M.; Ghobadian, B.; Najafi, G.; Galogah, R.J. Potential of biogas production in Iran. Renew. Sustain. Energy Rev. 2013, 28, 702–714. [Google Scholar] [CrossRef]
- Abdeshahian, P.; Lim, J.S.; Ho, W.S.; Hashim, H.; Lee, C.T. Potential of biogas production from farm animal waste in Malaysia. Renew. Sustain. Energy Rev. 2016, 60, 714–723. [Google Scholar] [CrossRef]
- Khalil, M.; Berawi, M.A.; Heryanto, R.; Rizalie, A. Waste to energy technology: The potential of sustainable biogas production from animal waste in Indonesia. Renew. Sustain. Energy Rev. 2019, 105, 323–331. [Google Scholar] [CrossRef]
- Saidmamatov, O.; Rudenko, I.; Baier, U.; Khodjaniyazov, E. Challenges and Solutions for Biogas Production from Agriculture Waste in the Aral Sea Basin. Processes 2021, 9, 199. [Google Scholar] [CrossRef]
- Cheng, S.; Li, Z.; Mang, H.-P.; Huba, E.-M. A review of prefabricated biogas digesters in China. Renew. Sustain. Energy Rev. 2013, 28, 738–748. [Google Scholar] [CrossRef]
- Coimbra-Araújo, C.H.; Mariane, L.; Júnior, C.B.; Frigo, E.P.; Frigo, M.S.; Araújo, I.R.C.; Alves, H.J. Brazilian case study for biogas energy: Production of electric power, heat and automotive energy in condominiums of agroenergy. Renew. Sustain. Energy Rev. 2014, 40, 826–839. [Google Scholar] [CrossRef]
- Cvetkovic, S.; Radoičić, T.K.; Vukadinović, B.; Kijevčanin, M. Potentials and status of biogas as energy source in the Republic of Serbia. Renew. Sustain. Energy Rev. 2014, 31, 407–416. [Google Scholar] [CrossRef]
- Katuwal, H.; Bohara, A.K. Biogas: A promising renewable technology and its impact on rural households in Nepal. Renew. Sustain. Energy Rev. 2009, 13, 2668–2674. [Google Scholar] [CrossRef]
- Putra, A.; Liu, Z.; Lund, M. The impact of biogas technology adoption for farm households—Empirical evidence from mixed crop and livestock farming systems in Indonesia. Renew. Sustain. Energy Rev. 2017, 74, 1371–1378. [Google Scholar] [CrossRef]
- Mengistu, M.; Simane, B.; Eshete, G.; Workneh, T. A review on biogas technology and its contributions to sustainable rural livelihood in Ethiopia. Renew. Sustain. Energy Rev. 2015, 48, 306–316. [Google Scholar] [CrossRef]
- Ghimire, P.C. Final Report on Technical Study of Biogas Plants Installed in Pakistan; Prepared by: Asia/Africa Biogas Programme, Netherlands Development Organisation (SNV). 2007, pp. 1–74. Available online: https://bibalex.org/baifa/Attachment/Documents/172360.pdf (accessed on 14 June 2021).
- Farooq, M.K.; Kumar, S. An assessment of renewable energy potential for electricity generation in Pakistan. Renew. Sustain. Energy Rev. 2013, 20, 240–254. [Google Scholar] [CrossRef]


| Species | Manure Yield (kg/Day) | Manure Availability Coefficient (%) | Biogas Yield (m3kg−1 TS) | Ratio of the TS (TS%) |
|---|---|---|---|---|
| Cattle | 10–20 | 50 | 0.6–0.8 | 25–30 |
| Buffalo | 10–20 | 50 | 0.6–0.8 | 25–30 |
| Sheep | 2 | 33 | 0.3–0.4 | 18–25 |
| Goat | 2 | 33 | 0.3–0.4 | 18–25 |
| Camel | 15–17 | 50 | 0.6–0.8 | 25–30 |
| Horse | 10–15 | 50 | 0.6–0.8 | 25–30 |
| Ass/Donkey | 10–15 | 50 | 0.6–0.8 | 25–30 |
| Mule | 10–15 | 50 | 0.6–0.8 | 25–30 |
| Poultry | 0.08–0.1 | 99 | 0.3–0.8 | 10–29 |
| Animal Type | 1960 | 1972 | 1976 | 1986 | 1996 | 2006 | 2016 | 2017 | 2018 |
|---|---|---|---|---|---|---|---|---|---|
| Punjab | |||||||||
| Cattle | 9673 | 8226 | 8108 | 8817 | 9382 | 14,412 | 20,826 | 21,607 | 22,417 |
| Buffaloes | 6129 | 7413 | 7979 | 11,150 | 13,101 | 17,747 | 23,850 | 24,566 | 25,302 |
| Sheep | 5583 | 6280 | 8037 | 6686 | 6142 | 6362 | 7168 | 7254 | 7341 |
| Goats | 2973 | 5943 | 7767 | 10,755 | 15,301 | 19,831 | 26,011 | 26,726 | 27,461 |
| Camels | 266 | 365 | 338 | 321 | 187 | 199 | 199 | 199 | 199 |
| Horses | 226 | 264 | 286 | 245 | 181 | 163 | 163 | 163 | 163 |
| Asses | 897 | 1063 | 1139 | 1657 | 1948 | 2232 | 2465 | 2490 | 2515 |
| Mules | 23 | 20 | 29 | 36 | 57 | 63 | 63 | 63 | 63 |
| Poultry | 6440 | 8688 | 13,783 | 27,848 | 24,511 | 25,906 | 50,961 | 54,528 | 58,345 |
| Total | 32,210 | 38,262 | 47,466 | 67,515 | 70,810 | 86,915 | 131,706 | 137,596 | 143,806 |
| Sindh | |||||||||
| Cattle | 2936 | 2800 | 2854 | 3874 | 5664 | 6925 | 10,007 | 10,382 | 10,771 |
| Buffaloes | 1353 | 1522 | 1834 | 3220 | 5615 | 7340 | 9684 | 10,160 | 10,465 |
| Sheep | 1590 | 840 | 1829 | 2616 | 3710 | 3959 | 4460 | 4514 | 4568 |
| Goats | 2201 | 2275 | 4237 | 6755 | 9734 | 12,572 | 16,490 | 16,943 | 17,409 |
| Camels | 62 | 80 | 144 | 218 | 225 | 278 | 278 | 278 | 278 |
| Horses | 40 | 71 | 94 | 76 | 63 | 45 | 45 | 45 | 45 |
| Asses | 159 | 242 | 373 | 500 | 694 | 1004 | 1109 | 1120 | 1131 |
| Mules | 1 | 2 | 3 | 5 | 12 | 20 | 22 | 22 | 23 |
| Poultry | 1250 | 2743 | 6295 | 8798 | 11,549 | 14,136 | 27,807 | 29,754 | 31,836 |
| Total | 9592 | 10,575 | 17,663 | 26,062 | 37,266 | 46,279 | 69,902 | 73,218 | 76,526 |
| KPK | |||||||||
| Cattle | 3206 | 2962 | 3000 | 3285 | 4237 | 5968 | 8624 | 8947 | 9283 |
| Buffaloes | 651 | 791 | 762 | 1271 | 1395 | 1928 | 2591 | 2668 | 2748 |
| Sheep | 2432 | 2455 | 3675 | 1599 | 2821 | 3363 | 3789 | 3834 | 3880 |
| Goats | 3035 | 3737 | 4686 | 2899 | 6764 | 9599 | 12,590 | 12,936 | 13,292 |
| Camels | 76 | 101 | 95 | 70 | 65 | 64 | 65 | 66 | 66 |
| Horses | 23 | 31 | 29 | 34 | 47 | 76 | 81 | 83 | 85 |
| Asses | 306 | 408 | 381 | 446 | 534 | 560 | 618 | 624 | 631 |
| Mules | 19 | 32 | 28 | 23 | 60 | 67 | 74 | 75 | 76 |
| Poultry | 4190 | 4939 | 9708 | 17,203 | 22,501 | 27,695 | 54,480 | 58,294 | 62,374 |
| Total | 13,938 | 15,456 | 22,364 | 26,830 | 38,424 | 49,320 | 82,912 | 87,527 | 92,435 |
| Balochistan | |||||||||
| Cattle | 643 | 482 | 684 | 1157 | 1341 | 2254 | 3257 | 3379 | 3505 |
| Buffaloes | 26 | 22 | 33 | 63 | 161 | 320 | 430 | 442 | 456 |
| Sheep | 2564 | 3859 | 5075 | 11,111 | 10,841 | 12,804 | 14,426 | 14,599 | 14,774 |
| Goats | 1596 | 3238 | 4441 | 7299 | 9369 | 11,785 | 15,457 | 15,882 | 16,319 |
| Camels | 86 | 185 | 212 | 349 | 339 | 380 | 380 | 380 | 380 |
| Horses | 10 | 19 | 23 | 29 | 43 | 60 | 60 | 60 | 60 |
| Asses | 99 | 171 | 244 | 370 | 383 | 472 | 521 | 526 | 531 |
| Mules | 0.4 | 1 | 1 | 4 | 6 | 6 | 6 | 6 | 7 |
| Poultry | 454 | 1183 | 1958 | 3295 | 4637 | 5911 | 11,628 | 12,441 | 13,312 |
| Total | 5478.4 | 9160 | 12,671 | 23,677 | 27,120 | 33,992 | 46,165 | 47,715 | 49,344 |
| Animal Type | 1960 | 1972 | 1976 | 1986 | 1996 | 2006 | 2016 | 2017 | 2018 |
|---|---|---|---|---|---|---|---|---|---|
| Cattle | 35.30 | 30.02 | 29.59 | 32.18 | 34.24 | 52.60 | 76.01 | 78.86 | 81.82 |
| Buffaloes | 22.37 | 27.05 | 29.12 | 40.69 | 47.81 | 64.77 | 87.05 | 89.66 | 92.35 |
| Sheep | 4.07 | 4.58 | 5.86 | 4.88 | 4.48 | 4.64 | 5.23 | 5.29 | 5.35 |
| Goats | 2.17 | 4.33 | 5.66 | 7.85 | 11.16 | 14.47 | 18.98 | 19.50 | 20.04 |
| Camels | 1.45 | 1.99 | 1.85 | 1.75 | 1.02 | 1.08 | 1.08 | 1.08 | 1.08 |
| Horses | 0.82 | 0.96 | 1.04 | 0.89 | 0.66 | 0.59 | 0.59 | 0.59 | 0.59 |
| Asses | 3.27 | 3.87 | 4.15 | 6.04 | 7.11 | 8.14 | 8.99 | 9.08 | 9.17 |
| Mules | 0.08 | 0.07 | 0.10 | 0.13 | 0.20 | 0.22 | 0.22 | 0.22 | 0.22 |
| Poultry | 0.23 | 0.31 | 0.50 | 1.01 | 0.89 | 0.94 | 1.86 | 1.99 | 2.12 |
| Total | 69.79 | 73.23 | 77.91 | 95.45 | 107.61 | 147.50 | 200.05 | 206.33 | 212.80 |
| Sindh | |||||||||
| Cattle | 10.71 | 10.22 | 10.41 | 14.14 | 20.67 | 25.27 | 36.52 | 37.89 | 39.31 |
| Buffaloes | 4.93 | 5.55 | 6.69 | 11.75 | 20.49 | 26.79 | 35.34 | 37.08 | 38.19 |
| Sheep | 1.16 | 0.61 | 1.33 | 1.90 | 2.70 | 2.89 | 3.25 | 3.29 | 3.33 |
| Goats | 1.60 | 1.66 | 3.09 | 4.93 | 7.10 | 9.17 | 12.03 | 12.36 | 12.70 |
| Camels | 0.33 | 0.43 | 0.78 | 1.19 | 1.23 | 1.52 | 1.52 | 1.52 | 1.52 |
| Horses | 0.14 | 0.25 | 0.34 | 0.27 | 0.22 | 0.16 | 0.16 | 0.16 | 0.16 |
| Asses | 0.58 | 0.88 | 1.36 | 1.82 | 2.5331 | 3.66 | 4.04 | 4.08 | 4.12 |
| Mules | 0.003 | 0.007 | 0.01 | 0.01 | 0.04 | 0.07 | 0.08 | 0.08 | 0.08 |
| Poultry | 0.04 | 0.10 | 0.22 | 0.32 | 0.42 | 0.51 | 1.01 | 1.08 | 1.16 |
| Total | 19.53 | 19.73 | 24.27 | 36.36 | 55.44 | 70.07 | 93.99 | 97.58 | 100.6 |
| KPK | |||||||||
| Cattle | 11.70 | 10.81 | 10.95 | 11.99 | 15.46 | 21.78 | 31.47 | 32.65 | 33.88 |
| Buffaloes | 2.37 | 2.88 | 2.78 | 4.63 | 5.09 | 7.03 | 9.45 | 9.73 | 10.03 |
| Sheep | 1.77 | 1.79 | 2.68 | 1.167 | 2.05 | 2.45 | 2.76 | 2.79 | 2.83 |
| Goats | 2.21 | 2.72 | 3.42 | 2.11 | 4.93 | 7.00 | 9.19 | 9.44 | 9.70 |
| Camels | 0.41 | 0.55 | 0.52 | 0.38 | 0.35 | 0.35 | 0.35 | 0.36 | 0.36 |
| Horses | 0.08 | 0.11 | 0.10 | 0.12 | 0.17 | 0.27 | 0.29 | 0.30 | 0.31 |
| Asses | 1.11 | 1.48 | 1.39 | 1.62 | 1.94 | 2.04 | 2.25 | 2.27 | 2.30 |
| Mules | 0.06 | 0.11 | 0.10 | 0.08 | 0.21 | 0.24 | 0.27 | 0.27 | 0.27 |
| Poultry | 0.15 | 0.18 | 0.35 | 0.62 | 0.82 | 1.01 | 1.98 | 2.12 | 2.27 |
| Total | 19.90 | 20.67 | 22.30 | 22.76 | 31.07 | 42.20 | 58.05 | 59.98 | 61.97 |
| Balochistan | |||||||||
| Cattle | 2.34 | 1.75 | 2.49 | 4.22 | 4.89 | 8.22 | 11.88 | 12.33 | 12.79 |
| Buffaloes | 0.09 | 0.08 | 0.12 | 0.22 | 0.58 | 1.16 | 1.56 | 1.61 | 1.66 |
| Sheep | 1.87 | 2.81 | 3.70 | 8.11 | 7.91 | 9.34 | 10.53 | 10.65 | 10.78 |
| Goats | 1.16 | 2.36 | 3.24 | 5.32 | 6.83 | 8.60 | 11.28 | 11.59 | 11.91 |
| Camels | 0.47 | 1.01 | 1.16 | 1.91 | 1.85 | 2.08 | 2.08 | 2.08 | 2.08 |
| Horses | 0.03 | 0.06 | 0.08 | 0.10 | 0.15 | 0.2 | 0.21 | 0.21 | 0.21 |
| Asses | 0.36 | 0.62 | 0.89 | 1.35 | 1.39 | 1.72 | 1.90 | 1.91 | 1.93 |
| Mules | 0.001 | 0.003 | 0.003 | 0.014 | 0.021 | 0.021 | 0.021 | 0.021 | 0.025 |
| Poultry | 0.01 | 0.04 | 0.07 | 0.12 | 0.16 | 0.21 | 0.42 | 0.45 | 0.48 |
| Total | 6.36 | 8.77 | 11.77 | 21.39 | 23.83 | 31.60 | 39.91 | 40.89 | 41.90 |
| Animal Type | 1960 | 1972 | 1976 | 1986 | 1996 | 2006 | 2016 | 2017 | 2018 |
|---|---|---|---|---|---|---|---|---|---|
| Punjab | |||||||||
| Cattle | 2647.98 | 2251.86 | 2219.56 | 2413.65 | 2568.32 | 3945.28 | 5701.11 | 5914.91 | 6136.65 |
| Buffaloes | 1677.81 | 2029.30 | 2184.25 | 3052.31 | 3586.39 | 4858.24 | 6528.93 | 6724.94 | 6926.42 |
| Sheep | 80.69 | 90.77 | 116.16 | 96.63 | 88.77 | 91.95 | 103.60 | 104.84 | 106.10 |
| Goats | 42.97 | 85.90 | 112.26 | 155.45 | 221.16 | 286.63 | 375.96 | 386.29 | 396.92 |
| Camels | 109.22 | 149.87 | 138.79 | 131.81 | 76.78 | 81.71 | 81.71 | 81.71 | 81.71 |
| Horses | 61.86 | 72.27 | 78.29 | 67.06 | 49.54 | 44.62 | 44.62 | 44.62 | 44.62 |
| Asses | 245.55 | 290.99 | 311.80 | 453.60 | 533.26 | 611.01 | 674.79 | 681.63 | 688.48 |
| Mules | 6.29 | 5.47 | 7.93 | 9.85 | 15.60 | 17.24 | 17.24 | 17.24 | 17.24 |
| Poultry | 10.12 | 13.65 | 21.66 | 43.77 | 38.52 | 40.72 | 80.10 | 85.71 | 91.71 |
| Total | 4882.53 | 4990.12 | 5190.73 | 6424.17 | 7178.39 | 9977.43 | 13,608.1 | 14,041.94 | 14,489.88 |
| Sindh | |||||||||
| Cattle | 803.73 | 766.5 | 781.28 | 1060.5 | 1550.52 | 1895.71 | 2739.41 | 2842.07 | 2948.56 |
| Buffaloes | 370.38 | 416.64 | 502.05 | 881.47 | 1537.10 | 2009.32 | 2650.99 | 2781.3 | 2864.79 |
| Sheep | 22.98 | 12.14 | 26.43 | 37.81 | 53.62 | 57.22 | 64.46 | 65.24 | 66.02 |
| Goats | 31.81 | 32.88 | 61.24 | 97.63 | 140.69 | 181.71 | 238.34 | 244.89 | 251.62 |
| Camels | 25.45 | 32.85 | 59.13 | 89.51 | 92.39 | 114.15 | 114.15 | 114.15 | 114.15 |
| Horses | 10.95 | 19.43 | 25.73 | 20.80 | 17.24 | 12.31 | 12.31 | 12.31 | 12.31 |
| Asses | 43.52 | 66.24 | 102.10 | 136.87 | 189.98 | 274.84 | 303.58 | 306.6 | 309.61 |
| Mules | 0.27 | 0.54 | 0.82 | 1.36 | 3.28 | 5.47 | 6.02 | 6.02 | 6.29 |
| Poultry | 1.96 | 4.31 | 9.89 | 13.82 | 18.15 | 22.21 | 43.70 | 46.76 | 50.04 |
| Total | 1311.08 | 1351.56 | 1568.70 | 2339.82 | 3603 | 4572.99 | 6173.01 | 6419.37 | 6623.43 |
| KPK | |||||||||
| Cattle | 877.64 | 810.84 | 821.25 | 899.26 | 1159.87 | 1633.74 | 2360.82 | 2449.24 | 2541.22 |
| Buffaloes | 178.21 | 216.53 | 208.59 | 347.93 | 381.88 | 527.79 | 709.28 | 730.36 | 752.26 |
| Sheep | 35.15 | 35.48 | 53.11 | 23.11 | 40.77 | 48.60 | 54.76 | 55.41 | 56.08 |
| Goats | 43.86 | 54.01 | 67.73 | 41.90 | 97.76 | 138.74 | 181.97 | 186.97 | 192.12 |
| Camels | 31.20 | 41.47 | 39 | 28.74 | 26.69 | 26.28 | 26.69 | 27.10 | 27.10 |
| Horses | 6.29 | 8.48 | 7.93 | 9.30 | 12.86 | 20.80 | 22.17 | 22.72 | 23.26 |
| Asses | 83.76 | 111.69 | 104.29 | 122.09 | 146.18 | 153.3 | 169.17 | 170.82 | 172.73 |
| Mules | 5.20 | 8.76 | 7.66 | 6.29 | 16.42 | 18.34 | 20.25 | 20.53 | 20.80 |
| Poultry | 6.58 | 7.76 | 15.25 | 27.04 | 35.36 | 43.53 | 85.63 | 91.63 | 98.04 |
| Total | 1267.93 | 1295.05 | 1324.86 | 1482.58 | 1917.83 | 2611.14 | 3630.78 | 3754.80 | 3883.64 |
| Balochistan | |||||||||
| Cattle | 176.02 | 131.94 | 187.24 | 316.72 | 367.09 | 617.03 | 891.60 | 925 | 959.49 |
| Buffaloes | 7.11 | 6.02 | 9.03 | 17.24 | 44.07 | 87.6 | 117.71 | 120.99 | 124.83 |
| Sheep | 37.06 | 55.77 | 73.35 | 160.59 | 156.69 | 185.06 | 208.51 | 211.01 | 213.54 |
| Goats | 23.06 | 46.80 | 64.19 | 105.49 | 135.41 | 170.34 | 223.41 | 229.55 | 235.87 |
| Camels | 35.31 | 75.96 | 87.05 | 143.30 | 139.20 | 156.03 | 156.03 | 156.03 | 156.03 |
| Horses | 2.73 | 5.20 | 6.29 | 7.93 | 11.77 | 16.42 | 16.42 | 16.42 | 16.42 |
| Asses | 27.10 | 46.81 | 66.79 | 101.28 | 104.84 | 129.21 | 142.62 | 143.99 | 145.36 |
| Mules | 0.10 | 0.27 | 0.27 | 1.09 | 1.64 | 1.64 | 1.64 | 1.64 | 1.91 |
| Poultry | 0.71 | 1.85 | 3.07 | 5.17 | 7.28 | 9.29 | 18.27 | 19.55 | 20.92 |
| Total | 309.24 | 370.66 | 497.31 | 858.88 | 968.03 | 1372.64 | 1776.25 | 1824.22 | 1874.40 |
| Animal Type | 1960 | 1972 | 1976 | 1986 | 1996 | 2006 | 2016 | 2017 | 2018 |
|---|---|---|---|---|---|---|---|---|---|
| Punjab | |||||||||
| Cattle | 1588.79 | 1351.12 | 1331.73 | 1448.19 | 1540.99 | 2367.17 | 3420.67 | 3548.95 | 3681.99 |
| Buffaloes | 1006.68 | 1217.58 | 1310.55 | 1831.38 | 2151.83 | 2914.94 | 3917.36 | 4034.96 | 4155.85 |
| Sheep | 48.41 | 54.46 | 69.70 | 57.98 | 53.26 | 55.17 | 62.16 | 62.90 | 63.66 |
| Goats | 25.78 | 51.54 | 67.35 | 93.27 | 132.6 | 171.98 | 225.57 | 231.77 | 238.15 |
| Camels | 65.53 | 89.92 | 83.27 | 79.08 | 46.07 | 49.02 | 49.02 | 49.02 | 49.02 |
| Horses | 37.12 | 43.36 | 46.97 | 40.24 | 29.72 | 26.77 | 26.77 | 26.77 | 26.77 |
| Asses | 147.33 | 174.59 | 187.08 | 272.16 | 319.95 | 366.60 | 404.87 | 408.98 | 413.08 |
| Mules | 3.77 | 3.28 | 4.76 | 5.91 | 9.36 | 10.34 | 10.34 | 10.34 | 10.34 |
| Poultry | 5.06 | 6.82 | 10.83 | 21.88 | 19.26 | 20.36 | 40.05 | 42.85 | 45.85 |
| Total | 2928.50 | 2992.70 | 3112.27 | 3850.12 | 4303.18 | 5982.38 | 8156.85 | 8416.59 | 8684.75 |
| Sindh | |||||||||
| Cattle | 482.23 | 459.9 | 468.76 | 636.30 | 930.31 | 1137.43 | 1643.65 | 1705.24 | 1769.13 |
| Buffaloes | 222.23 | 249.98 | 301.23 | 528.88 | 922.26 | 1205.59 | 1590.59 | 1668.78 | 1718.87 |
| Sheep | 13.78 | 7.28 | 15.86 | 22.68 | 32.17 | 34.33 | 38.67 | 39.14 | 39.61 |
| Goats | 19.08 | 19.72 | 36.74 | 58.58 | 84.41 | 109.02 | 143.00 | 146.93 | 150.97 |
| Camels | 15.27 | 19.71 | 35.47 | 53.70 | 55.43 | 68.49 | 68.49 | 68.49 | 68.49 |
| Horses | 6.57 | 11.66 | 15.43 | 12.48 | 10.34 | 7.39 | 7.39 | 7.39 | 7.39 |
| Asses | 26.11 | 39.74 | 61.26 | 82.12 | 113.98 | 164.90 | 182.15 | 183.96 | 185.76 |
| Mules | 0.16 | 0.32 | 0.49 | 0.82 | 1.97 | 3.28 | 3.61 | 3.61 | 3.77 |
| Poultry | 0.98 | 2.15 | 4.94 | 6.91 | 9.07 | 11.10 | 21.85 | 23.38 | 25.02 |
| Total | 786.45 | 810.50 | 940.23 | 1402.51 | 2159.98 | 2741.57 | 3699.43 | 3846.94 | 3969.05 |
| KPK | |||||||||
| Cattle | 526.58 | 486.50 | 492.75 | 539.56 | 695.92 | 980.24 | 1416.49 | 1469.54 | 1524.73 |
| Buffaloes | 106.92 | 129.92 | 125.15 | 208.76 | 229.12 | 316.67 | 425.57 | 438.21 | 451.35 |
| Sheep | 21.09 | 21.29 | 31.87 | 13.86 | 24.46 | 29.16 | 32.85 | 33.24 | 33.64 |
| Goats | 26.32 | 32.40 | 40.63 | 25.14 | 58.66 | 83.24 | 109.18 | 112.18 | 115.27 |
| Camels | 18.72 | 24.88 | 23.40 | 17.24 | 16.01 | 15.76 | 16.01 | 16.26 | 16.26 |
| Horses | 3.77 | 5.09 | 4.76 | 5.58 | 7.71 | 12.48 | 13.30 | 13.63 | 13.96 |
| Asses | 50.26 | 67.01 | 62.57 | 73.25 | 87.70 | 91.98 | 101.50 | 102.49 | 103.64 |
| Mules | 3.12 | 5.25 | 4.59 | 3.77 | 9.85 | 11.00 | 12.15 | 12.31 | 12.48 |
| Poultry | 3.29 | 3.88 | 7.62 | 13.52 | 17.68 | 21.76 | 42.81 | 45.81 | 49.02 |
| Total | 760.10 | 776.25 | 793.39 | 900.71 | 1147.16 | 1562.33 | 2169.90 | 2243.72 | 2320.38 |
| Balochistan | |||||||||
| Cattle | 105.61 | 79.16 | 112.34 | 190.03 | 220.25 | 370.21 | 534.96 | 555.00 | 575.69 |
| Buffaloes | 4.27 | 3.61 | 5.42 | 10.34 | 26.44 | 52.56 | 70.62 | 72.59 | 74.89 |
| Sheep | 22.23 | 33.46 | 44.01 | 96.35 | 94.01 | 111.04 | 125.10 | 126.60 | 128.12 |
| Goats | 13.84 | 28.08 | 38.51 | 63.29 | 81.25 | 102.20 | 134.04 | 137.73 | 141.52 |
| Camels | 21.18 | 45.57 | 52.23 | 85.98 | 83.52 | 93.62 | 93.62 | 93.62 | 93.62 |
| Horses | 1.64 | 3.12 | 3.77 | 4.76 | 7.06 | 9.85 | 9.85 | 9.85 | 9.85 |
| Asses | 16.26 | 28.08 | 40.07 | 60.77 | 62.90 | 77.52 | 85.57 | 86.39 | 87.21 |
| Mules | 0.065 | 0.16 | 0.16 | 0.65 | 0.98 | 0.98 | 0.98 | 0.98 | 1.14 |
| Poultry | 0.35 | 0.92 | 1.53 | 2.58 | 3.64 | 4.64 | 9.13 | 9.77 | 10.46 |
| Total | 185.47 | 222.21 | 298.08 | 514.81 | 580.09 | 822.65 | 1063.92 | 1092.57 | 1122.55 |
| Particulars | Number of Households |
|---|---|
| Total number of households that have livestock animals | 10 million |
| Households with only one cattle or buffalo which are technically not feasible for installing biodigesters | 2 million |
| Households having no potential for biodigesters due to various factors such as temperature and competitiveness of biogas | 3 million |
| Total number of households having potential for biodigester installation | 5 million |
Publisher’s Note: MDPI stays neutral with regard to jurisdictional claims in published maps and institutional affiliations. |
© 2021 by the authors. Licensee MDPI, Basel, Switzerland. This article is an open access article distributed under the terms and conditions of the Creative Commons Attribution (CC BY) license (https://creativecommons.org/licenses/by/4.0/).
Share and Cite
Khan, M.U.; Ahmad, M.; Sultan, M.; Sohoo, I.; Ghimire, P.C.; Zahid, A.; Sarwar, A.; Farooq, M.; Sajjad, U.; Abdeshahian, P.; et al. Biogas Production Potential from Livestock Manure in Pakistan. Sustainability 2021, 13, 6751. https://0-doi-org.brum.beds.ac.uk/10.3390/su13126751
Khan MU, Ahmad M, Sultan M, Sohoo I, Ghimire PC, Zahid A, Sarwar A, Farooq M, Sajjad U, Abdeshahian P, et al. Biogas Production Potential from Livestock Manure in Pakistan. Sustainability. 2021; 13(12):6751. https://0-doi-org.brum.beds.ac.uk/10.3390/su13126751
Chicago/Turabian StyleKhan, Muhammad U., Muhammad Ahmad, Muhammad Sultan, Ihsanullah Sohoo, Prakash C. Ghimire, Azlan Zahid, Abid Sarwar, Muhammad Farooq, Uzair Sajjad, Peyman Abdeshahian, and et al. 2021. "Biogas Production Potential from Livestock Manure in Pakistan" Sustainability 13, no. 12: 6751. https://0-doi-org.brum.beds.ac.uk/10.3390/su13126751