Article

Researching on the Sustainability of Transportation Industry Based on a Coupled Emergy and System Dynamics Model: A Case Study of Qinghai

Department of Economics and Management, North China Electric Power University, Baoding 071003, China
*
Author to whom correspondence should be addressed.
Sustainability 2021, 13(12), 6804; https://0-doi-org.brum.beds.ac.uk/10.3390/su13126804
Submission received: 12 May 2021 / Revised: 11 June 2021 / Accepted: 14 June 2021 / Published: 16 June 2021
(This article belongs to the Section Sustainable Transportation)

Abstract

:
A series of environmental issues caused by excessive energy consumption in the transportation industry have hindered China’s sustainable development. In this study, an emergy synthesis method was used to analyze the flow of energy. Meanwhile, the emergy yield rate (EYR), environmental load rate (ELR) and emergy sustainability index (ESI) were calculated to evaluate the economic and environmental benefits of the system. In addition, we applied system dynamics to provide a scenario simulation method to compare the emergy indicators of the framework implemented. The paper further put forward some policy insights to improve the sustainability of the transportation system, including adjusting the transportation structure, increasing renewable energy use and promoting a circular economy. The scenario simulation framework based on the sustainable development model of emergy flow can provide a reference for the green development of transportation systems in other regions.

1. Introduction

The transportation industry has become the department with the fastest growth in energy consumption in China, and the development of any industry cannot be separated from the coordination of the transportation links, which makes the realization of energy conservation and emission reduction crucial in the process of logistics transportation. The transportation industry is one of the most energy-consuming and polluting sectors, typically accounting for 30–35% of the total fuel demand in most industrialized countries [1]. Statistics from the International Energy Agency (IEA) showed that the transportation industry has the fastest growth in carbon emissions in all economic departments [2]. Some scholars also pointed out that the transportation industry is the fastest-growing energy consumption industry in the world [3]. The greenhouse gas emissions generated during car operation leads to global warming [4]. According to the report of the Intergovernmental Panel on Climate Change (IPCC), the continuous emission of fossil fuels will lead to a temperature increase of 1.4 to 5.8 degrees Celsius between 1990 and 2100 [5], among which the transportation industry has accounted for 13.5% of global warming [6]. Therefore, implementing the strategy of sustainable development has become an inevitable trend in the progress of the international society. The United Nations Conference on Environment and Development was held in Rio de Janeiro, Brazil, reaching the “United Nations Framework Convention on Climate Change” (UNFCCC) on climate change. The agreement emphasized that action on climate change must be carried out within the framework of sustainable development and that reducing greenhouse gas emissions is a global common society responsibility [7]. The Energy Charter Treaty had a restrictive effect on energy consumption generated by transportation activities and aimed to improve energy efficiency [8]. Due to increasing environmental degradation and severe resource shortages in China [9], in order to promote the healthy development of the industry, the 13th Five-Year Plan for the Development of Renewable Energy stipulated a series of principles to improve the energy structure [10]. The Chinese government proposed the sustainable development of a circular economy strategy [11] and became the first country in the world to promulgate the relevant laws and regulations.

2. Literature Review

The increase in energy consumption is mainly due to the fuel consumption generated in the process of transportation. Therefore, it is necessary to select an appropriate index to evaluate the impact of energy consumption on the environment of a country or region. In order to understand the credibility of the emergy analysis model, Giannetti et al. [12] used an emergy comprehensive method to analyze the reverse logistics network of steel recovery and pointed out that when the recovery price of steel reverse logistics is the lowest, fuel consumption was more important than investment in goods and services. Combining emergy from the perspective of the transportation system, Cristiano et al. [13] applied an emergy analysis to evaluate the convenience of civil infrastructure construction in transportation research and found that part of the transportation mode is converted to railway transportation ways that can improve the sustainability of the transportation system. Huang et al. [14] conducted an exploratory study on land transportation modes from the perspectives of emergy and found that the public transportation mode is an inevitable choice to improve environmental efficiency. Similarly, Liu et al. [15] used the emergy analysis method to explore the efficiency and sustainability of rapid pyrolysis and large-scale transportation fuel production and set up two programs for hydrogenation production and hydrogenation purchase. The study found that the purchase of hydrogen is the best choice for planning a biofuel production system, which provides a feasible solution for large-scale transportation fuel production. In addition, Meng et al. [16] discussed the overall development of urban public transportation systems. The study indicated that a rapid bus transit system can show high energy and environmental performances, and higher transportation speeds and technologies can improve transportation efficiency. The above research mainly focused on the use of emergy analysis to evaluate the environmental performance of energy consumption in logistics and transportation. Based on the consideration of the sustainability dimension, we summarized the current research fields of emergy analysis and the corresponding emergy evaluation indicators in Table 1.
However, it is difficult to study the dynamic interactions of the system. A small change in any one factor may cause a huge change in the entire system, so it is necessary to conduct a dynamic analysis on the internal structure of the system and the internal relations of different subsystems. From the perspective of policy recommendations, we divided the measures to optimize the transportation system into three categories. The first category is policy incentive measures. Liu D et al. [26] used a system dynamics model to establish an electric vehicle development scenario under policy incentives. The results confirmed that the Chinese electric vehicle market is mainly dominated by national policies, especially financial support, followed by environmental policy and energy policy support. The second category is technological advancement measures. Gómez Vilchez et al. [27] conducted a comprehensive analysis of the development history of system dynamics in transportation vehicles and found that technical research has been the main direction of exploration in recent years. Liu X et al. [28] found that technological progress is the optimal choice to achieve energy conservation and emission reduction in the short term. Mallick et al. [29] established a road system dynamics model for sustainable development based on the depletion of natural aggregate reserves. The results showed that policy makers and technological innovation are the key links to achieve sustainable development of road environments. The third category is the development of clean energy. Hao et al. [30] used the multiplier energy consumption as an object and the results showed that changing the fuel structure and improving fuel efficiency are important ways to reduce transportation carbon emissions. Later, Kuo et al. [31] proposed the use of biofuels to support the renewable development of fuel consumption in the transportation sector. They found that the increase in the proportion of biofuels should be achieved through technological development. Cao et al. [32] established the situational development trends of the thermal coal supply chain. The results showed that the effective ways to reduce carbon emissions include improving transportation structure and increasing investment in biodiesel. The above research mainly adopted system dynamics to conduct dynamic analyses on the whole transportation system and showed the ways to reduce energy consumption, as shown in Table 2. However, these studies only considered the sustainable development of the transportation industry from the perspective of the environment, and such results cannot fully reflect the situation of a country or region.
Fang et al. [36] combined the emergy theory with the system dynamics model and used the system dynamics model to simulate the urban emergy flow. Lei et al. [37] used the emergy flow analysis method to analyze and describe the development of Macau, and the dynamic simulation software simulated the emergy trend. Based on the above research content, it can be seen that some scholars used emergy analysis method to carry out research in logistics, and others used a system dynamics model to optimize the transportation system. However, few papers link the emergy analysis method with system dynamics when applying it to the transportation industry. Due to the lack of research in this field, we combined emergy analysis with system dynamics and selected Qinghai as the research area to collect energy consumption data, system modeling and scenario analysis in the transportation industry.
The emergy analysis method enables the unified description and quantitative measurement of ecological objectives and effectively simplifies the complex interactions between human social activities and natural systems. The emergy evaluation index can be used to analyze the sustainable development status in specific fields. Therefore, in order to reflect the ecological status of the transportation industry more objectively and truly, this study introduces the emergy analysis method for the sustainable development evaluation of the transportation industry. However, the emergy analysis method ignores the contribution of technical progress and economic development to the sustainable development of transportation industry and thus cannot describe the dynamic change trend of the complex feedback relationships and ecological conditions in the transportation system. To this end, this study introduces the system dynamics method that can simulate the structure and function of the system and build the system dynamics model of the transportation industry to realize the simulation of the development trend of the transportation ecosystem. Thus, we combined emergy theory with the system dynamics method to construct a simulation evaluation model for regional development. As such, the evolution mechanism of the industrial ecosystem can be investigated qualitatively and quantitatively, which can not only evaluate the current development situation, but also explore the future development mode. The research objective is to improve the sustainable performance of the transportation system through scenario analysis.

3. Data and Methods

3.1. Study Area and Data

Qinghai is located in the west of China (geographical position is between 89°35′ E–103°04′ E and 31°36′ N–39°19′ N), situated in the northeast of the Qinghai–Tibet Plateau, with an area of 722,300 square kilometers, ranking the fourth largest province in China in terms of land area. Qinghai is a province of natural resources, including sufficient energy such as renewable resources and non-renewable resources, which is the unique advantage of Qinghai. Although the modern service industry started late, it has developed rapidly, with investment in fixed assets and infrastructure construction showing positive growth, among which investment growth is the fastest in the new energy industry. However, to maintain the growth of the GDP, many people need to be supported. The increase in population leads to an accelerated consumption of resources, including internal and external resources. According to the Qinghai Province Railway Development Plan, the railway to Chengdu forms a convenient passage connecting with the southwest, and the railway to Dunhuang constitutes a channel to connect with the northwest. Due to the planning and construction of the Qinghai–Tibet Railway and the implementation of the western development strategy, the construction of transportation infrastructure has continued to expand within Qinghai Province. From the perspective of these characteristics, Qinghai is a representative province in terms of the abundance of natural resources and the development trend of the transportation industry in recent years. Therefore, this paper selects Qinghai as the object of case study.
In this article, most of the original data comes from the Qinghai Statistical Yearbook (2011–2018), the China Energy Statistical Yearbook (2011–2018) and the China Statistical Yearbook (2011–2018) (the National Bureau of Statistics, 2011–2018). The remaining data was collected from the Qinghai Yearbook (2011–2018) [38,39,40,41].

3.2. Emergy Analysis Method

The concept of emergy was introduced by Odum and is sometimes considered as an expansion of the embodied energy concept [42]. It is defined as “the available energy of one kind previously used directly or indirectly to generate a service or a product” [43]. Emergy allows for the measurement of system performances based on a common energy metrics. Emergy is the product of the original data and the emergy conversion rate. The emergy conversion rate is named UEV, which is the amount of solar energy required to produce 1J product or service. The emergy index can quantitatively analyze the degree of sustainable development of natural resources. The emergy analysis involves the flow, conversion and storage of energy. As an emergy method based on thermo dynamics, the total emergy is obtained by converting fuel, energy, electricity, human labor and services.

3.2.1. Emergy Flow

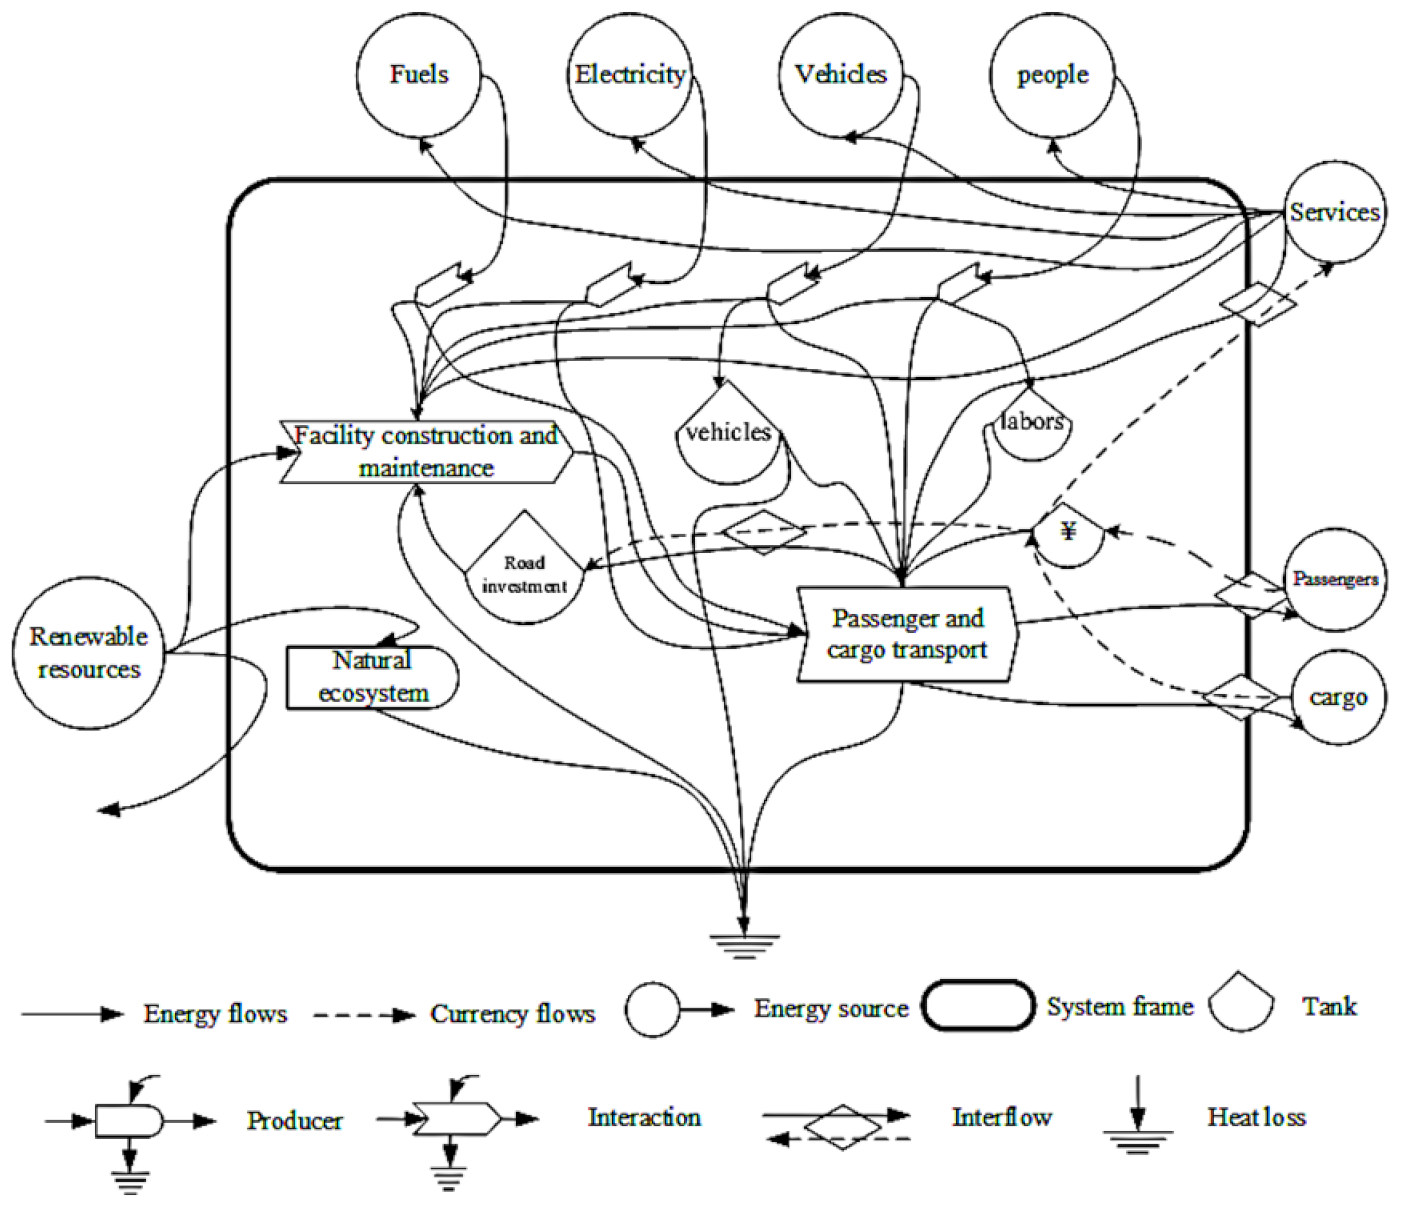
Emergy flow can be used to analyze the flow of resources and goods between various departments in the city, as well as the exchange between the socioeconomic system and the ecological environment. The emergy analysis method has been used to quantitatively assess the carrying capacity of the urban ecological environment. Generally speaking, the energy flow diagram includes the interaction between inputs, system components, symbolic components and the final product. The emergy flow is mainly concentrated on the conversion of internal and external resources [44]. Combined with the actual situation, we have depicted the energy system diagram of the transportation industry in Qinghai Province on the Qinghai–Tibet Plateau, as shown in the figure below.
Figure 1 shows the energy source and flow path of the transportation system in Qinghai Province. On the left is the renewable resource, which is the wealth foundation of the system. It is connected with the internal natural ecosystem, providing a variety of goods and services for human beings and supporting the survival and development of mankind. The exterior of the system includes the resource consumables and labor services of the transportation industry, which are fuel, electricity, vehicles and people in a hierarchical order respectively. Inputs purchased from outside the system are introduced along with their associated services to purchase sufficient resources, energy and labor through trade. Within the system, the natural ecosystem acts as a carrier for heat loss associated with the construction and maintenance of facilities, passenger and cargo transportation and vehicles. Electricity is an excellent energy with a very wide range of sources and uses. The actual production and life cannot be separated from the support of electricity. The region converts materials and goods into infrastructure through specific resource consumption, vehicle assistance, labor support and road investment. The road infrastructure built and maintained allows passengers and goods to pass. Transportation is the core part of the system, driven by incoming vehicles, driver’s labor, fuel and electricity and renewable resources. The final system exports passenger and freight services on the right side, resulting in heat loss below the system.

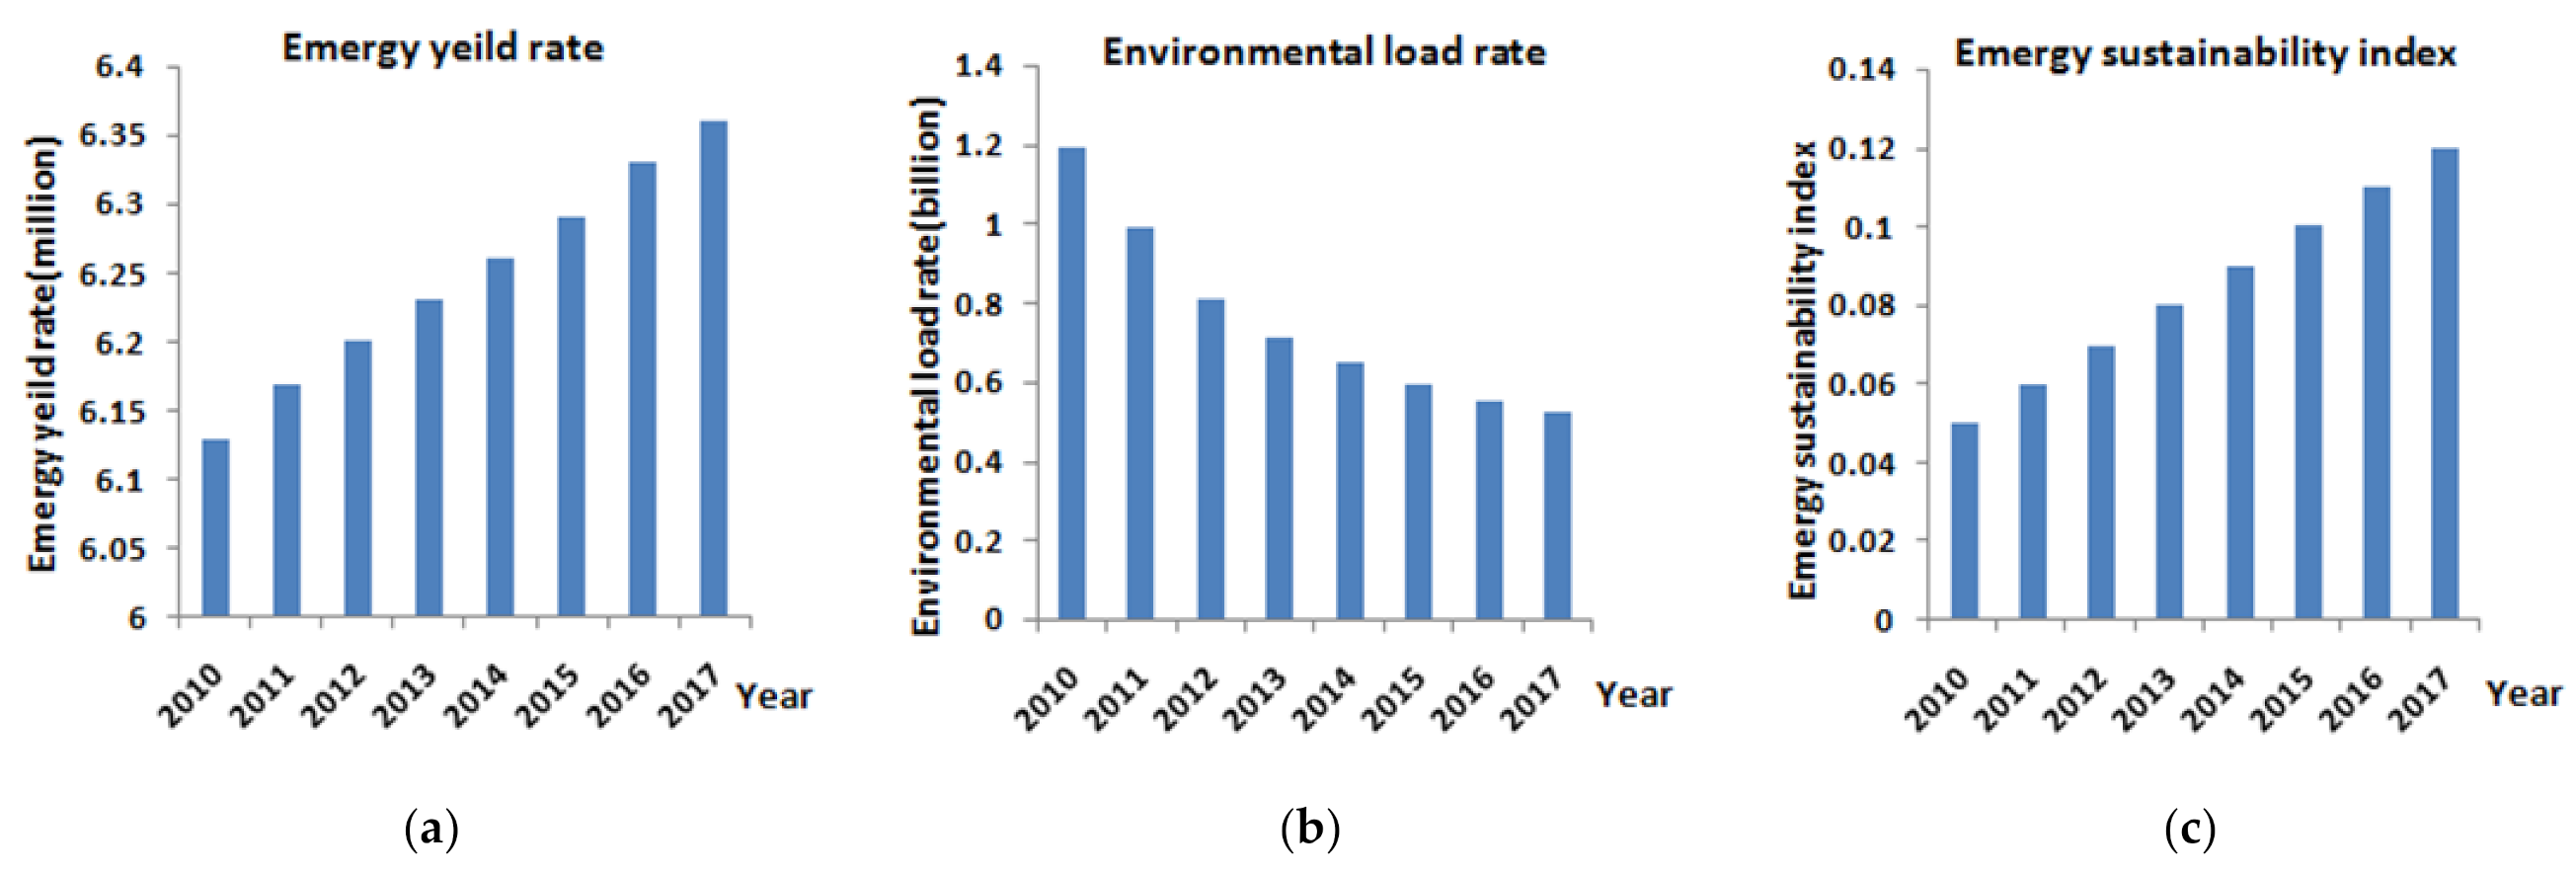
3.2.2. Emergy Analysis Index

Taking into account the actual local conditions in the process of calculation, this paper calculated the emergy flow during the operating years from 2010 to 2017. The following is an explanation of the formula for calculating the emergy index, and references for emergy conversion rates are shown in Table 3.
In order to satisfy the convenience of the emergy analysis research, we divided the data into renewable resources (R), non-renewable resources (N), economic feedback input (F) and output emergy (Y) [51]. A summary of the emergy index and its meanings is shown in Table 4.
Combined with the basic situation of the development of transportation industry in Qinghai Province, based on emergy theory, this paper analyzes its characteristics and operating state from a new perspective, and evaluates the development status and future development potential of transportation industry. The evaluation index system should fully consider the availability and completeness of the data, which can not only reflect its characteristics but also make full use of the relevant statistical data.

3.3. System Dynamics

System dynamics is a methodology for the systematic analysis of social and economic problems proposed by Professor Frates of the Massachusetts Institute of Technology. It uses a computer as a tool to analyze and study the structure and behavior of information feedback system. It is known that dynamics can be defined as the speed of change over time. System dynamics studies the overall behavior of the system by analyzing the feedback structure relationship between various variables in the socioeconomic system.
The variables include level variables and rate variables, as well as auxiliary variables. Level variables are generated by activities in the system, which explain the activities of the system at a certain point in time. Rate variables are variables of control flow, which indicate the variable of the system activity at a certain point. The basic idea is that feedback control can be carried out. Therefore, system dynamics can be used to deal with dynamic and complex problems [52].

3.3.1. Causal Cycle Diagram

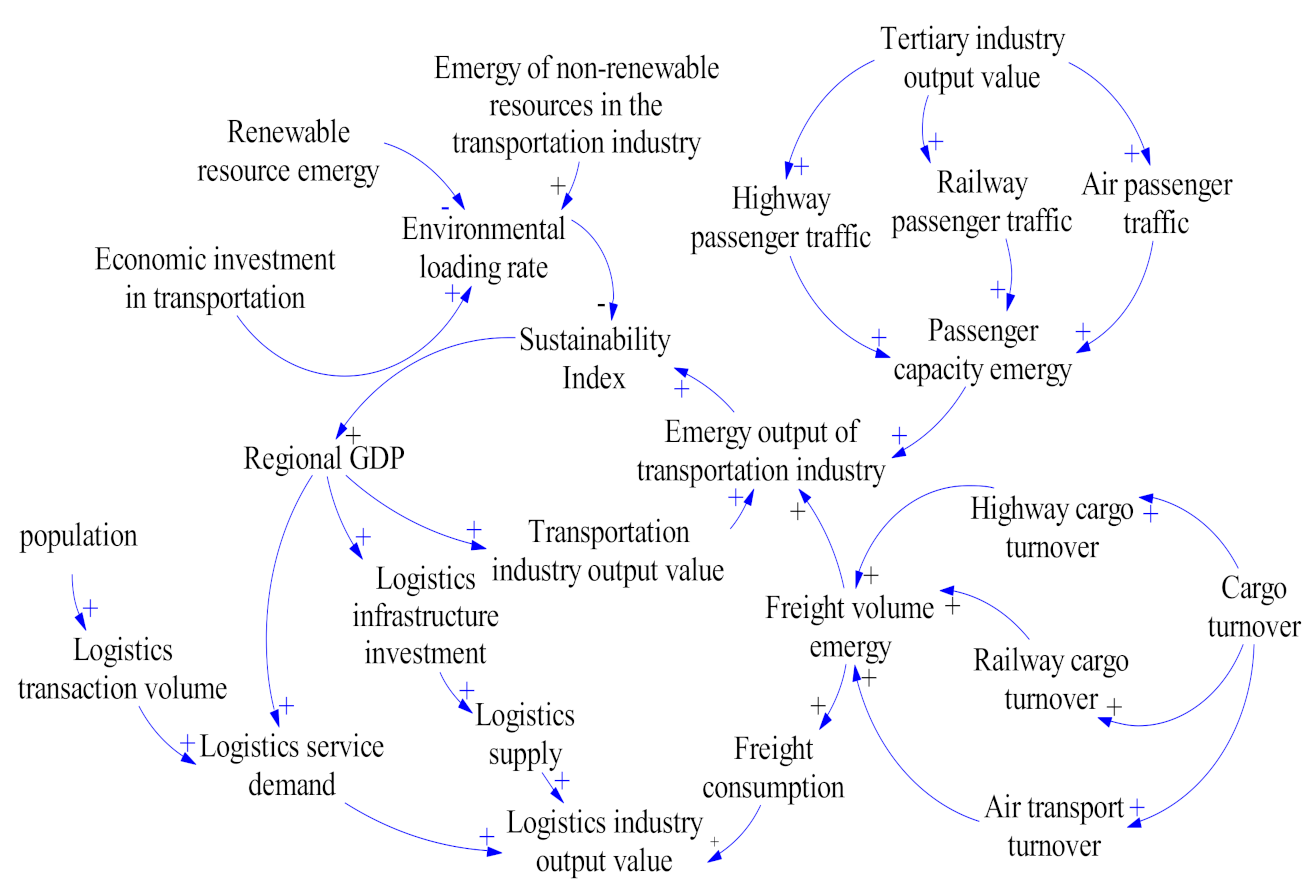
We constructed a causal loop diagram, as shown in Figure 2. The causal relationship diagram shows the main variables of the model and can identify some positive feedback and negative feedback loops so that we can deeply understand the feedback and control processes of the system [53]. In order to gain a deeper understanding of the causal cycle diagram, it is necessary to analyze the causal relationship between the variables. For example, there is a positive relationship between the emergy of non-renewable resources and the environmental load rate in transportation industry. In other words, it means that if the energy consumption of non-renewable resources increases in the transportation industry, its environmental load rate will increase. Conversely, there is a negative relationship between renewable resources and environmental load rate. Therefore, if the area has an increase in renewable resources, the environmental load rate will decrease. The closed loop of causality forms the feedback loop, which defines the dynamics of the model [54].

3.3.2. System Flow Diagram of the Transportation Industry

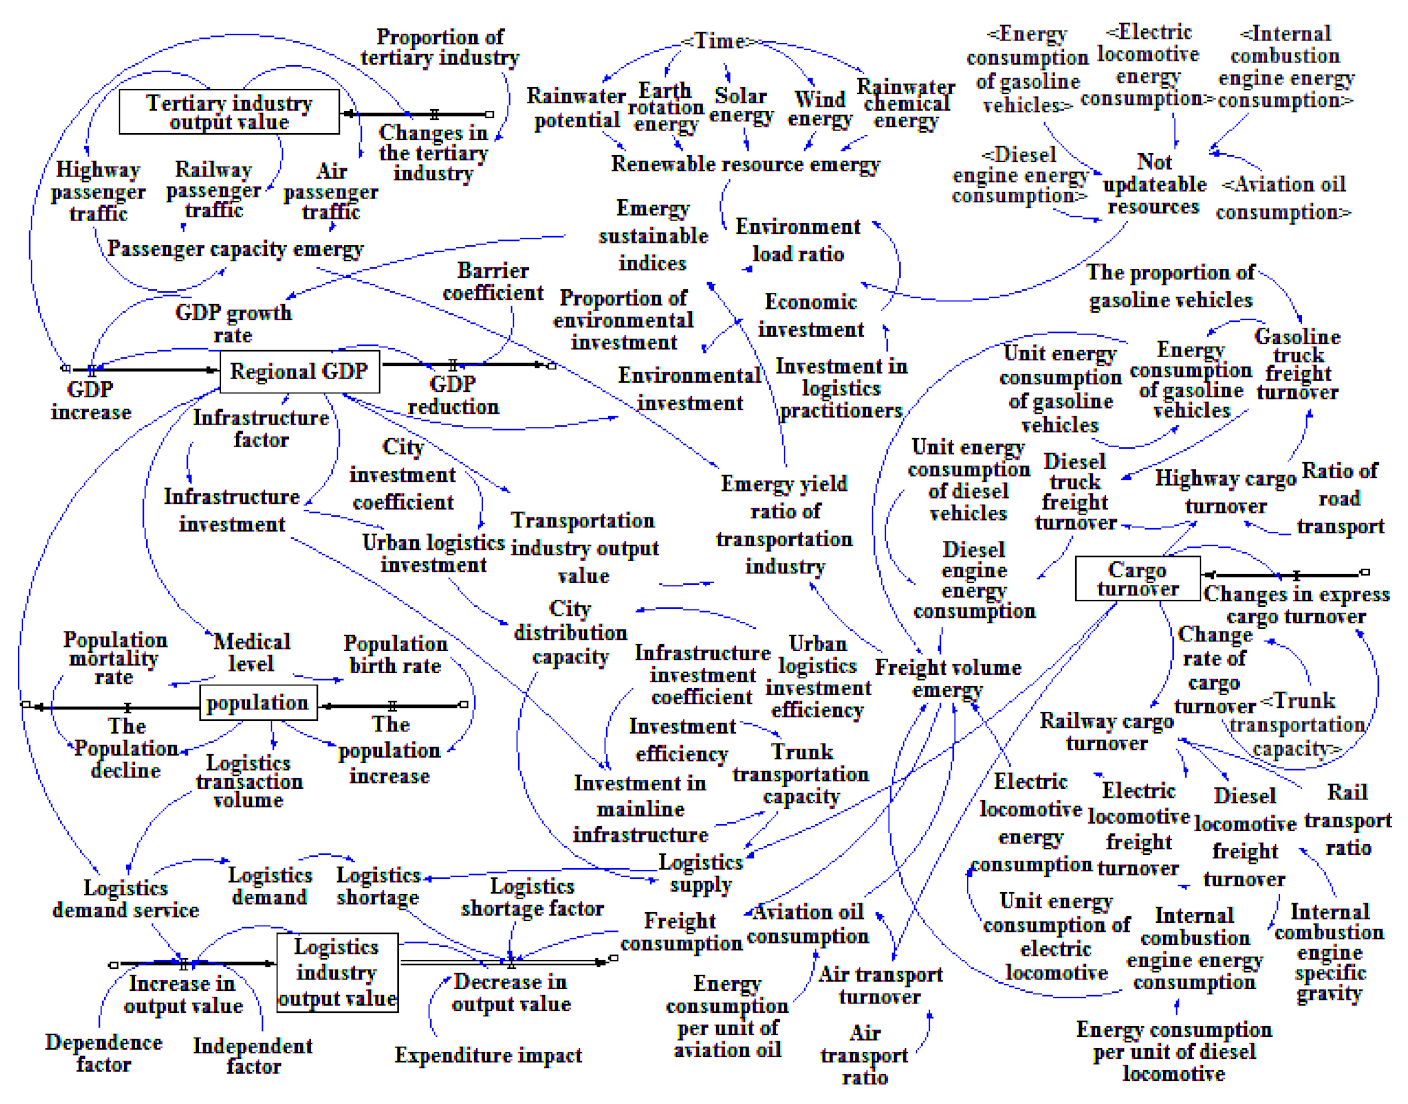
Based on the causal cycle diagram, we built a dynamic model of urban emergy flow system based on the energy flow diagram and emergy evaluation index system, as shown in Figure 3. This model is useful for combining causality, feedback, and delay between variables [55]. In the system flow diagram of the transportation industry, we set horizontal variables such as regional GDP, output value of the tertiary industry, population, industrial output value of the logistics industry, and volume of goods turnover. Due to the rapid economic development in recent years, the development of the transportation industry has been promoted. The investment in logistics infrastructure and the enhancement of logistics supply capabilities have increased the output value of the logistics industry. The rapid economic development, especially the rapid growth of GDP per capita, will have a great impact on the transportation system. Population is one of the level variables which will have a great impact on the system if it changes slightly. The increase in population will lead to the increase in logistics transaction volume, the increase in population welfare will lead to an increase in the new born population, and the improvement in the level of medical resources will reduce the number of deaths in the population. At the same time, the consumption of various resources by urban residents drives the flow of resources, which will have a series of impacts on the environment. On the left side of the system, there are mainly activities related to the economy and logistics industry. Taking road, railway, air and other major modes of transportation as an opportunity, the choice of different modes of transportation and the corresponding energy consumption are displayed at the bottom right of the system. At the upper right of the system flow diagram, renewable resources and non-renewable resources are added to the emergy index system and the concept of emergy is introduced. The emergy yield rate, environmental load rate, emergy sustainability indices and other economic and environmental perspectives can measure the sustainable development of the transportation industry.
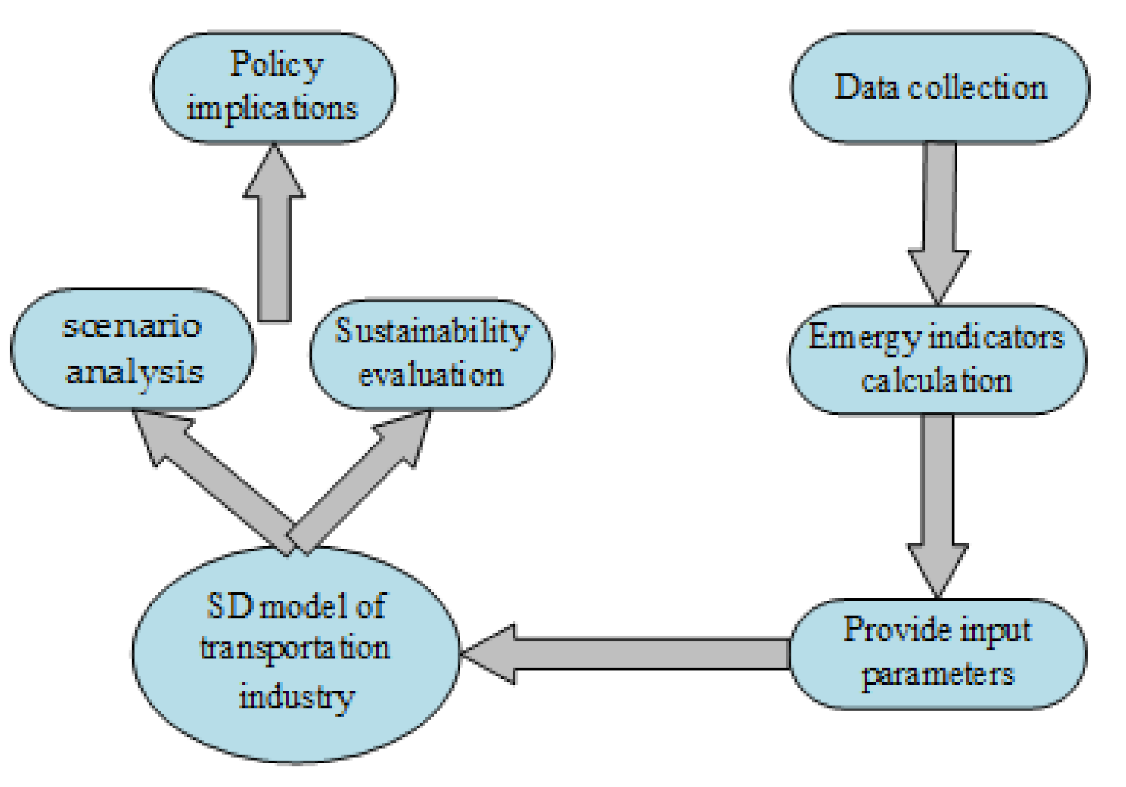
We mentioned the emergy analysis method and integrated the emergy evaluation index into the system dynamics model as its variable to evaluate the sustainability of the transportation system. The modeling objectives are described below. To make the approach clearer, the methodological framework of the SD model is shown in Figure 4.
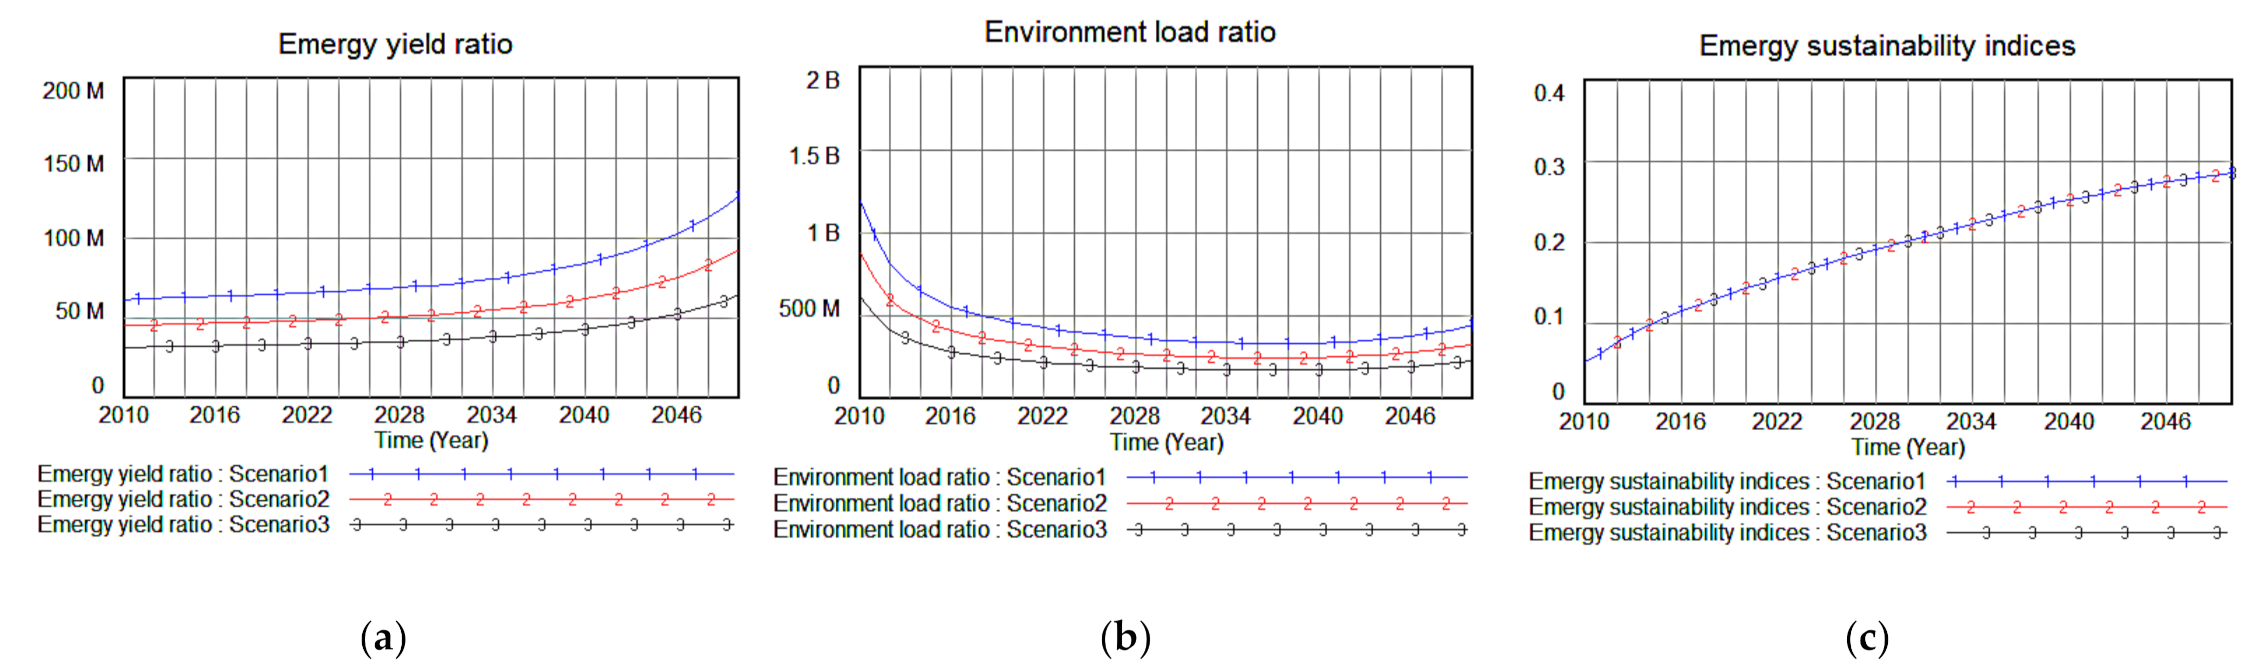
  • Through the construction of the causality diagram, the regional transportation system is deeply analyzed to clarify its internal influencing factors and the causality between each influencing factor and further realize the development trend of the regional transportation system.
  • We carry out a simulation prediction analysis and comparison on the output results of variables in the transportation system dynamics model. A better simulation effect can be achieved by using the dynamic simulation analysis method to describe the flow process of variables in the transportation system. On this basis, we can explore the way to achieve the sustainable development of regional transportation.

3.3.3. Model Test

We calculated the data of energy storage and the conversion of transportation industry in Qinghai Province. In order to verify the validity of the model, the historical data of the output emergy of the transportation industry in Qinghai was input into the model from 2010 to 2017 and the data from 2018 to 2050 was predicted. The error between the simulated value and the actual value is less than 5%, indicating the validity of the flow standard deviation. The verification results are shown in Table 5.

4. Results

4.1. Emergy Index Analysis of Transportation Industry

Table 6 shows the relevant data and information of the emergy elements of the transportation industry in Qinghai Province. Generally speaking, the total emergy of the renewable resources has basically not changed in this region from 2010 to 2017. As for the major non-renewable resources such as coal, gasoline and diesel consumed by the transportation industry, the energy consumption was constantly increasing, and an excessive reliance on non-renewable resources would lead to the continuous depletion of the ecological environment. The emergy of economic feedback inputs such as education, employment and fixed asset investment in the transportation industry increased from 3.87 × 10²² sej to 1.38 × 10²³ sej from 2010 to 2017, indicating that the country’s policy support is getting stronger for the transportation industry. From the table, we can see that the yield emergy of passenger volume declined from 7.56 × 10²⁰ sej in 2010 to 4.69 × 10²⁰ sej in 2017, including the passenger volume yield of roads, railways and aviation. The yield emergy of freight volume increased from 7.73 × 10²⁰ sej in 2010 to 1.23 × 10²¹ sej in 2017. Road and railway transportation are still the main modes of transportation. The growth observed in the data showed the continuous development and improvement of road infrastructure construction in Qinghai Province. The rise of electric business and shopping also plays a supporting role, and the level of service is also constantly improving. The yield emergy of the transportation industry increased from 5.71 × 10²² sej to 1.16 × 10²³ sej from 2010 to 2017, indicating that the development trend of the transportation industry is prosperous. The transportation industry will maintain an overall stable and steady progress. Meanwhile, it will face new opportunities and challenges in development.
Figure 5 shows the development trend of the emergy yield rate, environmental load rate and emergy sustainable index of the transportation industry in Qinghai Province from 2010 to 2017. The emergy yield rate of the system is positively correlated with the sustainable development index, and the changing trend is generally consistent. Figure 5a shows that the emergy yield rate fluctuates within the range of 6.0 × 10⁷ to 6.4 × 10⁷ during 2010–2017 and is constantly rising. Figure 5b shows that the environmental load rate is a declining trend, decreasing within the range of 1.4 × 10⁹ to 0.4 × 10⁹, and the environmental performance continued to improve. Although the environmental carrying capacity shows a downward trend in some time periods, it still cannot hinder its development trend in a good direction. Figure 5c shows that the emergy sustainability index has been increasing continuously and was maintained above 0.04 during 2010–2012. It continues to increase during 2012–2017, especially after 2015, when its value dropped below the level value of 0.1. In general, the economic and environmentally sustainable development of the transportation industry is not optimistic in Qinghai Province on the Qinghai–Tibet Plateau. In this regard, we carry on the scenario analysis to the future development situation of the transportation industry of Qinghai Province.

4.2. Scenario Analysis

To understand which of the solutions is the most profitable, we studied the simulation results of the model in terms of the emergy yield rate, the environmental load rate and the emergy sustainability index. The choice of transportation mode affects enterprise cost and profit. The usage of non-renewable resources plays an important role in the sustainable development of the ecological environment. The speed of economic development is the main premise of the forecast of the transportation industry, which directly affects the development of the transportation industry. Therefore, we set up three schemes from the perspectives of transportation mode, non-renewable resource usage and economic development speed. The specific scenarios are shown in Table 7.

4.2.1. Scenario Analysis under the Change of Transportation Mode

In the dynamic scenario, we link the variables “ratio of railway transport” and “proportion of road transport” and adjust the transport ratio parameters according to the market share of the transport mode. As shown in Figure 6a, the emergy yield rate increases year by year and flows between 0–150 million during 2010–2050 and still grows in the middle section. After 2030, the emergy yield rate will grow faster than before. This may be because the government has increased the coverage of railway facilities and the investment in railway construction, which has achieved remarkable results. From the perspective of the change degree of the development trend of the three scenarios, the increase in the proportion of railway transportation and the decrease in the proportion of road transportation will lead to the decrease in the emergy yield rate. It requires that we can reasonably choose the mode of transportation according to the characteristics and shape of the goods while also considering the freight afford ability of the goods. Generally, such a choice is more economical and reasonable.
It can be seen from Figure 6b that the environmental load rate presents a downward trend on the whole, and the overall change trend of the three scenarios is similar. At the beginning of the study, the rate of decline was fast, but after 2020, it steadily decreased to less than 500 million. Under the baseline scenario, the environmental load rate remains above zero from 2010 to 2050. The fastest decline occurs in the early 21st century. This may be because of the blind expansion of the rail transport range. We find that the increase in railway transportation proportion can reduce the environmental pressure brought by the transportation system. This is because railway transportation can improve safety performance and reduce energy consumption. Figure 6c shows that the emergy sustainability index changes within the range of 0–0.3, and the trend of the scene is not obvious.
After the above scenario analysis, we learned that due to the poor flexibility of railway transportation, it needs to coordinate with other transportation ways to develop a comprehensive transportation system. This revealed that road transportation still plays an irreplaceable role to some extent. In the future, multimodal transport is the most economical option.

4.2.2. Scenario Analysis under the Change of Non-Renewable Resource Usage

This is shown in Figure 7a. The emergy yield rate increases between 50 million and 200 million. Before 2040, it is within 100 million, and the remaining scenario simulation time varies between 100 and 200 million. Taking the 2030s as the node, the decrease in non-renewable resource usage under different situations has obvious influence on the increase in emergent productivity of transportation industry. This may be due to policy promotion and slight fluctuations showing the impact of the end of the highest level in the technological transformation scenarios. As can be seen from Figure 7b, the environmental load rate has a decline in depression between 250 million and 1 billion. It rapidly declines before 2020. The period is slowly declining between 0–500 million during 2020 to 2050. Although the environmental load rate gradually shows a good development trend before 2040, it rebounds after 2040 due to the influence of various factors. This may be due to the impact of changes in the structure of energy production. The scenario analysis shows that simply reducing the use of non-renewable resources is not conducive to the long-term absorption of environmental load rate of transportation industry. In order to reduce the environmental pressure caused by transportation activities, new energy sources need to be developed to fill the gap of reduced resources.
Figure 7c demonstrates that the emergy sustainability index shows a prominent growth between 0–0.4. The change trend of the three scenarios is similar, and the sustainable development performance of the three scenarios increases steadily in the range of 0–0.2 from 2010 to 2020. It will increase between 0.2–0.4 after 2020. This indicates that our model appears to operate within the acceptable range of the lower case and baseline scenario. Given China’s ongoing urbanization and development of the economy, we find that the high cost and limited supply of natural gas and electricity will hamper the transition to cleaner fuels. In fact, the development of clean energy is inseparable from financial subsidies, technological innovation and the continuous improvement of infrastructure construction. Cultivating high-tech talents can also help to build a resource-saving transportation system and ultimately ensure the harmonious development of the transportation industry and the environment.

4.2.3. Scenario Analysis under the Change of Economic Development Speed

It was found in Figure 8a that the emergy yield rate increases year by year. Taking 2040 as the node, it grows slowly below 50 million during 2010–2040 and grows rapidly above 50 million after 2040. At the same time, it can be seen that the growth in the economic development speed is conducive to the increase in the output value of the transportation industry. In the long term, when the economic development rate increased by 10% and 20%, the emergy yield rate increased rapidly after the 2030s, and the influence of economic policies has gradually strengthened. The acceleration of economic development is not favorable for the environmental load rate of transportation industry. Finally, increasing the speed of economic development can enhance the yield efficiency of the transportation system, and improve the transport efficiency of passenger and freight volumes.
Figure 8b shows that the environmental load rate fluctuates in the interval of 250 million and 1 billion. Taking 2040 as the node, the environmental load rate shows a downward trend before 2040, and its variation range is almost 0. After 2040, it shows an upward trend with a fast growth rate. It runs between 0–500 million during the period of 2020–2040 and varies between 500 million and 1 billion the rest of the time. If the economic development speed grows too fast, it is more likely to ignore the adverse impact on the environment, which leads to the increase in the environmental load rate and the environmental pressure of the sustainable development of the system. As can be seen from Figure 8c, the emergy sustainability index varies from 0 to 0.3, with a small fluctuation range. The change trend is basically the same and the change range is almost 0. At the same time, economic construction will stimulate the development of transportation infrastructure and improve the efficiency of resource allocation in the transportation industry. The level and quality of economic development affects the construction of transportation networks and the transformation of the management mode. Therefore, keeping the economy running smoothly is the best choice.

5. Discussion

5.1. Emergy Index Analysis of Transportation Industry under the Change of Transportation Mode, Usage of Non-Renewable Resources and Economic Development Speed

Figure 9 shows the overall development trend of the simulation time range and emergy indicators, indicating the environmental and economic dimensions of the simulation and prediction analysis of the sustainable development of the transportation system under the comprehensive effect of the three schemes. According to the results of the simulation analysis, Figure 9a showed that the emergy yield rate of the transportation industry will grow slowly and steadily before 2036 and turn to a relatively large growth after 2036. This is because the growth is relatively slow in the initial period due to the imperfection of the infrastructure. In contrast, Figure 9b showed the environmental load rate, although the environmental load rate has increased, the overall change is not significant. In all cases, the environmental load rate of the transportation industry declined rapidly before the 2020s. After that, the local environmental load rate changed little because of the decline in the birth population or the improvement in citizen literacy. With the support of new technologies, such as steady economic growth and clean energy, the infrastructure and auxiliary facilities have also been continuously strengthened, driving the development of the transportation industry. The ways to improve the sustainable performance of the transportation system include improving the infrastructure construction and increasing the variety and quantity of transportation fuels. Figure 9c shows the emergy sustainability index, indicating that the sustainable performance of the transportation industry has been enhanced after scenario simulation.
The model can be used as a decision-making tool for the comprehensive evaluation of urban planning to simulate the absorption of emergy indicators under multiple scenarios. For the transportation industry, the simulation analysis of policy combinations can help the healthy development of the industry and provide a theoretical basis for establishing policy support and feedback relationships for industrial development and sustainable development models. Therefore, the results of this study are effective tools to support decision-making in economic, social and environmental sustainability.

5.2. Policy Implications

We use the system dynamics model to establish different scenario analyses, predict the overall trend of development and determine the scope of activities of each variable. The sustainable development optimization model of transportation industry established in this paper can help to understand the impact of urban scenario planning and provide a quantitative method for construction decision-making. Most of the existing studies provided emission reduction strategies from other perspectives, such as improving the sector structure and the regional structure [56]. However, the simulation results gave us some inspirations in this article. Firstly, in the process of industry development, we should evaluate and plan in advance. Secondly, from the perspective of operation management, we should adjust the proportion of road and railway transportation appropriately. Thirdly, the need to ecologically and strategically support the transportation sector is therefore framed in wider thoughts on resource allocation. Fourth, the speed of economic development should be maintained at a medium level. It is not the case that a faster speed of economic development results in a better effect of sustainable development.

5.3. Future Prospects

In the process of collecting data, due to the limitation of data collection capacity, some data inevitably have some deviations. However, the obtained data provide the best information about the transportation industry of Qinghai Province to the greatest extent, which mostly reflect the situation of the transportation industry. In addition, the same data caliber is used throughout the analysis process, which ensures maximum integrity of the results. However, according to the local actual situation, the factors that may affect the sustainable development of the transportation system are different, leading to the difference in the selected variables. Therefore, future studies should clarify the sustainable development of the transportation system from a comprehensive perspective.

6. Conclusions

This paper proposed a dynamic model of the transportation system that includes a scenario analysis. Through historical tests, we have proved its reliability and effectiveness. From the simulation results and discussions, we can draw the following conclusions:
  • From the perspective of operation management, the redistribution of the proportion of road and railway transportation has the greatest impact on the sustainable development of the economic and environmental dimensions of the transportation system.
  • In terms of transportation energy consumption, the reduction of non-renewable resources has a positive impact on the energy sustainability indicators. The government should increase the proportion of clean energy used in transportation and improve the energy consumption structure of the transportation industry. However, it has a certain time lag, so its energy saving effect gradually appears over time.
  • The need to support ecologically and strategically sustainable societal decision-making in the transportation sector is therefore framed in wider thoughts on economic planning, while envisaging a transformation towards a prosperous and sustainable future.
  • We have established a robust and scalable system dynamics model for the sustainable development of the transportation industry. The simulation results can reflect the sustainable development of the system and reduce the environmental pressure caused by transportation activities.

Author Contributions

Conceptualization, W.F.; data curation, H.W.; formal analysis, H.W.; funding acquisition, W.F.; methodology, W.F.; supervision, J.L.; visualization, W.F.; writing—original draft, H.W.; writing—review and editing, W.F. and H.W. All authors have read and agreed to the published version of the manuscript.

Funding

This research was supported by the Fundamental Research Funds for the Central Uni-versities (2020MS128), the Second Tibetan Plateau Scientific Expedition and Research Program (2019QZKK0608), the Hebei Social Science Fund (HB20GL031) and the National Natural Science Foundation of China (41901259).

Institutional Review Board Statement

Not applicable.

Informed Consent Statement

Not applicable.

Data Availability Statement

The data presented in this study are available on request from the corresponding author.

Conflicts of Interest

The authors declare no conflict of interest.

References

  1. Rao, Z.H.; Wang, S.F. A review of power battery thermal energy management. Renew. Sustain. Energy Rev. 2011, 15, 4554–4571. [Google Scholar] [CrossRef]
  2. Zhang, X.Q.; Xu, L.; Chen, Y.; Liu, T.T. Emergy-based ecological footprint analysis of a wind farm in China. Ecol. Indic. 2020, 111, 106018. [Google Scholar] [CrossRef]
  3. Amjad, S.; Neelakrishnan, S.; Rudramoorthy, R. Review of design considerations and technological challenges for successful development and deployment of plug-in hybrid electric vehicles. Renew. Sustain. Energy Rev. 2010, 14, 1104–1110. [Google Scholar] [CrossRef]
  4. Sulaiman, N.; Hannan, M.A.; Mohamed, A.; Majlan, E.H.; Wan Daud, W.R. A review on energy management system for fuel cell hybrid electric vehicle: Issues and challenges. Renew. Sustain. Energy Rev. 2015, 52, 802–814. [Google Scholar] [CrossRef]
  5. Saidur, R.; Abdelaziz, E.A.; Demirbas, A.; Hossain, M.S.; Mekhilef, S. A review on biomass as a fuel for boilers. Renew. Sustain. Energy Rev. 2011, 15, 2262–2289. [Google Scholar] [CrossRef]
  6. Ong, H.C.; Mahlia, T.M.I.; Masjuki, H.H. A review on energy pattern and policy for transportation sector in Malaysia. Renew. Sustain. Energy Rev. 2012, 16, 532–542. [Google Scholar] [CrossRef]
  7. Nightingale, A.J. Power and politics in climate change adaptation efforts: Struggles over authority and recognition in the context of political instability. Geoforum 2017, 84, 11–20. [Google Scholar] [CrossRef]
  8. Aalto, P. The new International Energy Charter: Instrumental or incremental progress ingovernance? Energy Res. Soc. Sci. 2016, 11, 92–96. [Google Scholar] [CrossRef] [Green Version]
  9. Zhu, B.Z.; Jiang, M.X.; Wang, K.F.; Chevallier, J.; Wang, P.; Wei, Y.M. On the road to China’s 2020 carbon intensity target from the perspective of “double control”. Energy Policy 2018, 119, 377–387. [Google Scholar] [CrossRef]
  10. Cheng, B.; Yan, X.; Peng, Z.; Wei, S. The Direction and Focus of Implementing the Strategy of Innovation-driven Development during the 13th Five-year Plan Period. Fisc. Sci. 2016, 2, 25–34. [Google Scholar]
  11. Su, B.W.; Heshmati, A.; Geng, Y.; Yu, X.M. A review of the circular economy in China: Moving from rhetoric to implementation. J. Clean. Prod. 2013, 42, 215–227. [Google Scholar] [CrossRef]
  12. Giannetti, B.F.; Bonilla, S.H.; Almeida, C.M.V.B. An emergy-based evaluation of a reverse logistics network for steel recycling. J. Clean. Prod. 2013, 46, 48–57. [Google Scholar] [CrossRef]
  13. Cristiano, S.; Gonella, F. To build or not to build? Megaprojects, resources, and environment: An emergy synthesis for a systemic evaluation of a major highway expansion. J. Clean. Prod. 2019, 223, 772–789. [Google Scholar] [CrossRef]
  14. Huang, S.P.; An, H.Z.; Viglia, S.; Fiorentino, G.; Corcelli, F.; Fang, W.; Ulgiati, S. Terrestrial transport modalities in China concerning monetary, energy and environmental costs. Energy Policy 2018, 122, 129–141. [Google Scholar] [CrossRef]
  15. Liu, C.Q.; Huang, Y.G.; Wang, X.Y.; Tai, Y.; Liu, L.Q.; Sun, C.G.; Liu, H. Emergy analysis for transportation fuels produced from corn stover in China. J. Clean. Prod. 2018, 174, 213–225. [Google Scholar] [CrossRef]
  16. Meng, F.X.; Liu, G.Y.; Yang, Z.F.; Casazza, M.; Cui, S.H.; Ulgiati, S. Energy efficiency of urban transportation system in Xiamen, China. An integrated approach. Appl. Energy 2017, 186, 234–248. [Google Scholar] [CrossRef]
  17. Arbault, D.; Rugani, B.; Tiruta-Barna, L.; Benetto, E. A semantic study of the Emergy Sustainability Index in the hybrid lifecycle-emergy framework. Ecol. Indic. 2014, 43, 252–261. [Google Scholar] [CrossRef]
  18. Giannetti, B.F.; Almeida, C.M.V.B.; Bonilla, S.H. Comparing emergy accounting with well-known sustainability metrics: The case of Southern Cone Common Market Mercosur. Energy Policy 2010, 38, 3518–3526. [Google Scholar] [CrossRef]
  19. Cai, W.; Liu, C.H.; Zhang, C.X.; Ma, M.; Rao, W.Z.; Li, W.Y.; He, K.; Gao, M.D. Developing the ecological compensation criterion of industrial solid waste based on emergy for sustainable development. Energy 2018, 157, 940–948. [Google Scholar] [CrossRef]
  20. Lou, B.; Ulgiati, S. Identifying the environmental support and constraints to the Chinese economic growth—An application of the Emergy Accounting method. Energy Policy 2013, 55, 217–233. [Google Scholar] [CrossRef]
  21. Taskhiri, M.S.; Tan, R.R.; Chiu, A.S.F. Emergy-based fuzzy optimization approach for water reuse in an eco-industrial park. Resour. Conserv. Recycl. 2011, 55, 730–737. [Google Scholar] [CrossRef]
  22. Merlin, G.; Boileau, H. Eco-efficiency and entropy generation evaluation based on emergy analysis: Application to two small biogas plants. J. Clean. Prod. 2017, 143, 257–268. [Google Scholar] [CrossRef]
  23. Oliveira, R.K.D.; Higa, A.R.; Silva, L.D.; SilvaI, C.; Goncalves, M.D.M. Emergy-based sustainability assessment of a loblolly pine (Pinus taeda) production system in southern Brazil. Ecol. Indic. 2018, 93, 481–489. [Google Scholar] [CrossRef]
  24. Ali, M.; Marvuglia, A.; Geng, Y.; Robins, D.; Pan, H.Y.; Song, X.Q.; Yu, Z.J.; Sun, H.P. Accounting Emergy-based sustainability of crops production in India and Pakistan over first decade of the 21st century. J. Clean. Prod. 2019, 207, 111–122. [Google Scholar] [CrossRef]
  25. Kamp, A.; Morandi, F.; Qstergard, H. Development of concepts for human labour accounting in Emergy Assessment and other Environmental Sustainability Assessment methods. Ecol. Indic. 2016, 60, 884–892. [Google Scholar] [CrossRef]
  26. Liu, D.; Xiao, B. Exploring the development of electric vehicles under policy incentives: A scenario-based system dynamics model. Energy Policy 2018, 120, 8–23. [Google Scholar] [CrossRef]
  27. Gómez Vilchez, J.J.; Jochem, P. Simulating vehicle fleet composition: A review of system dynamics models. Renew. Sustain. Energy Rev. 2019, 115, 109367. [Google Scholar] [CrossRef]
  28. Liu, X.; Ma, S.; Tian, J.; Jia, N.; Geng, L. A system dynamics approach to scenario analysis for urban passenger transport energy consumption and CO2 emissions: A case study of Beijing. Energy Policy 2015, 85, 253–270. [Google Scholar] [CrossRef]
  29. Mallick, R.B.; Radzicki, M.J.; Zaumanis, M.; Frank, R. Use of system dynamics for proper conservation and recycling of aggregates for sustainable road construction. Resour. Conserv. Recycl. 2014, 86, 61–73. [Google Scholar] [CrossRef]
  30. Hao, H.; Liu, Z.; Zhao, F.; Li, W.; Hang, W. Scenario analysis of energy consumption and greenhouse gas emissions from China’s passenger vehicles. Energy 2015, 91, 151–159. [Google Scholar] [CrossRef]
  31. Kuo, T.C.; Lin, S.H.; Tseng, M.L.; Chiu, A.S.F.; Hsu, C.W. Biofuels for vehicles in Taiwan: Using system dynamics modeling to evaluate government subsidy policies. Resour. Conserv. Recycl. 2019, 145, 31–39. [Google Scholar] [CrossRef]
  32. Cao, Y.; Zhao, Y.; Wen, L.; Li, Y.; Li, H.; Wang, S.; Liu, Y.; Shi, Q.; Weng, J. System dynamics simulation for CO2 emission mitigation in green electric-coal supply chain. J. Clean. Prod. 2019, 232, 759–773. [Google Scholar] [CrossRef]
  33. Vafa-Arani, H.; Jahani, S.; Dashti, H.; Heydari, J.; Moazen, S. A system dynamics modeling for urban air pollution: A case study of Tehran, Iran. Transp. Res. Part D Transp. Environ. 2014, 31, 21–36. [Google Scholar] [CrossRef]
  34. Kamal, A.; Al-Ghamdi, S.G.; Ko, M. Modeling and understanding the impacts of efficiency measures on fleet fuel consumption in vehicle importing countries: A case study of Qatar. J. Clean. Prod. 2020, 259, 120619. [Google Scholar] [CrossRef]
  35. Liu, L.Y.; Zheng, B.H.; Bedra, K.B. Quantitative analysis of carbon emissions for new town planning based on the system dynamics approach. Sustain. Cities Soc. 2018, 42, 538–546. [Google Scholar] [CrossRef]
  36. Fang, W.; An, H.; Li, H. Accessing on the sustainability of urban ecological-economic systems by means of a coupled emergy and system dynamics model: A case study of Beijing. Energy Policy 2017, 100, 326–337. [Google Scholar] [CrossRef]
  37. Lei, K.; Wang, Z. Emergy synthesis and simulation for Macao. Energy 2008, 33, 613–625. [Google Scholar] [CrossRef]
  38. Qinghai Bureau of Statistics. Qinghai Statistical Yearbook 2011–2018; China Statistics Press: Beijing, China, 2018. [Google Scholar]
  39. National Energy Administration (NEA). China Energy Statistical Yearbook 2011–2018; China Statistics Press: Beijing, China, 2018.
  40. National Bureau of Statistics (NBS). China Statistical Yearbook 2011–2018; China Statistics Press: Beijing, China, 2018.
  41. Qinghai Yearbook Society. Qinghai Yearbook 2011–2018; Qinghai Provincial Local Chorography Compilation Committee Yearbook Editorial Department: Qinghai, China, 2018. [Google Scholar]
  42. Odum, H.T. Self-organization, transformity, and information. Science 1988, 242, 1132–1139. [Google Scholar] [CrossRef] [Green Version]
  43. Odum, H.T. Environmental accounting–EMERGY and environmental decision making. Child Dev. 1996, 42, 1187–1201. [Google Scholar]
  44. Brown, M.T.; Ulgiati, S. Emergy measures of carrying capacity to evaluate economic investments. Popul. Environ. 2001, 22, 471–501. [Google Scholar] [CrossRef]
  45. Zhao, Y.; Yu, M.; Xiang, Y.; Kong, F.; Li, L. A sustainability comparison between green concretes and traditional concrete using an emergy ternary diagram. J. Clean. Prod. 2020, 256, 120421. [Google Scholar] [CrossRef]
  46. Odum, H.T.; Brown, M.T.; Brandt-Williams, S. Handbook of Emergy Evaluation: A Compendium of Data for Emergy Computation Issued in a Series of Folios; Environmental Engineering Sciences, University of Florida: Gainesville, FL, USA, 2000. [Google Scholar]
  47. Brown, M.T.; Protano, G.; Ulgiati, S. Assessing geobiosphere work of generating global reserves of coal, crude oil, and natural gas. Ecol. Model 2011, 222, 879–887. [Google Scholar] [CrossRef]
  48. Odum, H.T. Environmental Accounting: Emergy and Environmental Decision Making; Wiley: New York, NY, USA, 1996; p. 370. [Google Scholar]
  49. Brown, M.T.; Ulgiati, S. Emergy evaluations and environmental loading of electricity production systems. J. Clean. Prod. 2002, 10, 321–334. [Google Scholar] [CrossRef]
  50. Ascione, M.; Campanella, L.; Cherubini, F.; Ulgiati, S. Environmental driving forces of urban growth and development: An emergy-based assessment of the city of Rome, Italy. Landsc. Urban Plann. 2009, 93, 238–249. [Google Scholar] [CrossRef]
  51. Lou, B.; Qiu, Y.; Ulgiati, S. Emergy-based indicators of regional environmental sustainability: A case study in Shanwei, Guangdong, China. Ecol. Indic. 2015, 57, 514–524. [Google Scholar] [CrossRef]
  52. Wang, J.; Lu, H.; Peng, H. System Dynamics Model of Urban Transportation System and Its Application. J. Intell. Transport. 2008, 8, 83–89. [Google Scholar] [CrossRef]
  53. Wolkenhauer, O.; Ullah, M.; Wellstead, P.; Cho, K.H. The dynamic systems approach to control and regulation of intracellular networks. FEBS Lett. 2005, 579, 1846–1853. [Google Scholar] [CrossRef] [Green Version]
  54. Smith, S.M.; Miller, K.L.; Salimi-Khorshidi, G.; Webster, M.; Beckmann, C.F.; Nichols, T.E.; Ramsey, J.D.; Woolrich, M.W. Network modelling methods for FMRI. Neuroimage 2011, 54, 875–891. [Google Scholar] [CrossRef]
  55. Soriano, M.C.; Jordi, G.O.; Mirasso, C.R.; Fischer, I. Complex photonics: Dynamics and applications of delay-coupled semiconductors lasers. Rev. Mod. Phys. 2013, 85, 421. [Google Scholar] [CrossRef] [Green Version]
  56. Goh, T.; Ang, B.W.; Xu, X.Y. Quantifying drivers of CO2 emissions from electricity generation—Current practices and future extensions. Appl. Energy 2018, 231, 1191–1204. [Google Scholar] [CrossRef]
Figure 1. Emergy flow diagram of the transportation industry in Qinghai Province.
Sustainability 13 06804 g001
Figure 2. Causal feedback loop diagram of transportation industry.
Sustainability 13 06804 g002
Figure 3. System flow diagram of transportation industry.
Sustainability 13 06804 g003
Figure 4. A methodological framework for the SD model.
Sustainability 13 06804 g004
Figure 5. Emergy index analysis of transportation industry. (a) Emergy yield rate. (b) Environmental load rate. (c) Emergy sustainability index.
Sustainability 13 06804 g005
Figure 6. Emergy index analysis of under the change of transportation proportion. (a) Emergy yield ratio of transportation industry. (b) Environmental load ratio. (c) Emergy sustainability indices.
Sustainability 13 06804 g006
Figure 7. Emergy index analysis under the change of non-renewable resources. (a) Emergy yield ratio of transportation industry. (b) Environmental load ratio. (c) Emergy sustainability indices.
Sustainability 13 06804 g007
Figure 8. Emergy index analysis under the change of economic development speed. (a) Emergy yield ratio of transportation industry. (b) Environmental load ratio. (c) Emergy sustainability indices.
Sustainability 13 06804 g008
Figure 9. Emergy index analysis under the comprehensive impact. (a) Emergy yield ratio of transportation industry. (b) Environmental load ratio. (c) Emergy sustainability indices.
Sustainability 13 06804 g009
Table 1. A summary of the existing research on emergy.
Sustainability DimensionResearch AreaLiteratureEmergy Evaluation Index
Emergy sustainability indexA semantic study of the emergy sustainability indexArbault et al. [17]Emergy sustainability index; Emergy yield ratio; Environmental loading ratio.
Giannetti et al. [18]Emergy yield ratio (EYR); Emergy investment ratio (EIR); Subtotal ecologic–economic product (SEP); Ecosystem services product (ESP); Environmental load ratio (ELR); Environmental sustainability index (ESI) and Ecological footprint (EF).
Cai et al. [19]Emergy of comprehensive utilization; Ecological compensation criterion; Emdollar value.
Economical dimensionEconomic benefitsGiannetti et al. [12]Solar emergy flow; Emergy-based currency equivalent.
Lou et al. [20]ESI: Ratio of electricity to use; Emergy exchange ratio. EYR: Total emergy use; Emergy use per person; Emergy density; Total imported emergy.
ELR: Ratio of concentrated to rural; Fuel use per person; Total fuels use.
Environmental dimensionEcological sustainabilityTaskhiri et al. [21]Rate of total emergy use; Rate of emergy inputs; Rate of emergy use.
Merlin et al. [22]Emergy yield ratio; Environmental loading ratio; Emergy sustainability index.
Production sustainabilityOliveira et al. [23]Environmental loading ratio; Emergy yield ratio; Emergy sustainability index.
Ali et al. [24]Emergy yield ratio; Environmental loading ratio; Emergy investment ratio; Emergy sustainability index.
Social dimensionTransportationHuang et al. [14]Percentage of each modality of total emergy; UEV of transportation service; Total emergy.
Liu et al. [15]Total emergy; Emergy yield ratio; Environmental loading ratio; Emergy sustainability index.
Cristiano et al. [13]Emergy yield ratio; Environmental loading ratio; Emergy sustainability index; Total emergy; Emergy per passenger-km; Emergy per ton-km.
Human labor accountingKamp et al. [25]Environmental sustainability assessment; Extended exergy accounting; Life cycle assessment; Emergy of labor.
Table 2. A summary of the existing research for system dynamics.
Environmental DimensionLiteratureSystem Dynamics ModelMeasures
Energy consumptionVafa-Aranietal. [33]A system dynamics model for urban air pollutionTechnology improvement.
Kamal et al. [34]The combined use of system dynamics and vehicle cohort modelingTransition to new technology vehicles with clean fuels.
Hao et al. [30]Establishing a bottom-up accounting frameworkFuel consumption regulation.
Carbon emissionLiu L et al. [35]A “population-economy-land-carbon emission” modelBased on the population density.
Cao et al. [32]A system dynamics model to simulate the scenarios on CO2 emission mitigationIncrease the proportion of railway transportation.
Energy consumption and carbon emissionLiu X et al. [28]A Beijing urban passenger transport carbon modelThe effect of different policies.
Liu D et al. [26]A detailed China transportation energy modelCarbon price policies.
Table 3. References using the emergy transformity.
ItemUEVReferences
1. Renewable resources (R)
Solar energy1Odum et al. [45]
Wind energy2.45 × 103Odum et al. [45]
Rainwater chemical energy3.05 × 104Odum et al. [45]
Rainwater potential energy4.70 × 104Odum et al. [45]
Earth rotation energy5.80 × 104Odum et al. [45]
2. Non-renewable resources (N)
Coal2.88 × 109Brown et al. [46]
Gasoline9.07 × 104Odum [47]
Diesel oil1.11 × 105Odum [47]
Natural gas1.78 × 105Brown et al. [46]
3. Social and economic input (F)
Electricity5.46 × 1011Brown and Ulgiati [48]
Number of employees2.73 × 1016Ascione et al. [49]
Investment in fixed assets in transportation3.00 × 1012Odum [47]
4. Emergy of Products (Y)
Emergy output of transportation industry8.67 × 1012Odum [47]
Freight volume6.87 × 1012Lou et al. [50]
Passenger volume6.87 × 1012Lou et al. [50]
The UEV represents energy conversion rate.
Table 4. A summary of the emergy index and its meanings.
IndicatorFormulaMeaning of Indicators
Emergy yield rateEYR= Y/FIt is the ratio between the total emergy outputs (Y) and the one invested from main economy (F).
Environmental load rateELR = (F + N)/RIt confronts the emergy from the economy system and from non-renewable resources (F + N) with that coming from local renewables (R).
Emergy sustainability indexESI = EYR/ELRIt is an integrated measure of economic yield and environmental compatibility.
Table 5. Model validity test.
YearOutput Value of Transportation IndustrySimulation Rate of Deviation
20106.59 × 1096.71 × 1091.84%
20117.33 × 1097.61 × 1093.82%
20128.10 × 1098.29 × 1092.27%
20138.55 × 1098.82 × 1093.23%
20149.59 × 1099.71 × 1091.30%
20151.05 × 10101.09 × 10104.44%
20161.17 × 10101.18 × 10100.83%
20171.34 × 10101.35 × 10100.72%
Table 6. Emergy elements of transportation industry in Qinghai Province.
ItemSolar Emergy
20102011201220132014201520162017
1. Renewable resources (R)4.19 × 10284.19 × 10284.19 × 10284.19 × 10284.19 × 10284.19 × 10284.19 × 10284.19 × 1028
Solar energy5.27 × 10175.27 × 10175.27 × 10175.27 × 10175.27 × 10175.27 × 10175.27 × 10175.27 × 1017
Wind energy3.49 × 10243.49 × 10243.49 × 10243.49 × 10243.49 × 10243.49 × 10243.49 × 10243.49 × 1024
Rainwater chemical energy4.39 × 10224.34 × 10224.88 × 10223.80 × 10224.81 × 10223.35 × 10224.77 × 10224.25 × 1022
Rainwater potential energy5.37 × 10235.30 × 10235.96 × 10234.65 × 10235.88 × 10234.10 × 10235.84 × 10235.20 × 1023
Earth rotation energy4.19 × 10284.19 × 10284.19 × 10284.19 × 10284.19 × 10284.19 × 10284.19 × 10284.19 × 1028
2. Non-renewable resources (N)3.70 × 10143.83 × 10143.61 × 10143.08 × 10142.43 × 10142.61 × 10142.30 × 10141.86 × 1014
Coal3.60 × 10143.67 × 10143.44 × 10142.83 × 10142.25 × 10142.26 × 10141.92 × 10141.43 × 1014
Gasoline7.57 × 1097.17 × 1095.77 × 1095.55 × 1097.01 × 1096.94 × 1097.84 × 1099.80 × 109
Diesel oil6.03 × 10106.42 × 10106.74 × 10106.98 × 10107.90 × 10108.10 × 10109.55 × 10101.08 × 1011
Natural gas1.07 × 10131.58 × 10131.66 × 10132.47 × 10131.73 × 10133.42 × 10133.77 × 10134.38 × 1013
3. Social and economic input (F)3.87 × 10223.64 × 10223.22 × 10224.36 × 10225.01 × 10225.62 × 10221.01 × 10231.38 × 1023
Electricity9.72 × 10191.76 × 10202.92 × 10202.91 × 10203.13 × 10203.40 × 10203.70 × 10204.37 × 1020
Number of employees6.09 × 10206.81 × 10208.09 × 10201.16 × 10219.85 × 10201.06 × 10211.06 × 10211.16 × 1021
Investment in fixed assets in transportation3.80 × 10223.55 × 10223.11 × 10224.21 × 10224.88 × 10225.48 × 10229.98 × 10221.36 × 1023
4. Emergy of Products (Y)5.87 × 10226.52 × 10227.20 × 10227.60 × 10228.45 × 10229.21 × 10221.03 × 10231.18 × 1023
Emergy output of transportation industry5.71 × 10226.36 × 10227.02 × 10227.41 × 10228.31 × 10229.06 × 10221.02 × 10231.16 × 1023
Freight volume7.73 × 10208.65 × 10209.26 × 10209.93 × 10201.01 × 10211.02 × 10211.16 × 10211.23 × 1021
Passenger volume7.56 × 10208.20 × 10208.78 × 10209.49 × 10203.84 × 10204.33 × 10204.38 × 10204.69 × 1020
Table 7. Specific scenario analysis.
Scenario Analysis The Change of Transportation RatioThe Change of Non-Renewable Resource UsageAdjust the Speed of Economic DevelopmentThe Combined Effect of the Above Three Aspects
Scenario 1The road ratio is 70%. The railway ratio is 25%.The original scenario ABS (0.06 + 0.3 × Emergy sustainability indices)The original scenario
Scenario 2The road ratio is reduced by 10%, and the railway ratio is increased by 10%Reduce non-renewable resource usage by 10%Economic development speed increased by 10%The road ratio and non-renewable resources is reduced by 10%, the railway ratio is increased by 10%, and the speed of economic development increases by 5%.
Scenario 3The road ratio is reduced by 20%, and the railway ratio is increased by 20%Reduce non-renewable resource usage by 20%Economic development speed increased by 20%The road ratio and non-renewable resources is reduced by 20%, the railway ratio is increased by 20%, and the speed of economic development increases by 10%.
Publisher’s Note: MDPI stays neutral with regard to jurisdictional claims in published maps and institutional affiliations.

