
Verona Adapt. Modelling as a Planning Instrument: Applying a Climate-Responsive Approach in Verona, Italy

 , , , and
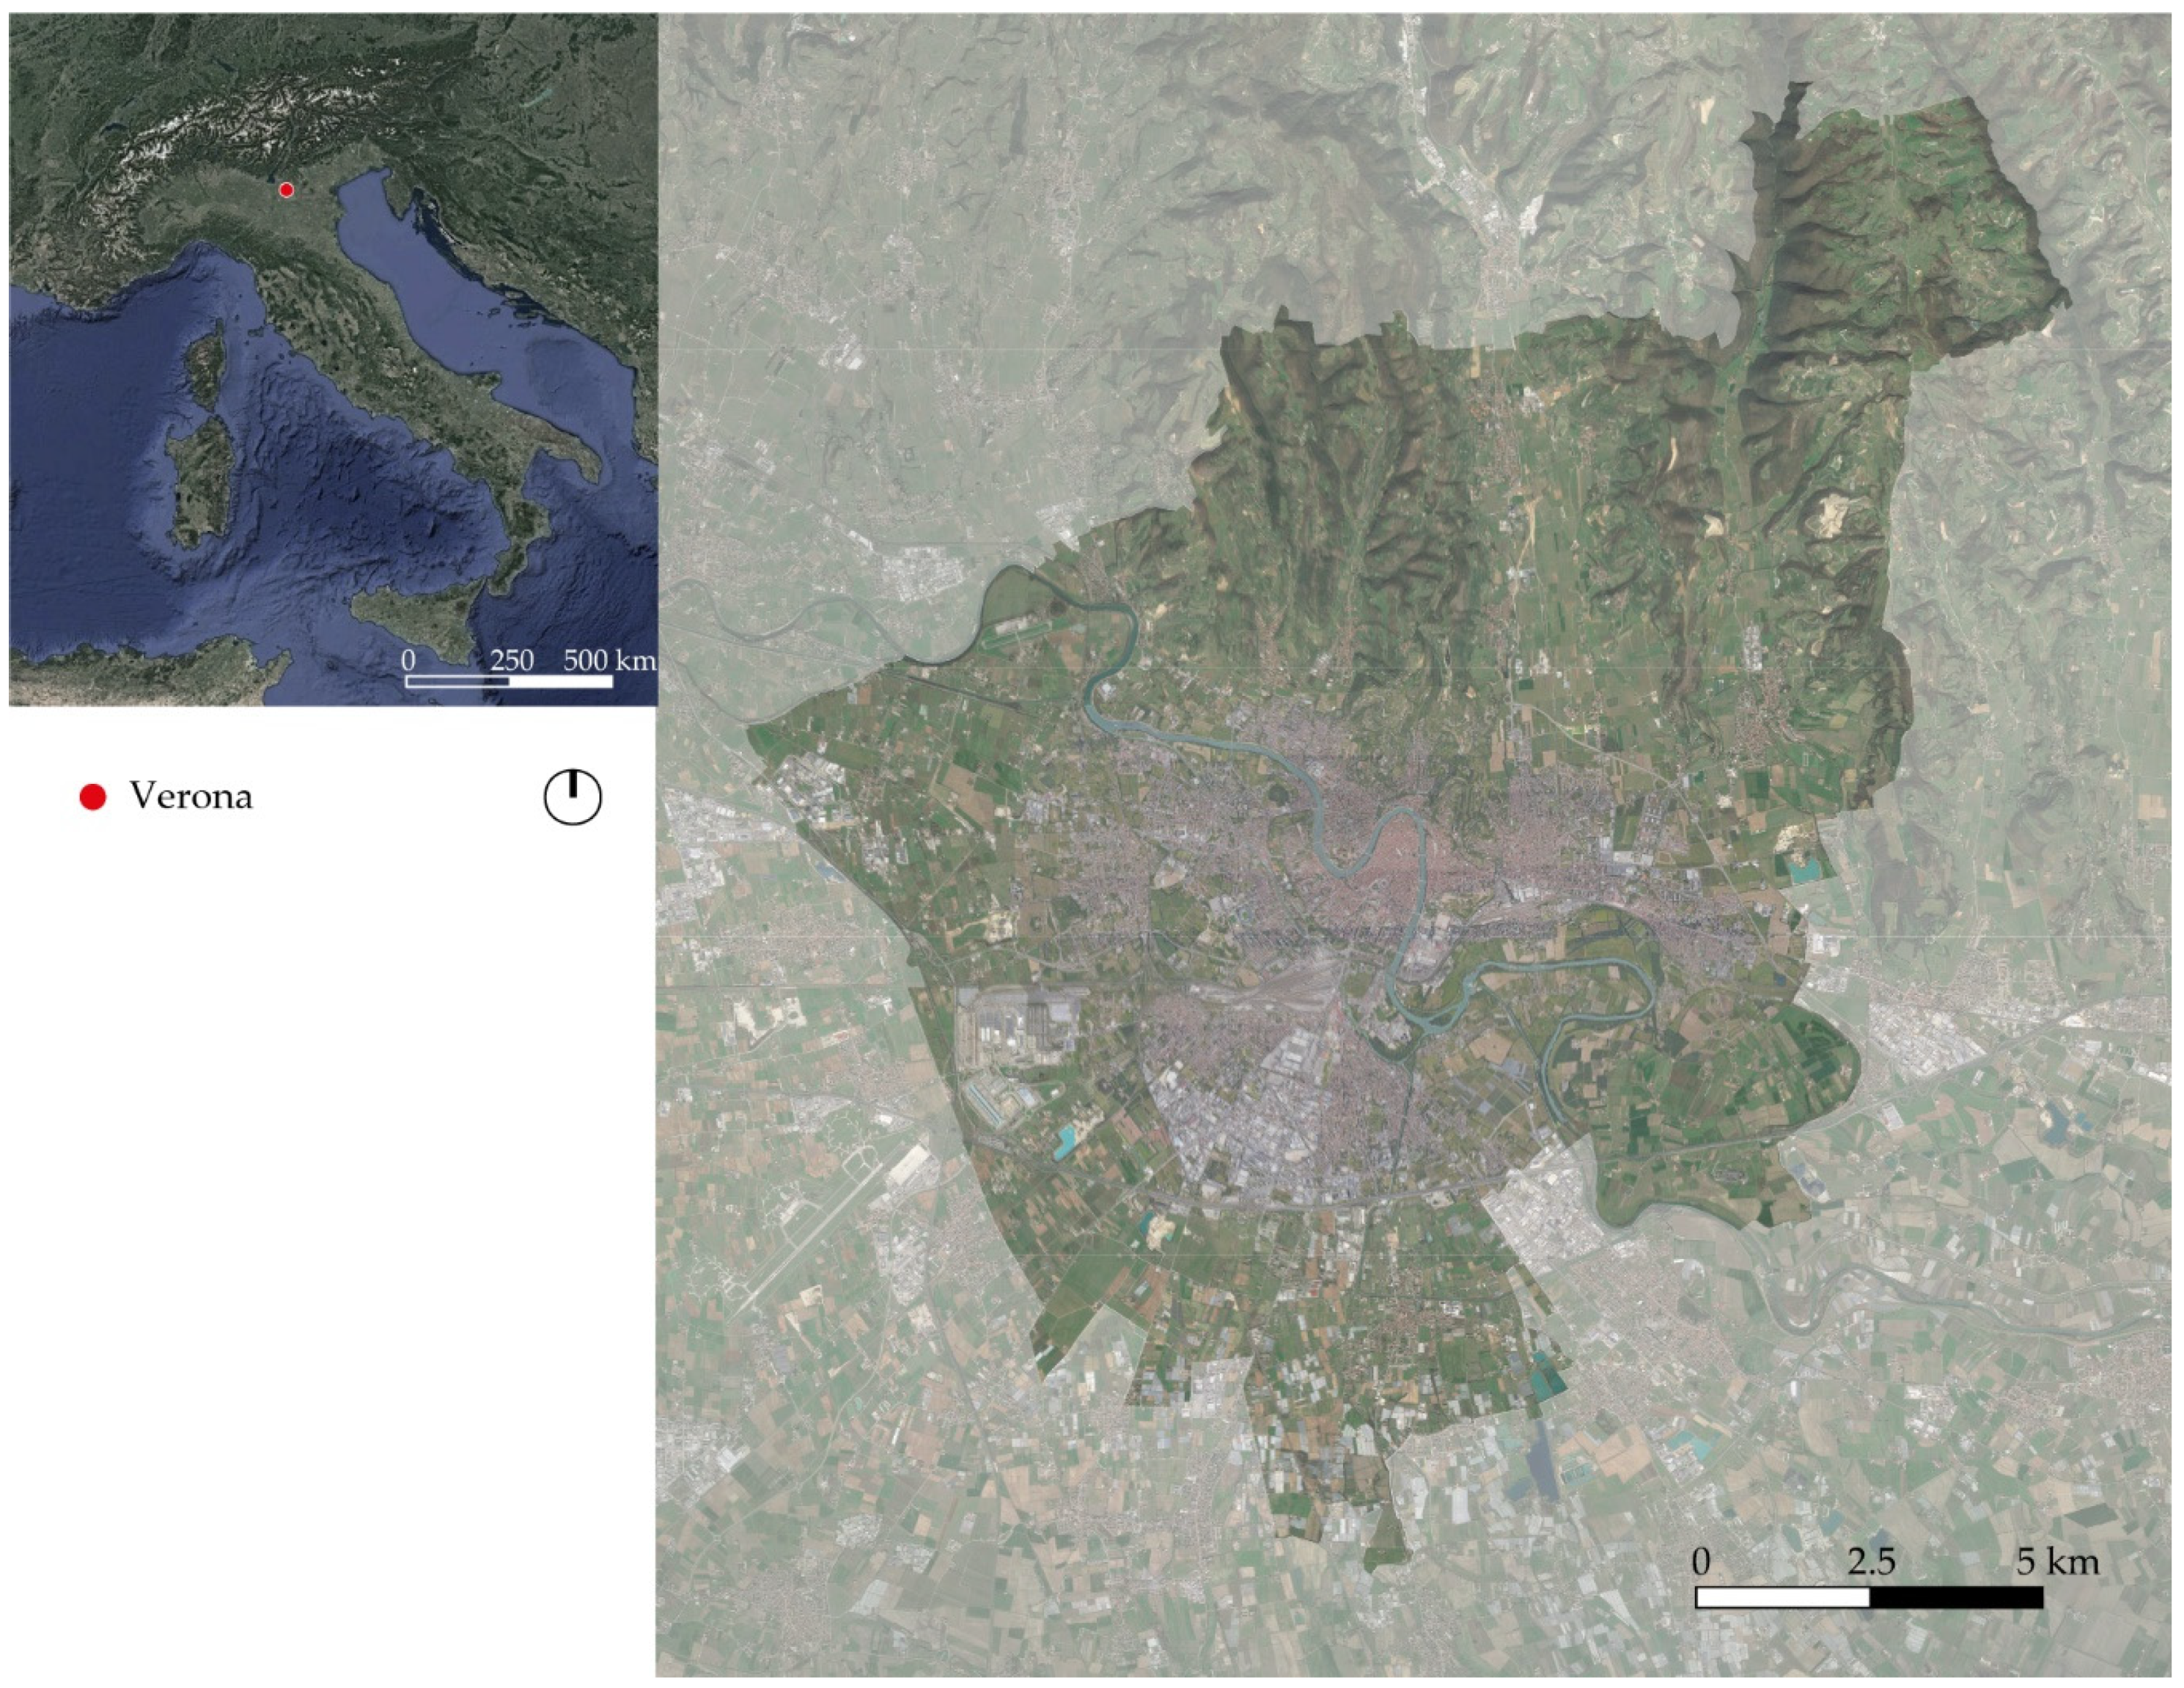
Abstract
:1. Introduction
2. Blue and Green Infrastructure as Climate Adaptation Strategy
3. A Climate-Responsive Approach: Case, Methods, and Materials
3.1. Verona as a Case Study
3.2. An Approach across Scales Linking Climate Modelling and Open Space Planning
3.3. City Scale Assessment
3.4. District Scale Assessment
3.5. Design Phases
4. Results
4.1. City Scale Assessment—Investigating the UHI Effect in Verona through WUDAPT Classification, WRF Model, and Vulnerability Maps
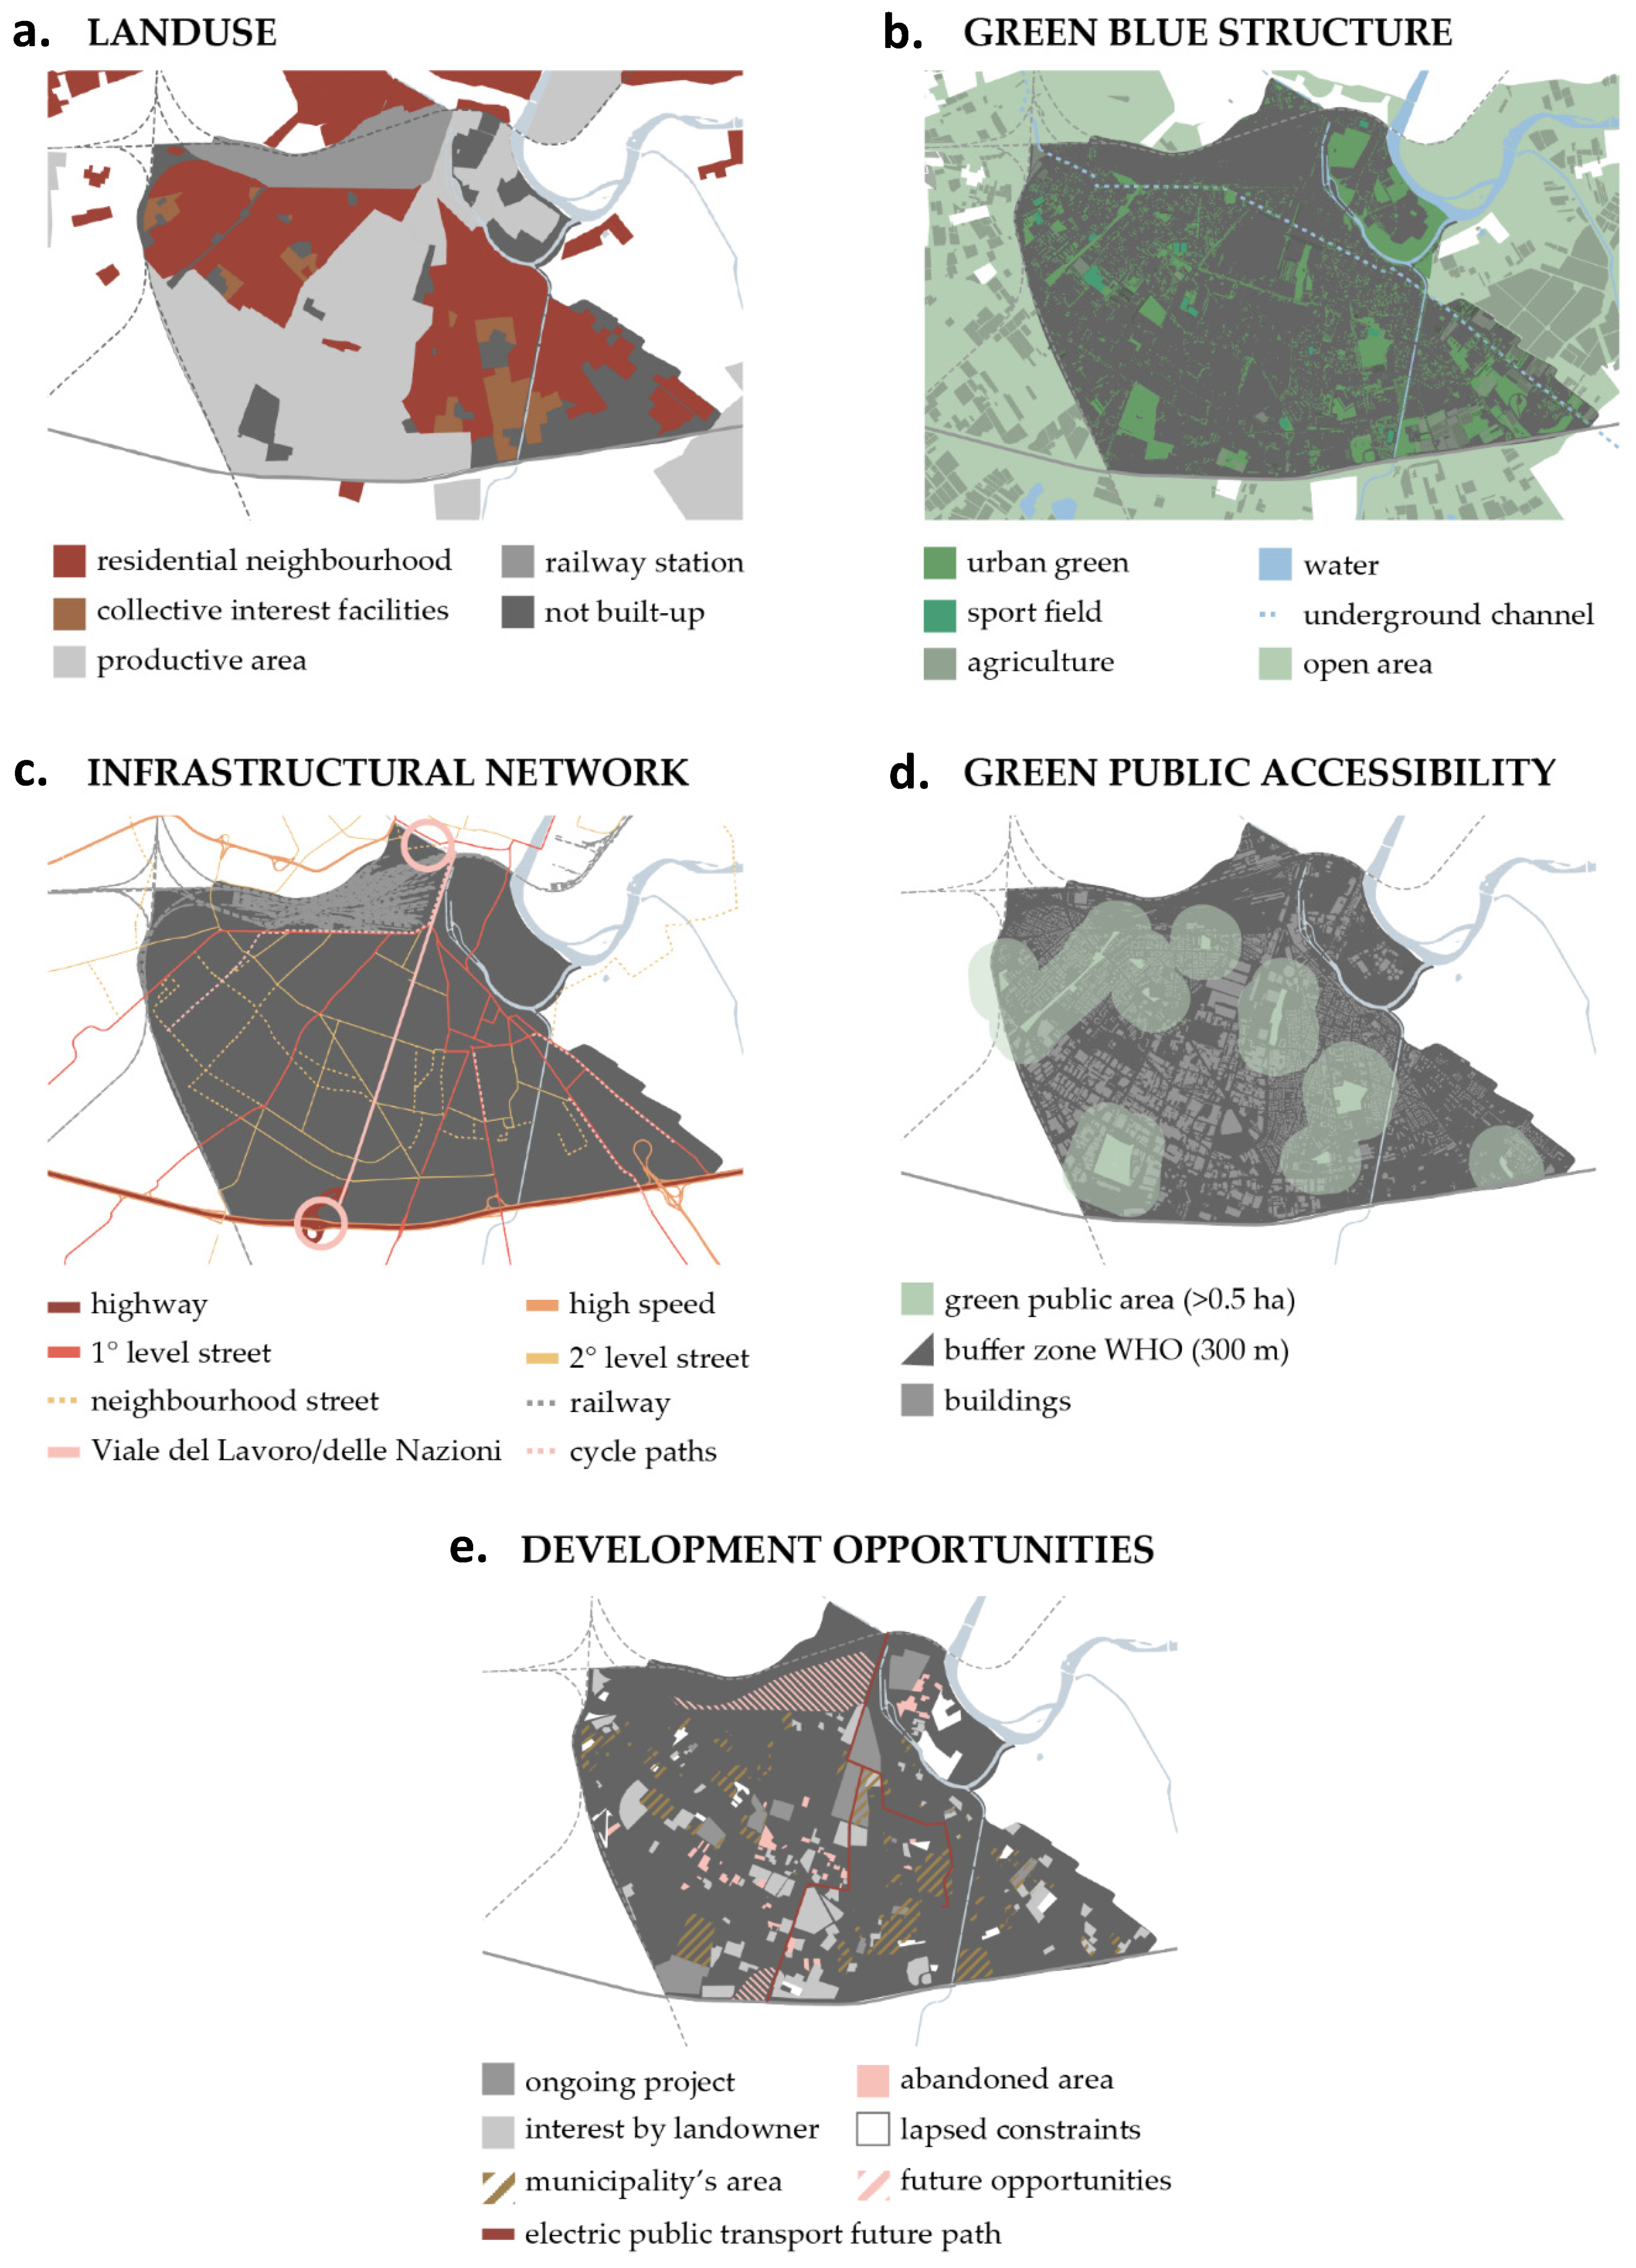
4.2. The Urban and Climate Assessment of Verona South
4.3. The Climate Adaptation Proposal for Verona South
4.3.1. A Program for Wind, Green, and Grey
4.3.2. The New Master Plan
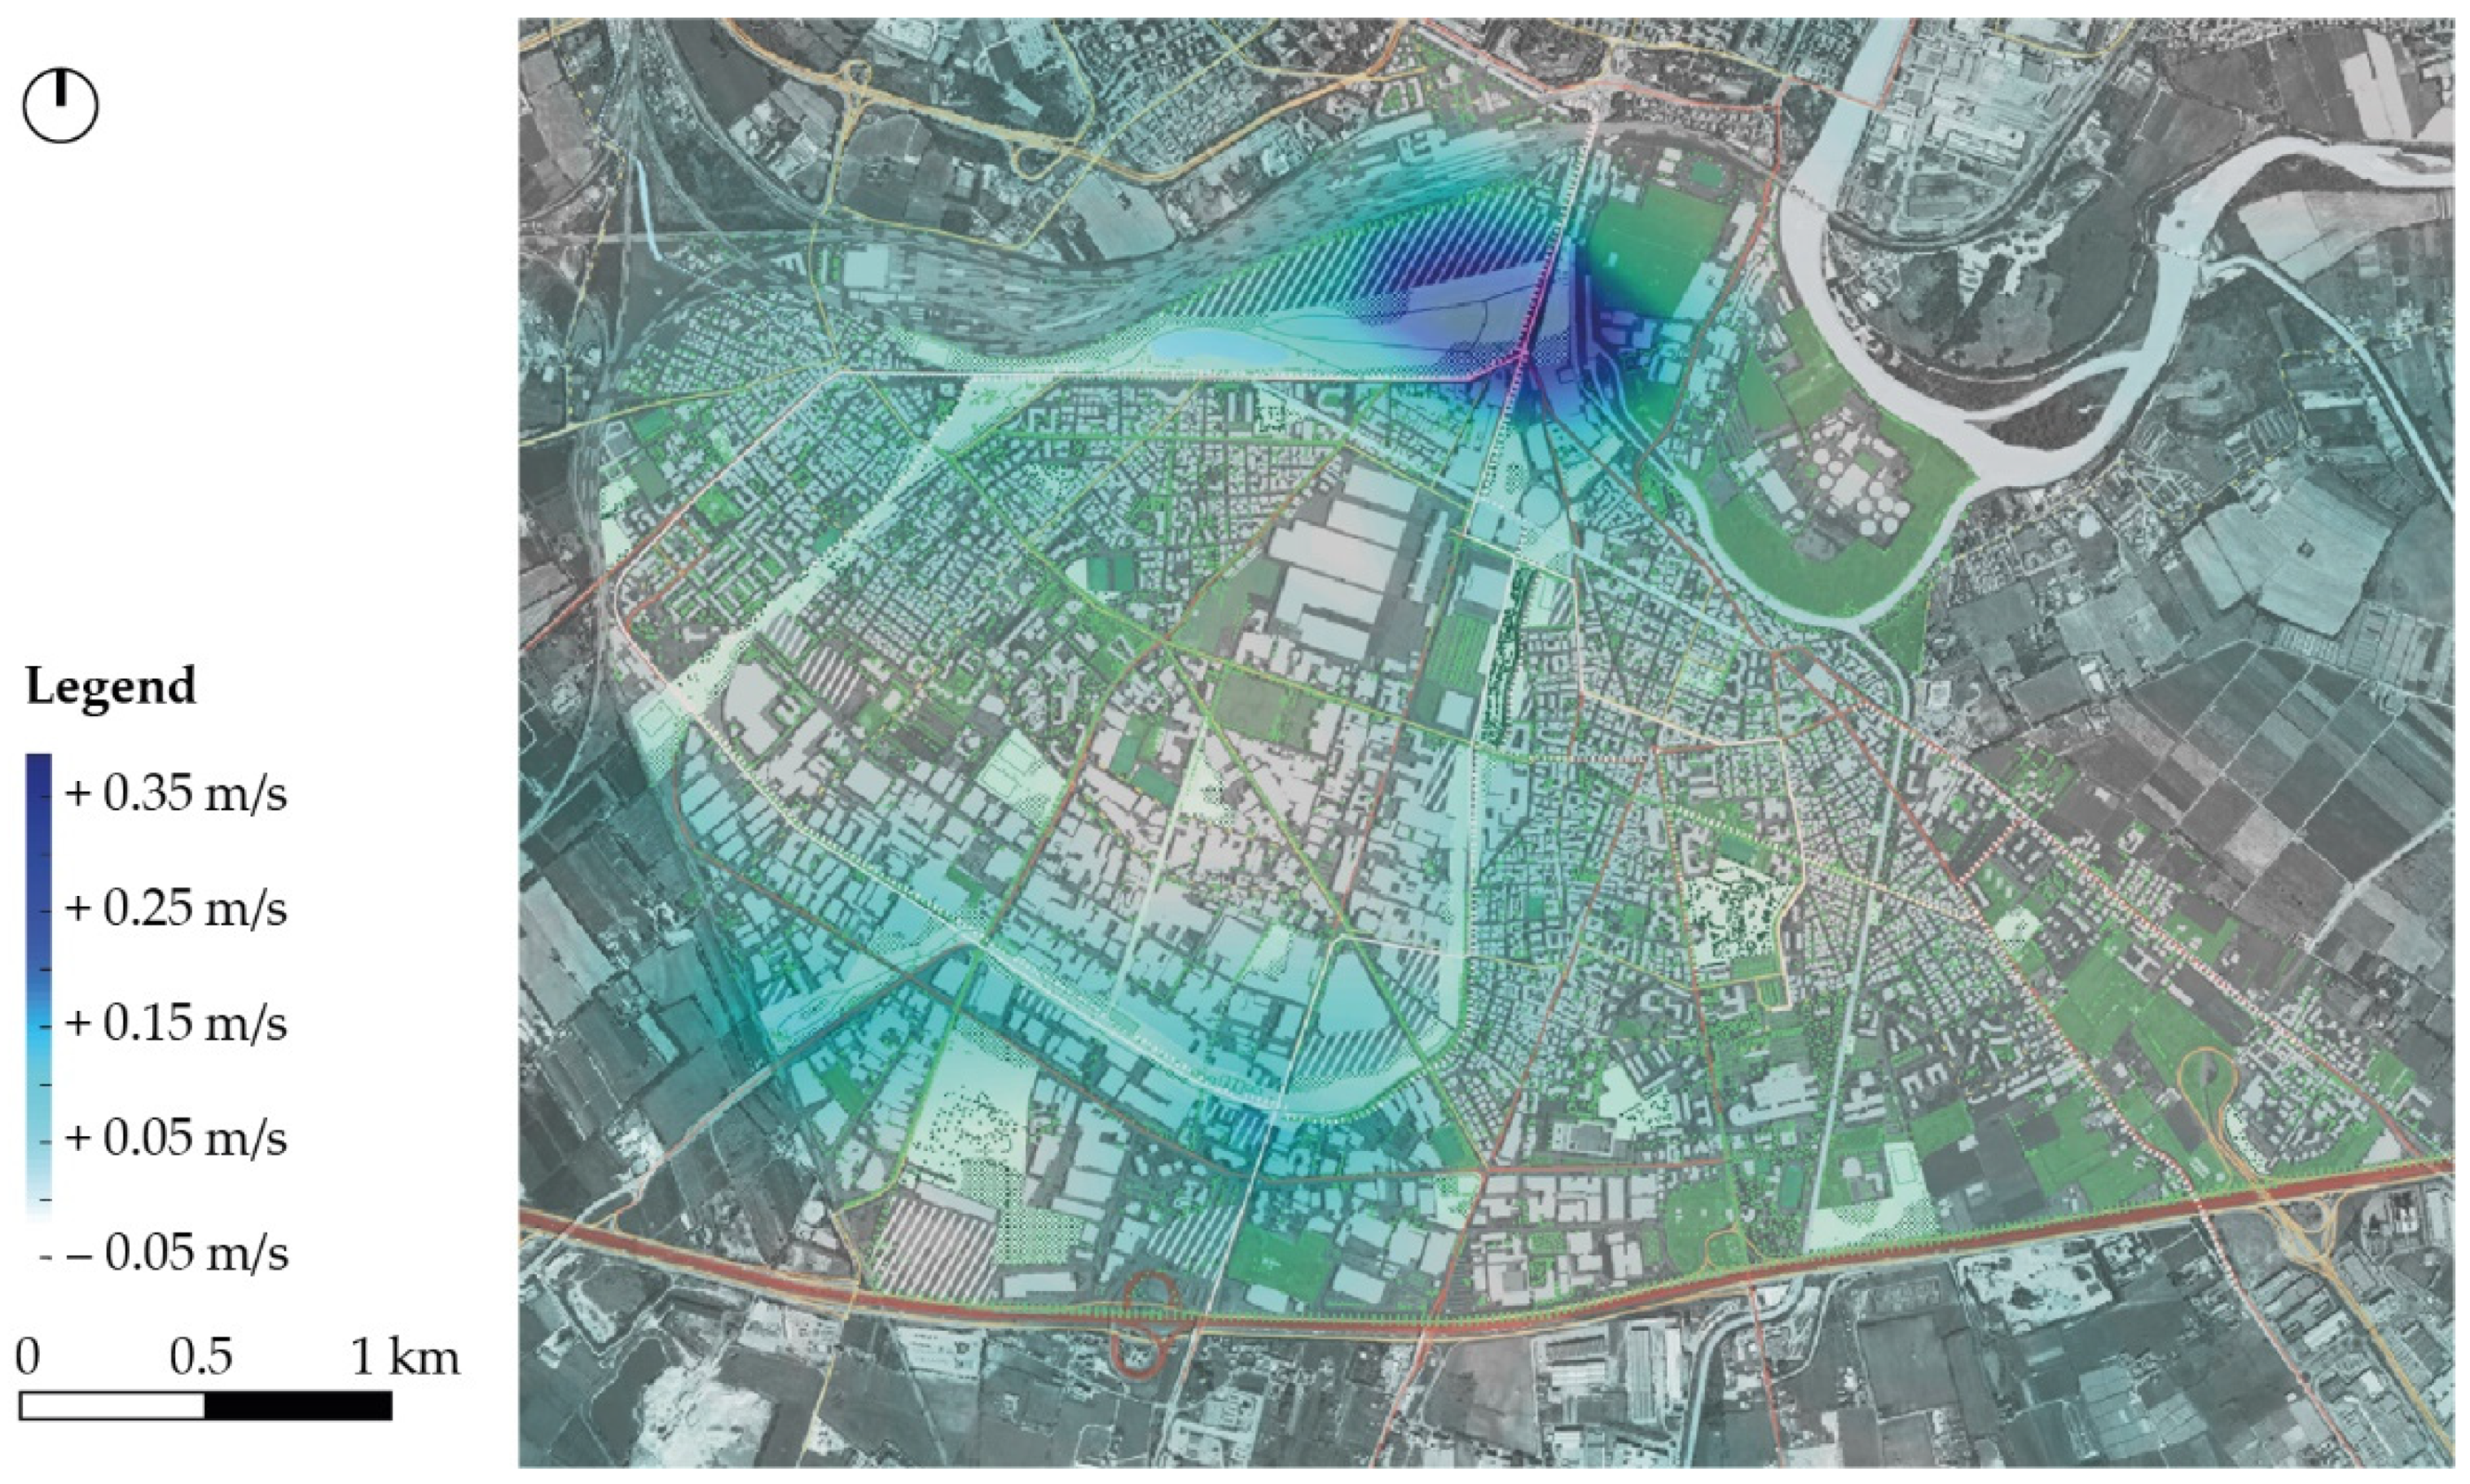
4.3.3. Simulating the Final Scenario
5. Discussion and Future Development
Author Contributions
Funding
Institutional Review Board Statement
Informed Consent Statement
Data Availability Statement
Acknowledgments
Conflicts of Interest
Appendix A

References
- Frantzeskaki, N.; McPhearson, T.; Collier, M.J.; Kendal, D.; Bulkeley, H.; Dumitru, A.; Walsh, C.; Noble, K.; Van Wyk, E.; Ordóñez, C.; et al. Nature-Based Solutions for Urban Climate Change Adaptation: Linking Science, Policy, and Practice Communities for Evidence-Based Decision-Making. Bioscience 2019, 69, 455–466. [Google Scholar] [CrossRef]
- European Commission A European Green Deal. Available online: https://ec.europa.eu/info/strategy/priorities-2019-2024/european-green-deal_en (accessed on 26 February 2021).
- Codemo, A.; Favargiotti, S.; Albatici, R. Fostering the climate-energy transition with an integrated approach. Synergies and interrelations between adaptation and mitigation strategies. J. Land Use Mobil. Environ. 2021, 14, 5–20. [Google Scholar] [CrossRef]
- Wamsler, C.; Pauleit, S.; Zölch, T.; Schetke, S.; Mascarenhas, A. Mainstreaming nature-based solutions for climate change adaptation in urban governance and planning. In Nature-Based Solutions to Climate Change Adaptation in Urban Area; Kabisch, N., Bonn, A., Korn, H., Stadler, J., Eds.; Springer: Cham, Switzerland, 2017; pp. 257–273. [Google Scholar]
- Favargiotti, S. Re-Cool Trento. Designing blue and green flows for a hot city. In Activating Public Space. An Approach for Climate Change Mitigation; Battisti, A., Santucci, D., Eds.; Technische Universität München, Fakultät für Architektur: Germany, München, 2020; pp. 129–140. ISBN 978-3-948278-08-3. Available online: https://www.researchgate.net/publication/340887342_ACTIVATING_PUBLIC_SPACE_-_An_Approach_for_Climate_Change_Mitigation (accessed on 29 March 2021).
- Cortekar, J.; Bender, S.; Brune, M.; Groth, M. Why climate change adaptation in cities needs customised and flexible climate services. Clim. Serv. 2016, 4, 42–51. [Google Scholar] [CrossRef] [Green Version]
- Oke, T.R. Boundary Layer Climates, 2nd ed.; Taylor & Francis, Ed.; Routledge Publishing: London, UK, 2002; ISBN 0-203-40721-0. [Google Scholar]
- United Nations, Department of Economic and Social Affairs Population Dynamics. World Urbanization Prospects: The 2018 Revision. Available online: https://population.un.org/wup/Download/ (accessed on 19 February 2021).
- Castellari, S.; Venturini, S.; Giordano, F.; Ballarin Denti, A.; Bigano, A.; Bindi, M.; Bosello, F.; Carrera, L.; Chiriacò, M.V.; Danovaro, R.; et al. Elementi per una Strategia Nazionale di Adattamento ai Cambiamenti Climatici; Rome, Italy, 2014; Available online: https://www.researchgate.net/publication/280924663_Elementi_per_una_Strategia_Nazionale_di_Adattamento_ai_Cambiamenti_Climatici (accessed on 20 February 2021).
- Legambiente Le Città Alla Sfida del Clima. 2017. Available online: https://cittaclima.it/2017/06/19/dossier-le-citta-alla-sfida-del-clima/ (accessed on 29 March 2021).
- Sharma, R.; Hooyberghs, H.; Lauwaet, D.; De Ridder, K. Urban Heat Island and Future Climate Change—Implications for Delhi’s Heat. J. Urban Health 2019, 96, 235–251. [Google Scholar] [CrossRef] [PubMed]
- European Commission EU Adaptation Strategy. Available online: https://ec.europa.eu/clima/policies/adaptation/what_en (accessed on 8 December 2020).
- Klemm, W.; Lenzholzer, S.; van den Brink, A. Developing green infrastructure design guidelines for urban climate adaptation. J. Landsc. Archit. 2017, 12, 60–71. [Google Scholar] [CrossRef]
- City of Copenhagen. Copenhagen Climate Adaptation Plan; Metropolen, M., Ed.; Copenhagen, Denmark, 2011; Available online: https://en.klimatilpasning.dk/media/568851/copenhagen_adaption_plan.pdf (accessed on 20 February 2021).
- Nikologianni, A.; Betta, A.; Pianegonda, A.; Favargiotti, S.; Moore, K.; Grayson, N.; Morganti, E.; Berg, M.; Ternell, A.; Ciolli, M.; et al. New Integrated Approaches to Climate Emergency Landscape Strategies: The Case of Pan-European SATURN Project. Sustainability 2020, 12, 8419. [Google Scholar] [CrossRef]
- Cohen-Schacham, E.; Walters, G.; Janzen, C.; Maginnis, S. (Eds.) Nature based Solutions to Address Global Societal Challenges; IUCN Commission on Ecosystem Management (CEM) and IUCN World Commission on Protected Areas (WCPA): Gland, Switzerland, 2016; Available online: https://serval.unil.ch/resource/serval:BIB_93FD38C8836B.P001/REF (accessed on 7 June 2021).
- EEA. Urban Adaptation to Climate Change in Europe. Transforming Cities in a Changing Climate; Luxembourg, 2016; Available online: https://www.eea.europa.eu/publications/urban-adaptation-2016 (accessed on 26 February 2021).
- European Commission Towards an EU Research and Innovation Policy Agenda for Nature-Based Solutions and Re-Naturing Cities. Final Report of the Horizon 2020 Expert Group on ’Nature-Based Solutions and Re-Naturing Cities; European Union: Luxembourg, 2015; Available online: https://op.europa.eu/de/publication-detail/-/publication/fb117980-d5aa-46df-8edc-af367cddc202 (accessed on 27 January 2018).
- BlueAp Bologna Local Urban Environment Adaptation Plan for a Resilient City. Available online: http://www.blueap.eu/site/ (accessed on 20 February 2021).
- Nardino, M.; Cremonini, L.; Georgiadis, T.; Mandanici, E.; Bitelli, G. Microclimate classification of Bologna (Italy) as a support tool for urban services and regeneration. Int. J. Environ. Res. Public Health 2021, 18, 4898. [Google Scholar] [CrossRef] [PubMed]
- Gordon, A.; Simondson, D.; White, M.; Moilanen, A.; Bekessy, S.A. Integrating conservation planning and land use planning in urban landscapes. Landsc. Urban Plan. 2009, 91, 183–194. [Google Scholar] [CrossRef]
- Brown, R.D.; Gillespie, T.J. Microclimatic Landscape Design. Creating Thermal Comfort and Energy Efficiency; John Wiley & Sons: New York, NY, USA, 1995. [Google Scholar]
- Lenzhölzer, S. Designing Atmospheres: Research and Design for Thermal Comfort in Dutch Urban Squares. Ph.D. Dissertation, Wageningen University, Wageningen, NL, USA, 2010. [Google Scholar]
- Balany, F.; Ng, A.W.; Muttil, N.; Muthukumaran, S.; Wong, M.S. Green Infrastructure as an Urban Heat Island Mitigation Strategy—A Review. Water 2020, 12, 3577. [Google Scholar] [CrossRef]
- Zölch, T.; Maderspacher, J.; Wamsler, C.; Pauleit, S. Using green infrastructure for urban climate-proofing: An evaluation of heat mitigation measures at the micro-scale. Urban For. Urban Green. 2016, 20, 305–306. [Google Scholar] [CrossRef]
- Bochenek, A.D.; Klemm, K. The Impact of Passive Green Technologies on the Microclimate of Historic Urban Structures: The Case Study of Lodz. Atmosphere 2020, 11, 974. [Google Scholar] [CrossRef]
- Herath, H.M.P.I.K.; Halwatura, R.U.; Jayasinghe, G.Y. Evaluation of green infrastructure effects on tropical Sri Lankan urban context as an urban heat island adaptation strategy. Urban For. Urban Green. 2018, 29, 212–222. [Google Scholar] [CrossRef]
- Lin, B.-S.; Lin, C.-T. Preliminary study of the influence of the spatial arrangement of urban parks on local temperature reduction. Urban For. Urban Green. 2016, 20, 348–357. [Google Scholar] [CrossRef]
- De Wit, R.; Kainz, A.; Goler, R.; Žuvela-Aloise, M.; Hahn, C.; Zuccaro, G.; Leone, M.; Loibl, W.; Tötzer, T.; Hager, W.; et al. Supporting climate proof planning with CLARITY’s climate service and modelling of climate adaptation strategies—The Linz use-case. Urban Clim. 2020, 34, 100675. [Google Scholar] [CrossRef]
- Yin, R.K. Case Study Research: Design and Methods, 4th ed.; SAGE: Thousands Oaks, CA, USA; Available online: https://journals.nipissingu.ca/index.php/cjar/article/view/73 (accessed on 28 March 2021).
- Kabisch, N.; Frantzeskaki, N.; Pauleit, S.; Naumann, S.; Davis, M.; Artmann, M.; Haase, D.; Knapp, S.; Korn, H.; Stadler, J.; et al. Nature-based solutions to climate change mitigation and adaptation in urban areas: Perspectives on indicators, knowledge gaps, barriers, and opportunities for action. Ecol. Soc. 2016, 21, 39. [Google Scholar] [CrossRef] [Green Version]
- Eggermont, H.; Balian, E.; Azevedo, J.M.N.; Beumer, V.; Brodin, T.; Claudet, J.; Fady, B.; Grube, M.; Keune, H.; Lamarque, P.; et al. Nature-based Solutions: New Influence for Environmental Management and Research in Europe. GAIA-Ecol. Perspect. Sci. Soc. 2015, 24, 243–248. [Google Scholar] [CrossRef]
- Maes, J.; Jacobs, S. Nature-Based Solutions for Europe’s Sustainable Development. Conserv. Lett. 2017, 10, 121–124. [Google Scholar] [CrossRef] [Green Version]
- Pauleit, S.; Zölch, T.; Hansen, R.; Randrup, T.B.; Konijnendijk van den Bosch, C. Nature-Based Solutions and climate change—Four shades of green. In Nature-Based Solutions to Climate Change Adaptation in Urban Areas; Kabisch, N., Bonn, A., Korn, H., Stadler, J., Eds.; Springer: Cham, Switzerland, 2017; pp. 29–49. [Google Scholar]
- Andreucci, M.B. Progettare Green Infrastructure; Wolters Kluwer: Vicenza, Italy, 2017. [Google Scholar]
- EEA. What Is Green Infrastructure? Available online: https://www.eea.europa.eu/themes/sustainability-transitions/urban-environment/urban-green-infrastructure/what-is-green-infrastructure (accessed on 15 November 2020).
- Benedict, M.A.; McMahon, E.T. The green infrastructure approach: Principles from past to present. In Green Infrastructure: Linking Landscapes and Communities; Benedict, M.A., McMahon, E.T., Eds.; Island Press: Washington, DC, USA, 2006; pp. 23–55. Available online: https://www.researchgate.net/publication/40777458_Green_Infrastructure_Linking_Landscapes_and_Communities (accessed on 29 March 2021).
- Hansen, R.; Rall, E.; Chapman, E.; Rolf, W.; Pauleit, S. (Eds.) Urban Green Infrastructure Planning: A Guide for Practitioners: GREEN SURGE; GREEN SURGE: Freising, Munich, Germany, 2017; Available online: https://www.e-pages.dk/ku/1340/html5/ (accessed on 7 June 2021).
- Tzoulas, K.; Korpela, K.; Venn, S.; Yli-Pelkonen, V.; Kazmiercazak, A.; Niemela, J.; Philip, J. Promoting Ecosystem and Human Health in Urban Areas using Green Infrastructure: A Literature review. Landsc. Urban Plan. 2007, 81, 167–178. [Google Scholar] [CrossRef] [Green Version]
- Dessì, V.; Farnè, E.; Ravanello, L.; Salomoni, M.T. Rigenerare la Città con la Natura. Strumenti per la Progettazione Degli Spazi Pubblici tra Mitigazione e Adattamento ai Cambiamenti Climatici; Maggioli Editore: Santarcangelo di Romagna, Italy, 2016. [Google Scholar]
- Bowen, K.J.; Lynch, Y. The public health benefits of green infrastructure: The potential of economic framing for enhanced decision-making. Curr. Opin. Environ. Sustain. 2017, 25, 90–95. [Google Scholar] [CrossRef]
- Ward Thompson, C.; Aspinall, P.; Roe, J.; Robertson, L.; Miller, D. Mitigating Stress and Supporting Health in Deprived Urban Communities: The Importance of Green Space and the Social Environment. Int. J. Environ. Res. Public Health 2016, 13, 440. [Google Scholar] [CrossRef]
- Stuttgart State Capital. Climate Change—Challenge Facing Urban Climatology; Stuttgart, Germany, 2010. Available online: https://www.stadtklima-stuttgart.de/index.php?klima_klimawandel_heft-3-2010 (accessed on 28 September 2020).
- Rovers, V.; Bosch, P.; Albers, R.; Hove, B.; Blocken, B.; Dobbelsteen, A.; Spit, T.J.M.; Dikmans, M.; Boonstra, B.; Brolsma, R.J.; et al. Climate Proof Cities—Final Report 2010–2014; Climate Proof Cities Consortium; The Netherlands, 2014; Available online: https://edepot.wur.nl/351021 (accessed on 15 November 2020).
- Snep, R. Biodiversity Conservation at Business Sites: Options and Opportunities. Ph.D. Thesis, Wageningen University, Wageningen, The Netherlands, 2009. [Google Scholar]
- Stefani, B. Verde sul tetto. Riv. Bioarchit. 2009, 9, 34–47.
- Comune di Verona Statistica. Available online: https://statistica.comune.verona.it/nqcontent.cfm?a_id=50739&tt=statistica_agid (accessed on 26 November 2020).
- CLIMATE-DATA.ORG. Available online: https://it.climate-data.org/europa/italia/veneto/verona-1123/ (accessed on 4 November 2020).
- Cossio, F.; Cunego, G.; Daprà, F.; Franzini, G.; Frontero, P.; Malesani, P.; Mansoldo, C.; Marcello, A.; Piazzi, O.; Pozzerle, C.; et al. Inquadramento geografico, socio-economico e climatico. In Primo Rapporto Sullo Stato Dell’ambiente; Provincia di Verona, Ed.; 2002; pp. 3.1–3.20. Available online: https://portale.provincia.vr.it/uffici/uffici/6/documenti/informazioni-comunicazioni-ambientali/rapporto-sullo-stato-dellambiente/1b0-rapporto-sullo-stato-dellambiente/3025 (accessed on 20 February 2021).
- EEA. Urban Adaptation Map Viewer. Available online: https://eea.maps.arcgis.com/apps/MapSeries/index.html?appid=ec9a942228894562bd53310e3c3bc211#) (accessed on 4 November 2020).
- EEA. Heating and Cooling Degree Days. Available online: https://www.eea.europa.eu/data-and-maps/indicators/heating-degree-days-2/assessment (accessed on 5 January 2021).
- Roggema, R. Research by Design: Proposition for a Methodological Approach. Urban Sci. 2016, 1. [Google Scholar] [CrossRef]
- Stewart, I.D.; Oke, T.R. Local climate zones for urban temperature studies. Bull. Am. Meteorol. Soc. 2012, 93, 1879–1900. [Google Scholar] [CrossRef]
- Brousse, O.; Martilli, A.; Foley, M.; Mills, G.; Bechtel, B. WUDAPT, an efficient land use producing data tool for mesoscale models? Integration of urban LCZ in WRF over Madrid. Urban Clim. 2016, 17, 116–134. [Google Scholar] [CrossRef]
- Zonato, A.; Martilli, A.; Di Sabatino, S.; Zardi, D.; Giovannini, L. Evaluating the performance of a novel WUDAPT averaging technique to define urban morphology with mesoscale models. Urban Clim. 2020, 31, 100584. [Google Scholar] [CrossRef]
- Skamarock, W.C.; Klemp, J.B.; Dudhia, J.; Gill, D.O.; Barker, D.M.; Duda, M.G.; Huang, X.; Wang, W.; Powers, J.G. A Description of the Advanced Research WRF Version 3 (No. NCAR/TN-475+STR); University Corporation for Atmospheric Research: Boulder, CO, USA, 2008; Available online: https://opensky.ucar.edu/islandora/object/technotes:500 (accessed on 29 March 2021). [CrossRef]
- Chen, F.; Kusaka, H.; Bornstein, R.; Ching, J.; Grimmond, C.S.B.; Grossman-Clarke, S.; Loridan, T.; Manning, K.W.; Martilli, A.; Miao, S.; et al. The integrated WRF/urban modelling system: Development, evaluation, and applications to urban environmental problems. Int. J. Climatol. 2011, 31, 273–288. [Google Scholar] [CrossRef]
- Pappaccogli, G.; Giovannini, L.; Cappelletti, F.; Zardi, D. Challenges in the application of a WRF/Urban TRNSYS model chain for estimating the cooling demand of buildings: A case study in Bolzano (Italy). Sci. Technol. Built Environ. 2018, 24, 529–544. [Google Scholar] [CrossRef]
- Martilli, A.; Clappier, A.; Rotach, M.W. An Urban Surface Exchange Parametrization for Mesoscale Models. Bound.-Layer Meteorol. 2002, 104, 261–304. [Google Scholar] [CrossRef]
- Salamanca, F.; Krpo, A.; Martilli, A.; Clappier, A. A new building energy model coupled with an urban canopy parameterization for urban climate simulations-part I. formulation, verification, and sensitivity analysis of the model. Theor. Appl. Climatol. 2010, 99, 331–344. [Google Scholar] [CrossRef]
- Comune di Verona Relazioni Sull’attuazione Della Legislazione. Available online: https://www.comune.verona.it/nqcontent.cfm?a_id=42858&tt=verona_ (accessed on 5 January 2021).
- Lenzholzer, S.; van Lierop, M.; van Seumeren, R. Urban Climate in Tiel; Landscape Architecture, Wageningen UR Publishing: Wageningen, The Netherlands, 2013. [Google Scholar]
- Comune di Verona Sistema Informativo Geografico Integrato. Available online: https://mapserver4.comune.verona.it/siti/default.aspx (accessed on 17 January 2021).
- WHO Regional Office for Europe. Urban Green Spaces and Health; Copenhagen, Denmark, 2016; Available online: https://www.euro.who.int/en/health-topics/environment-and-health/urban-health/publications/2016/urban-green-spaces-and-health-a-review-of-evidence-2016 (accessed on 15 November 2020).
- Comune di Verona; Federico Oliva Associati. Masterplan per il Piano degli Interventi Verona Sud ATO 4; Comune di Verona; 2011; Available online: http://mapserver5.comune.verona.it/UFFI_SIT/PIAP_CONSULTAZIONE/VR_SUD_MASTERPLAN_febbraio_2012.pdf (accessed on 17 November 2020).
- Comune di Verona Pianificazione e Progettazione Urbanisitica. Available online: https://www.comune.verona.it/nqcontent.cfm?a_id=780&tt=verona_agid (accessed on 25 February 2021).
- AMT Opera Filovia Verona. Available online: https://www.amt.it/progetti/filovia/ (accessed on 21 June 2019).
- Zardi, D.; Whiteman, C.D. Diurnal mountain wind systems. In Mountain Weather Research and Forecasting: Recent Progress and Current Challenges; Chow, F., De Wekker, S., Snyder, B., Eds.; Springer: Dordrecht, NL, USA, 2013; pp. 35–119. [Google Scholar]
- Wicht, M.; Wicht, A.; Osińska-Skotak, K. Detection of ventilation corridors using a spatio-temporal approach aided by remote sensing data. Eur. J. Remote Sens. 2017, 50, 254–267. [Google Scholar] [CrossRef] [Green Version]
- Jessel, B.; Tobias, K. Ökologisch orientierte Planung: Eine Einführung in Theorien, Daten und Methoden; Eugen Ulmer Publishing: Stuttgart, Germany, 2002. [Google Scholar]
- Klemm, W. Clever and Cool: Generating Design Guidelines for Climate-Responsive Urban Green Infrastructure. Ph.D. Thesis, Wageningen University, Wageningen, NL, USA, 2018. [Google Scholar]
- De Roo, M.; Kuypers, V.H.M.; Lenzholzer, S. The Green City Guidelines: Techniques for a Healthy Liveable City; Urban and Regional Development Landscape Architecture ALTERRA Wageningen UR: Wageningen, The Netherlands, 2011. [Google Scholar]
- Zonato, A.; Martilli, A.; Di Sabatino, S.; Giovannini, L.; Zardi, D.; Pappaccogli, G. Comparing the Impact of Different Rooftop Technologies in Urban Heat Island Mitigation and on Energy Consumption during a Heat Wave Period. In Proceedings of the 10th International Conference on Urban Climate/14th Symposium on the Urban Environment, New York, NY, USA, 6–10 August 2018. [Google Scholar]
- Ascenso, A.; Augusto, B.; Silveira, C.; Rafael, S.; Coelho, S.; Monteiro, A.; Ferreira, J.; Menezes, I.; Roebeling, P.; Miranda, A.I. Impacts of nature-based solutions on the urban atmospheric environment: A case study for Eindhoven, The Netherlands. Urban For. Urban Green. 2021, 57, 126870. [Google Scholar] [CrossRef]
- Santamouris, M.; Ding, L.; Fiorito, F.; Oldfield, P.; Osmond, P.; Paolini, R.; Prasad, D.; Synnefa, A. Passive and active cooling for the outdoor built environment—Analysis and assessment of the cooling potential of mitigation technologies using performance data from 220 large scale projects. Sol. Energy 2017, 154, 14–33. [Google Scholar] [CrossRef]
- Zölch, T.; Henze, L.; Keilholz, P.; Pauleit, S. Regulating urban surface runoff through nature-based solutions—An assessment at the micro-scale. Environ. Res. 2017, 157, 135–144. [Google Scholar] [CrossRef] [PubMed]
- Norton, B.A.; Coutts, A.M.; Livesley, S.J.; Harris, R.J.; Hunter, A.M.; Williams, N.S.G. Planning for cooler cities: A framework to prioritise green infrastructure to mitigate high temperatures in urban landscapes. Landsc. Urban Plan. 2015, 134, 127–138. [Google Scholar] [CrossRef]
- Borrallo-Jiménez, M.; LopezdeAsiain, M.; Herrera-Limones, R.; Arcos, M.L. Towards a circular economy for the city of seville: The method for developing a guide for a more sustainable architecture and urbanism (GAUS). Sustainability 2020, 12, 7421. [Google Scholar] [CrossRef]
- Wamsler, C.; Wickenberg, B.; Hanson, H.; Alkan Olsson, J.; Stålhammar, S.; Björn, H.; Falck, H.; Gerell, D.; Oskarsson, T.; Simonsson, E.; et al. Environmental and climate policy integration: Targeted strategies for overcoming barriers to nature-based solutions and climate change adaptation. J. Clean. Prod. 2020, 247, 119154. [Google Scholar] [CrossRef]
- Hansen, R.; Rall, E.; Rolf, W.; Pauleit, S.; Erlwein, S.; Fohlmeister, S.; Santos, A.; Luz, A.C.; Szaraz, L.; Branquinho, C.; Santos-Reis, M.; et al. Advanced Urban Green Infrastructure Planning and Implementation. Innovative Approaches and Strategies from European Cities. 2016. Available online: https://www.researchgate.net/publication/299604360_Advanced_Urban_Green_Infrastructure_Planning_and_Implementation_-_Innovative_Approaches_and_Strategies_from_European_Cities (accessed on 18 December 2017).
- Raymond, C.M.; Frantzeskaki, N.; Kabisch, N.; Berry, P.; Breil, M.; Nita, M.R.; Geneletti, D.; Calfapietra, C. A framework for assessing and implementing the co-benefits of nature-based solutions in urban areas. Environ. Sci. Policy 2017, 77, 15–24. [Google Scholar] [CrossRef]
- Connop, S.; Vandergert, P.; Eisenberg, B.; Collier, M.J.; Nash, C.; Clough, J.; Newport, D. Renaturing cities using a regionally-focused biodiversity-led multifunctional benefits approach to urban green infrastructure. Environ. Sci. Policy 2016, 62, 99–111. [Google Scholar] [CrossRef] [Green Version]
- Pinho, P.; Correia, O.; Lecoq, M.; Munzi, S.; Vasconcelos, S.; Gonçalves, P.; Rebelo, R.; Antunes, C.; Silva, P.; Freitas, C.; et al. Evaluating green infrastructure in urban environments using a multi-taxa and functional diversity approach. Environ. Res. 2016, 147, 601–610. [Google Scholar] [CrossRef]
- Carter, J.G.; Cavan, G.; Connelly, A.; Guy, S.; Handley, J.; Kazmierczak, A. Climate change and the city: Building capacity for urban adaptation. Prog. Plann. 2015, 95, 1–66. [Google Scholar] [CrossRef]
- Bolund, P.; Hunhammar, S. Ecosystem services in urban areas. Ecol. Econ. 1999, 29, 293–301. [Google Scholar] [CrossRef]
- Haase, D.; Kabisch, S.; Haase, A.; Andersson, E.; Banzhaf, E.; Baró, F.; Brenck, M.; Fischer, L.K.; Frantzeskaki, N.; Kabisch, N.; et al. Greening cities—To be socially inclusive? About the alleged paradox of society and ecology in cities. Habitat Int. 2017, 64, 41–48. [Google Scholar] [CrossRef]
- Runhaar, H.; Wilk, B.; Persson, Å.; Uittenbroek, C.; Wamsler, C. Mainstreaming climate adaptation: Taking stock about “what works” from empirical research worldwide. Reg. Environ. Chang. 2018, 18, 1201–1210. [Google Scholar] [CrossRef] [Green Version]
- Uittenbroek, C.J.; Janssen-Jansen, L.B.; Runhaar, H.A.C. Mainstreaming climate adaptation into urban planning: Overcoming barriers, seizing opportunities and evaluating the results in two Dutch case studies. Reg. Environ. Chang. 2013, 13, 399–411. [Google Scholar] [CrossRef]
- Berkowitz, M. What a Chief Resilience Officer Does. Available online: https://www.rockefellerfoundation.org/blog/what-a-chief-resilience-officer-does/ (accessed on 15 September 2020).
- Cai, M.; Ren, C.; Xu, Y.; Lau, K.K.-L.; Wang, R. Investigating the relationship between local climate zone and land surface temperature using an improved WUDAPT methodology—A case study of Yangtze River Delta, China. Urban Clim. 2018, 24, 485–502. [Google Scholar] [CrossRef]
- Lenzholzer, S.; Brown, R.D. Climate-responsive landscape architecture design education. J. Clean. Prod. 2013, 61, 89–99. [Google Scholar] [CrossRef]
- Cheval, S.; Micu, D.; Dumitrescu, A.; Irimescu, A.; Frighenciu, M.; Iojă, C.; Tudose, N.C.; Davidescu, Ș.; Antonescu, B. Meteorological and Ancillary Data Resources for Climate Research in Urban Areas. Climate 2020, 8, 37. [Google Scholar] [CrossRef] [Green Version]


Publisher’s Note: MDPI stays neutral with regard to jurisdictional claims in published maps and institutional affiliations. |
© 2021 by the authors. Licensee MDPI, Basel, Switzerland. This article is an open access article distributed under the terms and conditions of the Creative Commons Attribution (CC BY) license (https://creativecommons.org/licenses/by/4.0/).
Share and Cite
Tomasi, M.; Favargiotti, S.; van Lierop, M.; Giovannini, L.; Zonato, A. Verona Adapt. Modelling as a Planning Instrument: Applying a Climate-Responsive Approach in Verona, Italy. Sustainability 2021, 13, 6851. https://0-doi-org.brum.beds.ac.uk/10.3390/su13126851
Tomasi M, Favargiotti S, van Lierop M, Giovannini L, Zonato A. Verona Adapt. Modelling as a Planning Instrument: Applying a Climate-Responsive Approach in Verona, Italy. Sustainability. 2021; 13(12):6851. https://0-doi-org.brum.beds.ac.uk/10.3390/su13126851
Chicago/Turabian StyleTomasi, Marika, Sara Favargiotti, Martina van Lierop, Lorenzo Giovannini, and Andrea Zonato. 2021. "Verona Adapt. Modelling as a Planning Instrument: Applying a Climate-Responsive Approach in Verona, Italy" Sustainability 13, no. 12: 6851. https://0-doi-org.brum.beds.ac.uk/10.3390/su13126851