
How Do International Conflicts Impact China’s Energy Security and Economic Growth? A Case Study of the US Economic Sanctions on Iran


1
School of Economics and Resource Management, Beijing Normal University, Beijing 100875, China
2
Beijing Key Lab of Study on Sci-Tech Strategy for Urban Green Development, Beijing Normal University, Beijing 100875, China
*
Author to whom correspondence should be addressed.
Sustainability 2021, 13(12), 6903; https://0-doi-org.brum.beds.ac.uk/10.3390/su13126903
Submission received: 23 May 2021
/
Revised: 11 June 2021
/
Accepted: 16 June 2021
/
Published: 18 June 2021
(This article belongs to the Special Issue Energy Economy Aspect of Sustainability)
Abstract
:International conflicts cause global energy price fluctuations and supply disruptions, which can threaten energy security and economic growth in energy-importing countries, including China. However, the implications and impact mechanisms of international conflicts on the energy security and economy of oil-importing countries have been poorly explored. Using US economic sanctions on Iran as a case, a global energy-extended computable general equilibrium model, GTAP-E, is employed to assess the impacts of international conflicts on China’s energy production, trade and supply, sectoral outputs, and economic growth. The results indicate that the USA–Iran tension would threaten China’s energy security, mainly due to the instability of the energy supply and the consequent upsurge of energy prices. However, if increased oil exports from other Persian Gulf countries compensate for the global oil supply shortages, China’s energy supply would be generally assured. Moreover, because of the close energy cooperation links between Iran and China, the sanctions could decrease the Chinese outputs of non-energy sectors and economic growth. Nevertheless, compared with sole-sanction situations, the results from a possible USA–Iran tension escalation, going as far as Iran’s closure of the Hormuz Strait, could pose a more serious risk to China’s energy security and economic growth.
1. Introduction
Energy security in energy-importing countries is being increasingly threatened by international conflicts. Over recent decades, international conflicts among different countries—such as the Persian Gulf War, the Ukraine crisis, the Iran–Iraq war, and the Color Revolutions (e.g., the Rose Revolution in Georgia, the Orange Revolution in Ukraine, and the Tulip Revolution in Kyrgyzstan)—have mainly focused on economic sanctions by influencing energy prices and supply, and controlling energy transport channels [1,2,3,4,5,6]. For example, the Ukraine crisis began with Russia’s annexation of Crimea, a Ukrainian territory [7,8]. Subsequently, the European Union (EU) imposed economic sanctions on Russia, which significantly impacted Russia’s energy security. Russia, as a key source of energy imports for Ukraine, then interrupted gas imports into Ukraine, which also threatened Ukrainian energy security [9,10]. Complex international conflicts have also been seen emerging in Iran—a global-scale oil and gas producer—which pose serious threats to the energy security of major energy-importing countries, such as China [11,12]. Economic sanctions have become one of the most common trademarks of international conflict in Iran, which consequently affect the global energy market [13,14].
Iran has been constantly under the shadow of economic sanctions from the US since the 1970s [15,16], which have seriously damaged its economic growth [17,18]. In 2010, the US approved another round of sanctions against Iran, which imposed a heavy cost on the Iranian economy [19]. Since 2011, strict economic sanctions have been imposed on Iran’s economy by the US, the EU and other countries in an attempt to prohibit Iran’s government from continuing the development of its nuclear weapons program [20]. The persistently updated sanctions are targeted at Iran’s oil exports, which are a significant source of revenues for Iran’s governments. After imposing a new round of sanctions on Iran in 2016 and 2017, the US announced its withdrawal from the Joint Comprehensive Plan of Action and banned its oil exports in 2018 [21,22,23], aiming to prohibit Iran’s development of nuclear weapons [24,25]. This led other Persian Gulf countries, who own the largest amount of spare oil production capacity [26], to increase production and exports in order to address the gap in the global oil supply [5,27,28,29]. In an escalation situation, in order to resist the US sanctions, Iran could harass—or even disrupt—oil transportation through the Hormuz Strait, as it did during the Iran–Iraq War [30,31]. The original economic sanctions and Iran’s potential counter-sanctions could combine to reduce the energy supply from Iran and other Persian Gulf countries sharply, causing serious fluctuations to the oil supply and prices in global energy markets [32,33].
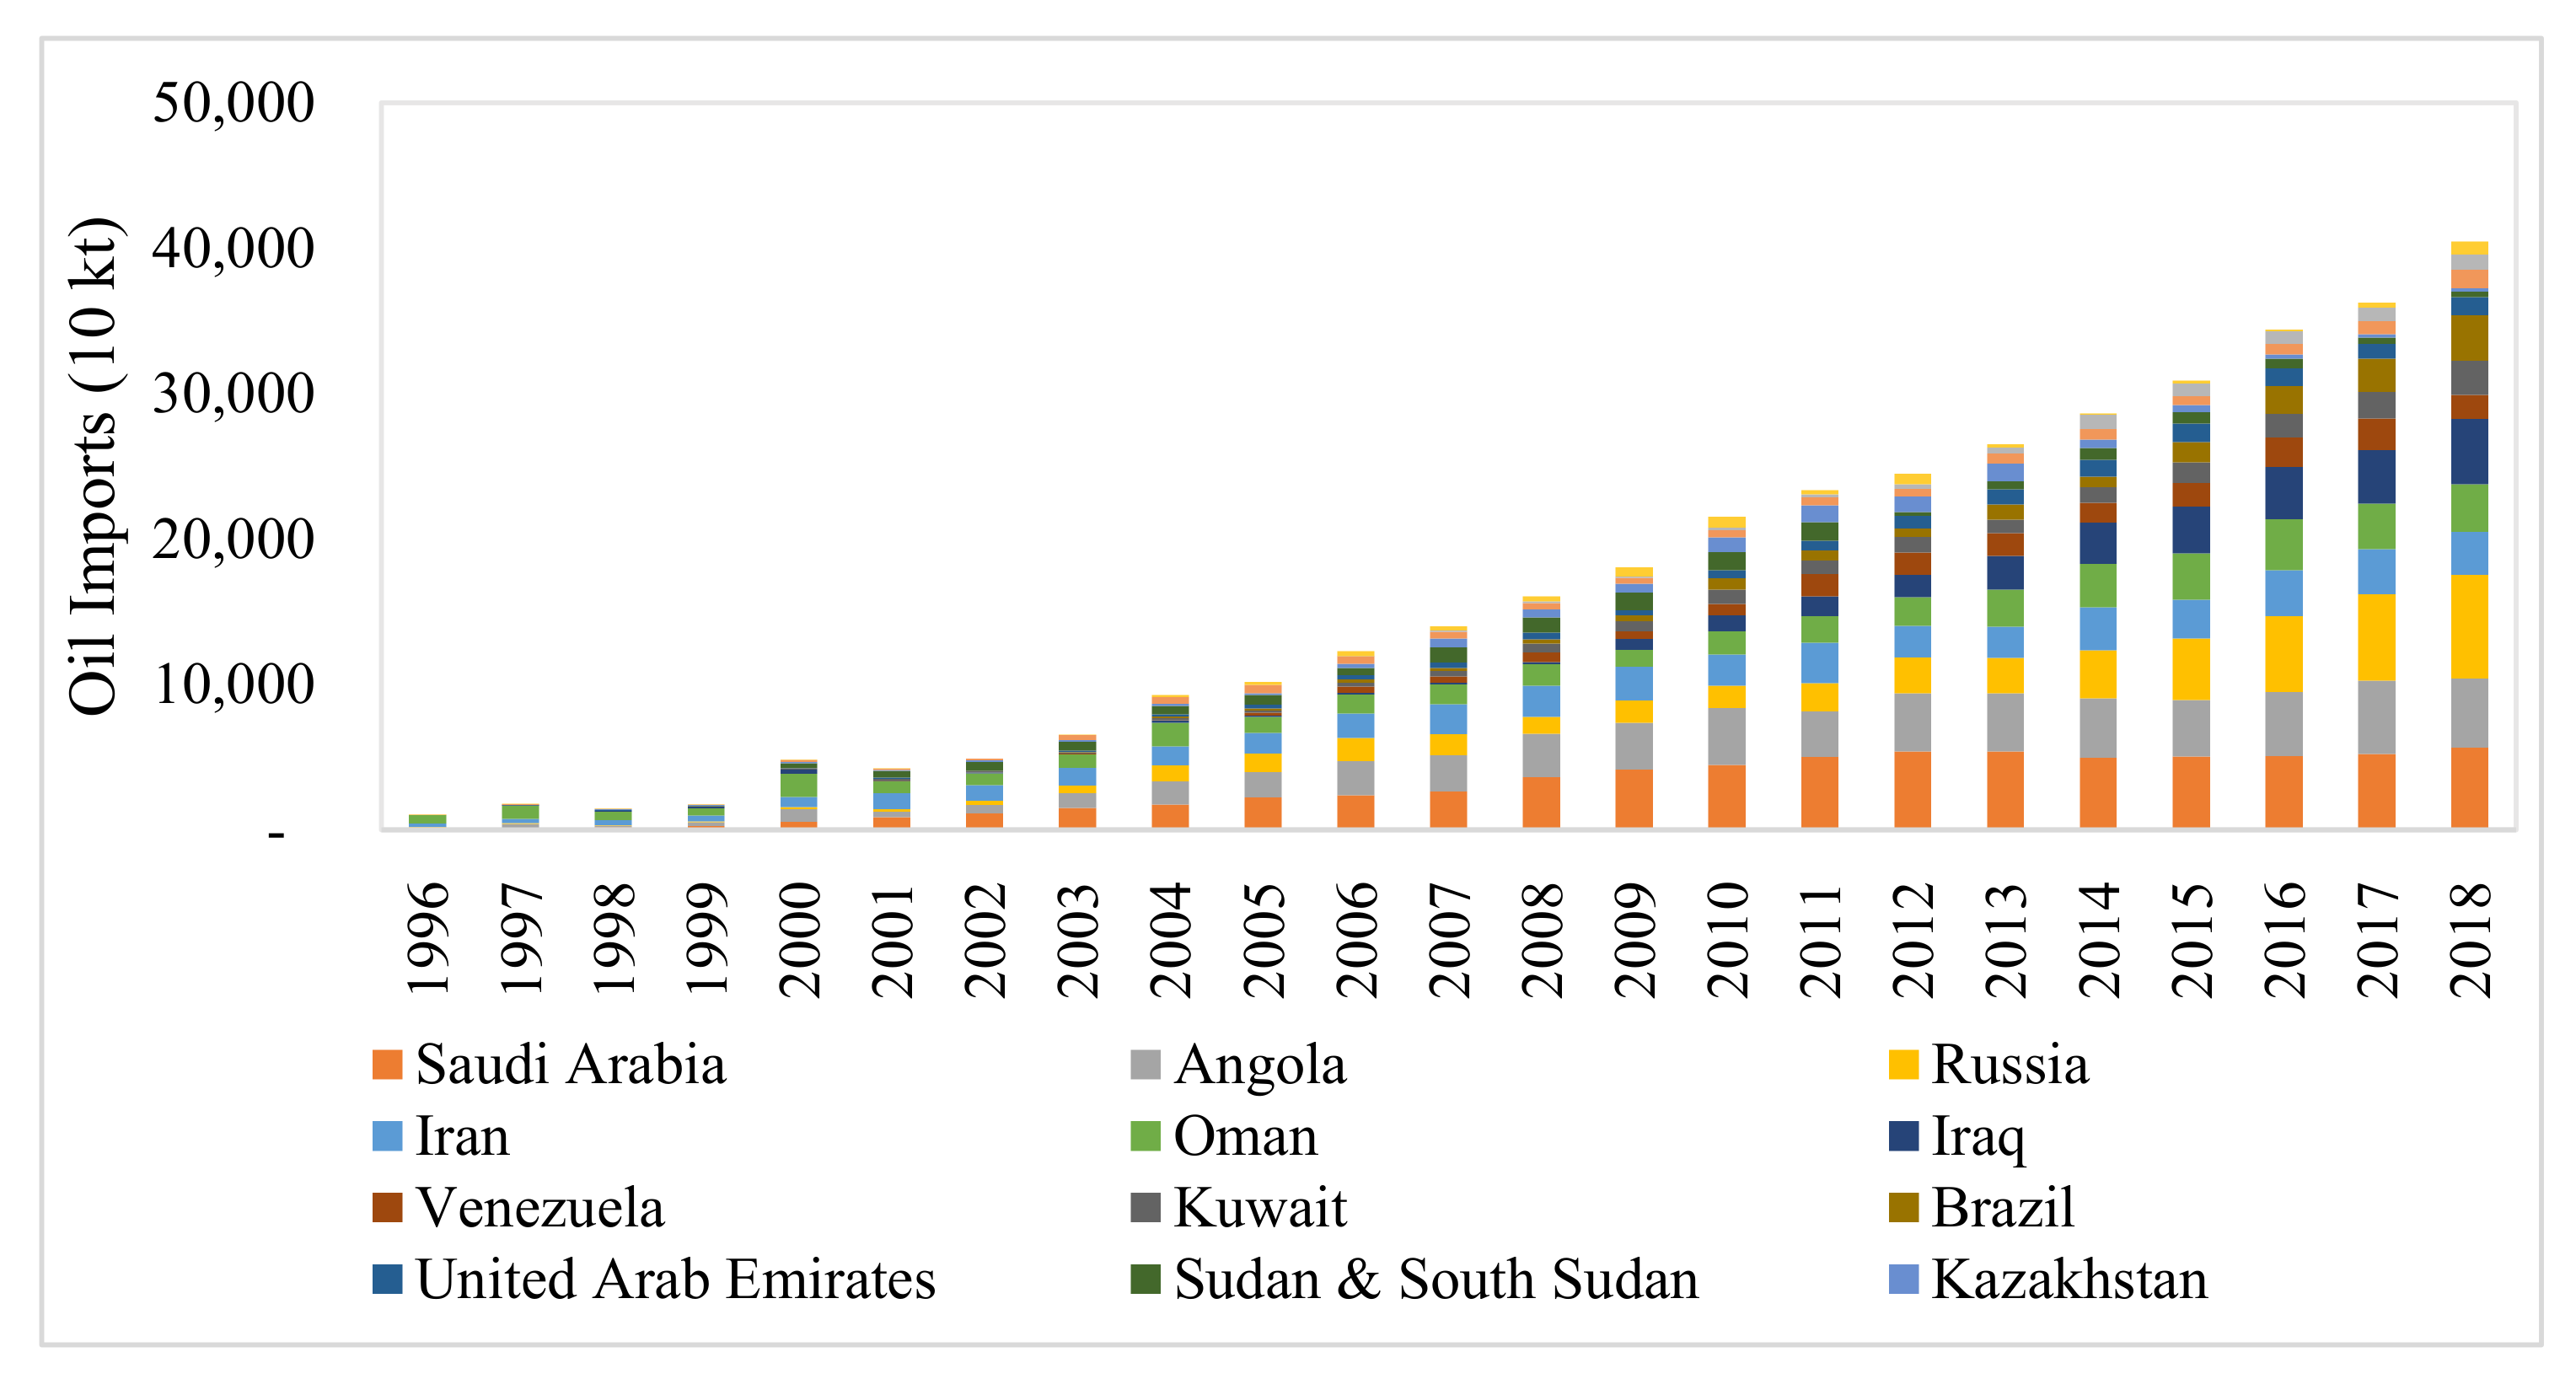
Despite the persistent sanctions of the past decades, Iran has been a key oil supplier to China, which makes China’s energy security vulnerable to the international conflicts [34,35,36,37]. With the rapid growth of its economy and population, China’s demand for energy products will continue to increase gradually, making it the largest oil importer in the world. China’s oil imports increased from 22.62 million tons in 1996 to 536.3 million tons in 2018, and the proportion of imports to the total Chinese oil consumption increased to 72.6% over this period [38]. Persian Gulf countries, especially Iran, have become the most important source of China’s oil supply, thus playing an important role in assuring China’s energy security. From 1996 to 2018, China’s oil imports from Iran increased from 2.31 million tons to more than 30 million tons, an increase of nearly 11 times (Figure 1). The share of oil imports from Iran in China’s total oil imports has also shown a fluctuating upwards trend, rising from 1% in 1996 to 5% in 2018. Iran has been involved in international conflicts, such as the US economic sanctions, in the past decade, and this has posed significant threats to China’s energy security and economic growth [39].
There are increasing numbers of studies that have examined the impacts of international conflicts, and most of them focused on the economic sanctions aiming to strike the economy of the target country [41,42,43,44,45]. The existing literature indicates that economic sanctions can severely disturb economic activities in sanctioned industries, and can consequently worsen the economic growth of the target country. Nakhli et al. [46] applied a DSGE model to assess the impacts of oil sanctions on Iran’s economy and oil production, and showed that the sanctions reduced oil exports, deteriorated technology development and foreign investment, and consequently destroy oil production. Iranmanesh et al. [47] employed the fuzzy logic method and found that the sanctions have more severe economic effects and consequences over time. Farzanegan and Hayo [48] suggested that the international sanctions of 2012 to 2013 had a significantly stronger negative impact on the growth rate of the shadow economy than the official GDP growth rate in Iran. Gharibnavaz and Waschik [49] used a multi-regional computable general equilibrium (CGE) model to suggest that the sanctions lowered Iran’s aggregate welfare and government revenues by 14–15% and 40–50%, respectively. Gharehgozli [50] proved that the sanctions imposed during 2011–2014 reduced Iran’s real GDP by more than 17%, with the largest decrease occurring in 2012.
Although the relationships between international conflicts, energy security and economic growth have been widely discussed, gaps remain in the literature. First, most studies have focused on the impacts of international conflicts on the countries targeted by the sanctions, but collateral damage to the energy security and economic growth of other stakeholders or third parties has been mostly ignored. Second, the previous studies that assessed the impacts of international conflicts rarely explored the interactive behaviors of the participants in those conflicts, which may lead to the over- or underestimation of the impacts of the conflicts. Third, the actual impact mechanisms of international conflicts on the energy security and economic growth of energy-importing countries have scarcely been examined.
Taking note of the shortcomings listed above and using the USA–Iran tension as an example, a global energy-extended computable general equilibrium (CGE) model, GTAP-E, is applied in this study in order to evaluate the impact of international conflict on China’s energy security and economic growth. This work contributes to the existing literature from the following three perspectives: First, the impact mechanism of international conflicts on the energy security and economic growth of energy-importing countries is comprehensively investigated. Second, three illustrative scenarios, including fully implemented economic sanctions, increasing oil exports from Persian Gulf countries other than Iran, and Iran’s anti-sanctions measures, are developed in order to model possible responses by Iran and other Persian Gulf countries after the application of sanctions. Third, in addition to the impact of the sanctions on energy and the economy, impacts on non-energy sectors are also examined.
The remainder of this paper is organized as follows. In Section 2, we use a literature review to explore the impact mechanism of international conflicts on energy security and economic growth, whereas the simulation model and scenario settings are introduced in Section 3. Simulation results with respect to the impacts of the US–Iran conflict on China’s energy security, non-energy sectors and economic growth are discussed in Section 4, with conclusions and policy implications presented in Section 5.
2. Diagnosing the Impact Mechanisms
Using the USA–Iran tension as a case study, this paper explores the impact mechanisms of international conflicts on energy security and economic growth. Economic sanctions, which are one of the most common tactics used in international conflicts, can significantly affect global energy supply chains by threatening the energy supply from energy-exporting countries [51,52]. The US economic sanctions on Iran restricted and hindered various cross-boundary economic activities, such as energy trade, the purchase of production equipment and technology transfer, which reduced Iran’s energy production and decreased the energy supply to the global market [53]. At the same time, freezing the financial assets disrupted energy investments and other cooperation actions between Iran and its trading partners, which also reduced Iran’s production capacity [54]. More seriously, the sanctions also affected the energy supply of Iran and other Persian Gulf countries by interrupting energy transport corridors and lowering transportation efficiency, which can cause some insurance companies to refuse oil tanker insurance [55]. This shows that the disruption of energy exports and transport corridor movements by using economic sanctions poses serious risks to the global energy supply chain, and reduces the availability of energy products to importers.
Economic sanctions can affect China’s energy security from three perspectives: price, supply and import source [56,57,58]. With respect to energy prices, the USA–Iran tension could reduce Iran’s capacity to supply oil, while causing increased global oil prices. Then, if Iran escalates the conflict by blockading the Hormuz Strait in retaliation, the oil production and export from all Persian Gulf countries could be greatly restricted, making oil prices rise more sharply, resulting in insufficient supply to the global oil market. Due to China’s high dependence on foreign oil supply, the impact of increasing oil prices on energy security will be very clear. In addition, the costs of other energy sources in China would rise with the increasing oil prices, which could also affect energy security [59,60]. In terms of energy supply, China’s supplies, especially oil imports, would be affected by the conflict. Disrupting the oil supply chain with sanctions would directly reduce China’s oil imports in the short term, because China has close energy cooperation agreements with Iran [61,62]. Sanctions could also reduce China’s investment in energy assets in Iran in the longer run, which could indirectly affect China’s energy import sources as well [63]. In addition to changing the energy supply and prices, economic sanctions could also affect China’s energy trading partnerships. This occurs when, due to the unavailability of energy products from Iran or other Persian Gulf countries, China ends up requiring a significant amount of time to develop new import sources, shifting its trading partnerships to other countries that have spare oil production capacity, such as Saudi Arabia, Kuwait, Iraq, Russia, or Venezuela [64,65].
The energy insecurity resulting from international conflicts could damage China’s economic growth by reducing its consumption, investment and total exports [36,40,66]. First, energy supply shortages and price fluctuations could severely disrupt the activity of Chinese enterprises, leading in turn to employment and labor income reductions [67,68], thus reducing public disposable income levels, causing decreased consumption [40,69]. Second, the sharp rises in energy prices would increase enterprise production costs and lower investment return rates, which, in turn, would reduce the total investment [70]. Fluctuations in energy prices and unstable energy supply could also erode investor confidence, leading to further reductions in investment [71,72,73]. Third, oil supply shortages indirectly reduce the output of the downstream sectors in the energy supply chain, such as construction and heavy manufacturing [69,74], while rising energy prices worsen China’s terms of trade and reduce the competitiveness in the global market, decreasing China’s total exports [75,76]. Therefore, international conflicts have the potential to eventually damage Chinese economic growth by affecting its energy security.
3. Simulation Model and Scenario Design
3.1. GTAP-E-Model
In this study, a multi-region, multi-sector CGE model (GTAP-E), developed at Purdue University, USA [77], was used to assess the impact of the US–Iran tension on Chinese energy security and economic growth. With a long history of systematic improvements, the GTAP-E model has been widely used to analyze the effects of changes in energy production, international trade and climate [78,79,80,81]. There is an emerging body of literature that employs global CGE models, including the GTAP model, to study the impacts of the international conflict [49,82,83]. The US and Iran are important players in the international energy trade, strongly influencing global oil prices. The assessment of the USA–Iran tension requires the utilization of a global economic equilibrium model to quantify the impacts on countries’ energy and economy. In operation, the GTAP-E model captures the direct impact of international conflicts on the energy trade in the target country, and the indirect impacts of price fluctuations on other energy trading partners.
The theoretical framework of the GTAP-E model is introduced in Truong [84], where it is assumed that the market is completely competitive, and that there are constant returns concomitant with the scale of production. The model assumes that cost is minimized by producers, utility is maximized by consumers, and all countries or regions are connected through bilateral trade in commodities/services. The GTAP-E model comprises many mathematical equations which precisely describe the economic activities associated with production, consumption, investment and trade.
In the GTAP-E model, the nested constant elasticity of substitution functions (CES) is used to describe substitutions between different inputs for each production sector, with producers determining the optimal input based on the principle of cost minimization. For the top-level nest in the production structure, the output from each firm is a combination of intermediate goods and value-added-energy inputs, as depicted by the Leontief function. Value-added-energy inputs include energy capital and other primary factors through a CES structure operating at the second nest. At the bottom nest, the sources of intermediate goods include domestic and imported goods according to the Armington assumption, suggesting that domestically produced goods and imported goods have incomplete substitution [85]. On the consumption side, the model assumes the separation of private consumption from government consumption (the consumption by households of publicly provided goods) and private savings. Government consumption expenditure is then assumed to be Cobb–Douglas with respect to all commodities. Household private consumption—that is, the consumption of private goods—is assumed to be structured according to a “constant difference of elasticities” (CDE) functional form.
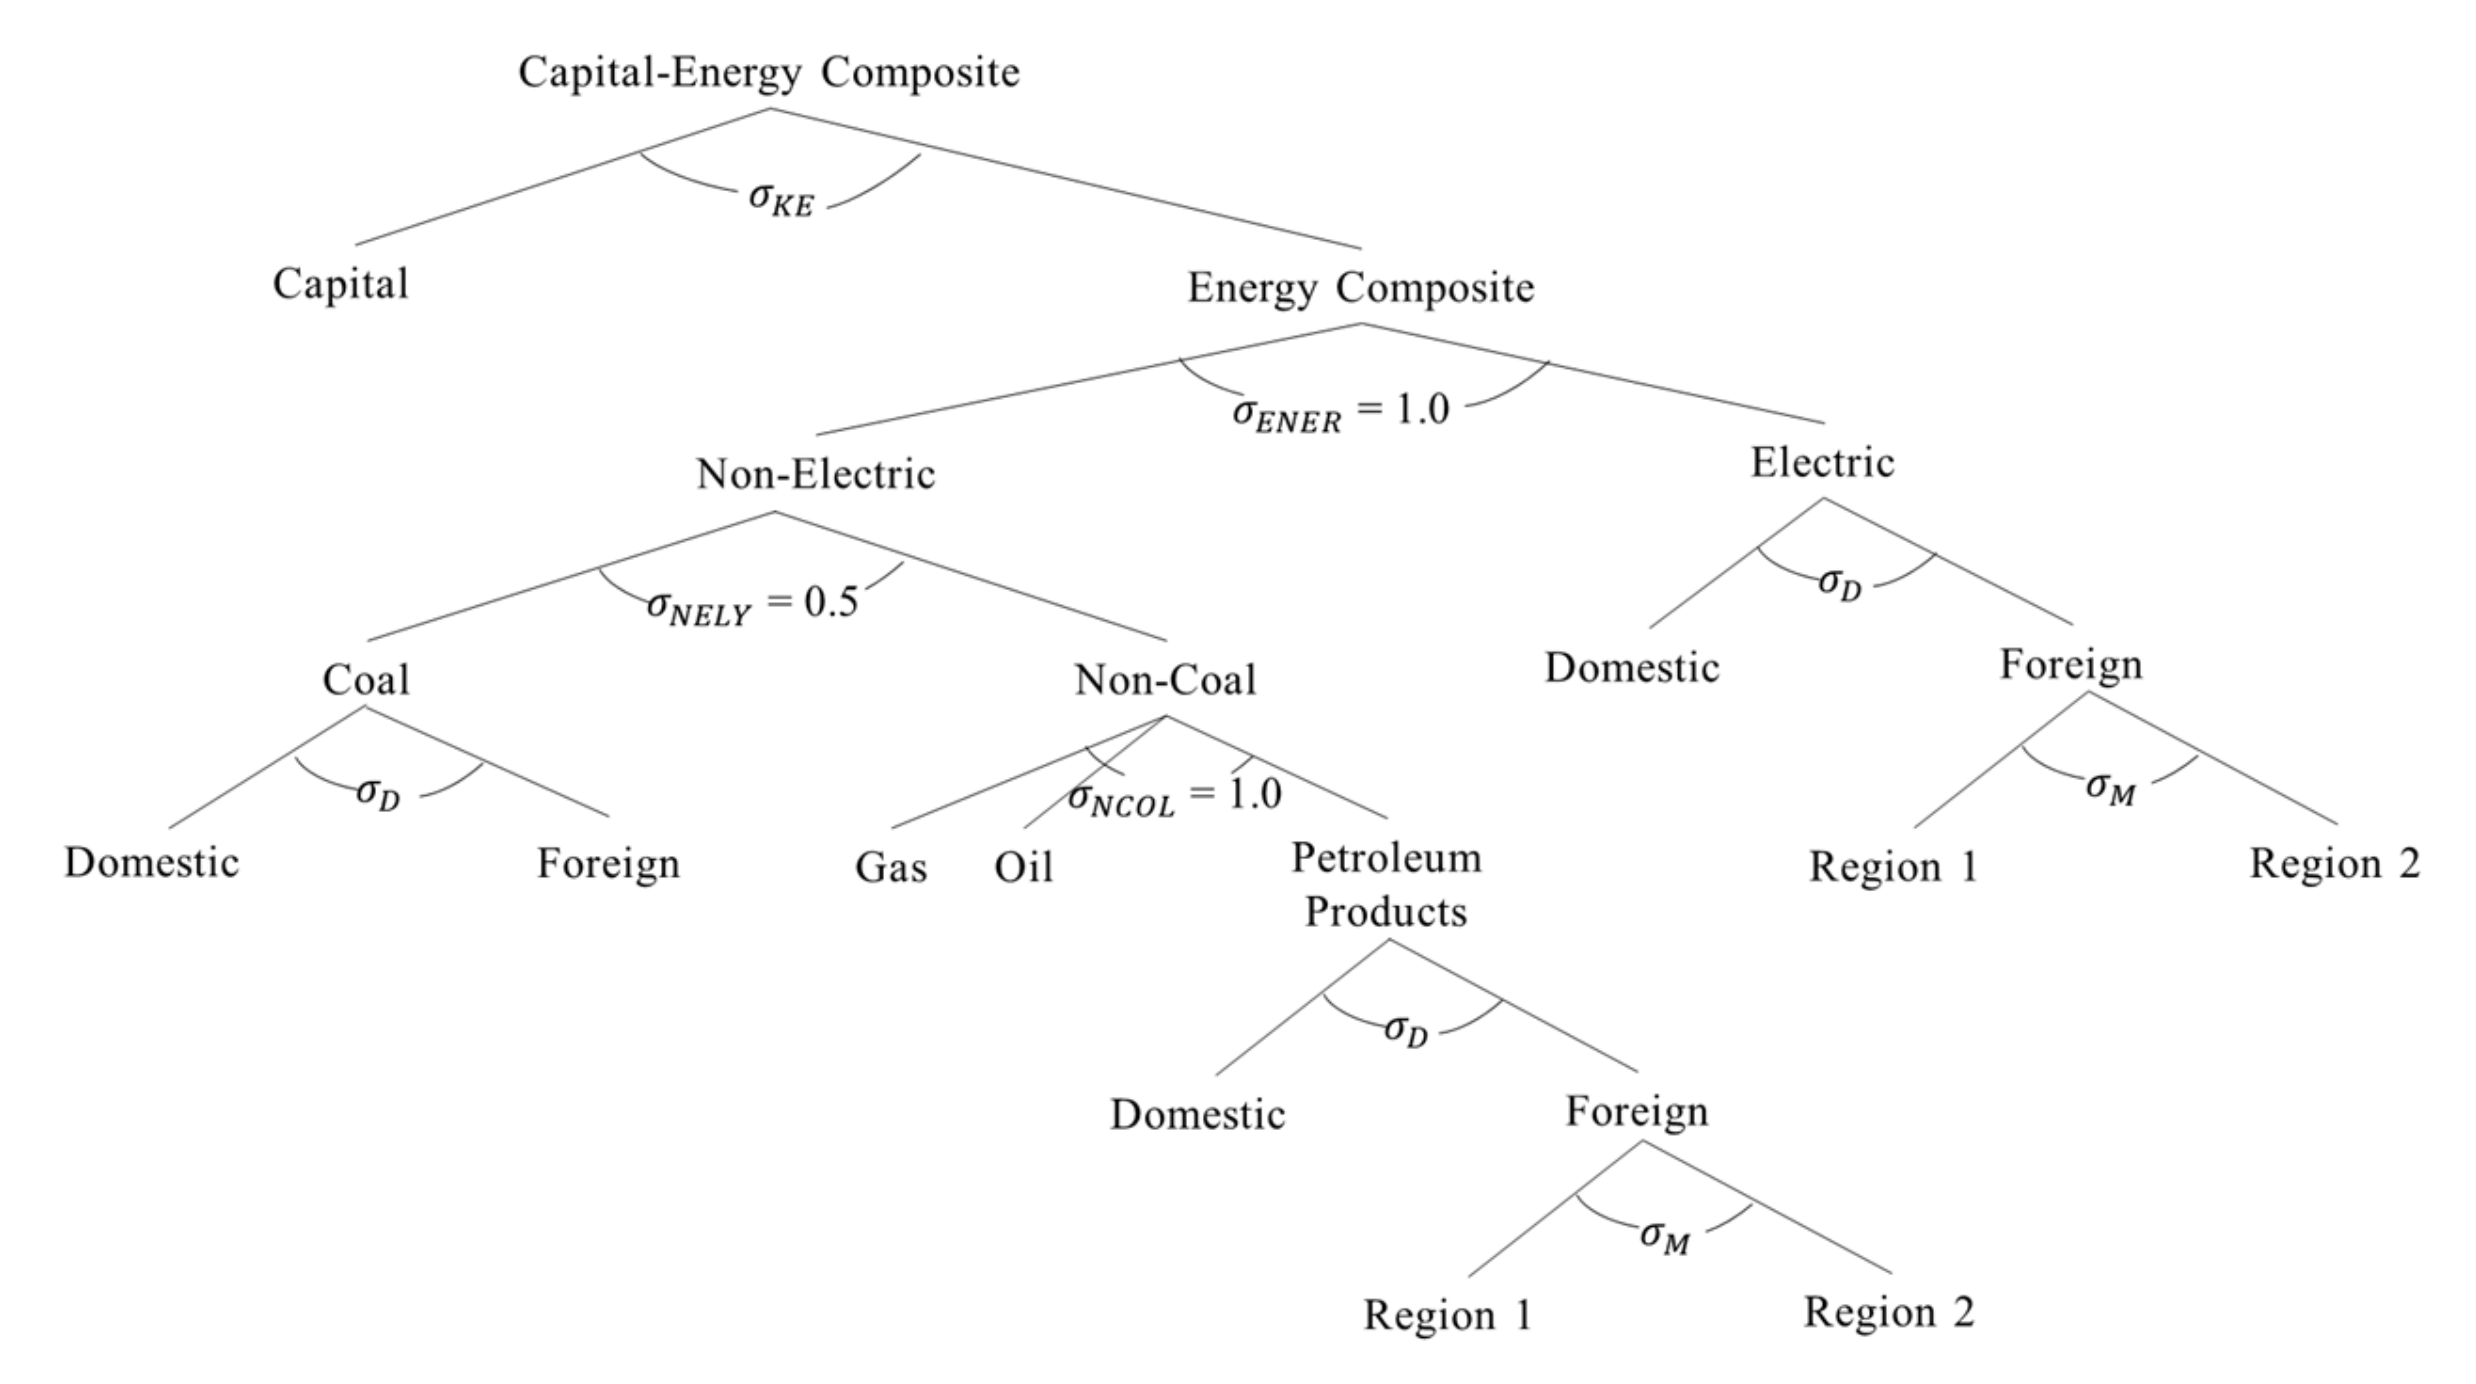
The detailed nested structure of the capital–energy composite for production sectors in the GTAP-E model can be seen in Figure 2. At the top of the nested structure, the capital–energy commodity is comprised of capital input and composited energy consumption in production sectors, depicted by the CES function with a substitution elasticity (σKE) of 0.5, for most industries. At the lower level, the energy composite commodity is separated into electrical and nonelectrical energy, with a substitution elasticity (σENER) of 1.0. Nonelectrical energy is composed of coal and non-coal energy, with a substitution elasticity (σNELY) of 0.5. Then, the commodity of non-coal energy is divided into gas, oil and petroleum products, and a substitution elasticity (σNCOL) of 1.0 is applied. At the bottom, the demand for electricity, coal, gas, oil and petroleum products in the nest follows the Armington assumption, which implies that composited energy inputs can achieve only incomplete substitution between domestic and imported products; that is, they differ according to the production location.
3.2. Data and Closure
In order to establish the GTAP-E model database, this paper used the latest database version (V10), based on input–output tables for 141 countries/regions across the world, with a base year of 2014. The original GTAP database contained 65 production sectors and five primary factors (land, capital, skilled labor, unskilled labor and natural resources). In order to facilitate the simulation and analysis, we aggregated the 141 original countries/regions into 19 regions, covering the major oil-exporting and -importing countries, such as Iran, other Persian Gulf countries, China, India, Korea and Japan (see Appendix A Table A1). The 65 production sectors were aggregated down to 14, covering the major upstream and downstream aspects of energy production sectors (Appendix A Table A2). The five primary factors were aggregated into land, labor and capital. The data on the substitution elasticity among different types of energy were taken from the GTAP-E model database, whereas the Armington elasticity values were obtained from the GTAP V10 database.
This paper adopts a standard, long-run macroeconomic closure to study the impact of the US–Iran conflict. Adopting this closure involved the following key assumptions. In the labor market, aggregate employment remains unchanged, and real wages are endogenous. In the capital market, capital stocks are free to change in such a way that fixed rates of return are maintained. Aggregate investment follows the aggregate capital stock. Household and government expenditures move together to accommodate balance-of-trade constraints.
3.3. Policy Scenarios
In order to examine the impact of the USA–Iran tension on Chinese energy security and economic growth, three illustrative scenarios were established (Table 1). Scenario 1 (S1) involved the US establishing a complete embargo on Iranian oil exports, reducing them to zero. As the international conflict between the US and Iran deteriorates, the bilateral conflict gradually evolves into a multilateral situation involving other Persian Gulf countries. In scenario 2 (S2), other Persian Gulf oil producers make full use of their spare capacity to increase oil production, compensating for the gap in the global oil supply. It has been estimated by the International Energy Agency that, in 2018, OPEC members had 3.30 million barrels/day in spare oil production capacity, of which over 70% belonged to Saudi Arabia, with the remainder belonging to Kuwait, the UAE and Iraq [86]. Using the spare oil production capacity could increase the oil production by Persian Gulf countries other than Iran by 12.62%, from the level of 25.35 million barrels/day in 2017. In scenario 3 (S3), Iran closes the oil tanker transport corridor through the Hormuz Strait, the most important route for oil exports from Persian Gulf countries, as a countersanctions action. In this scenario, it is assumed that if Iran harasses vessels transiting the Hormuz Strait with military force, Persian Gulf country oil exports would fall by 30%.
4. Results
4.1. Impacts of International Conflict on Chinese Energy Security
4.1.1. Impacts on the Output, Price and Trade of Energy Sectors in China
Table 2 suggests that the USA–Iran tension has limited impacts on the output, price and trade of each energy sector in China, provided that other Persian Gulf countries could increase oil exports through the Hormuz oil transport corridor.
Under S1, the sanctions would lead to increased oil, gas and electricity outputs, and decreased coal, petroleum products and gas supply outputs. The full embargo on Iran’s oil exports would decrease China’s oil imports (by 1.224%) and raise domestic oil prices (by 0.710%), which consequently stimulates its own oil production (2.520%) and leads to oil export reductions of 0.749%. Affected by the decrease in oil exports, the demand for gas (as an alternative to oil) would likely increase globally, causing China’s gas exports to increase slightly (0.360%), leading to higher domestic gas prices (0.313%) and output (0.187%). These increased domestic prices for oil and gas would inevitably lead to higher costs for energy use in the main downstream sectors, leading to the outputs of petroleum products and gas supply decreasing by 1.138% and 0.294%, respectively. Electricity prices could be expected to rise slightly (0.062%), along with fossil fuel-derived energy prices, increasing electricity output by 0.034%.
In S2, the availability of oil exports from other Persian Gulf countries (the most important oil exporters in the world) largely alleviates the shock of sanctions on the output and price of most Chinese energy sectors. When Iran’s oil exports are fully embargoed, increased oil exports from other Persian Gulf countries would effectively increase oil imports (2.747%) and reduce oil prices (by 0.506%) in China, thus leading to a significant decline in output (by 1.793%) and export (by 6.515%) from the oil sector. This decrease in petroleum products exports is lower than that predicted under S1, but the increases in petroleum product imports are much higher. With lower oil import prices affected by the increase in oil exports from other Persian Gulf countries, China could be expected to increase its imports of oil and petroleum products, buffering the import reduction caused by sanctions. Meanwhile, the model predicts that petroleum products and gas supply outputs would decrease by 0.122% and 0.063%, respectively, accompanied by a slight decrease in their prices. The output of gas would increase significantly (2.940%) because of the large increase in gas demand from other countries; that is, under S2, gas exports can be expected to rise by 17.08%. In contrast, due to the decreasing oil prices, the coal and electricity price and output would experience slight reductions.
Under S3, when oil exports from Persian Gulf countries decrease, the global oil price could be expected to rise more sharply, and the output, price and trade for each energy sector (excluding electricity) would fluctuate significantly. Under this scenario, oil export reductions from Persian Gulf countries not only lead directly to decreased Chinese oil imports but also to increased global oil prices, indirectly lowering China’s oil imports. Affected by this sharp decrease in oil imports (5.067%), China’s domestic oil price (4.795%) and output (16.609%) would increase significantly. Moreover, China would experience a substantial increase in oil exports (15.023%) stimulated by rapidly rising global oil prices. In contrast, gas output is expected to decline significantly (by 9.588%) based on the large decrease in gas exports (−40.868%). Driven by increased production costs and decreased imports, coal, petroleum products and gas supply outputs could decrease by 1.244%, 5.187% and 1.027%, respectively. Nevertheless, under S3, the output of the electricity sector increases by 0.343% because its price increases by 0.372%.
4.1.2. Impacts on the Supply of Chinese Energy Sectors
By influencing China’s energy output and trade, the US–Iran tension leads to a change in the energy supply, threatening the energy security in China. For each energy format, supply is equal to the sum of domestic production and net imports (imports minus exports), which is calculated using Equation (1):
where Xsupply, Xproduction, Ximport and Xexport represent the supply, production, import and export of energy, respectively. By linearizing Equation (1), the percentage changes in energy supply can be calculated, as shown in Equation (2):
where xsupply, xproduction, ximport and xexport represent the percentage change in the supply, production, import and export of each energy format, respectively. Sproduction, Simport and Sexport represent the proportions of production, imports and exports in the supply of each energy source. Equation (2) allows us to see that the percentage change in the energy supply depends not only on the percentage change in production, imports and exports but also on the relative proportions of these in the supply equation for each energy sector.
The simulations suggest that sanctions would have a negative impact on supply for most energy sectors, but the reasons for the supply reduction in each differ significantly (Table 3). In general, China’s oil and gas sector supplies depend on imports, whereas the supplies of coal, petroleum products, gas and electricity are mainly dominated by the domestic outputs from their respective sectors.
Under S1, a full embargo on Iranian oil exports would decrease the supply of products from most energy sectors (except for electricity), thereby seriously threatening China’s energy security. The oil supply would experience the largest decline (1.116%), being directly affected by decreased Chinese oil imports from Iran. As 82.49% of China’s gas comes from imports, the overall supply of gas would decrease to 0.044% with a 0.076% decrease in gas imports. Domestic coal, petroleum products and gas supply would decrease by 0.288%, 0.687% and 0.103%, respectively, due to their declining outputs. The electricity supply would increase slightly, by 0.036%, mainly because of the increase in domestic output.
Under S2, the negative impact of sanctions on the supplies of most Chinese energy sectors could be largely offset. The net supplies of oil, coal, gas and petroleum products would increase by 0.115%, 0.004%, 0.082% and 0.382%, respectively. However, the supply of gas becomes further reduced, by 0.569%, which indicates that using spare oil production capacity from other Persian Gulf countries cannot compensate for the gas supply shortage caused by the conflict. With less electricity output, the electricity supply would decrease to 0.069%.
The supply of most energy products in China would fluctuate significantly in the situation in which oil exports from other Persian Gulf countries are reduced (S3), with the oil supply (down by 4.869%) being the most negatively affected. Supply in the gas sector would increase by 1.669%, however, mainly because of rising imports. Compared to S1 and S2, the supply of petroleum products (down 4.250%), coal (down 1.379) and gas (−0.689%) would decrease significantly because of the decline in their production, indicating a severe deterioration in China’s energy security.
4.2. Impacts of International Conflict on Chinese Energy Import Sources
4.2.1. Changes in Oil Import Sources
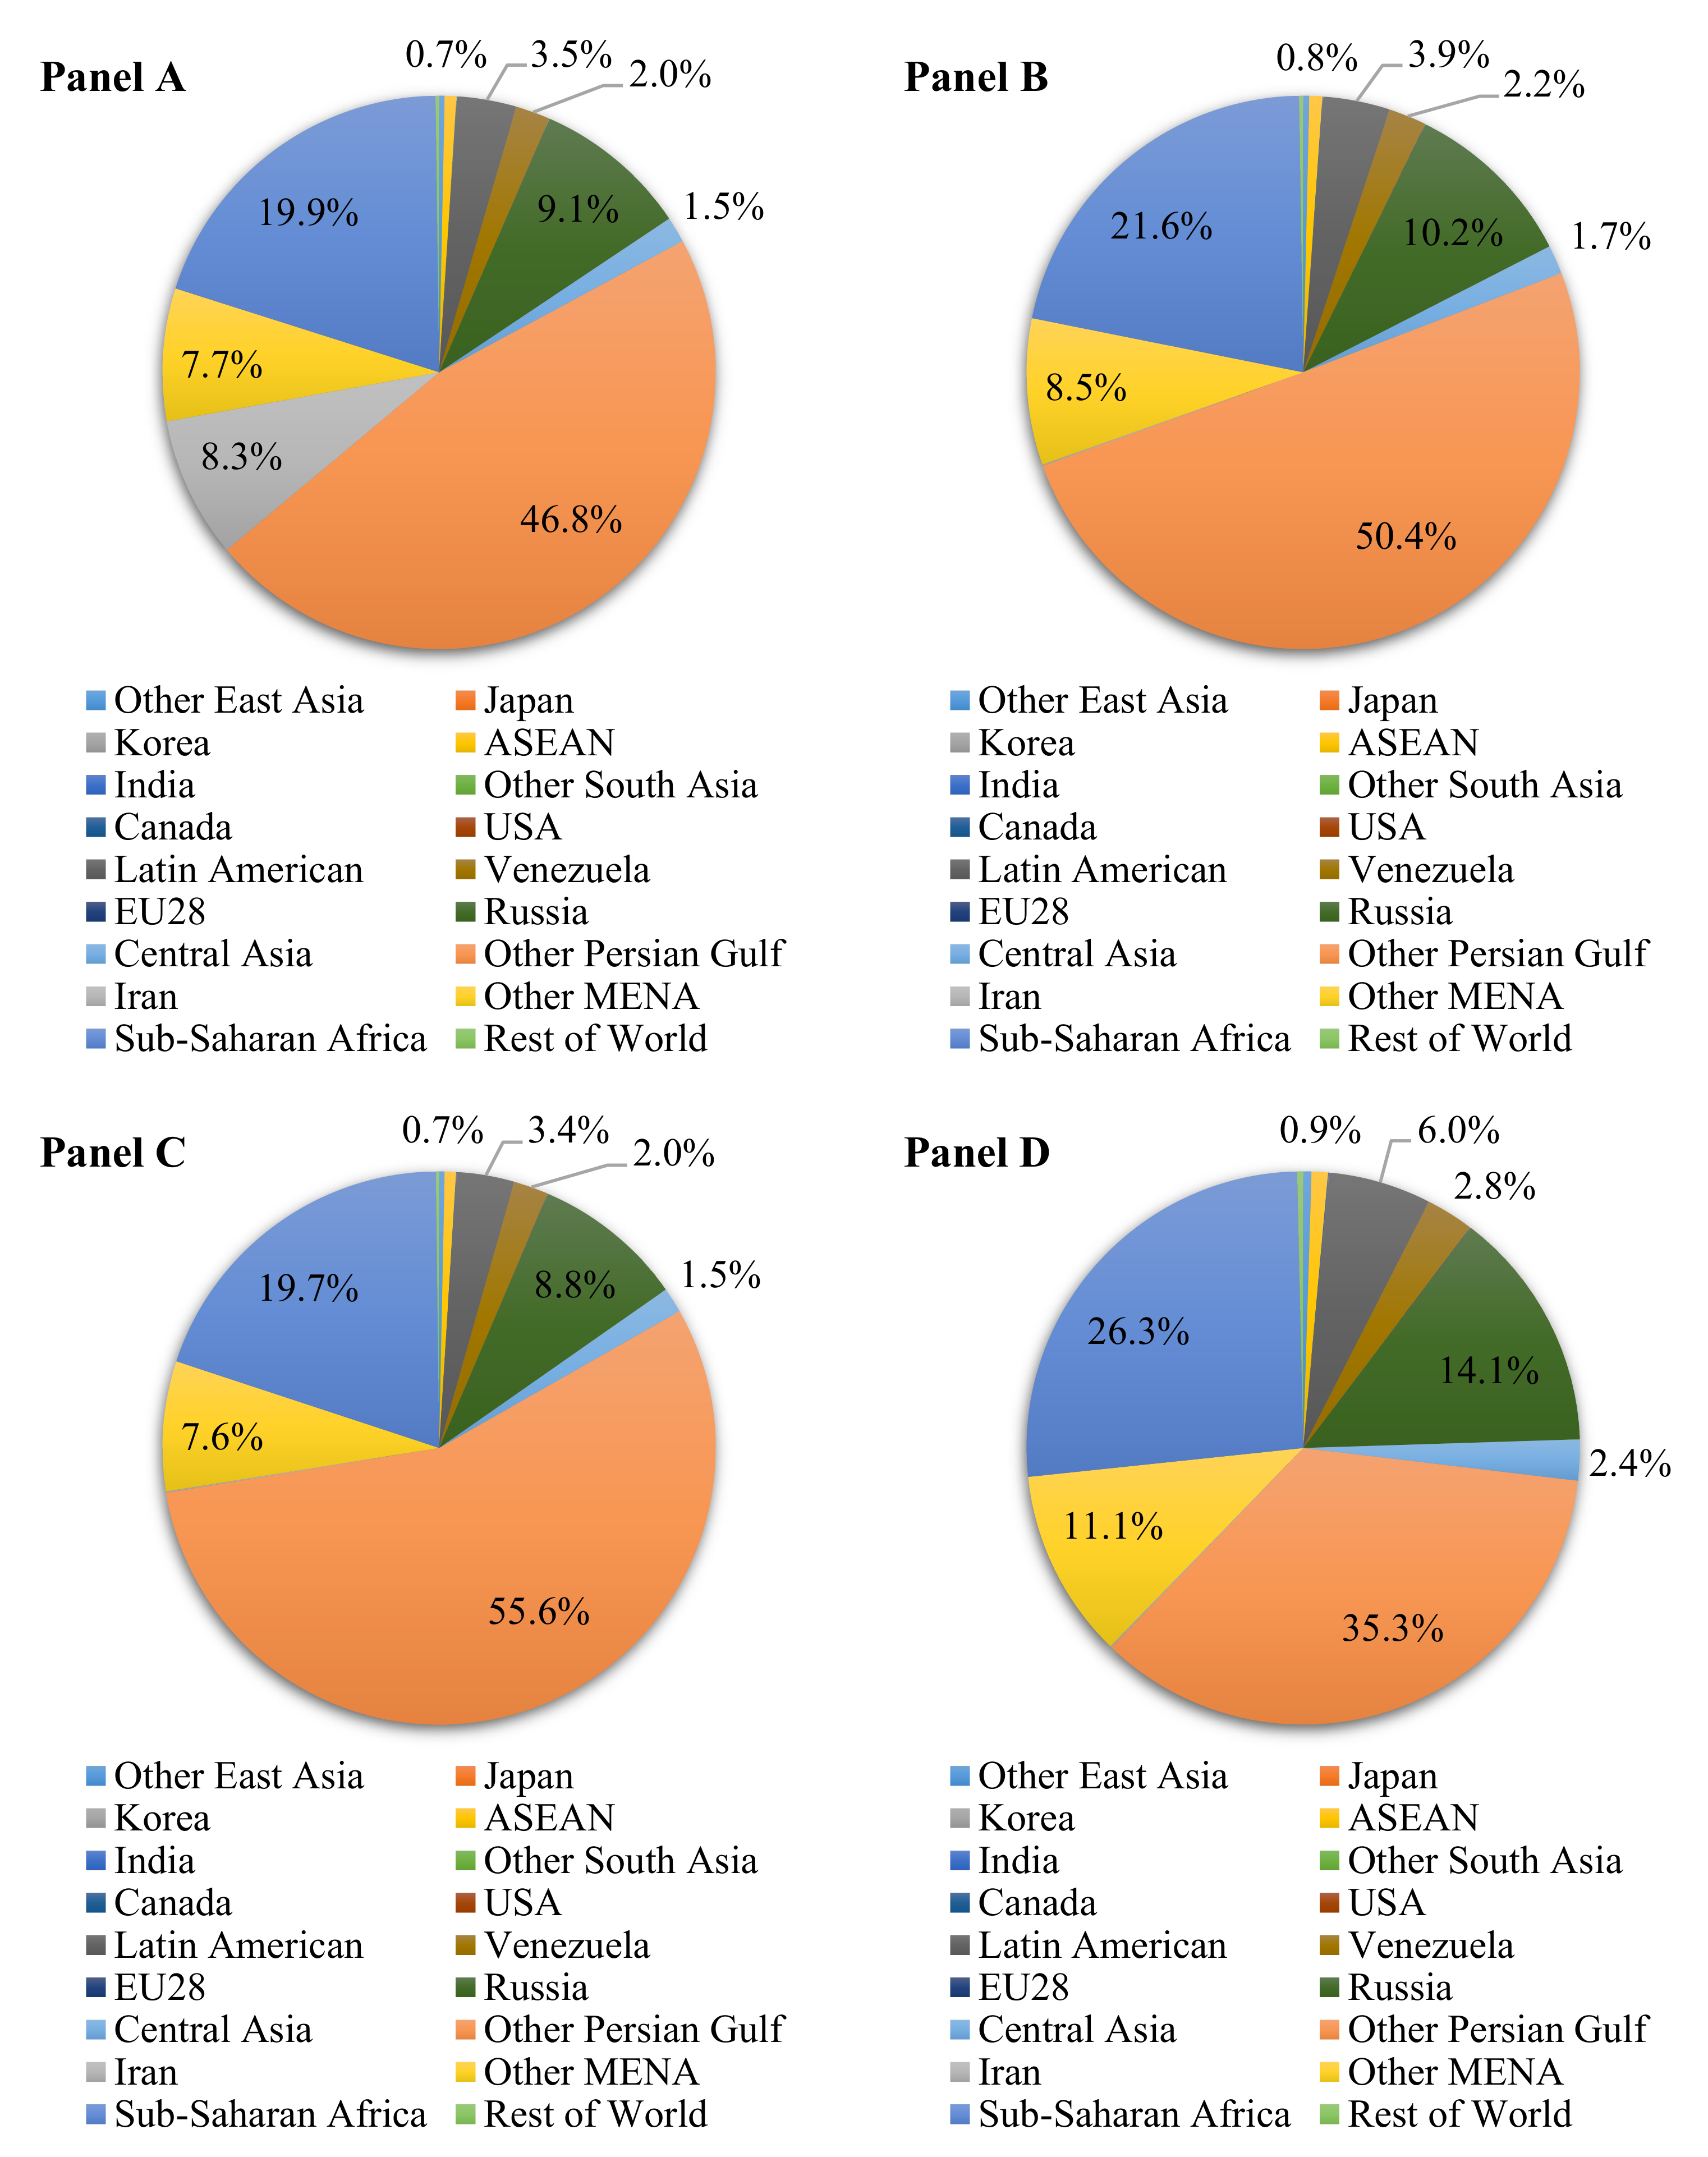
The distribution of China’s oil imports from other regions before and (as simulated) after sanctions can be seen in Figure 3. The “before” data (Panel A, Figure 3) show that China’s oil imports are currently sourced mainly from Persian Gulf countries other than Iran (46.8%), Sub-Saharan Africa (19.9%), Russia (9.1%), Iran (8.3%) and other Middle Eastern and North African (MENA) countries (7.7%). This indicates that more than half of China’s oil imports are from Persian Gulf countries, which emphasizes the importance of analyzing the effects of USA–Iran tensions on China’s oil import sources.
The results suggests that sanctions would cause China to gradually change oil import sources from Iran and other Persian Gulf countries to Sub-Saharan Africa, Russia and other MENA countries. If Iran’s oil exports are fully restricted (Panel B, Figure 3), China’s oil import deficit would be mostly compensated by the other four oil-exporting regions. Specifically, the proportion of China’s total oil imports from other Persian Gulf countries would increase to 50.4%, and the proportions from Sub-Saharan Africa (21.6%), Russia (10.2%) and other MENA countries (8.5%) would also increase, to a lesser extent. Under S2, due to the increased oil production, the proportion of China’s oil imports from Persian Gulf countries would further increase to 55.6% (Figure 3, Panel C), while the proportions from Sub-Saharan Africa, Russia and other MENA countries would decrease to 19.7%, 8.8%, and 7.6%, respectively. The structure of China’s import sources can be expected to change drastically under S3 (Figure 3, Panel D). The proportion sourced from Persian Gulf countries falls sharply, accounting for approximately 35.3%. This leads to significant increases in the proportions sourced from Sub-Saharan Africa (26.3%), Russia (13%), and Other MENA countries (10%), with Venezuela and Latin American sources together being predicted to account for 8.8% of China’s oil imports.
4.2.2. Changes in the Gas Import Sources
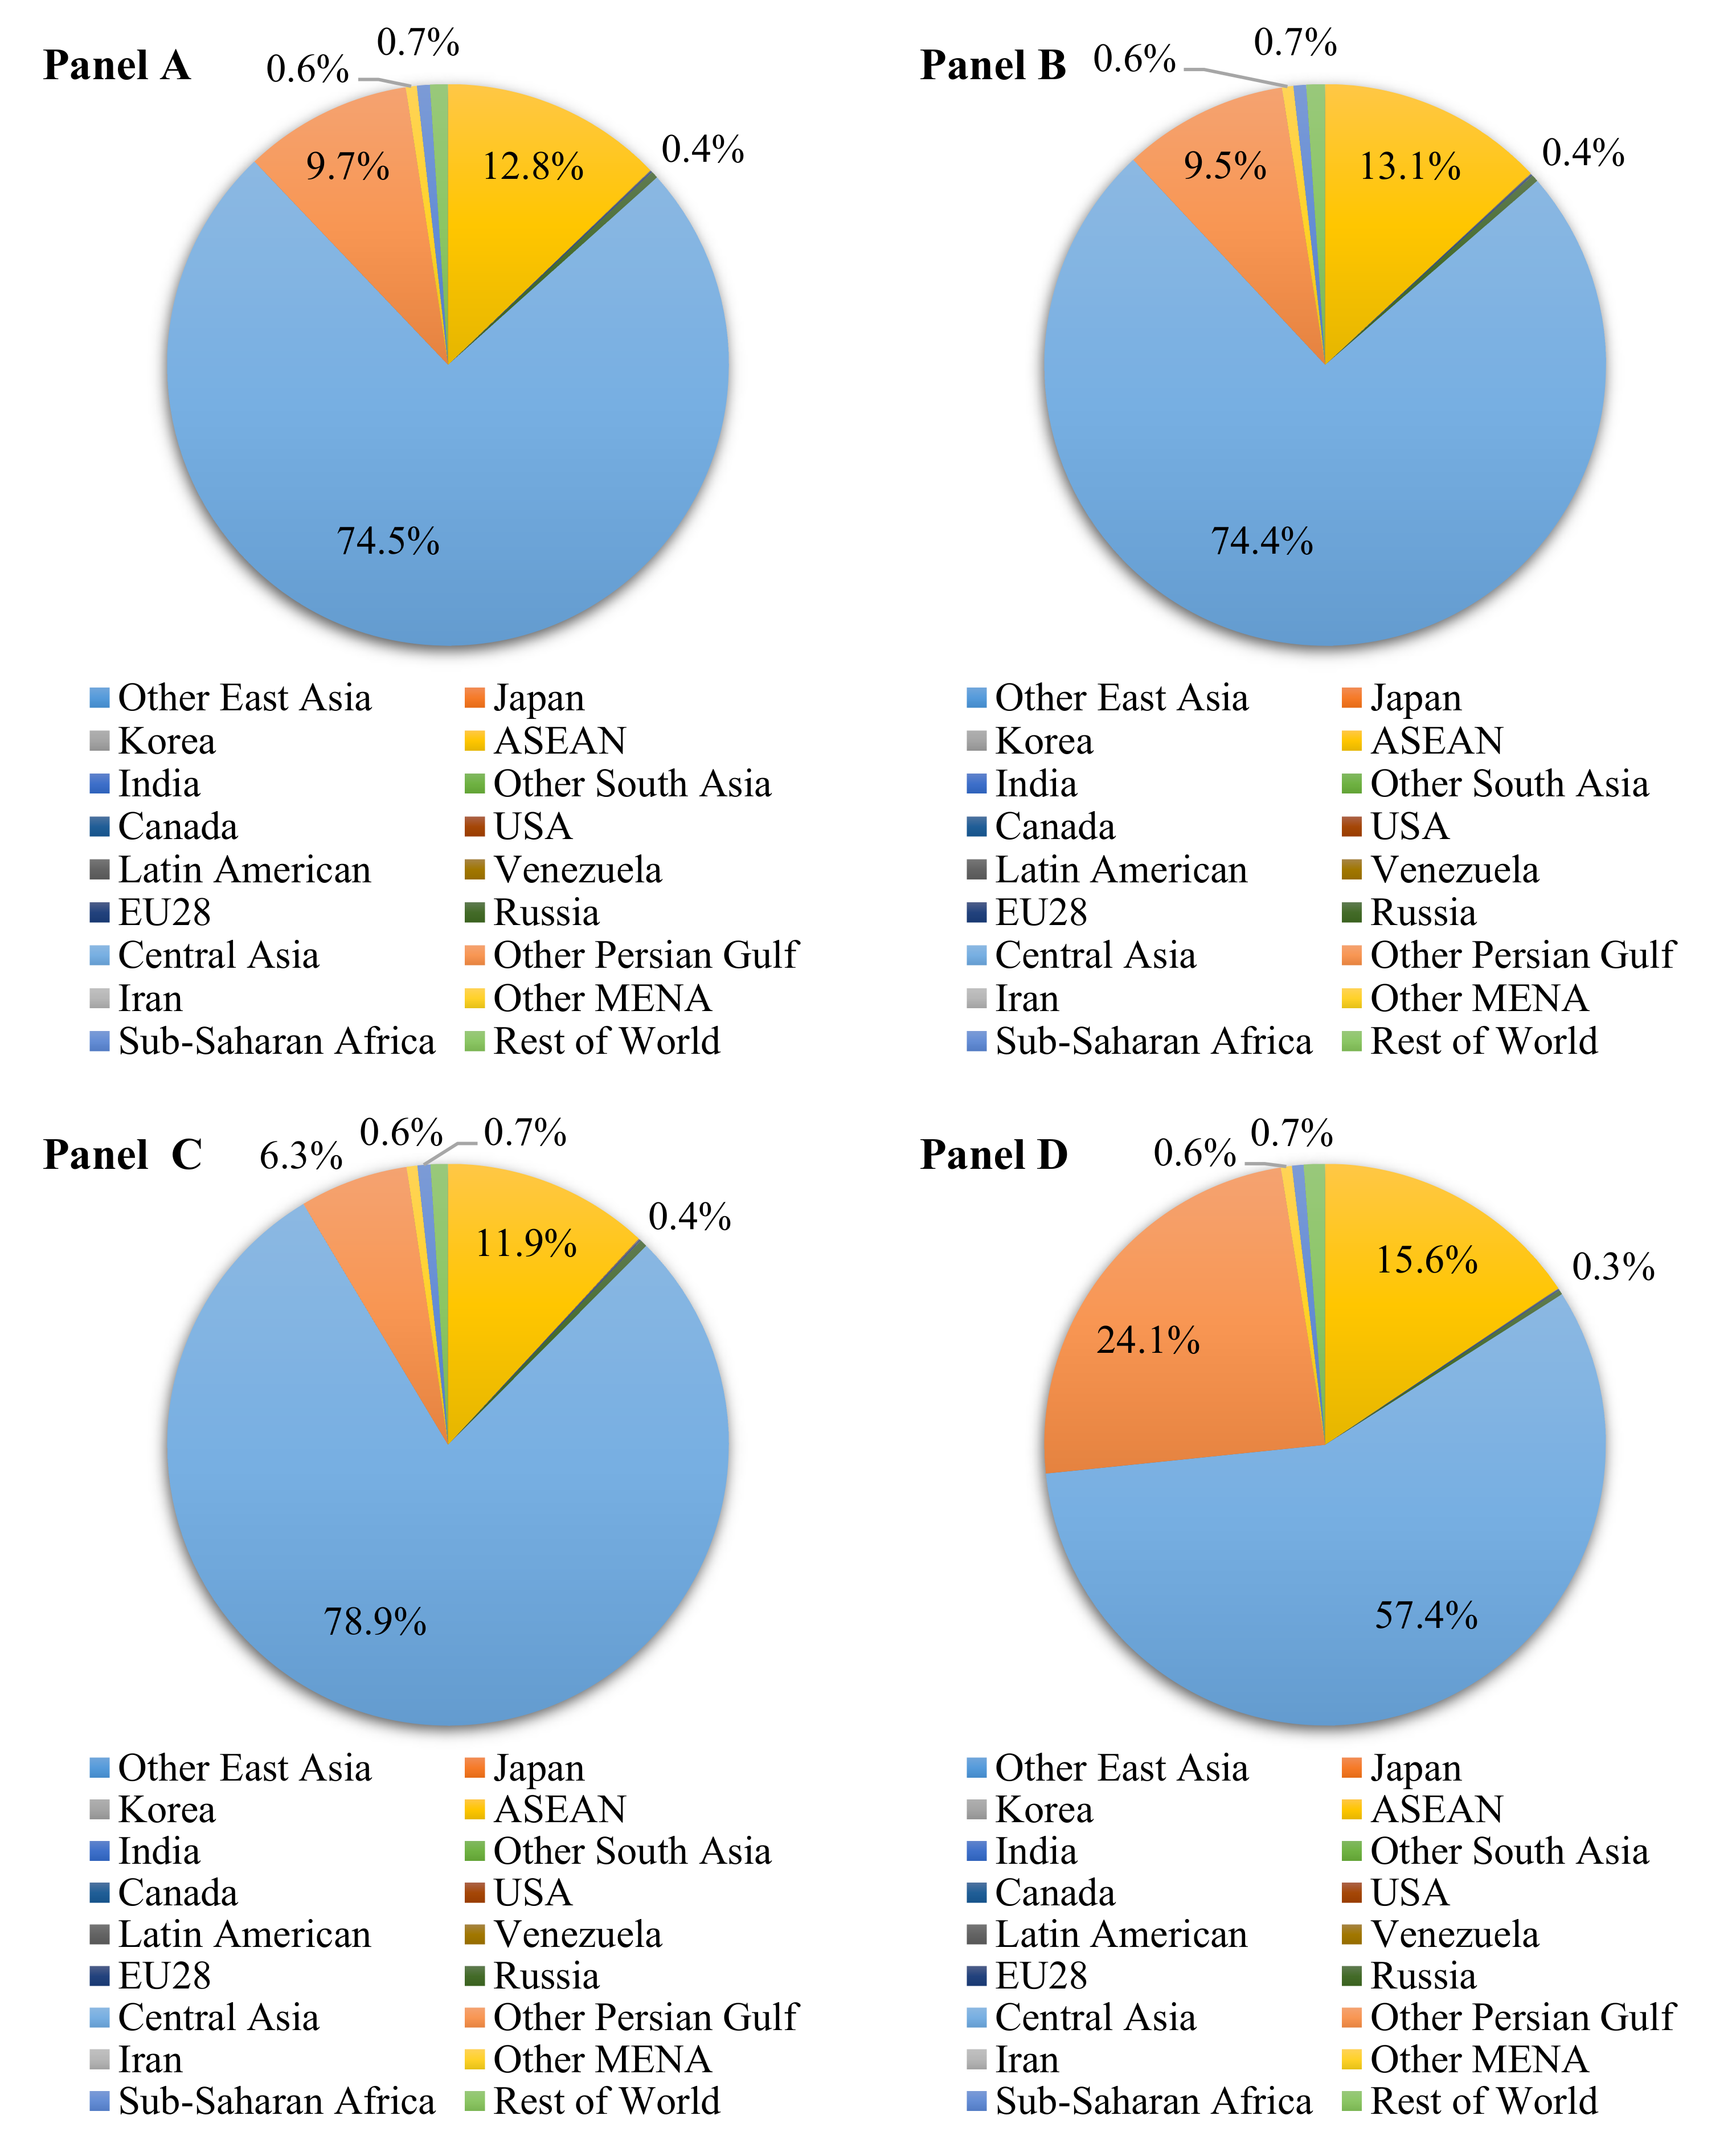
Panel A in Figure 4 represents the current situation (base data), which shows that China’s gas imports are sourced mainly from Central Asia (74.5%), ASEAN (12.8%) and other Persian Gulf countries (9.7%). The simulation results suggest that these three sources continue to provide most of China’s gas imports after the imposition of the sanctions, supplying >97% of this resource.
The proportions supplied by Central Asia, ASEAN and other Persian Gulf countries are predicted to change slightly under different sanction imposition scenarios. Under S1, the proportions sourced from Central Asia and Other Persian Gulf countries could be expected to decrease slightly, to 74.4% and 9.5%, respectively, whereas the proportion sourced from ASEAN countries slightly increases (Panel B, Figure 4). Compared with S1, the proportions of the gas imports from ASEAN and other Persian Gulf countries in S2 are predicted by the simulations to decrease by 3.2% and 1.2% (Panel C, Figure 4) because the market is expected to prefer oil consumption over gas at this time. However, Central Asia provides 78.9% of China’s gas imports, such that when the oil exports from other Persian Gulf countries decrease, the gas exports from other Persian Gulf countries are predicted by the simulations to increase sharply, accounting for 24.1% of China’s gas imports (Panel D, Figure 4). Meanwhile, the proportion sourced from ASEAN countries could also increase significantly to a point higher than that seen in other scenarios. Consequently, the proportion supplied by Central Asia could be expected to decline to 57.4%, although Central Asia would still be China’s largest source of gas imports.
4.2.3. Changes in the Petroleum Products Import Sources
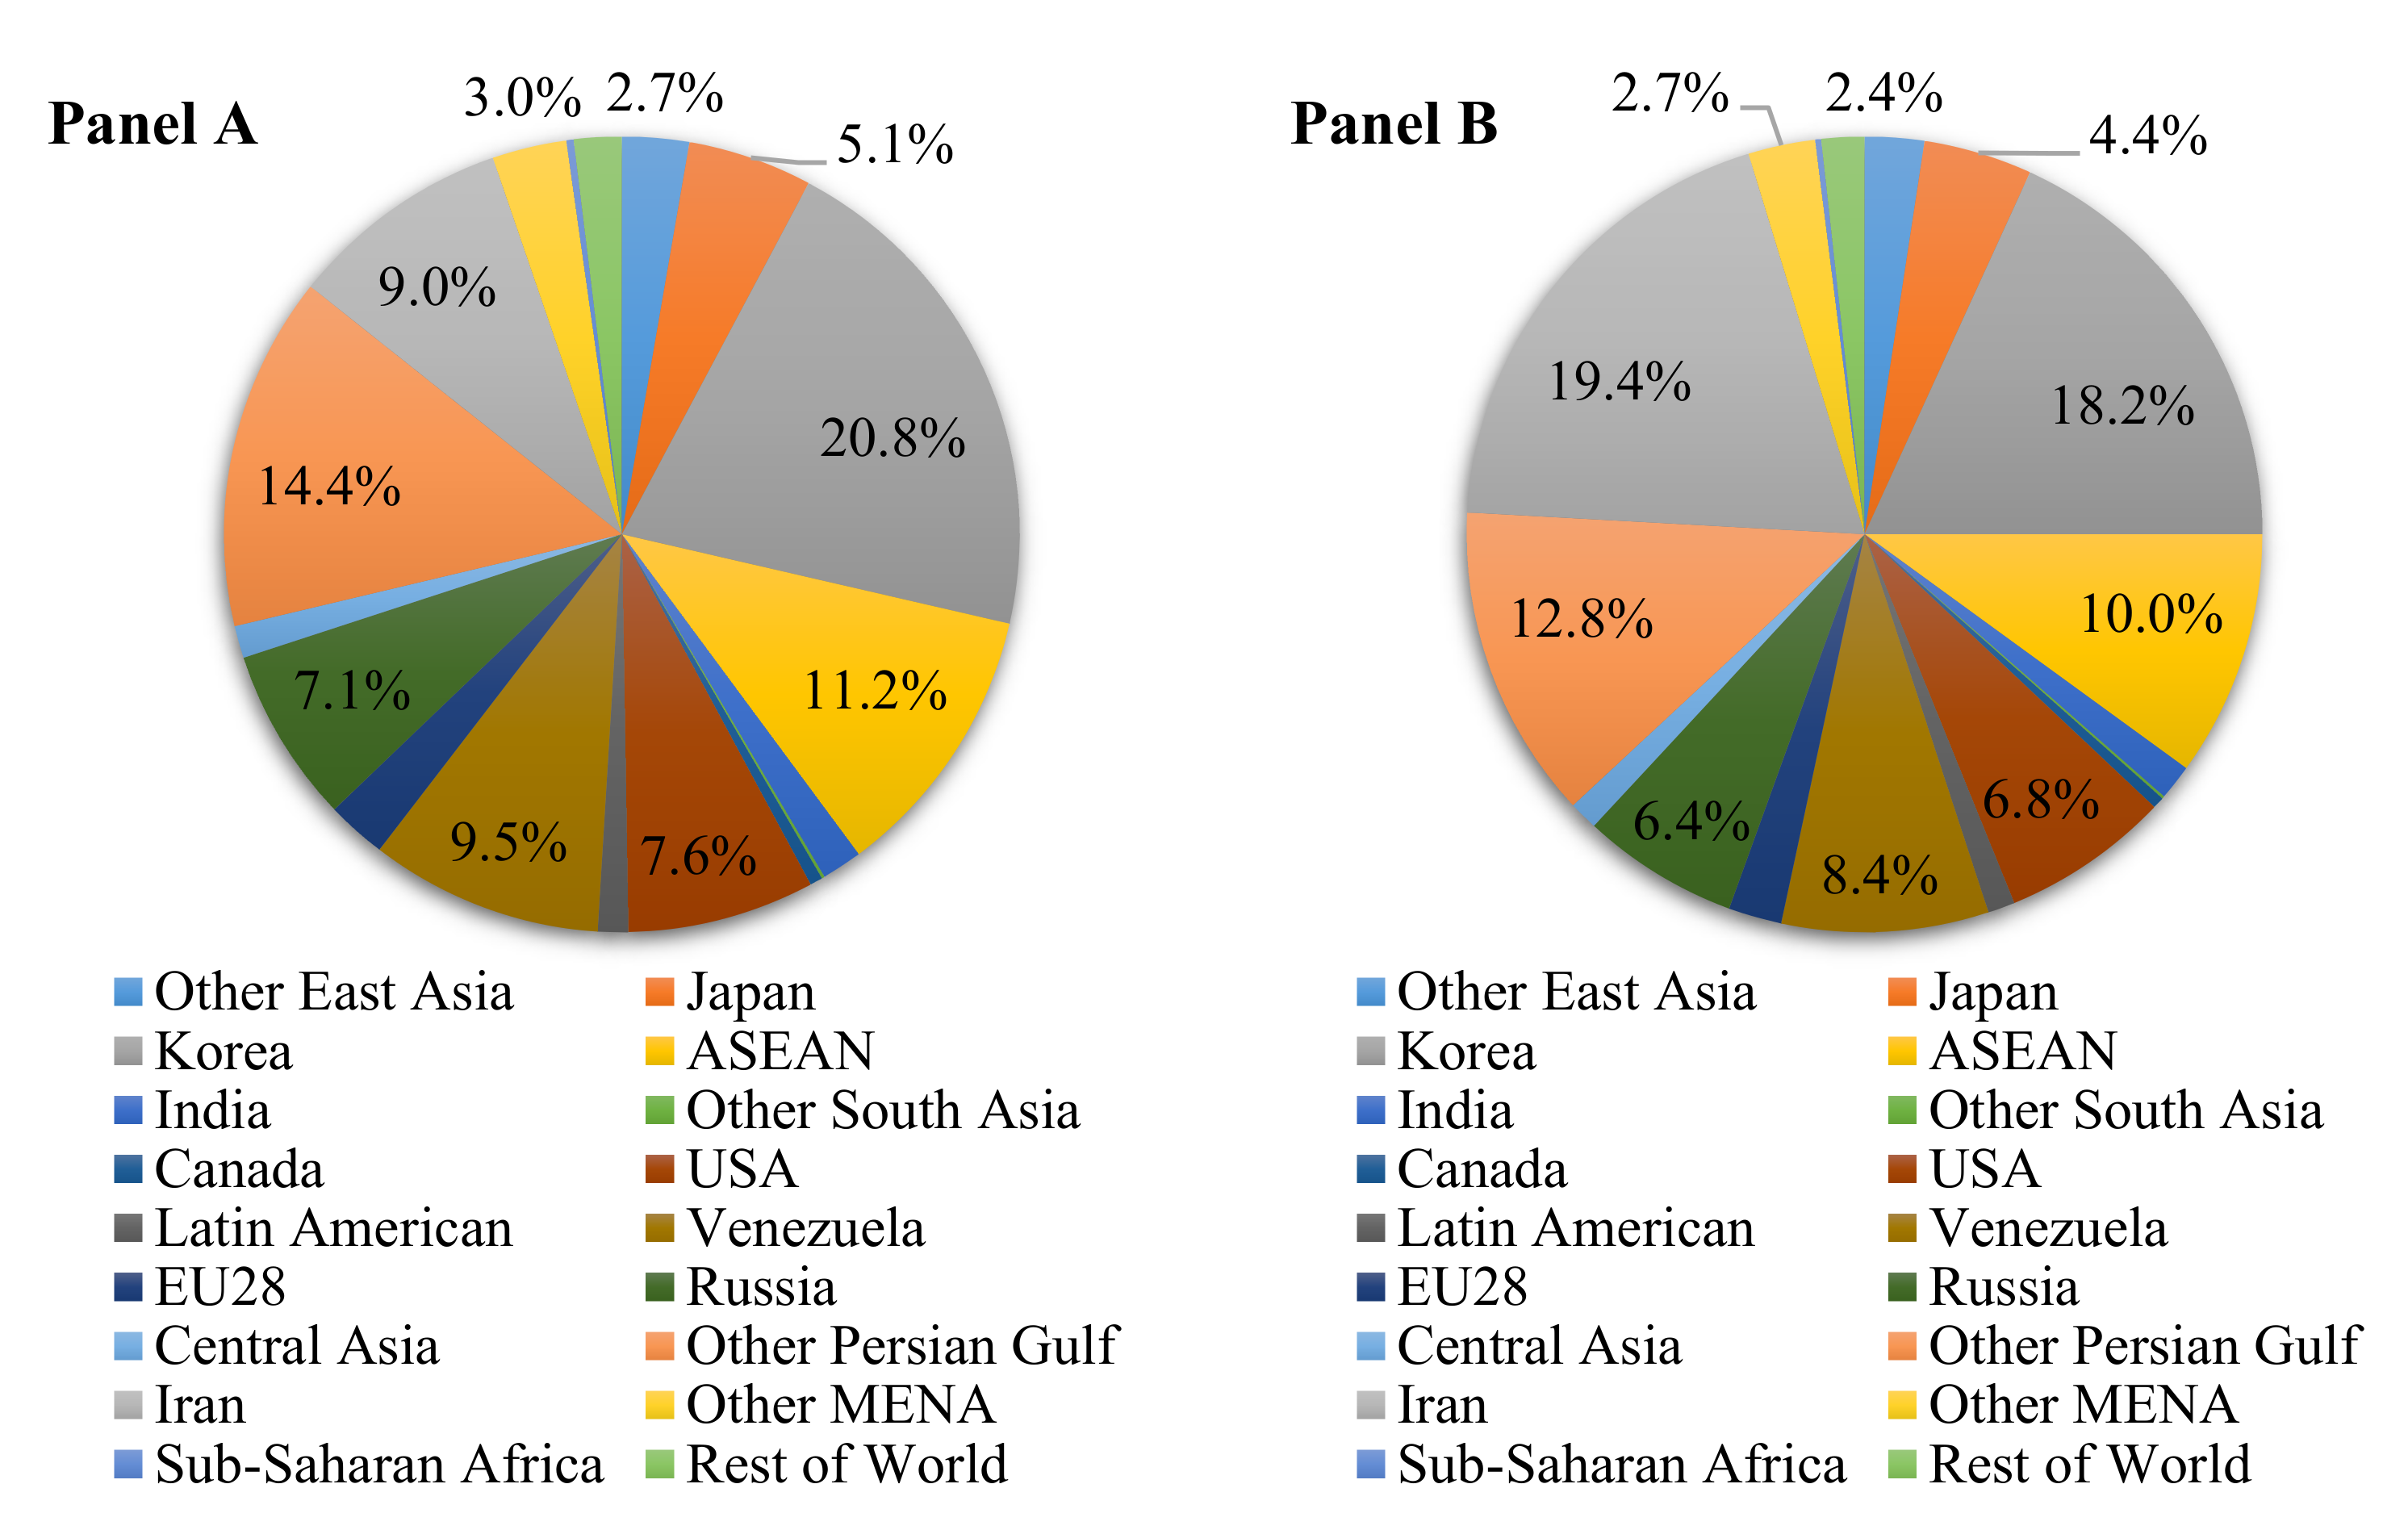
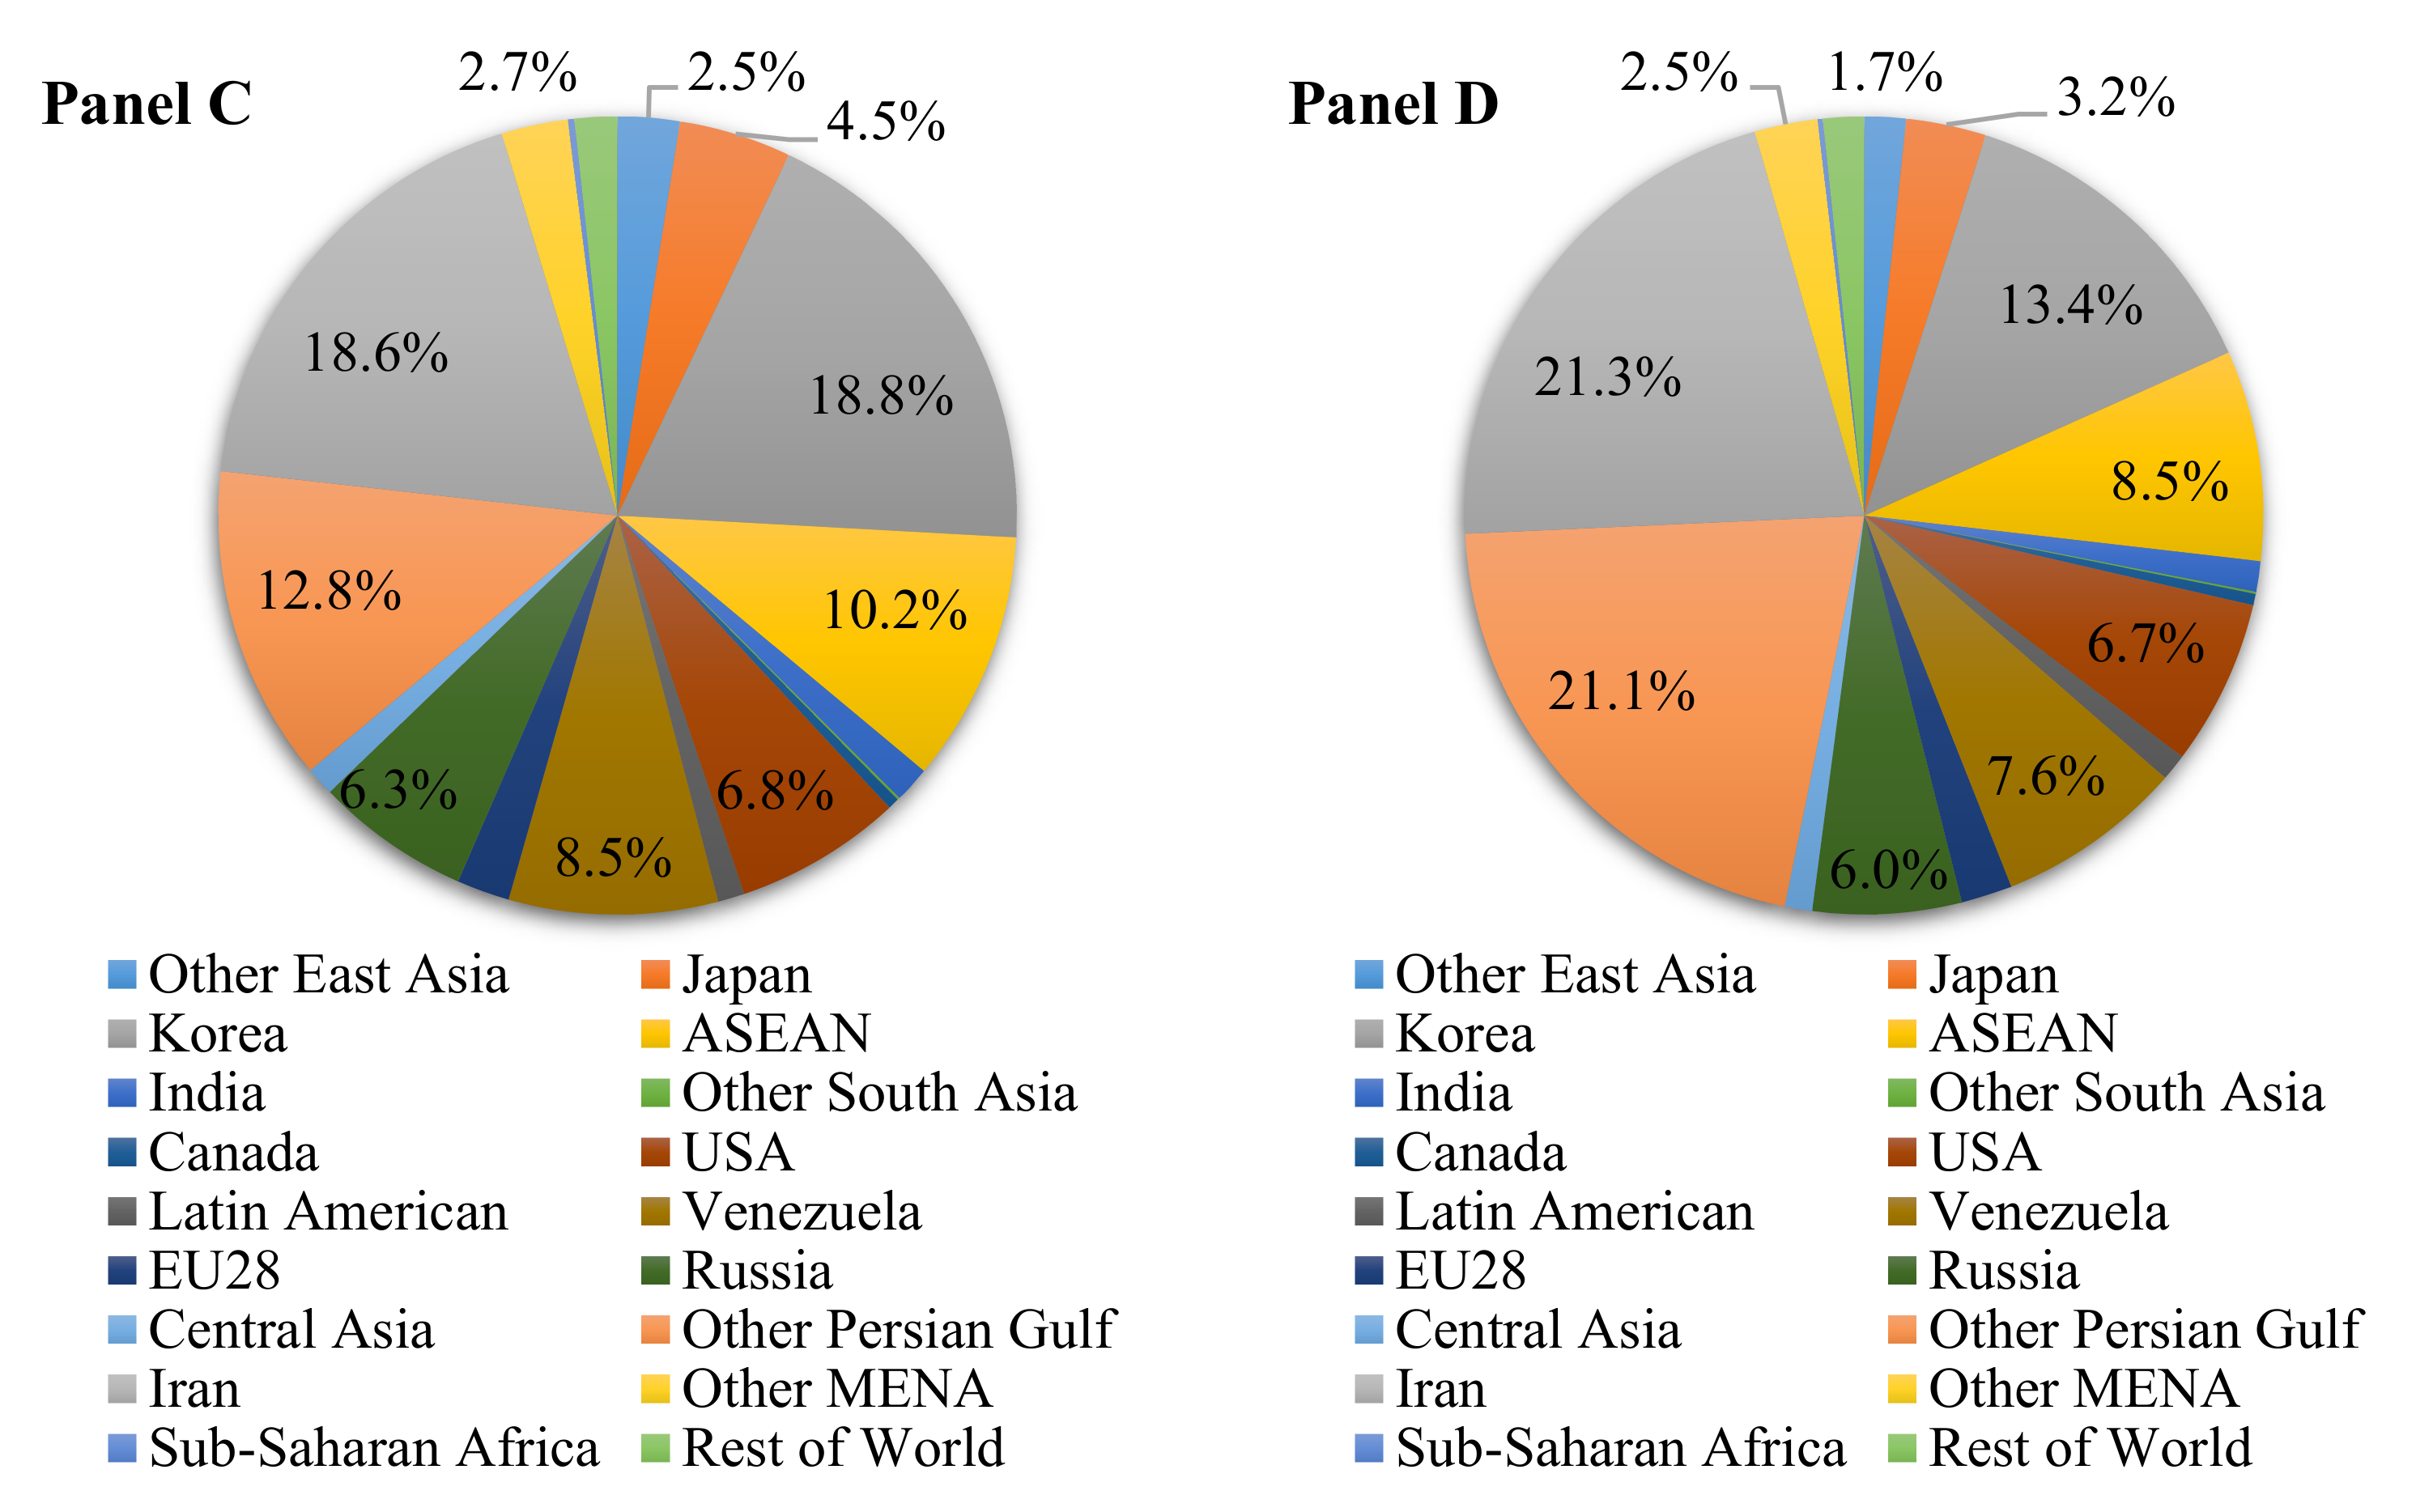
Compared to oil and gas, China’s petroleum product import sources are relatively diverse. In the base data, South Korea (20.8%), other Persian Gulf countries (14.4%), ASEAN countries (11.2%), Venezuela (9.5%) and Iran (9.0%) make up the top five petroleum products import sources for China (Panel A, Figure 5).
Under S1, the sanctions can be expected to have the effect of making Iran transfer its export activities towards exporting more petroleum products, causing the proportion imported to China from Iran to rise to 19.4% (Panel B, Figure 5) and the proportions from South Korea (18.2%), other Persian Gulf countries (12.8%), ASEAN (10.0%) and Venezuela (8.4%) to decrease. If the spare oil production capacity in other Persian Gulf countries is fully utilized, as occurs under S2, the proportion from Iran can be expected to decrease by 0.8% compared to S1, whereas that from South Korea would increase by 0.6% (Panel C, Figure 5). In comparison, the situation with respect to the proportions sourced from other Persian Gulf countries, ASEAN and Venezuela is predicted to remain relatively stable. If oil exports from other Persian Gulf countries become reduced, as seen under S3, the proportion sourced from South Korea in China’s petroleum product imports is simulated to decrease to 13.4%, dropping below that sourced from Iran (21.3%) and other Persian Gulf countries (21.1%). Moreover, petroleum product exports to China from ASEAN nations and Venezuela are predicted to decrease, accounting for 8.5% and 7.6%, respectively, of China’s petroleum product imports.
4.3. Impacts of International Conflict on Non-Energy Sectors
The simulation results indicate that sanctions have negative impacts on the output and trade of most non-energy sectors (Table 4).
Under S1, the chemical products sector is the most damaged (decreased by 0.093%) due to the expected increase in imports (0.339%), which reduces its competitive advantage in the international market. The downstream and upstream sectors along the production chain of the energy sectors are the next most severely affected by the conflict. In the major downstream sectors, the construction output is predicted to fall to 0.064%, followed by services (0.038%) and heavy manufacturing (0.035%). Increased energy prices would raise the production costs for these downstream sectors, which is expected to lead to decreased output. For the main upstream sectors, mineral products (down 0.070%) suffer from sanctions due to the reduced demand for raw materials in the energy sector. The only sector to benefit is the export-oriented sector of light manufacturing, of which the exports are predicted to rise by 0.151%. Agriculture and processed food are the least negatively affected sectors, reducing only slightly, by 0.015% and 0.017%, respectively.
When the spare oil capacity in other Persian Gulf countries is used (S2), accompanied by decreased energy prices, the negative impacts on construction (0.110%), heavy manufacturing (0.099%), services (0.037%), processed food (0.016%), agriculture (0.001%) and mineral products (0.002%) are largely offset, even becoming positive. The output from the chemical products sector further decreases by 0.151% because its imports are predicted to increase sharply (0.769%). Meanwhile, declining light manufacturing exports lead to a slight decrease in the net output.
Under S3, the changes to the outputs from all non-energy sectors are the opposite of those modeled under S2; that is, the output losses from the upstream and downstream energy sectors are calculated to increase, whereas the impacts on light manufacturing and chemical products are expected to be reduced.
4.4. Impacts of International Conflict on Real GDP
Extended USA–Iran tensions could not only threaten Chinese energy security but also have significant impacts on global economic growth, as represented by the real GDP reductions listed in Table 5.
Under S1, a full embargo on Iran’s oil exports would result in a sharp decline in its real GDP (by 0.647%). Meanwhile, the countries most damaged by the sanctions are Asian, including China (down 0.047%), Japan (0.076%), South Korea (down 0.122%) and India (losing 0.174%). Real GDP losses for other East Asian and South Asian countries are expected to be relatively slight, at <0.008%. As the main oil exporters in the world, Central Asia (up 0.023%), other Persian Gulf countries (up 0.020%), Venezuela (up 0.016%) and Latin America (up 0.005%) benefit from the rising oil prices and have slightly higher GDPs.
Under S2 conditions, with the spare oil production capacity from other Persian Gulf countries being fully utilized, the estimated real GDP damage to oil-importing countries would be partly offset and the GDP losses estimated for China (down 0.024%), Japan (down 0.013 %), South Korea (down 0.056%) and India (down 0.103%) would be comparatively minor. The real GDP for other East Asian countries and other South Asian countries would increase under this scenario. Similarly, under S2, the real GDP for other Persian Gulf countries would rise significantly by 2.92% because of their increased oil production revenues. However, the GDP changes estimated for Central Asian countries, Venezuela, and Latin American countries are negative (down 0.04%) due to the reduced global oil prices and exports. Likewise, the GDPs of the EU28 (0.021%), other East Asian countries (0.010%), other South Asian countries (0.004%) and the USA (0.005%) change only slightly.
When the oil transport corridor through the Hormuz Strait is disturbed (S3), the simulations suggest that most countries, particularly those in Asia, would suffer more economic loss, estimating that the GDPs of China, Japan, South Korea and India would decline by 0.342%, 0.884%, 1.619% and 1.250%, respectively. Furthermore, as decreased oil exports from the Persian Gulf would most likely lead to further increases in global oil prices, the GDP would decline in the EU28 (−0.164%), other East Asian countries (−0.861%), other South Asian countries (−0.282%) and the USA (−0.111%). The GDPs for major oil-exporting countries—such as Canada (0.013%), Latin America (0.026%), Venezuela (0.134%) and Central Asia (0.212%)—could slightly increase, driven by the sharp increase in oil prices, whereas Russia’s GDP could decrease by 0.791%, due to its reduced exports.
5. Conclusions and Policy Implications
5.1. Conclusions
International conflicts threaten energy security and economic growth in energy-importing countries by causing energy price fluctuations and disrupting global energy supplies. Few studies have looked into this, however, and the impact mechanisms and implications of international conflict on the energy security and economies of energy-importing countries, such as China, remain unclear. In this context, this paper considered potential developments in the conflict between the US and Iran, and developed three illustrative scenarios, including the imposition of a full embargo on Iranian oil exports, increased oil production by other Persian Gulf oil producers, and reduced oil exports from Persian Gulf countries due to the disruption of the Hormuz Strait oil transport corridor. A global energy-extensive CGE model, GTAP-E, was applied to simulate the likely impacts from such USA–Iran tension scenarios on China’s energy production, trade and supply, as well as on sectoral output and economic growth. The major conclusions from this study can be summarized as follows.
First, the negative impacts of the US–Iran tension on China’s energy output, trade and supply are comparatively limited when the conflict is restricted to a simple embargo on Iranian oil exports (S1), and could largely be alleviated if spare oil production capacity in other Persian Gulf producers is available (S2). Once Persian Gulf oil exports are effectively curtailed, however (S3), the output, trade and supply from each Chinese energy sector (excluding electricity) could be expected to fluctuate significantly. Affected by the sharp decrease in oil imports, China’s oil price (4.795%) and output (16.609%) could increase significantly, whereas the output of gas (−9.588%) could decline sharply due to a large decrease in gas exports (−40.868%). From the perspective of energy import sources, China’s imports of oil, gas, and petroleum products are heavily dependent on Iran and the other Persian Gulf countries. Therefore, US–Iran tensions could threaten China’s energy security directly, by affecting energy prices, energy supplies and import sources.
Second, our modeling suggests that international conflicts also have negative impacts on the output and trade of most non-energy sectors. The downstream and upstream sectors along energy sector production chains are seen to be severely affected by the conflict, with light manufacturing being the only sector benefiting. Increased energy prices could greatly increase downstream sector production costs, decreasing outputs from the construction (−0.064%), service (−0.038%) and heavy manufacturing (−0.035%) sectors. Mineral products (down 0.070%) suffer from sanctions due to decreasing demand from energy sectors. In addition, the negative impacts on most non-energy sectors are predicted to be largely offset under S2, in which the spare oil production capacity from other Persian Gulf countries becomes available. However, it could be aggravated if oil exports from these countries are subsequently reduced, as is modeled under S3.
Third, the USA–Iran tension could not only threaten Chinese energy security but could also have negative impacts on economic growth. Under S1, a full embargo on Iran’s oil exports is expected to impede its exports, indirectly resulting in a decline in China’s real GDP (−0.047%). Compared with sole sanctions, any subsequent escalation in USA–Iran tension—including consequential actions by other Persian Gulf countries and Iran’s resistance to sanctions—could influence the extent of the impacts to China’s economic growth. The simulation results suggest that increased oil production by other Persian Gulf countries would partly buffer the declining trend in China’s real GDP (reducing it to −0.024%). However, under a scenario in which oil exports from the Persian Gulf are completely curtailed, global oil prices could rise sharply, causing China to suffer greater economic losses (decreasing the GDP by 0.342%)
5.2. Policy Implications
The modeling conclusions derived in Section 5.1 helped the authors to identify a series of improvement policies that could buffer the anticipated impacts. First, as a major energy policy objective, China should implement energy import diversification in order to reduce the high level of reliance on imported fossil fuels, and to narrow the gap in the energy supply. Taking oil imports as an example, efforts could be made to move away from a high dependence on oil imports from Persian Gulf countries towards a more diverse suite of suppliers—such as Sub-Saharan Africa and Russia—to make China less dependent on vessels transiting the Hormuz Strait, and to effectively reduce this energy supply risk. Second, policies involving the government providing market support and buffering reactive mechanisms need to be executed in order to optimize the energy supply structure and reduce the effects of the external market instability caused by international conflicts. These measures include enlarging the strategic oil reserve, developing and applying low-carbon technologies, improving energy efficiency, and encouraging renewable energy development. Finally, in order to effectively obtain oil and gas resources, China should strengthen international energy cooperation by accelerating its investment in overseas energy equipment and actively pursuing additional belt and road initiatives (known in Chinese, and formerly in English, as One Belt One Road, or OBOR, partnerships) and other international energy partnerships.
In this paper, we presented an illustrative study on international conflict, with a focus on potential ramifications for China’s energy security and economic growth, considering impact mechanisms. The three scenarios developed in this study were somewhat simplistic, however, and additional factors—such as developing other oil transport corridors in China, increasing oil imports from other sources, energy substitutes and global environmental conventions on limiting the utilization of fossil fuel energy—should also be taken into account in future scenarios. It can be said, however, that while somewhat over-simplified, this study offers a quantified assessment of the ways in which the USA–Iran tension, as a representative international conflict, could have significant impacts on China’s energy security and economic growth. The analysis thus also highlights the importance of reducing the shocks from the international conflict and ensuring energy supply for China.
The evolution of USA–Iran tension has remained complicated and difficult to predict, as the multiple involved parties have much differentiated objectives and preferences. However, a major barrier for the CGE-based assessment of the international conflicts is keeping up with the policy changes in a timely manner. There are numerous ongoing actions of participants in the complex international energy game, which should be studied in the future, such as the decreasing energy prices, China’s domestic energy policies and OPEC’s internal conflicts. Moreover, in order to mitigate the threats to the oil supply, China may tend to invest in oil reserve facilities at home and abroad, and increase its oil reserves, which could alleviate the oil shortage and smooth oil price fluctuations in the short term. However, the GTAP-E model does not depict the oil reserves of countries, and may thus overestimate the impacts of the sanction on China’s energy security and economic growth, which is another limitation of the GTAP-E model. Future studies should lay emphasis on the effect of oil reserves on China’s energy security and economic growth.
In addition to the severe threats to China’s energy security and economic growth, the sanctions would also cause great fluctuations in the economic growth of other oil-importing countries, such as Japan, South Korea and India. Thus, this study has significant policy implications, as it not only presents a detailed assessment of the impact of the potential USA–Iran tension escalation on energy security and economic growth in China but also provides guidance for other energy-importing countries by offering insights about the mitigation of the damage caused by international conflicts. For example, energy-importing countries should establish more diversified oil import channels in the complex international energy campaign.
Author Contributions
Conceptualization, X.H. and Q.C.; methodology, Q.C. and L.H.; validation, X.H.; formal analysis, X.H. and L.H.; writing—original draft preparation, X.H. and L.H.; writing—review and editing, L.H. and Q.C.; visualization, X.H.; supervision, Q.C. and L.H. All authors have read and agreed to the published version of the manuscript.
Funding
This research was funded by National Key R&D Program of China, grant number 2016YFA0602503, and the National Natural Science Foundation of China, grant numbers 72073010, 71761137001, and 71903014.
Institutional Review Board Statement
Not applicable.
Informed Consent Statement
Not applicable.
Data Availability Statement
Data is contained within the article.
Conflicts of Interest
The authors declare no conflict of interest.
Appendix A

Table A1.
The regional matching concordance between this study and the GTAP V10 Database.
| Countries/Regions in this Study | Countries/Regions in GTAP V10 Database |
|---|---|
| China | China |
| Other East Asia | Hong Kong, Mongolia, Taiwan, and rest of East Asia |
| Japan | Japan |
| Korea | Korea |
| ASEAN | Brunei Darussalam, Cambodia, Indonesia, Lao People’s Democratic Republic, Malaysia, Philippines, Singapore, Thailand, Viet Nam, and rest of Southeast Asia |
| India | India |
| Other South Asia | Bangladesh, Nepal, Pakistan, Sri Lanka, and rest of South Asia |
| Canada | Canada |
| USA | United States of America |
| Latin American | Mexico, Rest of North America, Argentina, Bolivia, Brazil, Chile, Colombia, Ecuador, Paraguay, Peru, Uruguay, Rest of South America, Costa Rica, Guatemala, Honduras, Nicaragua, Panama, El Salvador, Rest of Central America, Dominican Republic, Jamaica, Puerto Rico, Trinidad and Tobago, Caribbean |
| Venezuela | Venezuela |
| E.U. 28 | Austria, Belgium, Bulgaria, Croatia, Cyprus, Czech Republic, Denmark, Estonia, Finland, France, Germany, Greece, Hungary, Ireland, Italy, Latvia, Lithuania, Luxembourg, Malta, Netherlands, Poland, Portugal, Romania, Slovakia, Slovenia, Norway, Albania, Belarus |
| Russia | Russian Federation |
| Central Asia | Kazakhstan, Kyrgyzstan, Tajikistan, and rest of Former Soviet Union |
| Other Persian Gulf | Bahrain, Kuwait, Qatar, Saudi Arabia, United Arab Emirates, Rest of Western Asia |
| Iran | Islamic Republic of Iran |
| Other MENA | Israel, Jordan, Oman, Turkey, Egypt, Morocco, Tunisia, Rest of North Africa |
| Sub-Saharan Africa | Benin, Burkina Faso, Cameroon, Cote d’Ivoire, Ghana, Guinea, Nigeria, Senegal, Togo, Rest of Western Africa, Central Africa, South Central Africa, Ethiopia, Kenya, Madagascar, Malawi, Mauritius, Mozambique, Rwanda, Tanzania, Uganda, Zambia, Zimbabwe, Rest of Eastern Africa, Botswana, Namibia, South Africa, Rest of South African Customs Union |
| Rest of World | Rest of World |
Table A2.
The sectorial matching concordance between this study and the GTAP V10 Database.
| Sectors in this Study | Sectors in GTAP V10 Database |
|---|---|
| Agriculture | Paddy rice, Wheat, Cereal grains nec, Vegetables, fruit, nuts, Oil seeds, Sugar cane, sugar beet, Plant-based fibers, Crops nec, Bovine cattle, sheep and goats, horses, Animal products nec, Raw milk, Wool, silk-worm cocoons, Forestry, Fishing |
| Coal | Coal |
| Oil | Oil |
| Gas | Gas |
| Mineral products | Other Extraction (formerly omn Minerals nec) |
| Processed food | Bovine meat products, Meat products nec, Vegetable oils and fats, Dairy products, Processed rice, Sugar, Food products nec, Beverages and tobacco products |
| Light manufacturing | Textiles, Wearing apparel, Leather products, Wood products, Paper products, publishing |
| Petroleum products | Petroleum, coal products |
| Chemical products | Chemical products, Basic pharmaceutical products, Rubber and plastic products |
| Heavy manufacturing | Mineral products nec, Ferrous metals, Metals nec, Metal products, Computer, electronic and optical products, Electrical equipment, Machinery and equipment nec, Motor vehicles and parts, Transport equipment nec, Manufacturing nec |
| Electricity | Electricity |
| Gas supply | Gas manufacture, distribution |
| Construction | Construction |
| Services | Water, Trade, Accommodation, Food and service activities, Transport nec, Water transport, Air transport, Warehousing and support activities, Communication, Financial services nec, Insurance (formerly isr), Real estate activities, Business services nec, Recreational and other services, Public Administration and defense, Education, Human health and social work activities, Dwellings |
References
- Nyman, E. Offshore oil development and maritime conflict in the 20th century: A statistical analysis of international trends. Energy Res. Soc. Sci. 2015, 6, 1–7. [Google Scholar] [CrossRef]
- Noguera-Santaella, J. Geopolitics and the oil price. Econ. Model. 2016, 52, 301–309. [Google Scholar] [CrossRef]
- He, S.; Guo, K. Examination of the energy trading status of China and India and the prospect for cooperation. Procedia Comput. Sci. 2019, 162, 819–826. [Google Scholar] [CrossRef]
- Xia, Y.; Kong, Y.; Ji, Q.; Zhang, D. Impacts of China-US trade conflicts on the energy sector. China Econ. Rev. 2019, 58, 101360. [Google Scholar] [CrossRef]
- Estrada, M.A.R.; Park, D.; Tahir, M.; Khan, A. Simulations of US-Iran war and its impact on global oil price behavior. Borsa Istanb. Rev. 2020, 20, 1–12. [Google Scholar] [CrossRef]
- Malik, S.; Qasim, M.; Saeed, H.; Chang, Y.; Taghizadeh-Hesary, F. Energy security in Pakistan: Perspectives and policy implications from a quantitative analysis. Energy Policy 2020, 144, 111552. [Google Scholar] [CrossRef]
- Blockmans, S. Crimea and the quest for energy and military hegemony in the Black Sea region: Governance gap in a contested geostrategic zone. Southeast Eur. Black Sea Stud. 2015, 15, 179–189. [Google Scholar] [CrossRef]
- Rodríguez-Fernández, L.; Carvajal, A.B.F.; Ruiz-Gómez, L.M. Evolution of European Union’s energy security in gas supply during Russia–Ukraine gas crises (2006–2009). Energy Strategy Rev. 2020, 30, 100518. [Google Scholar] [CrossRef]
- Westphal, K. Russian Energy Supplies to Europe: The Crimea Crisis: Mutual Dependency, Lasting Collateral Damage and Strategic Alternatives for the European Union; Stiftung Wissenschaft und Politik; German Institute for International and Security Affairs: Berlin, Germany, 2014. [Google Scholar]
- San-Akca, B.; Sever, S.D.; Yilmaz, S. Does natural gas fuel civil war? Rethinking energy security, international relations, and fossil-fuel conflict. Energy Res. Soc. Sci. 2020, 70, 101690. [Google Scholar] [CrossRef]
- Dorraj, M.; English, J. China’s Strategy for Energy Acquisition in the Middle East: Potential for Conflict and Cooperation With the United States. Asian Politics Policy 2012, 4, 173–191. [Google Scholar] [CrossRef]
- Jaffe, A.M.; Elass, J. War and the oil price cycle. J. Int. Aff. 2015, 69, 121–137. [Google Scholar]
- Aloosh, M.; Salavati, A.; Aloosh, A. Economic sanctions threaten population health: The case of Iran. Public Health 2019, 169, 10–13. [Google Scholar] [CrossRef]
- Wen, J.; Zhao, X.; Wang, Q.J.; Chang, C.P. The impact of international sanctions on energy security. Energy Environ. 2020, 32, 458–480. [Google Scholar] [CrossRef]
- Fayazmanesh, S. The Politics of the U.S. Economic Sanctions against Iran. Rev. Radic. Political Econ. 2003, 35, 221–240. [Google Scholar] [CrossRef]
- Wright, R.B. The Iran Primer: Power, Politics, and U.S. Policy; U.S. Institute of Peace Press: Washington, DC, USA, 2010.
- Hufbauer, G.C.; Elliott, K.A.; Cyrus, T.; Winston, E. US Economic Sanctions: Their Impact on Trade, Jobs, and Wages; Working Paper Series Working Paper Special (2); Peterson Institute for International Economics: Washington, DC, USA, 1997. [Google Scholar]
- Torbat, A.E. Impacts of the US Trade and Financial Sanctions on Iran. World Econ. 2005, 28, 407–434. [Google Scholar] [CrossRef]
- Habibi, N. The Impact of Sanctions on Iran-GCC Economic Relations; Middle East Brief: Waltham, MA, USA, 2010; pp. 4–11. [Google Scholar]
- Farhidi, F.; Madani, K. A Game Theoretic Analysis of the Conflict over Iran’s Nuclear Program. In Proceedings of the 2015 IEEE International Conference on Systems, Man, and Cybernetics, Hong Kong, China, 9–12 October 2015; IEEE: Piscataway, NJ, USA, 2015; pp. 617–622. [Google Scholar]
- Terry, P.C.R. Letter to the Journal Unilateral Economic Sanctions and Their Extraterritorial Impact: One Foreign Policy for All? Chin. J. Int. Law 2019, 18, 425–435. [Google Scholar] [CrossRef]
- Torbat, A.E. The Nuclear Agreement’s Aftermath. In Politics of Oil and Nuclear Technology in Iran; Palgrave Macmillan: Cham, Switzerland, 2020; pp. 287–311. [Google Scholar]
- Chen, M.T. U.S. Treasury Secretary Announces Additional Sanctions against Iran against Senior Officials and Steel Industry. China News Network, 2020. Available online: http://www.chinanews.com/gj/2020/01-11/9056876.shtml (accessed on 11 January 2020).
- Cherkaoui, M. Trump’s Withdrawal from the Iran Nuclear Deal: Security or Economics? Al Jazeera, 10 May 2018. [Google Scholar]
- Werner, M.J.; Kampouridi, J.; Ryzgelyte, L. Undertakings caught in the crossfire: US sanctions on Iran vs. the EU Blocking Regulation and possible compensation as State aid. ERA Forum 2019, 20, 63–79. [Google Scholar] [CrossRef]
- Selmi, R.; Bouoiyour, J.; Miftah, A. Oil price jumps and the uncertainty of oil supplies in a geopolitical perspective: The role of OPEC’s spare capacity. Int. Econ. 2020, 164, 18–35. [Google Scholar] [CrossRef]
- Cooper, A.S. The Oil Kings: How the US, Iran, and Saudi Arabia Changed the Balance of Power in the Middle East; Simon and Schuster: New York, NY, USA, 2012. [Google Scholar]
- Chubin, S.; Tripp, C. Iran-Saudi Arabia Relations and Regional Order; Routledge: Abingdon-on-Thames, UK, 2014. [Google Scholar]
- Bollino, C.A.; Efird, B.; Hasanov, F.; Hatipoğlu, E. Iran Sanctions: Implications for the Oil Market; KAPSARC (King Abdullah Petroleum Studies and Research Center): Riyadh, Saudi Arabia, 2019. [Google Scholar]
- Ratner, M. Iran’s Threats, the Strait of Hormuz, and Oil Markets: In Brief. FAS, 2018. Available online: https://fas.org/sgp/crs/mideast (accessed on 6 August 2018).
- Shepard, J.U.; Pratson, L.F. Maritime piracy in the Strait of Hormuz and implications of energy export security. Energy Policy 2020, 140, 111379. [Google Scholar] [CrossRef]
- Cimino-Isaacs, C.D.; Katzman, K. Iran’s Expanding Economic Relations with Asia. Curr. Politics Econ. Middle East 2019, 10, 149–152. [Google Scholar]
- Barber, B.B. Sanctions and Interventions. In Japan’s Relations with Muslim Asia; Palgrave Macmillan: Cham, Switzerland, 2020; pp. 185–220. [Google Scholar]
- Bambawale, M.J.; Sovacool, B.K. China’s energy security: The perspective of energy users. Appl. Energy 2011, 88, 1949–1956. [Google Scholar] [CrossRef]
- Odgaard, O.; Delman, J. China’s energy security and its challenges towards 2035. Energy Policy 2014, 71, 107–117. [Google Scholar] [CrossRef]
- Esen, Ö.; Bayrak, M. Does more energy consumption support economic growth in net energy-importing countries? J. Econ. Financ. Adm. Sci. 2017, 22, 75–98. [Google Scholar] [CrossRef]
- Shepard, J.U.; Pratson, L.F. Hybrid input-output analysis of embodied energy security. Appl. Energy 2020, 279, 115806. [Google Scholar] [CrossRef]
- National Bureau of Statistics of the People’s Republic of China. Total Energy Consumption [EB/OL]. 2020. Available online: https://data.stats.gov.cn/easyquery.htm?cn=C01 (accessed on 18 January 2020). (In Chinese).
- Xue, M.M.; Wu, G.; Wang, Q.; Yao, Y.F.; Liang, Q.M. Socioeconomic impacts of a shortage in imported oil supply: Case of China. Nat. Hazards 2019, 99, 1415–1430. [Google Scholar] [CrossRef]
- UN Comtrade. International Trade Statistical Database. 2020. Available online: https://comtrade.un.org (accessed on 1 October 2020).
- Dong, Y.; Li, C. Economic sanction games among the US, the EU and Russia: Payoffs and potential effects. Econ. Model. 2018, 73, 117–128. [Google Scholar] [CrossRef]
- Han, B. The role and welfare rationale of secondary sanctions: A theory and a case study of the U.S. sanctions targeting Iran. Confl. Manag. Peace Sci. 2018, 35, 474–502. [Google Scholar] [CrossRef]
- Dreger, C.; Kholodilin, K.A.; Ulbricht, D.; Fidrmuc, J. Between the hammer and the anvil: The impact of economic sanctions and oil prices on Russia’s ruble. J. Comp. Econ. 2016, 44, 295–308. [Google Scholar] [CrossRef] [Green Version]
- Crozet, M.; Hinz, J. Friendly fire: The trade impact of the Russia sanctions and counter-sanctions. Econ. Policy 2020, 35, 97–146. [Google Scholar] [CrossRef]
- Vatansever, A. Put over a barrel? “Smart” sanctions, petroleum and statecraft in Russia. Energy Res. Soc. Sci. 2020, 69, 101607. [Google Scholar] [CrossRef]
- Nakhli, S.R.; Rafat, M.; Dastjerdi, R.B.; Rafei, M. Oil sanctions and their transmission channels in the Iranian economy: A DSGE model. Resour. Policy 2021, 70, 101963. [Google Scholar] [CrossRef]
- Iranmanesh, S.; Salehi, N.; Jalaee, S.A. Using the fuzzy logic approach to extract the index of economic sanctions in the Islamic Republic of Iran. MethodsX 2021, 8, 101301. [Google Scholar] [CrossRef]
- Farzanegan, M.R.; Hayo, B. Sanctions and the shadow economy: Empirical evidence from Iranian provinces. Appl. Econ. Lett. 2019, 26, 501–505. [Google Scholar] [CrossRef]
- Gharibnavaz, M.R.; Waschik, R.G. A computable general equilibrium model of international sanctions in Iran. World Econ. 2018, 41, 287–307. [Google Scholar] [CrossRef]
- Gharehgozli, O. An estimation of the economic cost of recent sanctions on Iran using the synthetic control method. Econ. Lett. 2017, 157, 141–144. [Google Scholar] [CrossRef]
- Colgan, J.D. Oil, Domestic Politics, and International Conflict. Energy Res. Soc. Sci. 2014, 1, 198–205. [Google Scholar] [CrossRef]
- Månsson, A. Energy, conflict and war: Towards a conceptual framework. Energy Res. Soc. Sci. 2014, 4, 106–116. [Google Scholar] [CrossRef] [Green Version]
- Shapovalova, D.; Galimullin, E.; Grushevenko, E. Russian Arctic offshore petroleum governance: The effects of western sanctions and outlook for northern development. Energy Policy 2020, 146, 111753. [Google Scholar] [CrossRef]
- Boogaerts, A.; Drieskens, E. Lessons from the MENA region: A configurational explanation of the (in) effectiveness of UN Security Council sanctions between 1991 and 2014. Mediterr. Politics 2020, 25, 71–95. [Google Scholar] [CrossRef]
- Fischhendler, I.; Herman, L.; Maoz, N. The political economy of energy sanctions: Insights from a global outlook 1938–2017. Energy Res. Soc. Sci. 2017, 34, 62–71. [Google Scholar] [CrossRef]
- Sovacool, B.K.; Brown, M.A. Competing Dimensions of Energy Security: An International Perspective. Annu. Rev. Environ. Resour. 2010, 35, 77–108. [Google Scholar] [CrossRef] [Green Version]
- Umbach, F. Global energy security and the implications for the E.U. Energy Policy 2010, 38, 1229–1240. [Google Scholar] [CrossRef]
- Ji, Q.; Zhang, H.-Y.; Fan, Y. Identification of global oil trade patterns: An empirical research based on complex network theory. Energy Convers. Manag. 2014, 85, 856–865. [Google Scholar] [CrossRef]
- Winkler, H.; Simões, A.F.; la Rovere, E.L.; Alam, M.; Rahman, A.; Mwakasonda, S. Access and Affordability of Electricity in Developing Countries. World Dev. 2011, 39, 1037–1050. [Google Scholar] [CrossRef]
- Sovacool, B.K. An international assessment of energy security performance. Ecol. Econ. 2013, 88, 148–158. [Google Scholar] [CrossRef]
- Barros, C.P.; Gil-Alana, L.A.; Payne, J.E. An analysis of oil production by OPEC countries: Persistence, breaks, and outliers. Energy Policy 2011, 39, 442–453. [Google Scholar] [CrossRef] [Green Version]
- Le, T.-H.; Nguyen, C.P. Is energy security a driver for economic growth? Evidence from a global sample. Energy Policy 2019, 129, 436–451. [Google Scholar] [CrossRef]
- Ahmadi, A. The impact of economic sanctions and the JCPOA on energy sector of Iran. Glob. Trade Cust. J. 2018, 13, 198–223. [Google Scholar]
- Liudmila, P.; Ehsan, R. Have sanctions modified iran’s trade policy? An evidence of asianization and de-europeanization through the gravity model. Economies 2016, 4, 24. [Google Scholar]
- Esfahani, M.N.; Rasoulinezhad, E.; Bahmani-Oskooee, M. Iran’s trade policy of Asianization and de-Europeanization under sanctions. J. Econ. Stud. 2018, 44, 552–567. [Google Scholar] [CrossRef]
- Du, L.; Yanan, H.; Wei, C. The relationship between oil price shocks and China’s macro-economy: An empirical analysis. Energy Policy 2010, 38, 4142–4151. [Google Scholar] [CrossRef]
- Elder, J. Employment and energy uncertainty. J. Econ. Asymmetries 2020, 21, e00159. [Google Scholar] [CrossRef]
- Koirala, N.P.; Ma, X. Oil price uncertainty and U.S. employment growth. Energy Econ. 2020, 91, 104910. [Google Scholar] [CrossRef]
- Yuan, M.; Zhang, H.; Wang, B.; Huang, L.; Fang, K.; Liang, Y. Downstream oil supply security in China: Policy implications from quantifying the impact of oil import disruption. Energy Policy 2020, 136, 111077. [Google Scholar] [CrossRef]
- Rajavuori, M.; Huhta, K. Investment screening: Implications for the energy sector and energy security. Energy Policy 2020, 144, 111646. [Google Scholar] [CrossRef]
- Sun, M.; Gao, C.; Shen, B. Quantifying China’s oil import risks and the impact on the national economy. Energy Policy 2014, 67, 605–611. [Google Scholar] [CrossRef]
- Arshad, A.; Zakaria, M.; Junyang, X. Energy prices and economic growth in Pakistan: A macro-econometric analysis. Renew. Sustain. Energy Rev. 2016, 55, 25–33. [Google Scholar] [CrossRef]
- Zhao, Y.; Shi, X.; Song, F. Has Chinese outward foreign direct investment in energy enhanced China’s energy security? Energy Policy 2020, 146, 111803. [Google Scholar] [CrossRef]
- Maghyereh, A.I.; Awartani, B.; Sweidan, O.D. Oil price uncertainty and real output growth: New evidence from selected oil-importing countries in the Middle East. Empir. Econ. 2019, 56, 1601–1621. [Google Scholar] [CrossRef]
- Lutz, C.; Lehr, U.; Wiebe, K.S. Economic effects of peak oil. Energy Policy 2012, 48, 829–834. [Google Scholar] [CrossRef]
- Rose, A.; Wei, D.; Paul, D. Economic consequences of and resilience to a disruption of petroleum trade: The role of seaports in U.S. energy security. Energy Policy 2018, 115, 584–615. [Google Scholar] [CrossRef]
- Hertel, T.W. Global Trade Analysis: Modeling and Applications; Cambridge University Press: Cambridge, UK, 1997; pp. 9–71. [Google Scholar]
- Chen, H.; He, L.; Chen, J.; Yuan, B.; Huang, T.; Cui, Q. Impacts of Clean Energy Substitution for Polluting Fossil-Fuels in Terminal Energy Consumption on the Economy and Environment in China. Sustainability 2019, 11, 6419. [Google Scholar] [CrossRef] [Green Version]
- Nong, D.; Nguyen, D.B.; Nguyen, T.H.; Wang, C.; Siriwardana, M. A stronger energy strategy for a new era of economic development in Vietnam: A quantitative assessment. Energy Policy 2020, 144, 111645. [Google Scholar] [CrossRef]
- Cui, Q.; He, L.; Liu, Y.; Zheng, Y.; Wei, W.; Yang, B.; Zhou, M. The impacts of COVID-19 pandemic on China’s transport sectors based on the CGE model coupled with a decomposition analysis approach. Transp. Policy 2021, 103, 103–115. [Google Scholar] [CrossRef]
- Cui, Q.; Liu, Y.; Ali, T.; Gao, J.; Chen, H. Economic and climate impacts of reducing China’s renewable electricity curtailment: A comparison between CGE models with alternative nesting structures of electricity. Energy Econ. 2020, 91, 104892. [Google Scholar] [CrossRef]
- Benzell, S.G.; Lagarda, G. Can Russia Survive Economic Sanctions? SSRN Electron. J. 2017, 16, 78–120. [Google Scholar] [CrossRef]
- Farzanegan, M.R.; Khabbazan, M.M.; Sadeghi, H. Effects of Oil Sanctions on Iran’s Economy and Household Welfare: New Evidence from A CGE Model; Palgrave Macmillan US: New York, NY, USA, 2016. [Google Scholar]
- Truong, T.P. GTAP-E. Incorporating Energy Substitution into GTAP Model, Technical Paper 16; Center for Global Trade Analysis, Purdue University: West Lafayette, IN, USA, 1999. [Google Scholar]
- Armington, P.S. A Theory of Demand for Products Distinguished by Place of Production. Staff Pap. 1969, 16, 159–178. [Google Scholar] [CrossRef]
- IEA (International Energy Agent). IEA Statement on Global Oil Markets. 2019. Available online: https://www.iea.org/newsroom/news/2019/april/iea-statement-on-global-oil-markets.html (accessed on 23 April 2019).
Figure 1.
Main sources of Chinese oil imports over the period 1996–2018. Source: UN Comtrade [40].
Figure 1.
Main sources of Chinese oil imports over the period 1996–2018. Source: UN Comtrade [40].

Figure 2.
Nested structure of the capital–energy composite for production sectors in the GTAP-E model.
Figure 2.
Nested structure of the capital–energy composite for production sectors in the GTAP-E model.

Figure 3.
Chinese oil import sources: (Panel A, using real data) before sanctions; (Panel B) after sanctions, as per S1; (Panel C) after sanctions, as per S2; and (Panel D) after sanctions, as per S3. Panels (B) and (C) are based on simulation data. Source: GTAP database and GTAP-E model simulation.

Figure 4.
Sources of China’s gas imports: (Panel A, using real data) before sanctions; (Panel B) after sanctions, as per S1; (Panel C) after sanctions, as per S2; (Panel D) after sanctions, as per S3. Panels (B,C) are based on simulation data. Source: GTAP database and GTAP-E model simulation.
Figure 4.
Sources of China’s gas imports: (Panel A, using real data) before sanctions; (Panel B) after sanctions, as per S1; (Panel C) after sanctions, as per S2; (Panel D) after sanctions, as per S3. Panels (B,C) are based on simulation data. Source: GTAP database and GTAP-E model simulation.

Figure 5.
Chinese petroleum product import sources: (Panel A, using real data) before sanctions; (Panel B) after sanctions, as per S1; (Panel C) after sanctions, as per S2; (Panel D) after sanctions, as per S3. Panels (B,C) are based on simulation data. Source: GTAP database and GTAP-E model simulation.


Table 1.
Summaries of policy scenarios after US sanctions are imposed on Iran.
| Policy Shocks | Scenario 1 | Scenario 2 | Scenario 3 |
|---|---|---|---|
| Complete embargo on Iranian oil exports | √ | √ | √ |
| Compensatory 12.6% production increase from other Persian Gulf oil producers | √ | ||
| Hormuz Strait closed, and Other Persian Gulf country oil exports reduced by 30% | √ |
Table 2.
Changes in the output, price and trade in Chinese energy sectors under the three scenarios (%).
Table 2.
Changes in the output, price and trade in Chinese energy sectors under the three scenarios (%).
| Coal | Oil | Gas | Petroleum | Electricity | Gas supply | |
|---|---|---|---|---|---|---|
| Scenario 1 | ||||||
| Output | −0.272 | 2.520 | 0.187 | −1.138 | 0.034 | −0.294 |
| Price | 0.073 | 0.710 | 0.313 | 0.977 | 0.062 | 0.300 |
| Import | −0.382 | −1.224 | −0.076 | 4.907 | 0.639 | 6.120 |
| Export | −0.015 | −0.749 | 0.360 | −2.910 | −0.303 | −6.969 |
| Scenario 2 | ||||||
| Output | −0.029 | −1.793 | 2.940 | −0.122 | −0.073 | −0.063 |
| Price | −0.073 | −0.506 | 0.010 | −0.670 | −0.057 | −0.199 |
| Import | 0.145 | 2.747 | −0.285 | 6.143 | 1.102 | 5.135 |
| Export | −0.096 | −6.515 | 17.080 | −2.554 | −0.899 | −4.875 |
| Scenario 3 | ||||||
| Output | −1.244 | 16.609 | −9.588 | −5.187 | 0.343 | −1.027 |
| Price | 0.480 | 4.795 | 1.158 | 6.494 | 0.372 | 1.819 |
| Import | −2.305 | −5.067 | 1.701 | 4.944 | −0.713 | 9.489 |
| Export | −1.475 | 15.023 | −40.868 | −11.182 | 1.247 | −13.401 |
Source: GTAP-E model simulation.
Table 3.
Changes in the supply of the Chinese energy sector under various scenarios (%).
| Sector | Scenario 1 | Scenario 2 | Scenario 3 |
|---|---|---|---|
| Coal | −0.287 | −0.006 | −1.379 |
| Oil | −1.033 | −0.154 | −4.391 |
| Gas | −0.038 | −0.392 | 1.208 |
| Petroleum products | −0.733 | 0.332 | −4.344 |
| Electricity | 0.036 | −0.069 | 0.339 |
| Gas supply | −0.103 | 0.082 | −0.692 |
Source: GTAP-E model simulation.
Table 4.
Changes in the output and trade of Chinese non-energy sectors under the three scenarios (%).
Table 4.
Changes in the output and trade of Chinese non-energy sectors under the three scenarios (%).
| Sector | Scenario 1 | Scenario 2 | Scenario 3 | ||||||
|---|---|---|---|---|---|---|---|---|---|
| Output | Import | Export | Output | Import | Export | Output | Import | Export | |
| Agriculture | −0.015 | −0.092 | −0.022 | −0.001 | 0.177 | −0.229 | −0.055 | −0.983 | 0.904 |
| Mineral products | −0.070 | 0.025 | 0.118 | −0.002 | 0.254 | −0.079 | −0.297 | −0.716 | 0.846 |
| Processed food | −0.017 | −0.114 | 0.083 | 0.016 | 0.116 | −0.093 | −0.117 | −0.934 | 0.783 |
| Light manufacturing | 0.037 | −0.109 | 0.151 | 0.017 | 0.125 | −0.013 | 0.171 | −0.843 | 0.889 |
| Chemical products | −0.093 | 0.339 | 0.076 | −0.151 | 0.769 | −0.259 | −0.028 | −0.773 | 0.752 |
| Heavy manufacturing | −0.035 | −0.021 | 0.008 | 0.099 | 0.005 | 0.082 | −0.466 | −0.031 | −0.111 |
| Construction | −0.064 | 0.021 | −0.047 | 0.110 | 0.163 | −0.164 | −0.661 | −0.492 | 0.518 |
| Services | −0.038 | 0.063 | −0.170 | 0.037 | 0.200 | −0.080 | −0.273 | −0.378 | −0.109 |
Source: GTAP-E model simulation.
Table 5.
The changes in the real GDP of each country (%).
| Country/Region | Scenario 1 | Scenario 2 | Scenario 3 |
|---|---|---|---|
| China | −0.047 | −0.024 | −0.342 |
| Other East Asia | −0.007 | 0.010 | −0.861 |
| Japan | −0.076 | −0.013 | −0.884 |
| South Korea | −0.122 | −0.056 | −1.619 |
| ASEAN | 0.000 | 0.005 | −0.465 |
| India | −0.174 | −0.103 | −1.250 |
| Other South Asia | −0.005 | 0.004 | −0.282 |
| Canada | 0.003 | −0.005 | 0.013 |
| USA | −0.003 | 0.005 | −0.111 |
| Latin American | 0.005 | −0.005 | 0.026 |
| Venezuela | 0.016 | −0.021 | 0.134 |
| EU28 | −0.011 | 0.021 | −0.164 |
| Russia | −0.010 | 0.230 | −0.791 |
| Central Asia | 0.023 | −0.036 | 0.212 |
| Other Persian Gulf | 0.020 | 2.920 | −0.173 |
| Iran | −0.647 | −0.656 | −0.635 |
| Other MENA | −0.002 | 0.019 | −0.121 |
| Sub-Saharan Africa | 0.010 | −0.004 | −0.048 |
| Rest of World | −0.006 | 0.015 | −0.103 |
Source: GTAP-E model simulation.
Publisher’s Note: MDPI stays neutral with regard to jurisdictional claims in published maps and institutional affiliations. |
© 2021 by the authors. Licensee MDPI, Basel, Switzerland. This article is an open access article distributed under the terms and conditions of the Creative Commons Attribution (CC BY) license (https://creativecommons.org/licenses/by/4.0/).
Share and Cite
MDPI and ACS Style
Hu, X.; He, L.; Cui, Q. How Do International Conflicts Impact China’s Energy Security and Economic Growth? A Case Study of the US Economic Sanctions on Iran. Sustainability 2021, 13, 6903. https://0-doi-org.brum.beds.ac.uk/10.3390/su13126903
AMA Style
Hu X, He L, Cui Q. How Do International Conflicts Impact China’s Energy Security and Economic Growth? A Case Study of the US Economic Sanctions on Iran. Sustainability. 2021; 13(12):6903. https://0-doi-org.brum.beds.ac.uk/10.3390/su13126903
Chicago/Turabian StyleHu, Xiaoxiao, Ling He, and Qi Cui. 2021. "How Do International Conflicts Impact China’s Energy Security and Economic Growth? A Case Study of the US Economic Sanctions on Iran" Sustainability 13, no. 12: 6903. https://0-doi-org.brum.beds.ac.uk/10.3390/su13126903
Note that from the first issue of 2016, this journal uses article numbers instead of page numbers. See further details here.