1. Introduction
Flood is a very common and quite destructive natural disaster around the world, which is usually triggered by intense but short-term precipitation events [
1]. Due to factors such as terrain and climate, floods are especially prone to occurring in mountainous-hilly areas [
2,
3,
4,
5]. In China, mountainous areas account for about two-thirds of the country’s land area, and nearly half of Chinese towns are located in such areas. Among the total flood-related deaths, deaths in mountain areas accounted for more than 70% [
6,
7]. Several southeastern provinces of China (e.g., Jiangxi, Fujian, and Guangdong) suffered the most from flooding due to the hilly terrain and high annual precipitation. In these flood-prone areas, flood can damage massive houses and crops, causing substantial wealth loss and increasing the possibility of regional poverty [
8]. Due to the high risk of flood disasters, flood monitoring and assessment have become necessary strategies for these towns to formulate a sustainable land-use plan and increase urban resilience against climate change [
9].
Proper evaluation of flood risk in rural and mountainous areas is challenging. First of all, quantification of flooding susceptibility is a multifaceted process. Floods not only occur as a result of excessive rainfall but also due to the comprehensive influence of various factors such as hydrological, geological, geomorphological, and vegetation parameters [
10]. When drawing flood sensitivity maps, the factors to be considered in mountainous areas are often more complicated than in large cities with flat terrain. Second, flood risk assessment relies on a large number of observations and records of flood phenomena. Many countries established geological disaster monitoring groups to collect field data, and a couple of approaches such as systematic documentation collection, semi-structured household interviews [
11], and ground surveys were developed to help us identify the past and current flooding locations [
1,
12]. Due to the remoteness and poor road infrastructure in mountain villages, field data collection is inefficient and laborious [
13,
14]. In fact, even in developed countries, the number of flood records is not enough for a comprehensive understanding of flood events in mountainous areas [
15]. The difficulties in field survey and data shortage hinder flood experts and researchers in identifying flood-prone regions and forecast flooding phenomena.
The emergence of UGC impacts the ways of field data collection and provides new opportunities for flood disaster management. According to the Organization for Economic Co-operation and Development (OECD), UGC refers to the content on the web which is created outside of local observations and can take any form of images, texts, voices, or videos [
16,
17]. In the era of big data, UGC increases at an annual exponential rate owing to the widespread use of mobile phones and social media apps [
18]. The rapidly increasing UGC is becoming valuable in scientific research [
19,
20,
21]. UGC was first applied to interdisciplinary research such as citizen journalism and consumers [
22]. In the past few years, the use of UGC was introduced into disaster management, and scholars started focusing on how to utilize observations from ordinary residents in flood disaster management [
23,
24]. Several scientists tried to use social media streaming data, such as Twitter and Facebook, for hydrological monitoring and flood event early detection [
18,
25]. However, only a few studies have attempted to make flood susceptibility assessment by combining users’ observations. (Fang and Hu et al., 2019) used Wuhan rainstorm in 2016 as an example and extracted information through a microblog platform to provide a basis for disaster response, proving the usefulness of social media in disaster assessment [
26]. (Zeng and Lan et al., 2020) used the simplest logistic regression model to explore the value of UGC in modeling and mapping urban flood susceptibility. Nevertheless, these case analyses are only focused on the geographical scope of large cities and fail to incorporate the state-of-the-art machine learning algorithms into the model [
27].
This study explored the integration of social media data with flood risk assessment in mountainous-hilly areas. The Ji’an County is in Jiangxi Province of China, where flood events frequently occurred and received much attention from users on the web in recent years. The case analysis aimed to explore the potential of UGC in flood susceptibility assessment. Our results indicate that UGC based on several years of users’ observations can achieve satisfactory results in flood assessment. Stakeholders such as ordinary residents can play a critical role in disaster management despite them being non-scientists. Considering the negative impacts of flood in mountainous areas, we argue that affected citizens, spontaneous volunteers, and official emergency services should cooperate more in flood disaster management in the future. Finally, bearing in mind the uncertainties of UGC, the limitations of UGC are discussed, and several strategies are proposed for its better application in flood disaster management. It is expected that the outcome can provide insight for policy-makers on disaster prevention and mitigation and strengthen the monitoring and risk management of flood disasters in mountainous areas, as well as provide a reference for disaster prevention in other countries and cities with scarce data.
2. Study Area
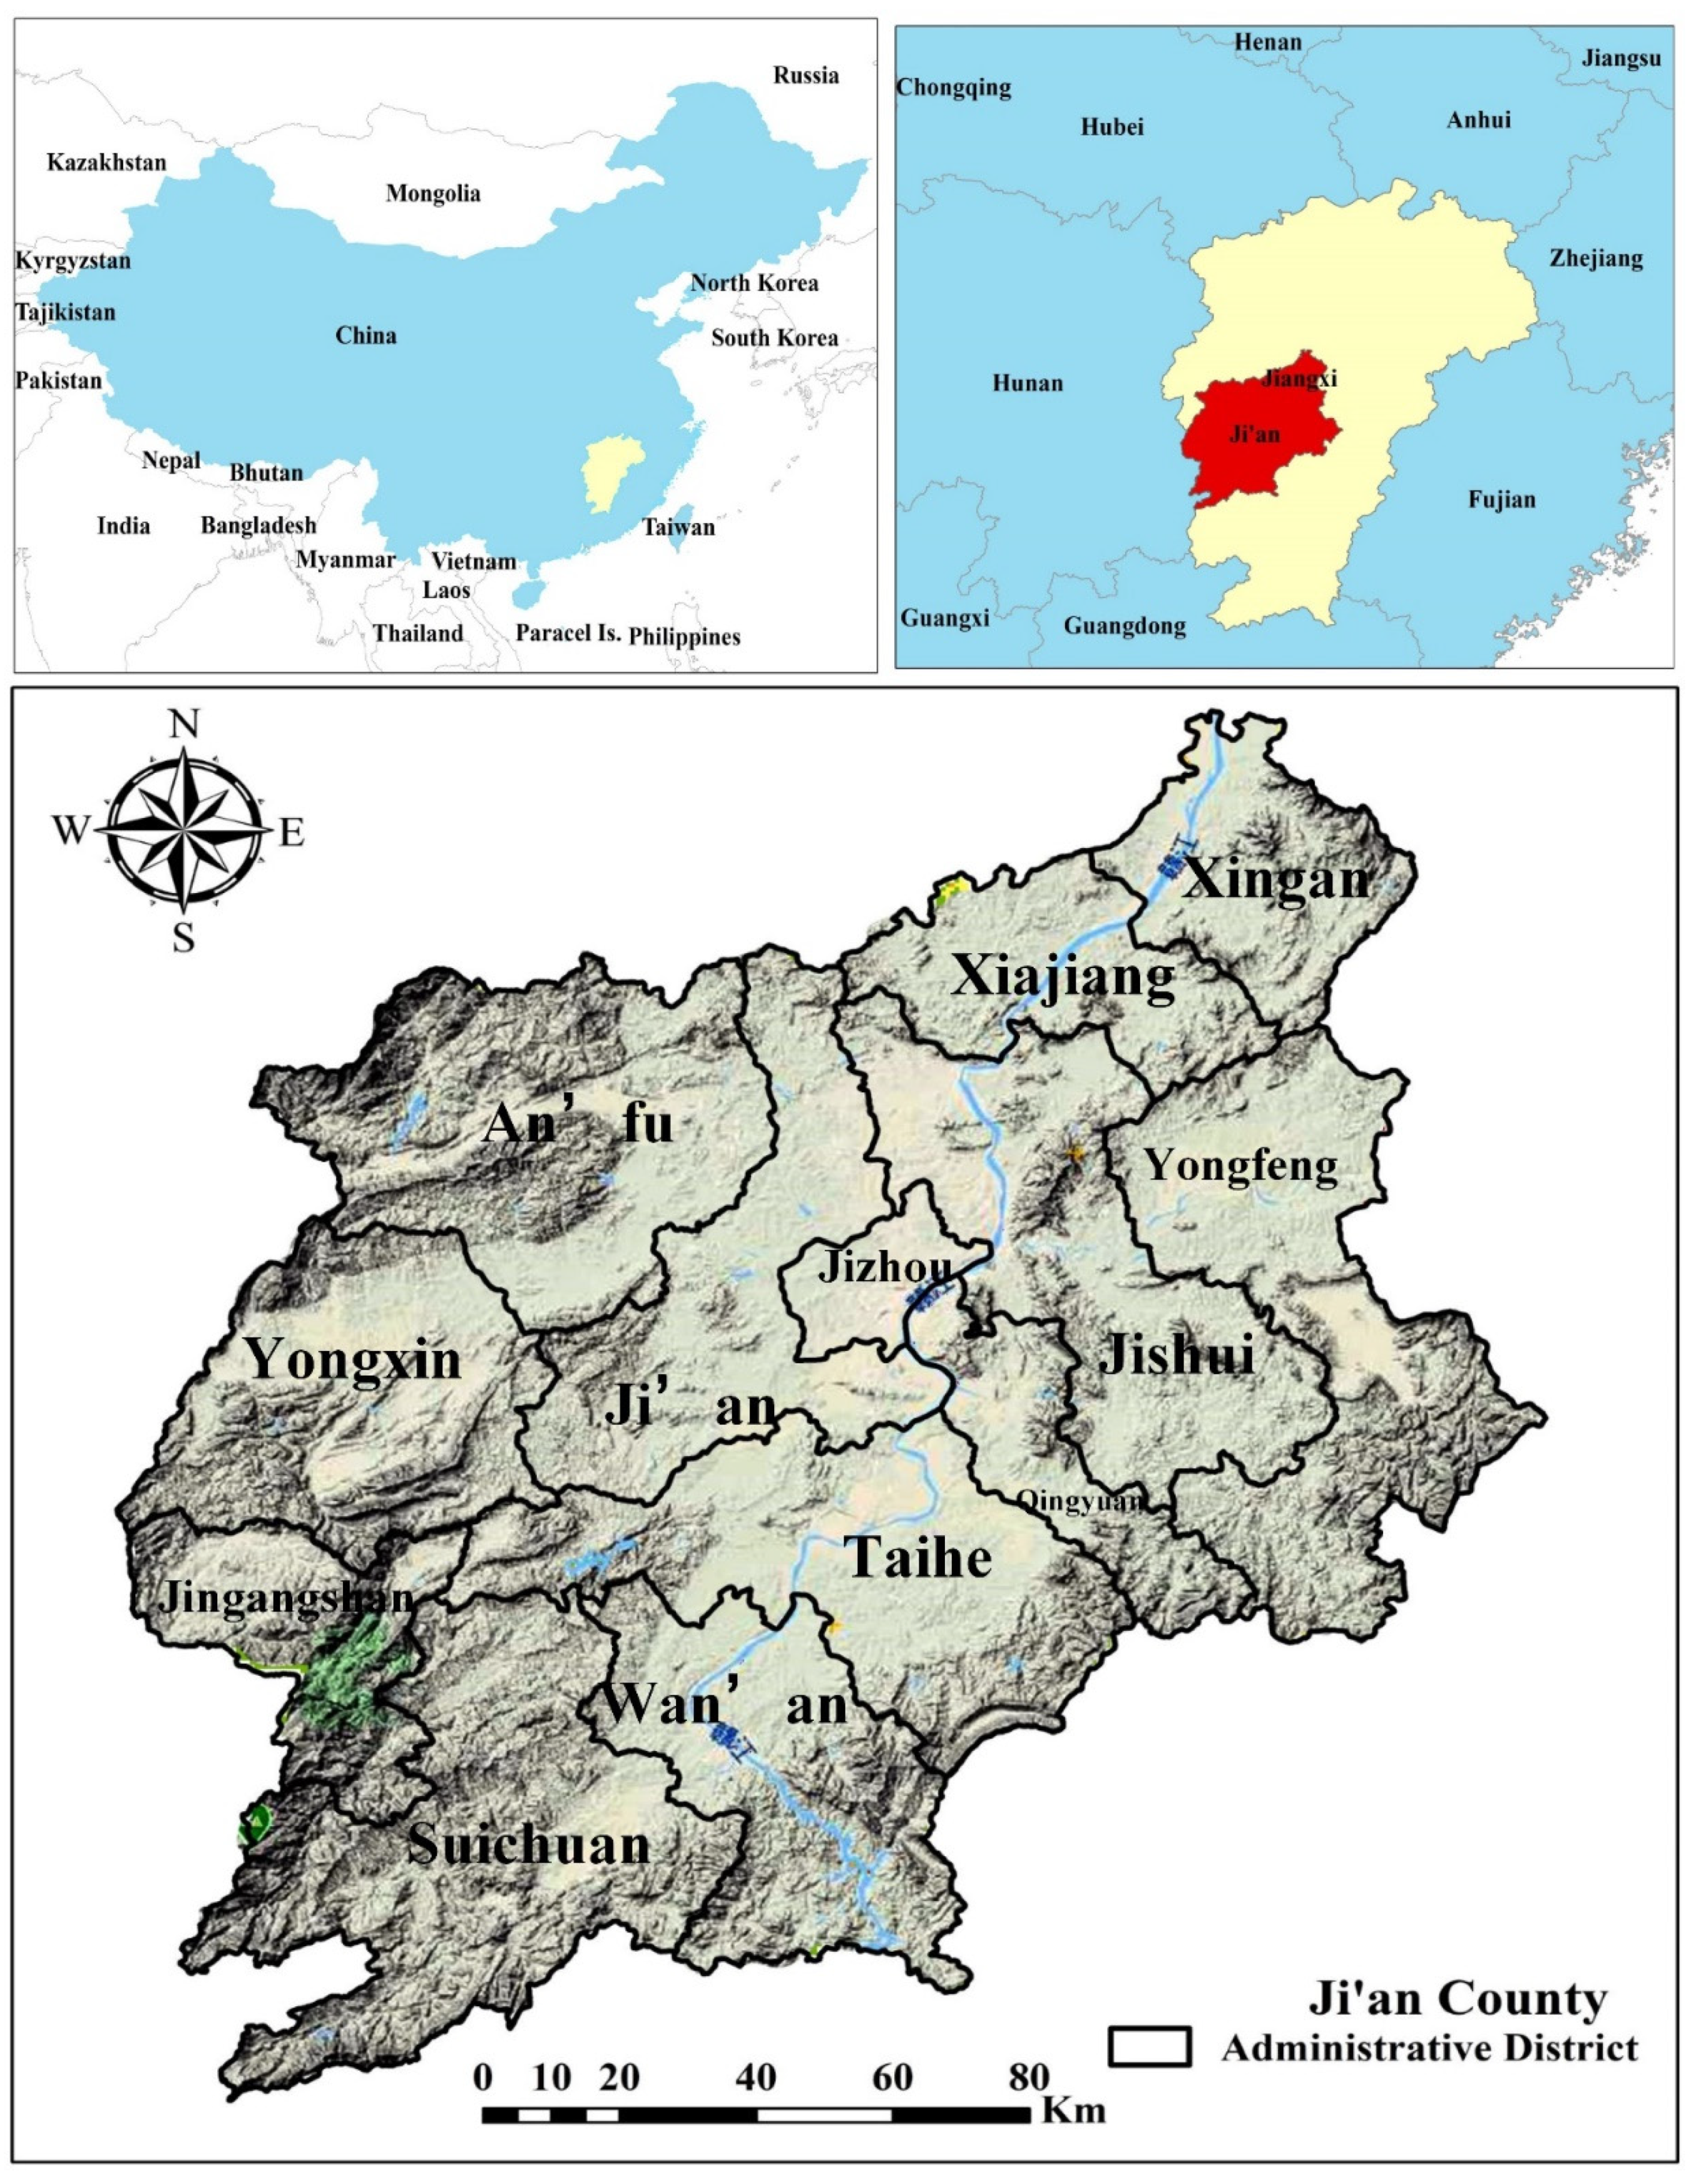
Ji’an County (
Figure 1) is one of the central cities of Jiangxi Province, where the Gan River runs from south to north, bringing abundant rainfall. Ji’an’s geographical extent is between latitudes of 25°58′ to 27°57′ N and longitudes of 113°46′ to 115°56′ E. The city is a typical mountainous and hilly landform, surrounded by mountains with the Jitai Basin in the middle, whose elevation ranges from 100 m to 1542 m. The region is composed of 13 administrative counties, with a total of 213 towns, covering a total area of about 20,000 km
2, and holds a population of 5.4 million. The climate of the study area is dominated by a subtropical monsoon climate. The mean annual precipitation is about 1504 mm with a mean temperature of approximately 17.8 degrees according to the long-term (1988–2018) data from weather stations.
Over the past five years, the city experienced catastrophic floods almost every year, causing huge losses to the lives and property of the people in the village (
Table 1). In the flood event of 2019, from June 6 to June 9, the torrential rains and cyclonic storms combined together to produce the most devastating flood disaster. According to the statistics, the flood killed more than 15 people, collapsed more than 1300 houses, affected nearly 2 million people’s livelihoods, and destroyed thousands of hectares of crops. The flood caused economic losses of USD 0.2 billion.
Although the flood events passed, the traces caused by floods remain on the Internet. Online reports not only have words and pictures but are also full of videos and sympathy for the victims. Thus, it is urgent to evaluate the flood susceptibility for the city’s future development.
3. Research Method
Scientific communities have developed various approaches to assess flood hazards and quantify flood susceptibility [
28]. The earlier approaches included subjective expert knowledge, frequency ratio, weighting factor, Shannon’s entropy, discriminant analysis, bivariate or multivariate regression, generalized linear model, logistic regression, etc. [
29]. Recently, several complex and more intelligent machine learning methods, such as artificial neural networks (ANNs), support vector machines (SVMs), random forest (RF), and decision trees (DTs), are proposed for flood assessment [
4,
30,
31]. All these statistical methods are fit for flood susceptibility assessment.
Maximum entropy (MaxEnt) model was chosen particularly here because the model is practical and requires relatively fewer training data and no need to generate non-flood points for supervised classification. The MaxEnt model is an advanced machine learning algorithm and was first used by scholars to study the distribution of animal and plant populations [
32,
33,
34]. The model was soon adopted by scholars in other research fields, including flood sensitivity assessment research, and proved to be very accurate [
35].
Here, it was used to verify the performance of UGC as source data to evaluate flood susceptibility in mountainous areas.
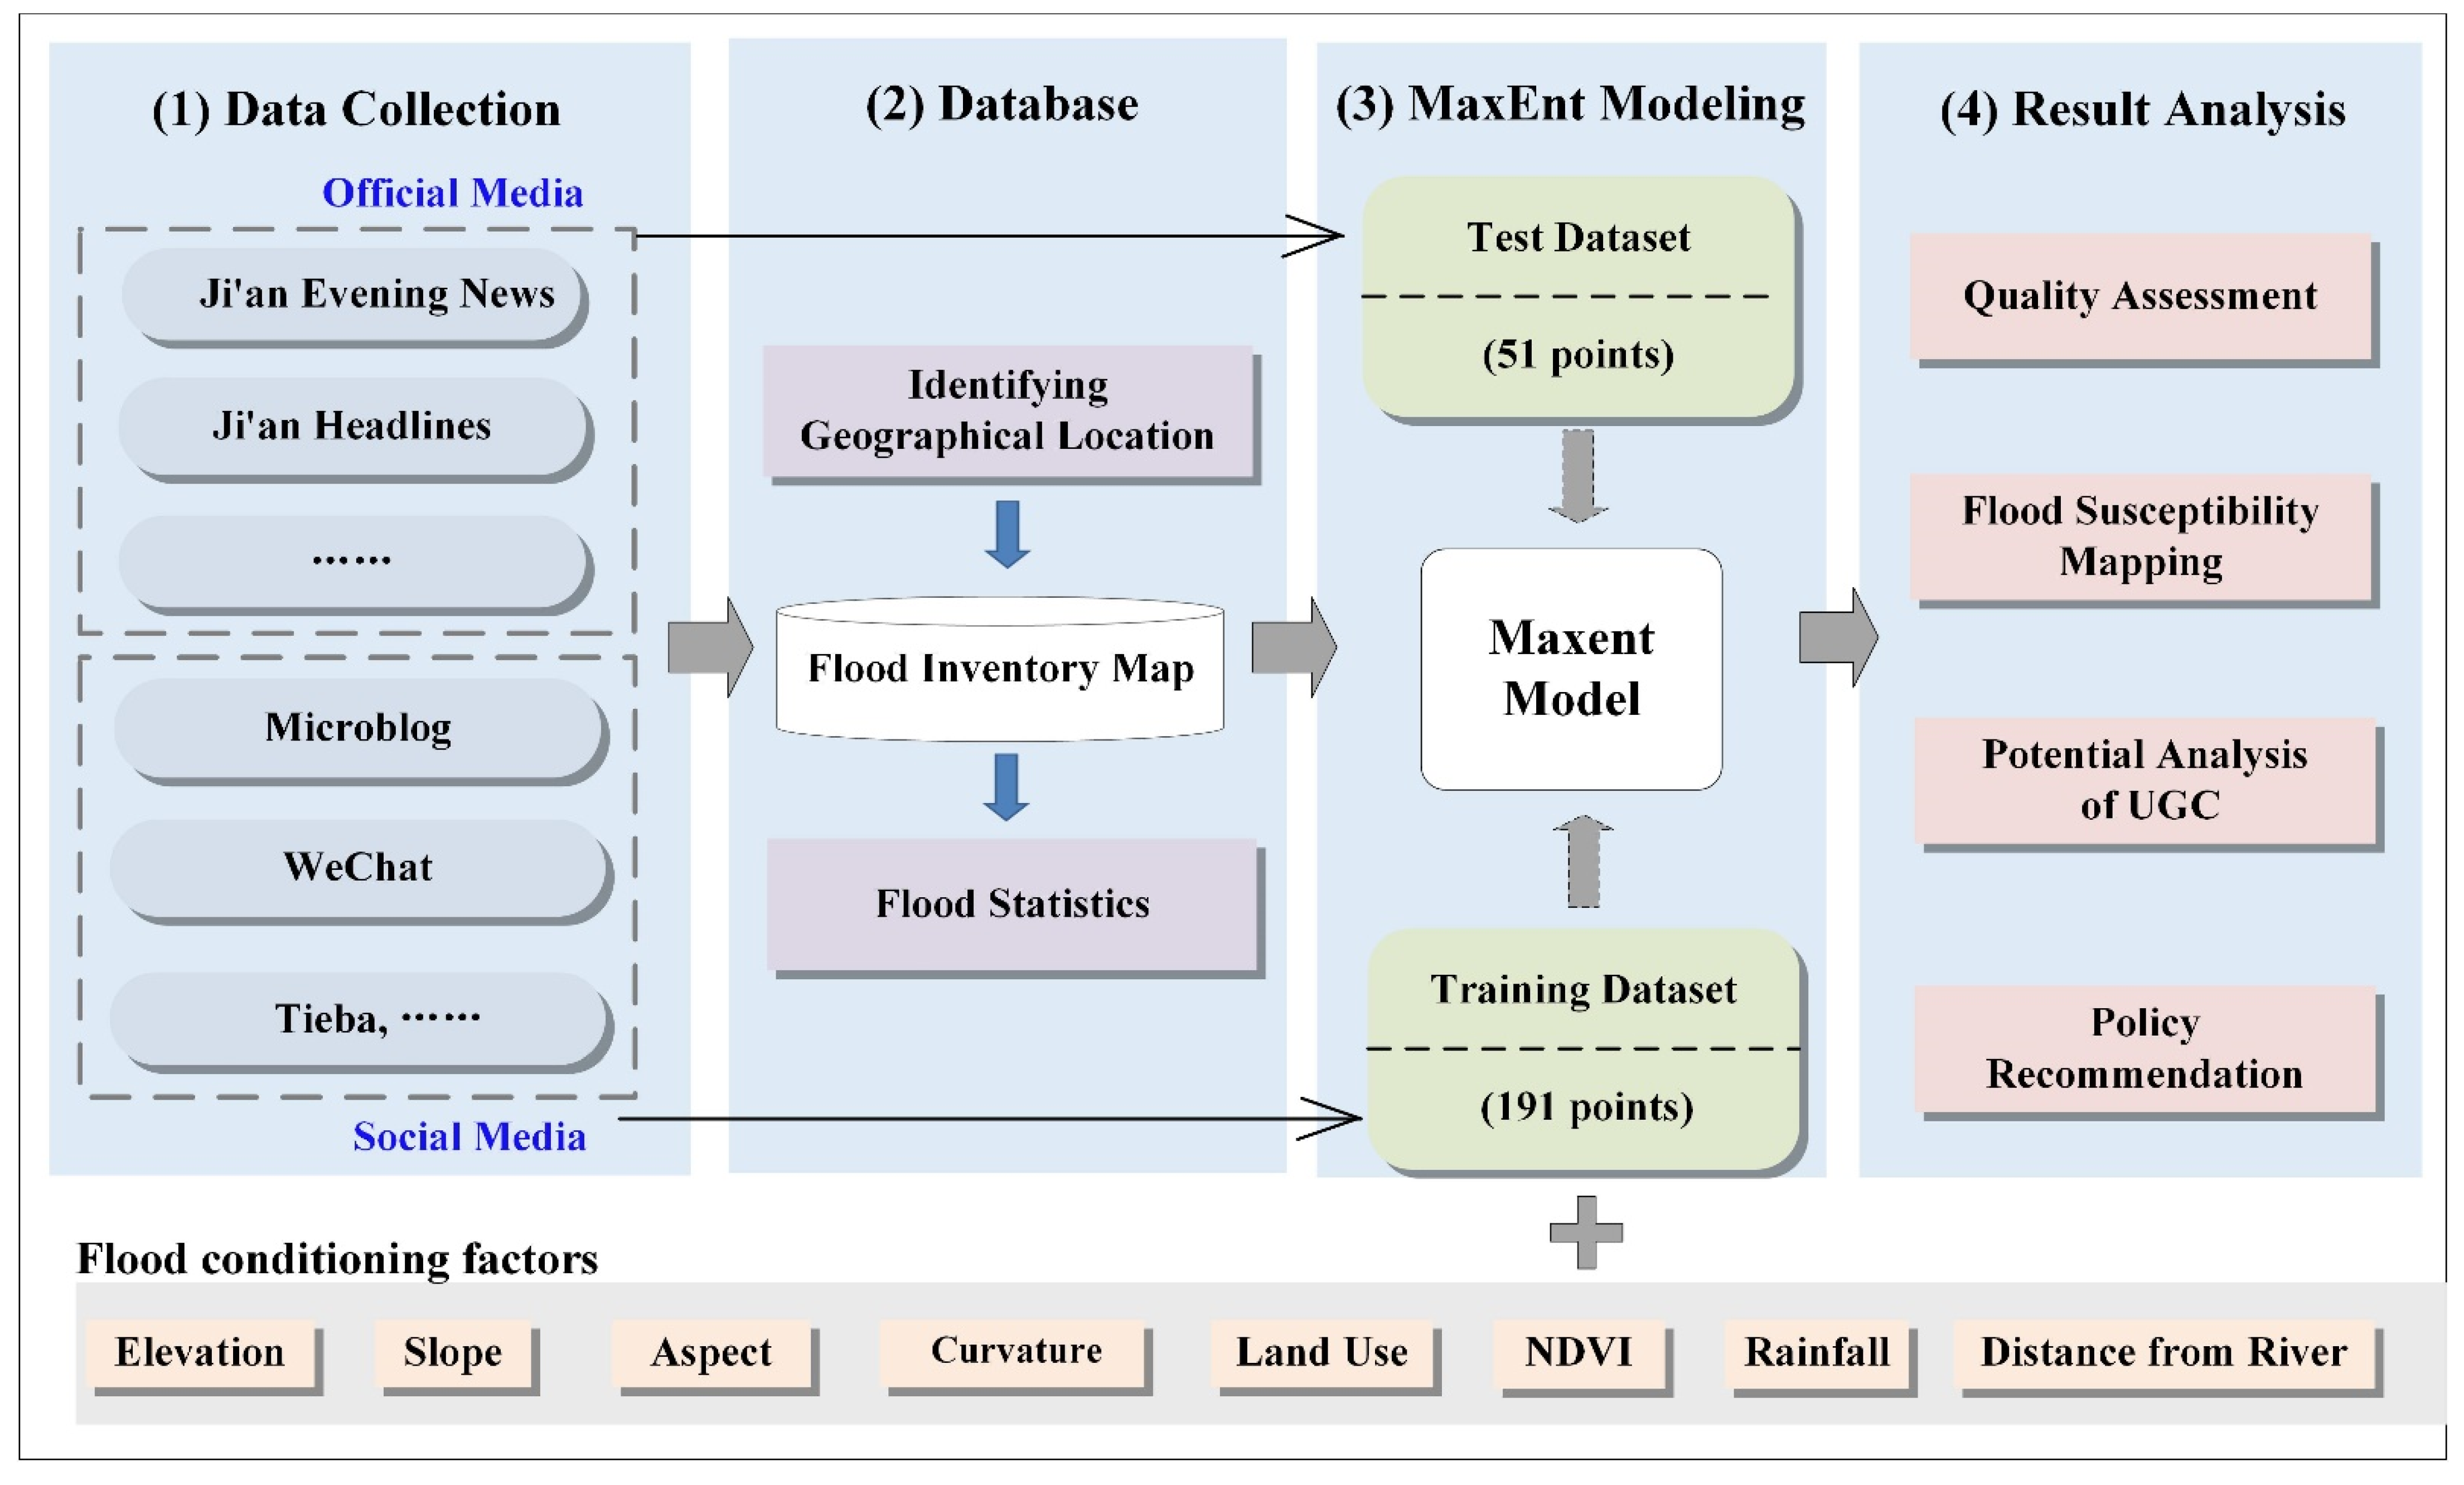
The procedural approach (
Figure 2) taken in the present research can be summarized as (i) collection and preparation of the required data for the flood modeling in the study area; (ii) retrieval of the flood historical events in UGC to determine geographical location of floods; (iii) identification of key factors affecting flood occurrence and susceptibility mapping; (iv) reliability assessment of the model by the division of training data, reported by ordinary users and test data, reported on official websites; (v) statistical analysis of flood susceptibility map and policy recommendations.
3.1. Data Collection
The Internet environment in China is different from that of many countries in the world. For instance, Twitter, Facebook, YouTube, and WhatsApp are not popular in the country. Compared to the Internet environment in other countries, the participation platform in China is diverse. Individuals and business enterprises use social media tools such as WeChat and Sina Blog to release news and disaster situation information on the web. Several social networking sites (SNSs) such as Zhihu (similar to Quora), Baidu Baike (similar to Wikipedia), and Tianya communities (a bulletin board service) are also very popular among users for uploading and sharing disaster information. The users’ observations posted on the web are usually not well organized in a structured way. The information relevant to the specific flood event is inundated with irrelevant information. Fortunately, data mining technology and AI can help us retrieve unstructured data and effectively search the relevant UGC for flood inventory.
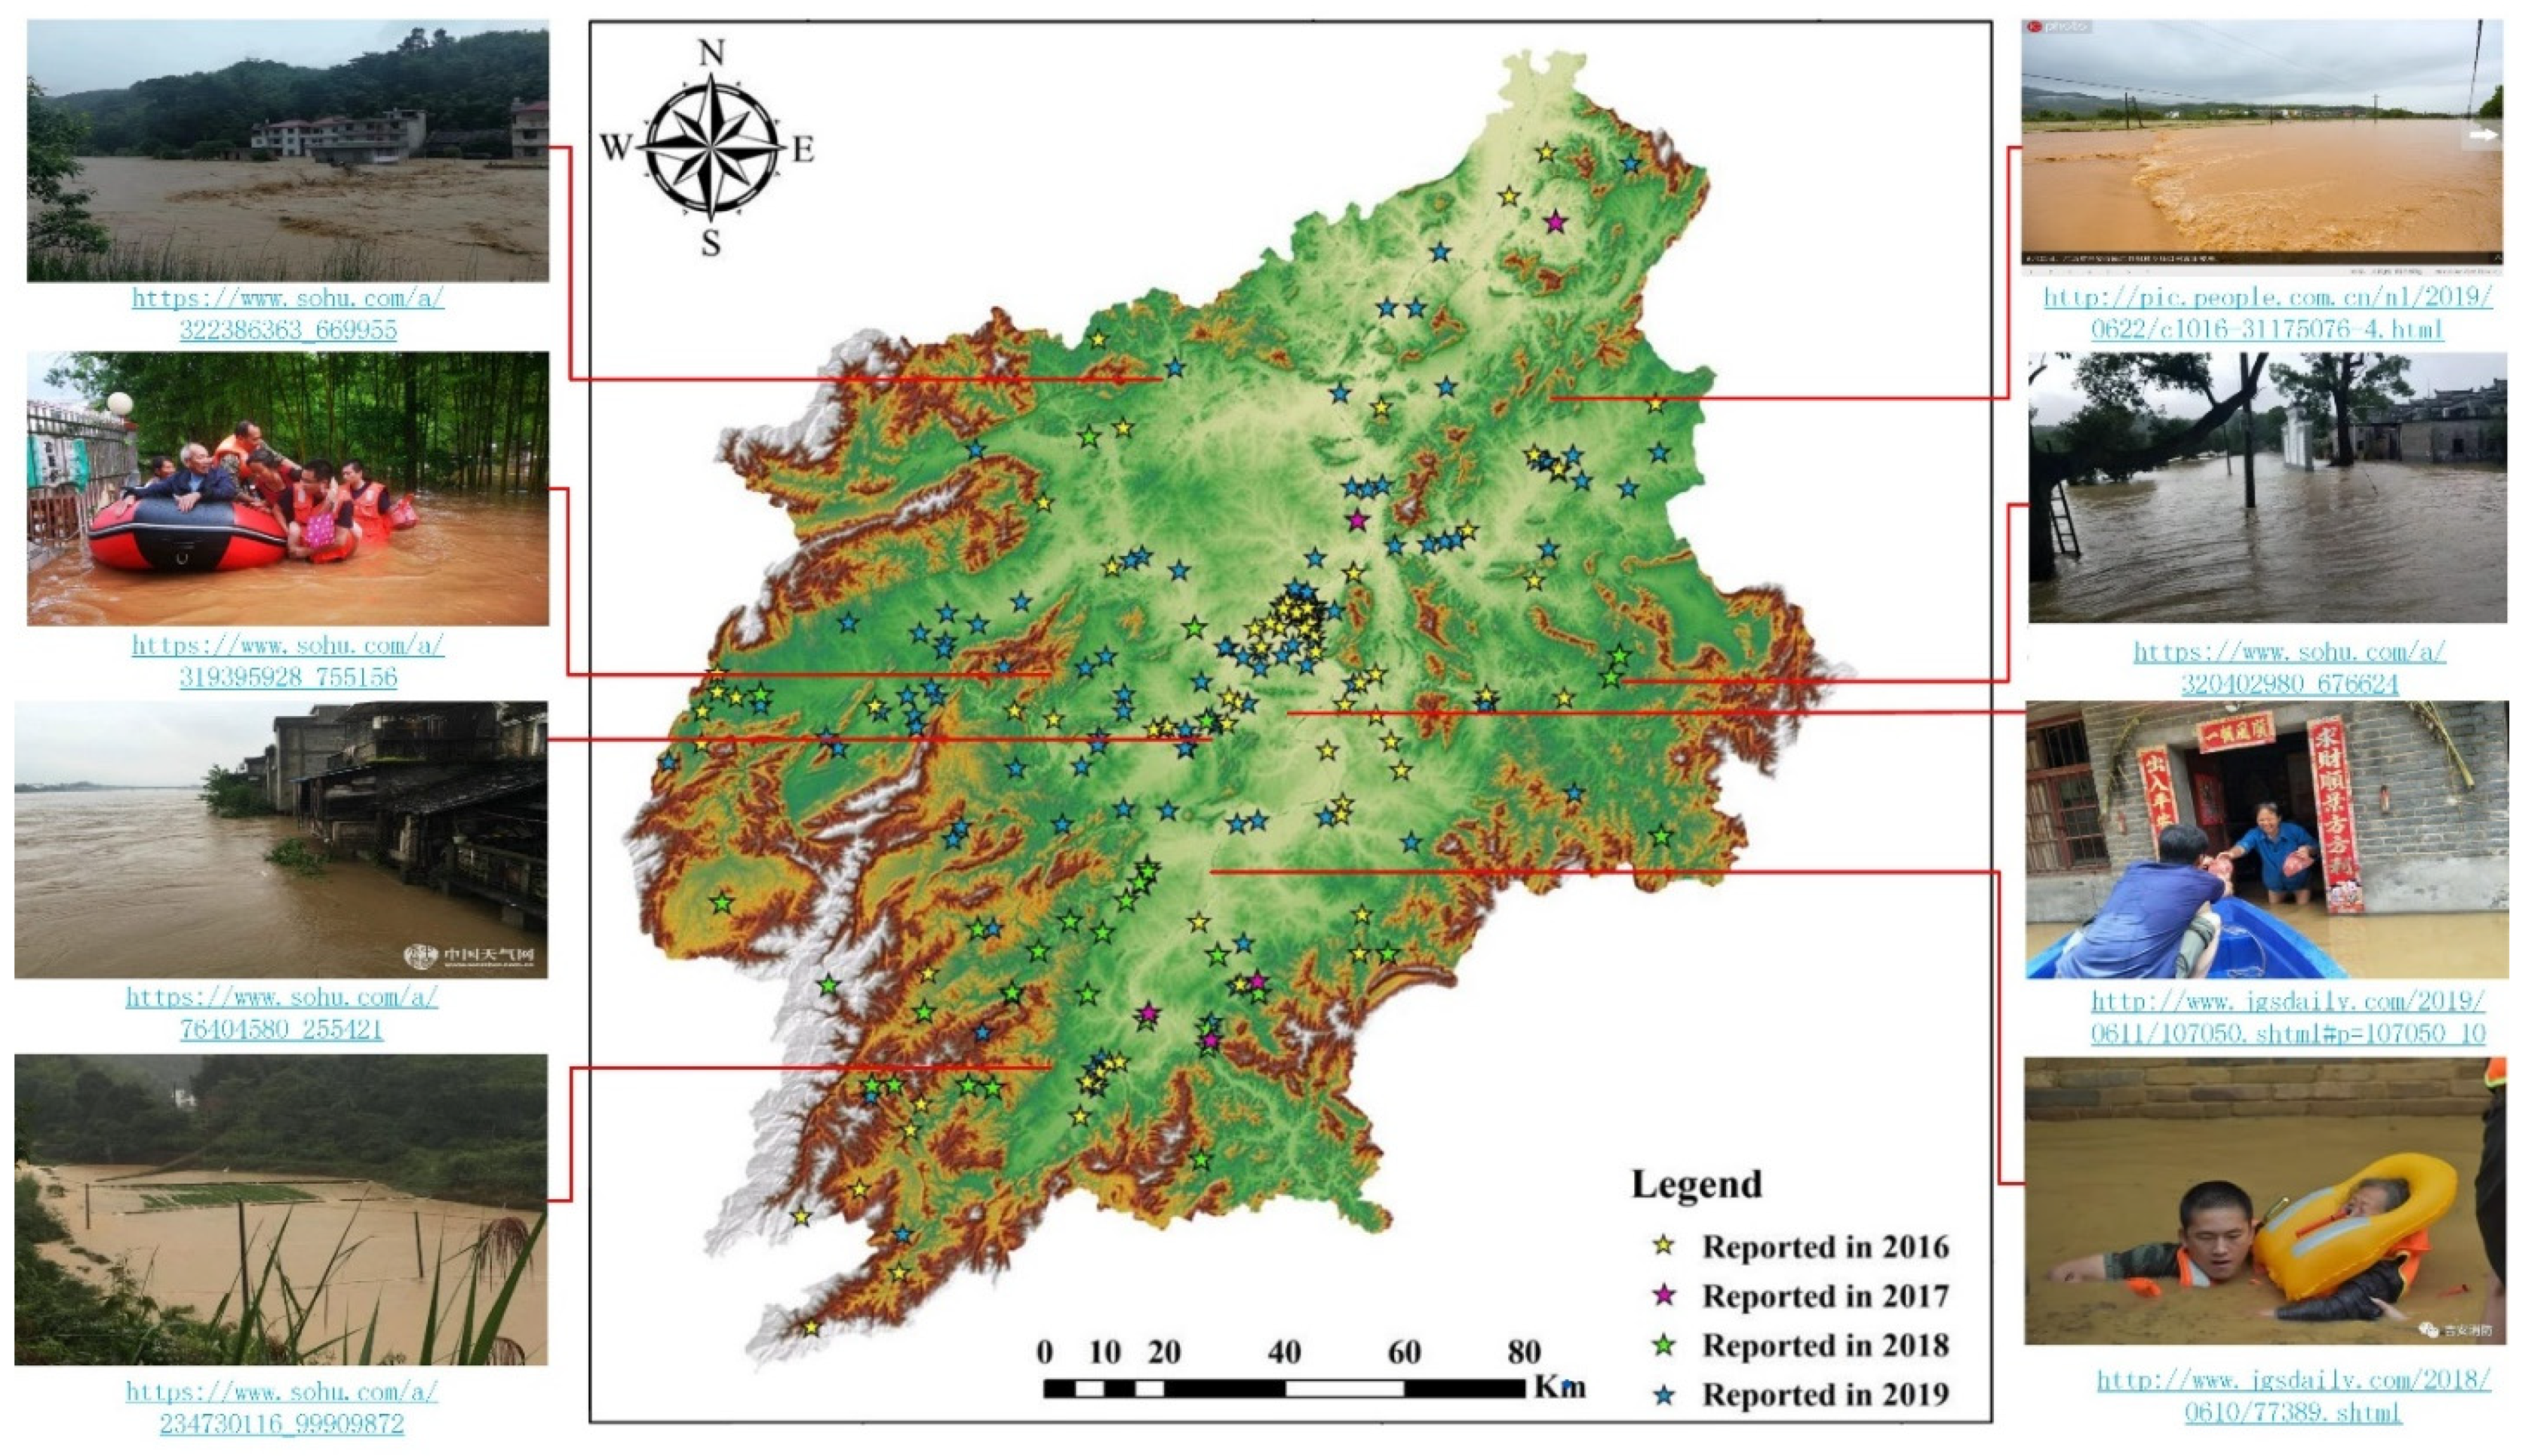
A web crawler combined with a natural language process (NLP) and social media application programming interface (API) was designed and implemented to help us identify the locations of flood events. The crawler searched 5689 records relating to the historical flood events in Ji’an, which were obtained from 248 websites and 125 social media accounts (BBSs, blogs, and microblogs), including authoritative media (e.g., Ji’an Evening News, Xinhua, government official website). The result of the crawler was carefully reviewed by three individuals on their types of posts, time, and geographical locations to remove repetitive and error-prone points. After filtering, 242 disaster points uploaded by users during 2016–2019 were considered very reliable, and their locations were labeled on a map (
Figure 3). Of these 242 sites, 162 were reported to occur in villages, 15 were located on the street, and 65 occurred in other places such as a certain residential area, parking lot, or a building, etc. (
Table 2).
The crawled flood data were divided into two categories. One category was 191 points in total floods, reported on social media, such as microblogs, WeChat, Tieba, etc., and uploaded by ordinary users’ accounts. There were a total of 191 flood points, and they were used to train the model. The other category was flood events published on a government official website or from authentic news media such as Ji’an Headlines, Ji’an Evening News, etc. There were 51 points in total, which were saved for model validation.
3.2. Conditioning Factors
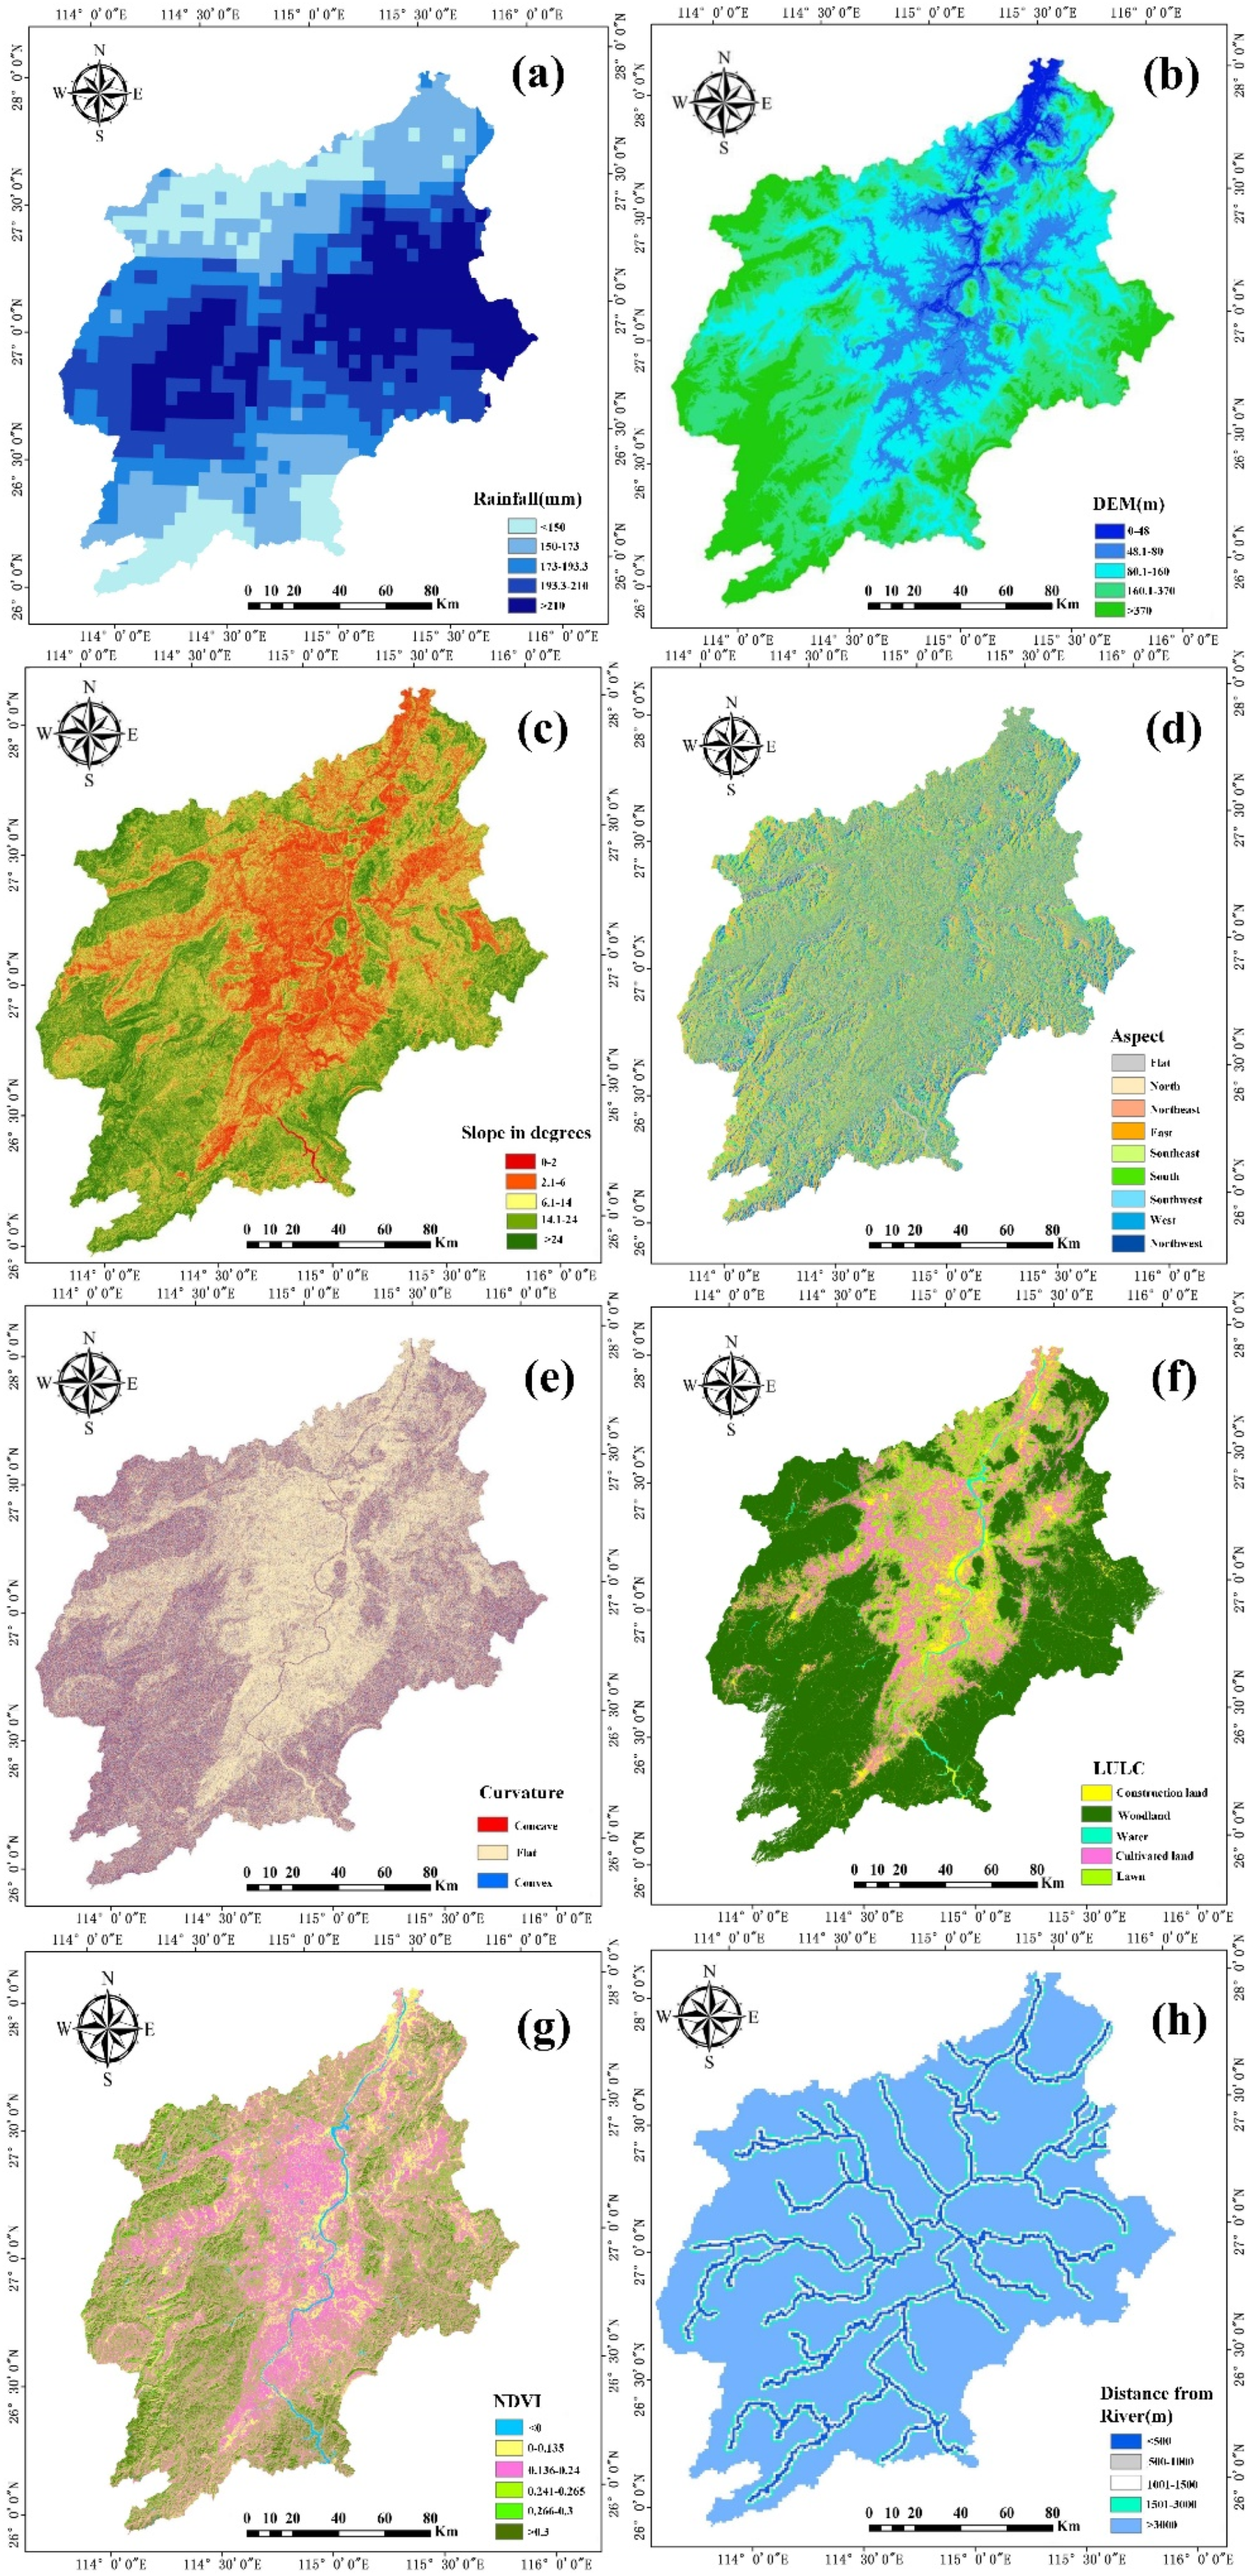
Flood susceptibility assessment requires comprehensive consideration of various factors, including watershed features, storm characteristics, and regional characteristics. The selection of conditioning factors should take into account both the natural topography and land-use type. Based on previous studies, eight conditioning factors including elevation, slope angle, aspect, curvature, rainfall, NDVI, LULC (land use/land cover), and distance from rivers were selected to establish our flood model.
The factors were derived from different data resources such as DEM (Digital Elevation Model), weather stations and publications, and satellite imagery. The data were downloaded from Geospatial Data Cloud (
http://www.gscloud.cn/ (accessed on 17 March 2020)) or National Geomatics Center of China (NGCA), respectively. The slope angle, slope aspect, altitude, plan curvature, and profile curvature were extracted from ASTER (Advanced Spaceborne Thermal Emission and Reflection Radiometer) Global DEM. LULC types were prepared from remote sensing image data. Distance-from-rivers map was derived from the river distribution shapefile using the Euclidean distance tool in ArcGIS.
Table 3 summarizes the factors, data sources, and factor classes used in this study. All the data layers were prepared in raster format with a spatial resolution of 30 m × 30 m.
Rainfall is a trigger factor leading to floods. The magnitude of rainfall directly affects the severity of flood disaster. The spatial distribution of rainfall was obtained from a 30+ year quasi-global rainfall dataset, called Climate Hazards Group InfraRed Precipitation with Station data (CHIRPS), which incorporates satellite imagery with in situ station data to create gridded rainfall time series. This study filtered out the maximum daily rainfall between 2016 and 2019 from the dataset in Google Earth Engine and used it for further analysis. Elevation is also an important factor contributing to the occurrence of floods. Generally, water flows downward due to the force of gravity, rainfall accumulates in the low-lying areas, and thus lower elevation is more prone to flooding. Slope is another factor frequently used in flood susceptibility assessment [
36,
37,
38]. Slope directly affects surface runoff velocity and vertical infiltration, thus affecting flood susceptibility. Note that areas with smaller slopes are prone to floods. Aspect will affect precipitation, sunshine hours, and soil moisture content, which indirectly affects the occurrence probability of flood [
39,
40]. Curvature represents the degree and direction of a curved surface, which determines whether the water flows in a convergent or divergent manner. LULC is considered essential for identifying flood-prone areas [
41]. LULC affects runoff speed, sequestration, infiltration, and evaporation transport [
42]. Urban and impervious surfaces will increase rainwater runoff. NDVI describes the vegetation density of a region. It is generally believed that vegetation has an influence on both the surface runoff and infiltration capability of land [
43]. NDVI was extracted from Landsat 8 OLI images by analyzing the spectral reflectance measurements obtained in the visible (red) and near-infrared regions. River is also closely related to floods. After a precipitation event, when discharge increases and overtops its bank, floods may occur in the surrounding area [
44]. Linda also concluded that river networks play an important role in floods [
45]. The closer a settlement is to the river, the more vulnerable it is to floods.
Figure 4 shows the maps of each conditioning factor.
3.3. MaxEnt Modeling for Flood Occurrence
Maximum entropy model (i.e., MaxEnt model) is a machine learning model that looks for the most dispersed or the closest uniform distribution method to predict the probability of occurrence of things under the condition of satisfying constraint rules. The model only considers the known sample information in the calculation. By superimposing the geographic location of the flood with all the input conditioning factors, a large number of sample points is randomly generated, and then the corresponding relationship with the conditioning factors is established to generate constraint rules. The model has two main components: one is the entropy value, which is used to establish the objective function; the other is the constraint, which is used to calibrate the model.
Assuming that the probability variable
X {
x1,
x2…,
} of flood occurrence in the study area, its probability distribution is
=
. Then the entropy of the variable
X is defined as:
depends on the distribution of
X and has nothing to do with the specific value of
X. After introducing various conditioning factors
Y (
), the entropy of the variable
X under the condition known as
Y is:
We used the spatial analysis tools in ArcGIS software to calculate the geographic coordinates of the flood points and input them into MaxEnt model. According to the principle of maximum entropy, the objective function of the maximum entropy (MaxEnt) model is:
The maximum entropy model continuously adjusts the parameter values through the random seed generation algorithm to find the optimal solution. To prevent the result from falling into a local optimum, this study used the average value of multiple training results as the final result and obtained the flood susceptibility map.
3.4. Quality Assessment and Validation
The accuracy detection of the flood susceptibility map is important for verifying the effectiveness of UGC.
Several statistical indices, such as confusion matrix, receiver operating characteristic (ROC), and area under curve (AUC), were used to assess the performance of a classifier [
46]. Four parameters in confusion matrix, namely true positive (TP), true negative (TN), false positive (FP), and false negative (FN), widely used in different types of evaluation models, such as decision tree, logistic regression, and linear discriminant analysis [
7,
47], were calculated (see
Table 4).
According to the confusion matrix, the indexes for model validity can be calculated. The overall accuracy (
OA) represents the proportion of samples that predict correctly (
TP and
TN) in all samples.
OA can directly reflect the correct proportion of points, but when the number of samples in each category is not balanced, it is necessary to use the Kappa coefficient to evaluate the accuracy of the model, which is calculated as follows.
The Kappa coefficient is a measure of the comparison between the effective prediction result and random guess, and the value is between 0 and 1. The higher the Kappa coefficient, the higher the explanatory power of the model.
Both OA and Kappa coefficients are an evaluation of the overall performance of the model. Some models may have high overall accuracy, but the prediction of a certain category contains a large number of errors. For a single category, there are producer’s accuracy and user’s accuracy to measure the prediction error in a single category. Producer’s accuracy (PA) is calculated by dividing the number of correctly predicted points by the total reference points: for flood, ; for non-flood, . User’s accuracy (UA) is another indicator that characterizes the number of missed errors in a single category. It is the number of correctly predicted points divided by the total number of predicted points: for flood, ; for non-flood, ,
4. Results
4.1. Conditioning Factor Statistics
Before modeling, the independence of variables was tested using the Statistical Package for the Social Sciences (SPSS). When two or more variables are highly correlated, multicollinearity appears, which is an issue that should be seriously considered. In statistics, two parameters called tolerance (TOL) and the variance inflation factor (VIF, the reciprocal of the TOL) are widely used to indicate whether multicollinearity appears. In general, if the value of TOL is greater than 0.1 and VIF is less than 10, then it indicates that there is no multicollinearity among the variables. Herein, according to the criteria, the model satisfies the requirements of no multicollinearity (
Table 5).
After the collinearity test, a statistical analysis was carried out to intuitively understand how factors affect the occurrence of floods. Factors of maximum daily rainfall, DEM, slope, and distance from river were divided into five categories according to the natural breakpoint method. Aspect, land use, and curvature were categorized according to their natural attributes.
It can be seen from the first category in
Table 6 that floods mainly occur in areas where the maximum daily rainfall exceeds 150 mm. As the precipitation increases, the number of flood points also increases. In the DEM category, 52.47% of the collected floods were found to occur at an altitude of less than 80 m, and the majority of the floods occur at elevations from 48 m to 160 m. For slope, most of the flood events occurred between slope values of 0° and 14°, accounting for 94.63% of the total flood occurrence. The aspect has nine directions: Flat, North, Northeast, East, Southeast, South, Southwest, West, and Northwest. However, no matter which direction, they contained a certain number of the flood occurrence points, and no obvious tendency was found. Therefore, for the occurrence of floods, slope seems to be more important than aspect in Ji’an. Curvature can be divided into concave, flat, and convex. The concave and flat areas are more prone to flooding than the convex surface. Note that 81 flood points were located on a convex surface, but according to our statistic, the convex curvatures of these points were all very small and the maximum value did not exceed 0.04. Land use was identified to have five categories: construction land, cultivated land, woodland, lawn, and water area. Data showed that the majority of flood points were located on construction land (accounted for 67.36%), while woodland was less likely to experience floods. Statistics from NDVI in the table showed that only a few points were located in areas with a high NDVI value. In the last category of the table, distance from river, we found that the farther away from the river, the fewer points the flood was reported at.
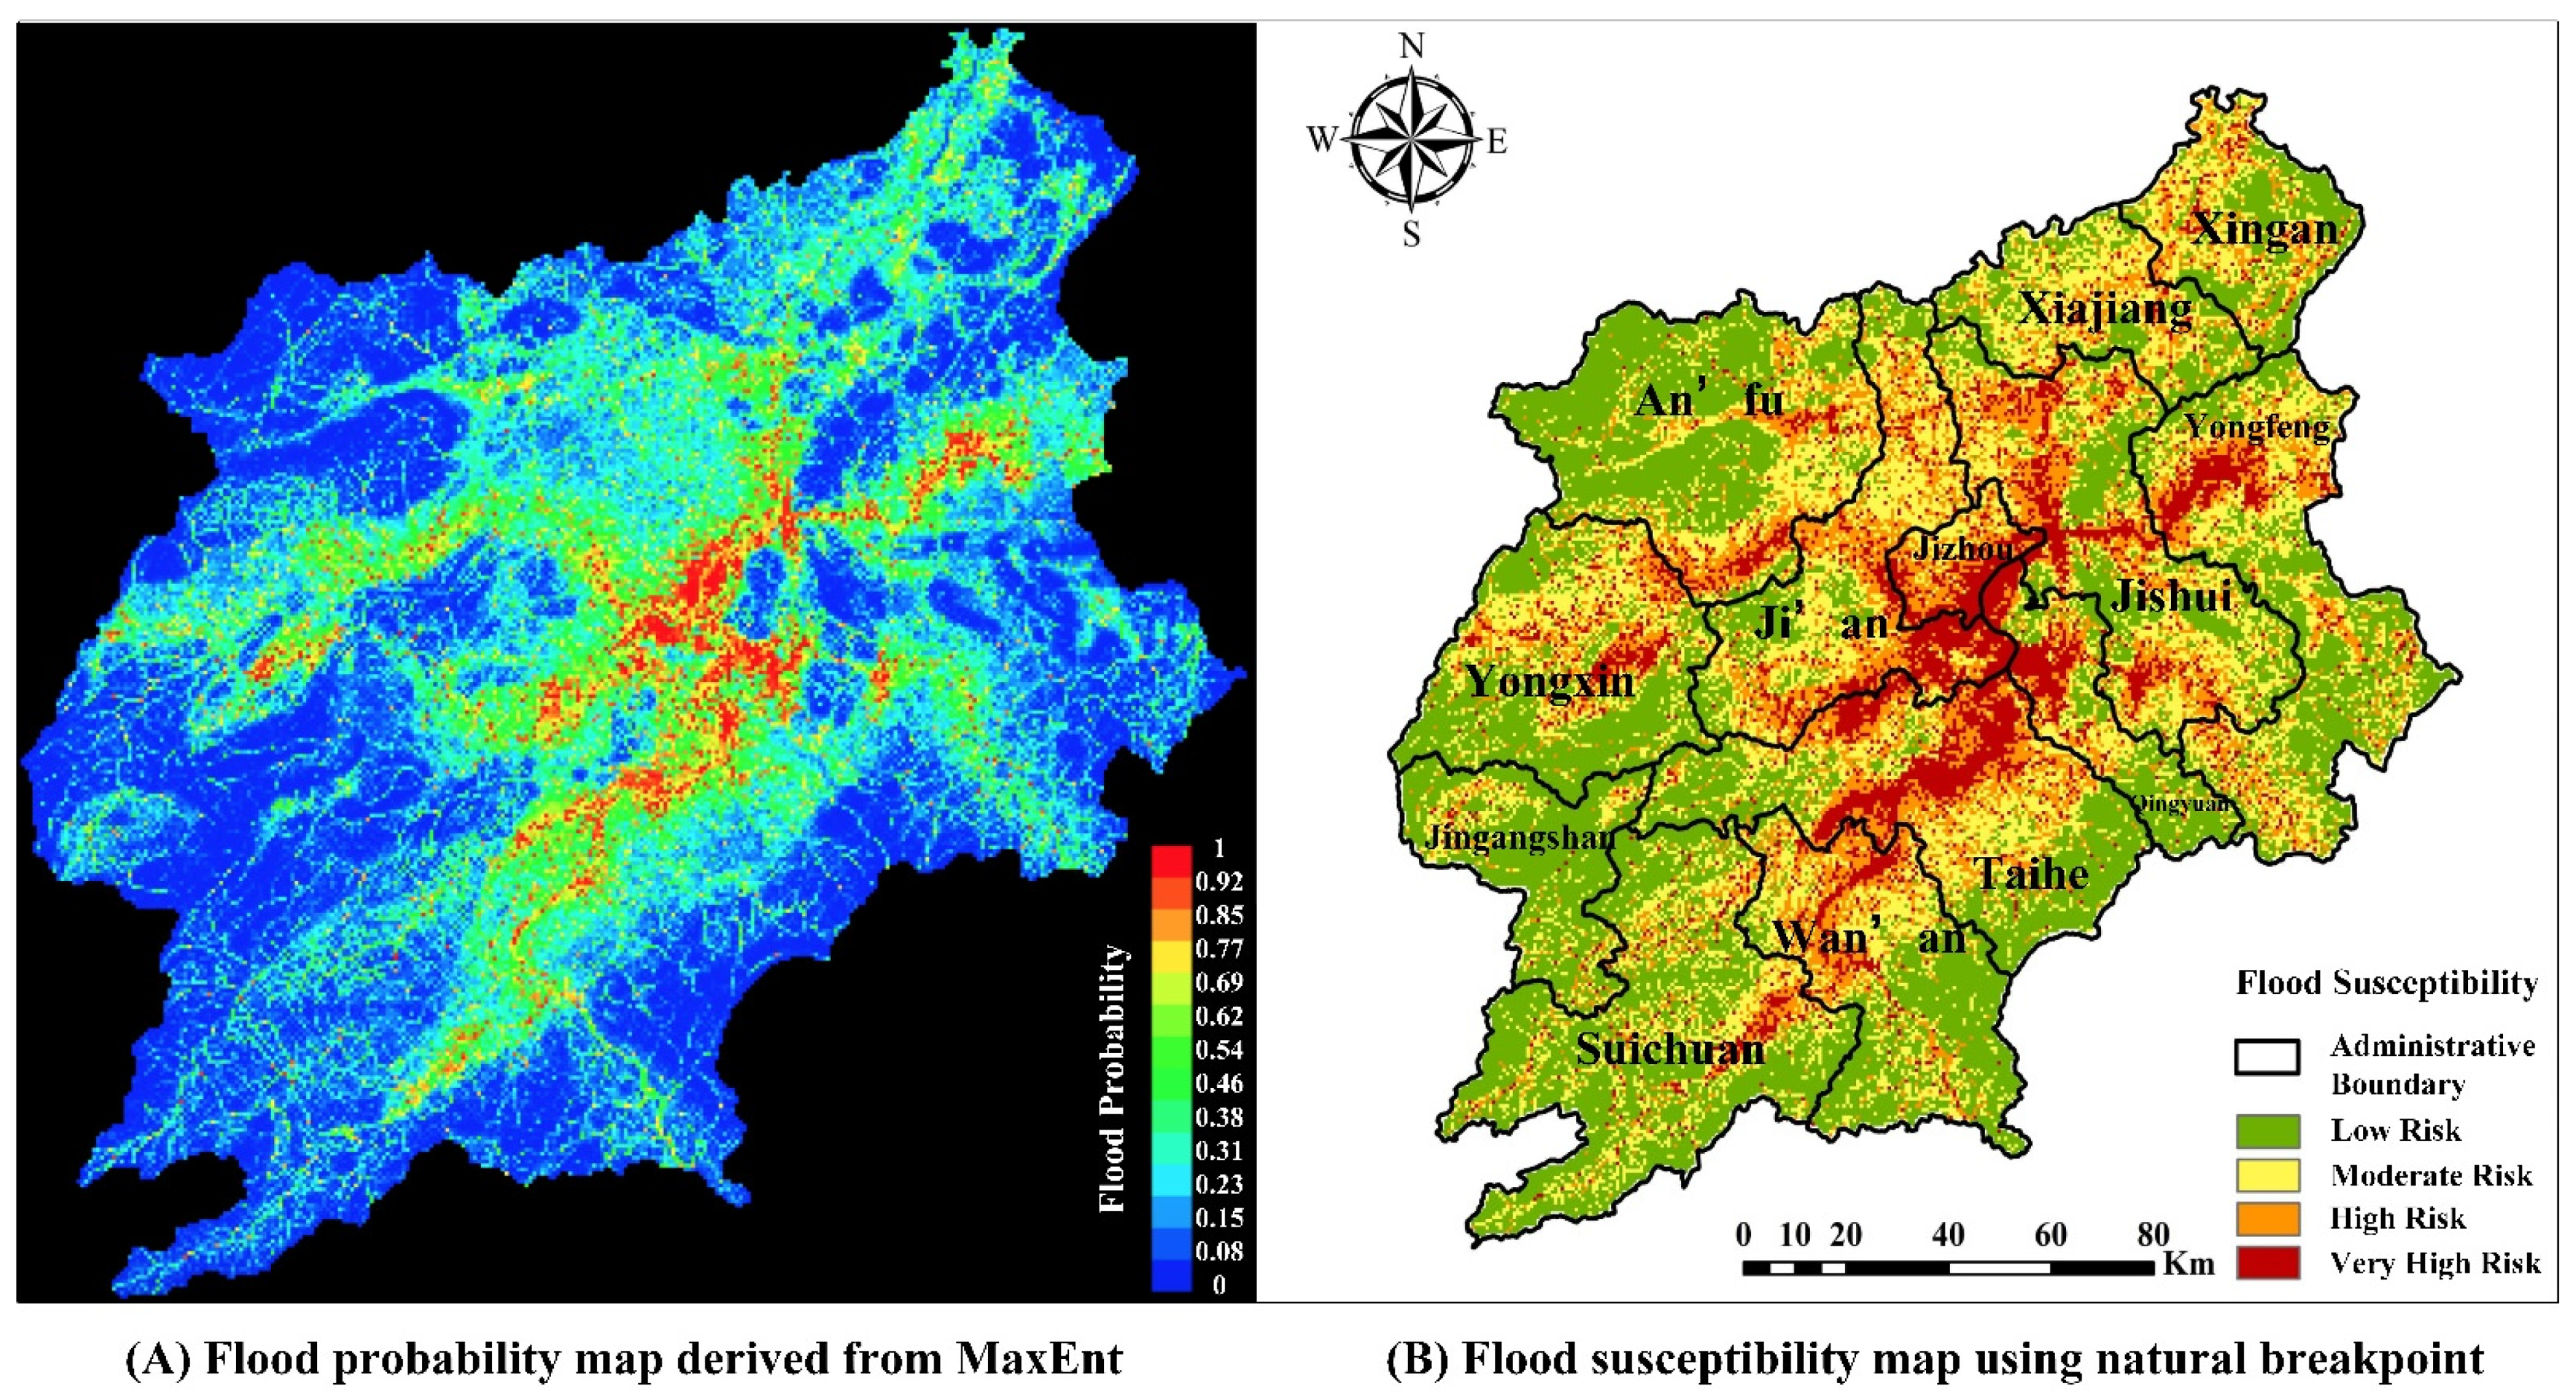
4.2. Susceptibility Map
The MaxEnt model has requirements of the conditioning factors’ data format. All the raster images should be processed into ASCII images with exactly the same geographic extents, the same number of rows and columns, and the same value of pixel size. To reduce the error, we repeated the experiment three times and averaged the results to generate flood probability map, as shown in
Figure 5A.
As can be seen from the figure, the high-risk areas of floods are mainly distributed in the middle of Ji’an County and have a meandering shape. Overlaying
Figure 4f and
Figure 5A in ArcGIS, it can be seen that the high-risk areas predicted by the model were places where construction land was highly concentrated. In addition, surrounding areas of Ji’an County were predicted to have low flood risk, where woodland is the main type of land use.
To get a hierarchical map for further data analysis, the natural breakpoint method was used to divide the level of flood risk (
Figure 5A) into four categories, as shown in
Figure 5B. The predicted high-risk areas for flood in Ji’an County were concentrated in Jizhou, Ji’an, Taihe, and Yongfeng districts. Comparing with
Figure 4a, it could be seen that the maximum rainfall is also heavily concentrated in these four districts.
Data statistics of
Figure 5B are listed in
Table 7. The high risk and high susceptibility level cover an area of 7221.9 km
2, accounting for 29.29% of the total land area. The flood disasters were densely distributed in these areas and contained 86% of the total flood points. The data also showed that there are 10,345.8 km
2 of land located in a low-risk area, accounting for 41.9% of the total land area which means residents living in these areas do not have to worry too much about the occurrence of floods.
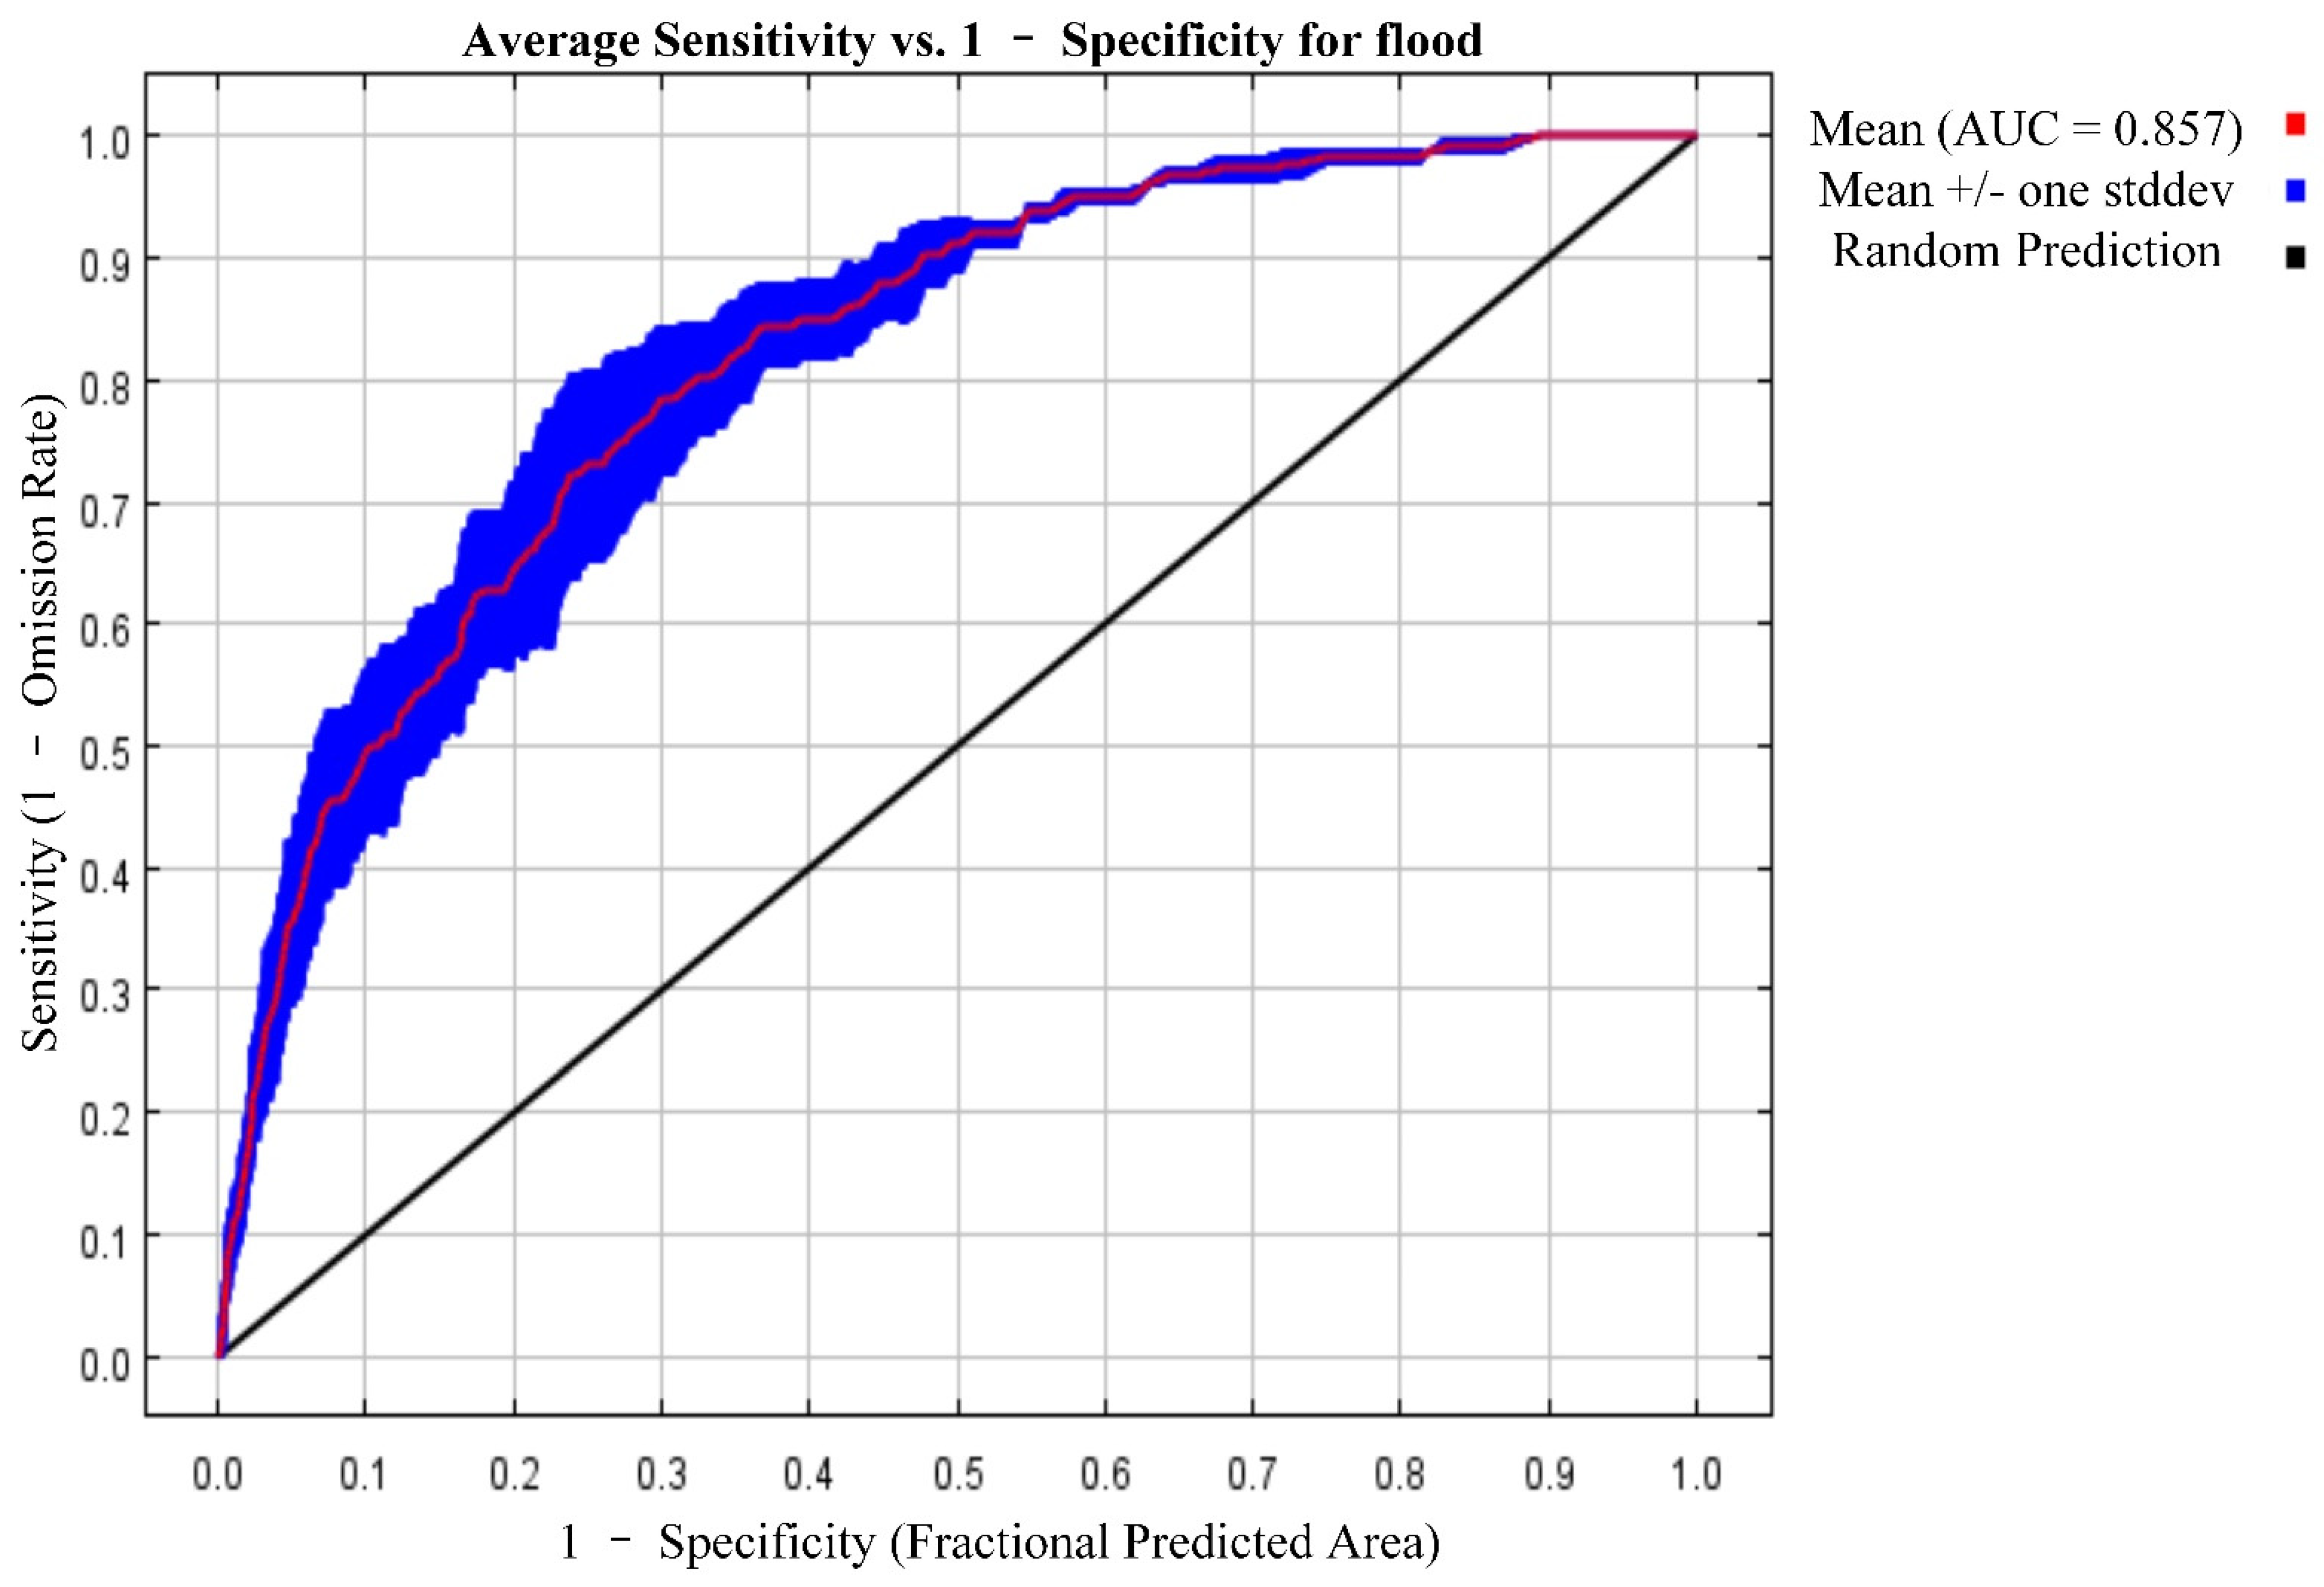
4.3. Accuracy Test
Several statistical indices were used to test the accuracy of the model.
Figure 6 shows the receiver operating characteristic (ROC) curve, which was averaged over the three times’ model results. The average test AUC for the three times’ runs is 0.857. As can be seen in the figure, the thickness of the curve in the picture denoted the fluctuation range of the ROC curve of the three times’ experiments, and the standard deviation of the three times’ results is 0.027, which means that even in the worst experiment of the three, the AUC of the model is 0.83. In general, an AUC of 0.5 suggests no discrimination (i.e., ability to judge areas prone or not prone to flooding based on the test), 0.7 to 0.8 is considered acceptable, 0.8 to 0.9 is considered excellent, and more than 0.9 is considered outstanding. Thus, the predictive ability of our model is excellent.
To derive the confusion matrix, 51 flood points we saved from reliable and official media and 51 non-flood points generated by random seed algorithm were used. We set the flood sensitivity threshold to 0.7 to generate a binary map of flood occurrence.
A manual inspection was conducted on the 102 points. Among the 51 reference pixels of flood, 46 points were correctly predicted and 5 points were predicted as non-flood. Among the 51 reference pixels of non-flood, 49 points were correctly predicted and 2 were misclassified. The specific number was listed as the confusion matrix shown in
Table 8.
As can be seen from
Table 8, the overall accuracy of the model is 93.14% and the Kappa coefficient is 0.916, which verified the overall reliability of the model. The performance of the user’s accuracy was 95.8% and 90.7% for flood and non-flood, respectively. The producer’s accuracy was 90.2% and 96.07% for flood and non-flood, respectively. The producers’ accuracies and the user’s accuracies were all above 90%, which means the model can make good predictions for each sub-category, verifying the reliability of the model.
4.4. Analysis of Variable Contributions
In this section, quantitative analysis of indices was adopted to evaluate the contribution of each influencing factor.
Percent contribution of each conditioning factor was calculated. The index represents the normalized cumulative value of the variable gain in each iteration. To determine the value of the index, the increase in regularized gain is added to the contribution of the corresponding variable in each iteration of the training algorithm or subtracted from it if the change to the absolute value of lambda is negative. After the gains of all variables were accumulated, the values were normalized to percentages. Permutation importance measures the increase in the prediction error of the model after features are permuted. To determine the value of the index, the values of a certain variable on training presence and background data were randomly permuted for each conditioning variable in turn. After permuting, the model was reevaluated on the permuted data, and the resulting drop in training AUC, which was normalized to percentages, was calculated and listed in
Table 9.
As can be found in the table, the top three variables that contributed most to flood risks were land use, slope, and distance from river. Their contribution rate was 54.6%, 16.7%, and 14.3%, respectively. According to our previous qualitative analysis, it could be inferred that areas covered with construction surface, located on flat terrain, and close to a river were at extremely high flood risk. As could be seen, although the contribution rate of slope factor was not as high as land use, the permutation importance showed that permuting the slope variable would bring about 38% of the model error, which made it the most indispensable variable among all variables. Rainfall factor ranked fourth in percent of contribution, which implied the impact of precipitation on flood risk was also worth noting. The DEM factor made 3.6% of the contribution to predicting flood disasters, but removing this variable would only bring about 1.9% error to the model, ranking last in permutation importance among all variables. The curvature factor did not make much contribution to predicting flood disasters (only 3.2%), but removing this variable would bring a considerable 13.7% error to the model, ranking fourth among all variables. The contribution rate of the factor NDVI ranked last in percent of contribution, but it has some permutation importance. Taking percent contribution and permutation importance together, it seemed that the aspect factor would be the least important factor of all factors, which was consistent with our analysis of flood point statistics.
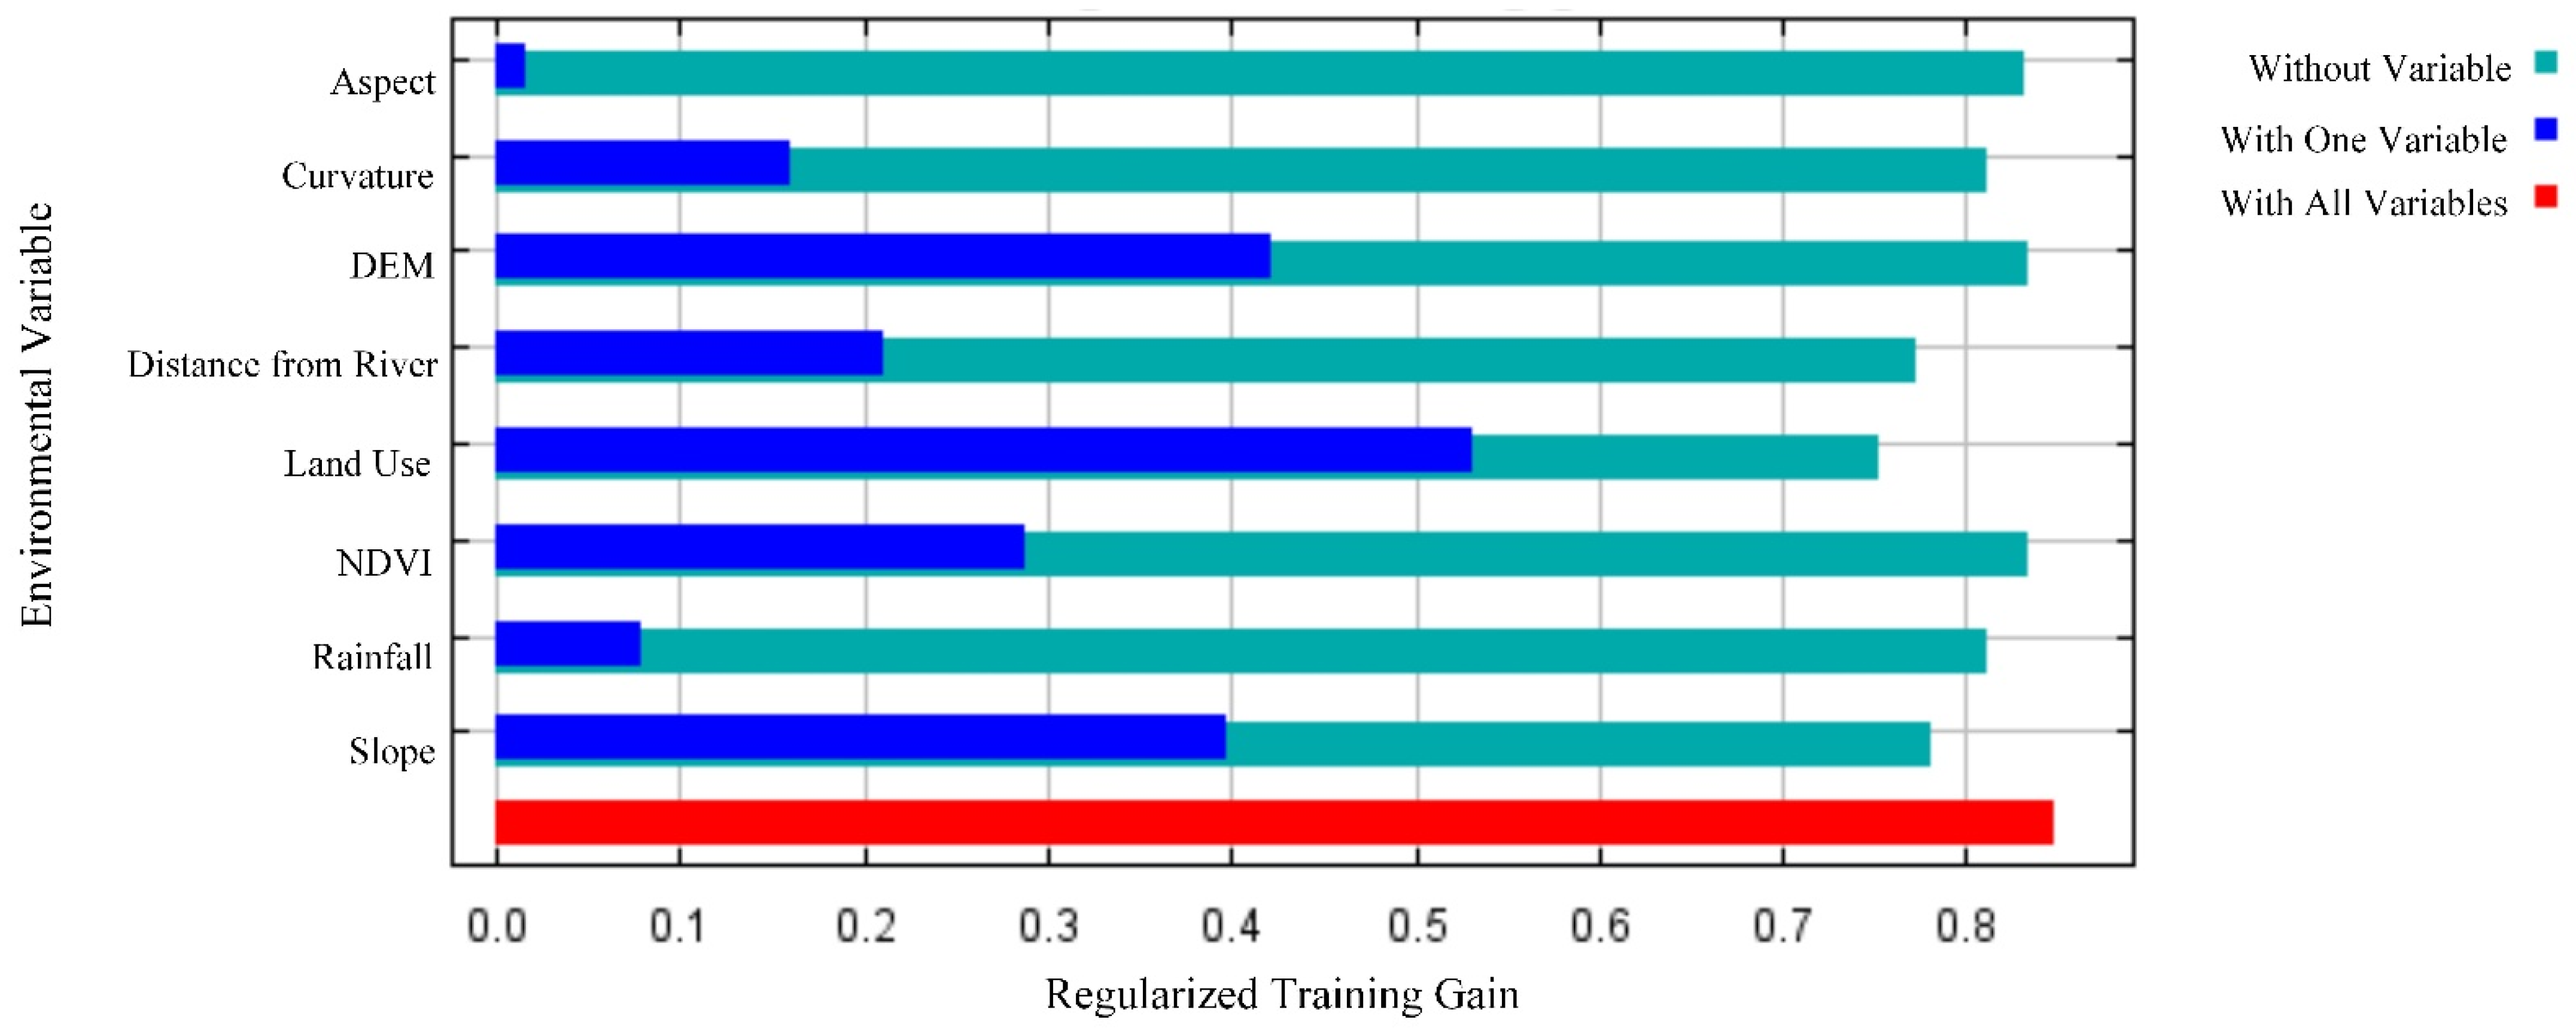
Figure 7 shows the results of the jackknife test of variable importance. The jackknife is a resampling technique that estimates parameters by systematically leaving out each factor from a dataset and calculating the values and then finding the average of these calculations. The blue bar represents the gain of the model with the only factor, the red bar represents the gain with all factors, and the green bar represents the gain loss without the factor.
The conditioning factor with the highest gain was again land use when used in isolation of the jackknife test, which therefore appears to have the most useful information by itself. In addition, when land use was omitted, the gain decreased the most, which made it the factor that has the most information that is not present in the other variables. It is worth noting that the DEM and slope factor independently contained more than 40% of the useful information, which was a supplement to our above analysis.
5. Discussion
Understanding the factors that contribute to flood occurrence and mapping the susceptibility to flood disasters is fundamental in managing flood hazards. UGC, as a new scientific data collection method, has begun to draw attention in flood management. Aided by information technology, such as smartphones and web applications, stakeholders including ordinary residents have more abilities to help observe flood phenomena. Therefore, it is crucial for scientists and management to integrate stakeholders’ contributions into flood hazard management, especially in those areas where the traditional monitoring network is not well covered. Based on these fundamental principles, this study presented the results of a comprehensive flood susceptibility assessment using UGC as the data source for the Ji’an areas. Using social media users’ observations and reports, a flood susceptibility map was obtained through the MaxEnt model and described the probability of the flood occurrence. A statistical analysis of flood points was conducted, and the importance of eight conditioning factors was analyzed qualitatively and quantitatively.
Percent contribution showed that land use, slope, and distance from river are the top three factors that contribute most to flood occurrence. Permutation importance value indicated that slope is the most indispensable factor when making the flood susceptibility map. Jackknife test revealed that the land-use factor contains the most useful information to evaluate flood risk that is not present in the other variables. The flood points crawled from official and authentic media verified the accuracy of the UGC-generated map. These flood points were mostly located in areas prone to flood, and the confusion matrix showed an overall accuracy of 93.14% of the map (see
Table 8). In addition, the model achieved a satisfactory result with an ROC value of 85.7%.
The mapping reminds us that the high-risk areas are mainly distributed in those communities that are close to rivers. Four administrative districts, i.e., Ji’an, Jizhou, Taihe, and Yongfeng, were identified to have the highest flood risk. The information in the map is very valuable for disaster reduction. For instance, if an area is assigned with “high values” in the susceptibility map, flood management such as drainage system improvement should be given priority in these areas. Large areas of impervious surfaces should not be planned for construction in high-flood-risk areas, such as areas with low slope terrain close to the river. In addition, an increase in the use ratio of woodland in the city can reduce the risk of flood hazards.
The case study shows that the model was able to recognize high-risk areas with few reports. Due to the adverse effects of floods on the lives of local residents, locations with frequent floods are likely to respond on social media. In a mountainous area, such as Ji’an City, where data are difficult to obtain, using data generated by users on the network as a data source can also help city managers identify flood risks. The flood events on the network provide a valuable resource for scientific research and disaster recovery and they can break through the bottleneck of data quantity to analyze the flood disaster in mountainous areas. Thus, UGC in flood management was of great value and particularly significant for planning purposes or for establishing land-use regulations.
In the age of the Internet, scientists should integrate users’ contribution to flood disaster management. Although the Internet landscape in China is different from other countries, the role and contents of UGC on social media of different countries are similar and can be used in hydrological monitoring, estimating flood inundation extent, and flood event detection for effective disaster risk management. Our analysis provides useful insights for flood susceptibility assessment. The results of our model are satisfying, which provides a way for other mountainous cities to carry out the research.
Using network media data as a data source is still facing some challenges. First of all, the spatial distribution of flood events tends to be in areas with high population density, and media reports are more likely to be concentrated in regions with higher economic losses. Secondly, the number of potential contributors affects the effectiveness of the method, while the regional smartphone and Internet penetration affect the number of potential contributors. In some areas, there may be fewer people using the network to publish location information. In addition, although collecting social media data is more labor-saving than field survey of flood occurrence, crawling data still need to be verified manually and removing repeated reports, which reduces the efficiency of flood assessment. More state-of-the-art natural language processing algorithms need to be applied to the process of extracting geographic locations of floods. The efficiency and accuracy comparison between the flood susceptibility model of UGC and field survey data can be conducted in future studies.
6. Conclusions
Floods are the most frequent type of natural disaster that seriously affects people’s lives and property globally. Food susceptibility assessment is one of the critical approaches to mitigate flood impacts. The inadequate field survey and lack of data hinder the assessment of flood sensitivity in mountainous and hilly areas. The effectiveness of using UGC reported on social media as source data in flood sensitivity assessment in mountainous areas remains unknown. This study used different types of UGC on the web (i.e., text, photo, video) across web platforms (websites, blogs) to model flood susceptibility in a mountainous-hilly area that is severely affected by floods. The application of UGC in this study was novel, and the state-of-the-art MaxEnt algorithm was adopted to draw the susceptibility map. Moreover, several indicators commonly used in the field of machine learning were used here to evaluate the importance of each conditioning factor. The results reveal that UGC is of great value for flood susceptibility assessment and proved to be an effective data source. The proposed model is practical and has high accuracy. Factors of land use, slope, and distance from river were found to contribute most to the occurrence of floods in this area. The accumulative UGC can be used as an important supplement to the insufficient field survey data. Thus, in the future, flood management should pay more attention to bringing in stakeholders’ contribution and public participation. The limitations of UGC are worth noting, that is, the spatial distribution of floods will be affected by population density and smartphone penetration. More efficient algorithms for mining flood-related UGC data need to be studied in the future, and a better mechanism should be established to motivate users to participate more actively in flood disaster management.
Author Contributions
Conceptualization, Z.Z. and A.R.H.; methodology, Z.Z., Y.L. and J.L. and A.R.H.; software, Z.Z., Y.L. and J.L.; validation, Z.Z., Y.L., J.L., A.R.H.; writing—original draft preparation, Z.Z. and A.R.H.; writing—review and editing, Z.Z., Y.L., J.L. and A.R.H.; supervision, Z.Z.; funding acquisition, Z.Z. All authors have read and agreed to the published version of the manuscript.
Funding
This work was supported by the National Key Research and Development Program of China (Grant No. 2017YFC0212605).
Institutional Review Board Statement
Not applicable.
Informed Consent Statement
Not applicable.
Data Availability Statement
Not applicable.
Conflicts of Interest
The authors declare no conflict of interest.
References
- Rodriguez-Morata, C.; Ballesteros-Cánovas, J.A.; Trappmann, D.; Beniston, M.; Stoffel, M. Regional Reconstruction of Flash Flood History in the Guadarrama Range (Central System, Spain). Sci. Total Environ. 2016, 550, 406–417. [Google Scholar] [CrossRef] [Green Version]
- Zhang, Y.; Wang, Y.; Chen, Y.; Liang, F.; Liu, H. Assessment of Future Flash Flood Inundations in Coastal Regions under Climate Change Scenarios—A Case Study of Hadahe River Basin in Northeastern China. Sci. Total Environ. 2019, 693, 133550. [Google Scholar] [CrossRef] [PubMed]
- Adiat, K.A.N.; Nawawi, M.N.M.; Abdullah, K. Assessing the Accuracy of GIS-Based Elementary Multi Criteria Decision Analysis as a Spatial Prediction Tool—A Case of Predicting Potential Zones of Sustainable Groundwater Resources. J. Hydrol. 2012, 440, 75–89. [Google Scholar] [CrossRef]
- Bui, D.T.; Panahi, M.; Shahabi, H.; Singh, V.P.; Shirzadi, A.; Chapi, K.; Khosravi, K.; Chen, W.; Panahi, S.; Li, S. Novel Hybrid Evolutionary Algorithms for Spatial Prediction of Floods. Sci. Rep. 2018, 8, 1–14. [Google Scholar] [CrossRef] [PubMed] [Green Version]
- Costache, R. Flash-Flood Potential Assessment in the Upper and Middle Sector of Prahova River Catchment (Romania). A Comparative Approach between Four Hybrid Models. Sci. Total Environ. 2019, 659, 1115–1134. [Google Scholar] [CrossRef]
- Zhao, G.; Pang, B.; Xu, Z.; Yue, J.; Tu, T. Mapping Flood Susceptibility in Mountainous Areas on a National Scale in China. Sci. Total Environ. 2018, 615, 1133–1142. [Google Scholar] [CrossRef] [PubMed]
- Chen, W.; Li, Y.; Xue, W.; Shahabi, H.; Li, S.; Hong, H.; Wang, X.; Bian, H.; Zhang, S.; Pradhan, B. Modeling Flood Susceptibility Using Data-Driven Approaches of Naïve Bayes Tree, Alternating Decision Tree, and Random Forest Methods. Sci. Total Environ. 2020, 701, 134979. [Google Scholar] [CrossRef] [PubMed]
- Mahanta, R.; Das, D. Flood Induced Vulnerability to Poverty: Evidence from Brahmaputra Valley, Assam, India. Int. J. Disaster Risk Reduct. 2017, 24, 451–461. [Google Scholar] [CrossRef]
- Cloke, H.L.; Pappenberger, F. Ensemble Flood Forecasting: A Review. J. Hydrol. 2009, 375, 613–626. [Google Scholar] [CrossRef]
- Diakakis, M.; Deligiannakis, G.; Pallikarakis, A.; Skordoulis, M. Factors Controlling the Spatial Distribution of Flash Flooding in the Complex Environment of a Metropolitan Urban Area. The Case of Athens 2013 Flash Flood Event. Int. J. Disaster Risk Reduct. 2016, 18, 171–180. [Google Scholar] [CrossRef]
- Zehra, D.; Mbatha, S.; Campos, L.C.; Queface, A.; Beleza, A.; Cavoli, C.; Achuthan, K.; Parikh, P. Rapid Flood Risk Assessment of Informal Urban Settlements in Maputo, Mozambique: The Case of Maxaquene A. Int. J. Disaster Risk Reduct. 2019, 40, 101270. [Google Scholar] [CrossRef]
- Santos, P.P.; Reis, E.; Pereira, S.; Santos, M. A Flood Susceptibility Model at the National Scale Based on Multicriteria Analysis. Sci. Total Environ. 2019, 667, 325–337. [Google Scholar] [CrossRef]
- Tullos, D.; Byron, E.; Galloway, G.; Obeysekera, J.; Prakash, O.; Sun, Y.-H. Review of Challenges of and Practices for Sustainable Management of Mountain Flood Hazards. Nat. Hazards 2016, 83, 1763–1797. [Google Scholar] [CrossRef]
- Ruiz-Villanueva, V.; Díez-Herrero, A.; Bodoque, J.M.; Cánovas, J.B.; Stoffel, M. Characterisation of Flash Floods in Small Ungauged Mountain Basins of Central Spain Using an Integrated Approach. Catena 2013, 110, 32–43. [Google Scholar] [CrossRef]
- Weingartner, R.; Barben, M.; Spreafico, M. Floods in Mountain Areas—An Overview Based on Examples from Switzerland. J. Hydrol. 2003, 282, 10–24. [Google Scholar] [CrossRef]
- Michelsen, N.; Dirks, H.; Schulz, S.; Kempe, S.; Al-Saud, M.; Schüth, C. YouTube as a Crowd-Generated Water Level Archive. Sci. Total Environ. 2016, 568, 189–195. [Google Scholar] [CrossRef] [PubMed]
- Shepherd, T. Twittering in the Oecd’s “Participative Web”: Microblogging and New Media Policy. Glob. Media J. 2009, 2, 149–165. [Google Scholar]
- Rossi, C.; Acerbo, F.S.; Ylinen, K.; Juga, I.; Nurmi, P.; Bosca, A.; Tarasconi, F.; Cristoforetti, M.; Alikadic, A. Early Detection and Information Extraction for Weather-Induced Floods Using Social Media Streams. Int. J. Disaster Risk Reduct. 2018, 30, 145–157. [Google Scholar] [CrossRef] [Green Version]
- Hung, K.-C.; Kalantari, M.; Rajabifard, A. Methods for Assessing the Credibility of Volunteered Geographic Information in Flood Response: A Case Study in Brisbane, Australia. Appl. Geogr. 2016, 68, 37–47. [Google Scholar] [CrossRef]
- Starkey, E.; Parkin, G.; Birkinshaw, S.; Large, A.; Quinn, P.; Gibson, C. Demonstrating the Value of Community-Based (‘Citizen Science’) Observations for Catchment Modelling and Characterisation. J. Hydrol. 2017, 548, 801–817. [Google Scholar] [CrossRef]
- Bhuvana, N.; Aram, I.A. Facebook and Whatsapp as Disaster Management Tools during the Chennai (India) Floods of 2015. Int. J. Disaster Risk Reduct. 2019, 39, 101135. [Google Scholar] [CrossRef]
- Allan, S.; Thorsen, E. Citizen Journalism: Global Perspectives; Peter Lang: New York, NK, USA, 2009; Volume 1, ISBN 1-4331-0295-1. [Google Scholar]
- Buytaert, W.; Dewulf, A.; De Bièvre, B.; Clark, J.; Hannah, D.M. Citizen Science for Water Resources Management: Toward Polycentric Monitoring and Governance? J. Water Resour. Plan. Manag. 2016, 142, 01816002. [Google Scholar] [CrossRef] [Green Version]
- Rosser, J.F.; Leibovici, D.G.; Jackson, M.J. Rapid Flood Inundation Mapping Using Social Media, Remote Sensing and Topographic Data. Nat. Hazards 2017, 87, 103–120. [Google Scholar] [CrossRef] [Green Version]
- Weeser, B.; Kroese, J.S.; Jacobs, S.R.; Njue, N.; Kemboi, Z.; Ran, A.; Rufino, M.C.; Breuer, L. Citizen Science Pioneers in Kenya–A Crowdsourced Approach for Hydrological Monitoring. Sci. Total Environ. 2018, 631, 1590–1599. [Google Scholar] [CrossRef] [Green Version]
- Fang, J.; Hu, J.; Shi, X.; Zhao, L. Assessing Disaster Impacts and Response Using Social Media Data in China: A Case Study of 2016 Wuhan Rainstorm. Int. J. Disaster Risk Reduct. 2019, 34, 275–282. [Google Scholar] [CrossRef]
- Zeng, Z.; Lan, J.; Hamidi, A.R.; Zou, S. Integrating Internet Media into Urban Flooding Susceptibility Assessment: A Case Study in China. Cities 2020, 101, 102697. [Google Scholar] [CrossRef]
- Lyu, H.-M.; Sun, W.-J.; Shen, S.-L.; Arulrajah, A. Flood Risk Assessment in Metro Systems of Mega-Cities Using a GIS-Based Modeling Approach. Sci. Total Environ. 2018, 626, 1012–1025. [Google Scholar] [CrossRef] [PubMed]
- Choubin, B.; Moradi, E.; Golshan, M.; Adamowski, J.; Sajedi-Hosseini, F.; Mosavi, A. An Ensemble Prediction of Flood Susceptibility Using Multivariate Discriminant Analysis, Classification and Regression Trees, and Support Vector Machines. Sci. Total Environ. 2019, 651, 2087–2096. [Google Scholar] [CrossRef]
- Chen, W.; Hong, H.; Li, S.; Shahabi, H.; Wang, Y.; Wang, X.; Ahmad, B.B. Flood Susceptibility Modelling Using Novel Hybrid Approach of Reduced-Error Pruning Trees with Bagging and Random Subspace Ensembles. J. Hydrol. 2019, 575, 864–873. [Google Scholar] [CrossRef]
- Dodangeh, E.; Choubin, B.; Eigdir, A.N.; Nabipour, N.; Panahi, M.; Shamshirband, S.; Mosavi, A. Integrated Machine Learning Methods with Resampling Algorithms for Flood Susceptibility Prediction. Sci. Total Environ. 2020, 705, 135983. [Google Scholar] [CrossRef]
- Zhang, K.; Zhang, Y.; Zhou, C.; Meng, J.; Sun, J.; Zhou, T.; Tao, J. Impact of Climate Factors on Future Distributions of Paeonia Ostii across China Estimated by MaxEnt. Ecol. Inform. 2019, 50, 62–67. [Google Scholar] [CrossRef]
- Dellicour, S.; Kastally, C.; Varela, S.; Michez, D.; Rasmont, P.; Mardulyn, P.; Lecocq, T. Ecological Niche Modelling and Coalescent Simulations to Explore the Recent Geographical Range History of Five Widespread Bumblebee Species in Europe. J. Biogeogr. 2017, 44, 39–50. [Google Scholar] [CrossRef] [Green Version]
- Couce, E.; Ridgwell, A.; Hendy, E.J. Environmental Controls on the Global Distribution of Shallow-water Coral Reefs. J. Biogeogr. 2012, 39, 1508–1523. [Google Scholar] [CrossRef] [Green Version]
- Norallahi, M.; Kaboli, H.S. Urban Flood Hazard Mapping Using Machine Learning Models: GARP, RF, MaxEnt and NB. Nat. Hazards 2021, 106, 119–137. [Google Scholar] [CrossRef]
- Fernandez, D.S.; Lutz, M.A. Urban Flood Hazard Zoning in Tucumán Province, Argentina, Using GIS and Multicriteria Decision Analysis. Eng. Geol. 2010, 111, 90–98. [Google Scholar] [CrossRef]
- Rahmati, O.; Pourghasemi, H.R.; Zeinivand, H. Flood Susceptibility Mapping Using Frequency Ratio and Weights-of-Evidence Models in the Golastan Province, Iran. Geocarto Int. 2016, 31, 42–70. [Google Scholar] [CrossRef]
- Li, K.; Wu, S.; Dai, E.; Xu, Z. Flood Loss Analysis and Quantitative Risk Assessment in China. Nat. Hazards 2012, 63, 737–760. [Google Scholar] [CrossRef]
- García-Rodríguez, M.J.; Malpica, J.A.; Benito, B.; Díaz, M. Susceptibility Assessment of Earthquake-Triggered Landslides in El Salvador Using Logistic Regression. Geomorphology 2008, 95, 172–191. [Google Scholar] [CrossRef] [Green Version]
- Shafapour Tehrany, M.; Shabani, F.; Neamah Jebur, M.; Hong, H.; Chen, W.; Xie, X. GIS-Based Spatial Prediction of Flood Prone Areas Using Standalone Frequency Ratio, Logistic Regression, Weight of Evidence and Their Ensemble Techniques. Geomat. Nat. Hazards Risk 2017, 8, 1538–1561. [Google Scholar] [CrossRef]
- Karlsson, C.S.; Kalantari, Z.; Mörtberg, U.; Olofsson, B.; Lyon, S.W. Natural Hazard Susceptibility Assessment for Road Planning Using Spatial Multi-Criteria Analysis. Environ. Manag. 2017, 60, 823–851. [Google Scholar] [CrossRef] [Green Version]
- Yalcin, A.; Reis, S.; Aydinoglu, A.C.; Yomralioglu, T. A GIS-Based Comparative Study of Frequency Ratio, Analytical Hierarchy Process, Bivariate Statistics and Logistics Regression Methods for Landslide Susceptibility Mapping in Trabzon, NE Turkey. Catena 2011, 85, 274–287. [Google Scholar] [CrossRef]
- Bui, D.T.; Tsangaratos, P.; Ngo, P.-T.T.; Pham, T.D.; Pham, B.T. Flash Flood Susceptibility Modeling Using an Optimized Fuzzy Rule Based Feature Selection Technique and Tree Based Ensemble Methods. Sci. Total Environ. 2019, 668, 1038–1054. [Google Scholar] [CrossRef] [PubMed]
- Hong, H.; Panahi, M.; Shirzadi, A.; Ma, T.; Liu, J.; Zhu, A.-X.; Chen, W.; Kougias, I.; Kazakis, N. Flood Susceptibility Assessment in Hengfeng Area Coupling Adaptive Neuro-Fuzzy Inference System with Genetic Algorithm and Differential Evolution. Sci. Total Environ. 2018, 621, 1124–1141. [Google Scholar] [CrossRef] [PubMed]
- Predick, K.I.; Turner, M.G. Landscape Configuration and Flood Frequency Influence Invasive Shrubs in Floodplain Forests of the Wisconsin River (USA). J. Ecol. 2008, 96, 91–102. [Google Scholar] [CrossRef]
- Fawcett, T. An Introduction to ROC Analysis. Pattern Recognit. Lett. 2006, 27, 861–874. [Google Scholar] [CrossRef]
- Chapi, K.; Singh, V.P.; Shirzadi, A.; Shahabi, H.; Bui, D.T.; Pham, B.T.; Khosravi, K. A Novel Hybrid Artificial Intelligence Approach for Flood Susceptibility Assessment. Environ. Model. Softw. 2017, 95, 229–245. [Google Scholar] [CrossRef]
| Publisher’s Note: MDPI stays neutral with regard to jurisdictional claims in published maps and institutional affiliations. |
© 2021 by the authors. Licensee MDPI, Basel, Switzerland. This article is an open access article distributed under the terms and conditions of the Creative Commons Attribution (CC BY) license (https://creativecommons.org/licenses/by/4.0/).


