Wind Blade Twist Correction for Enhanced Annual Energy Production of Wind Turbines

 , , and
Abstract
:1. Introduction
1.1. Literature Review
1.2. Research Objectives
2. Performance of Wind Turbine
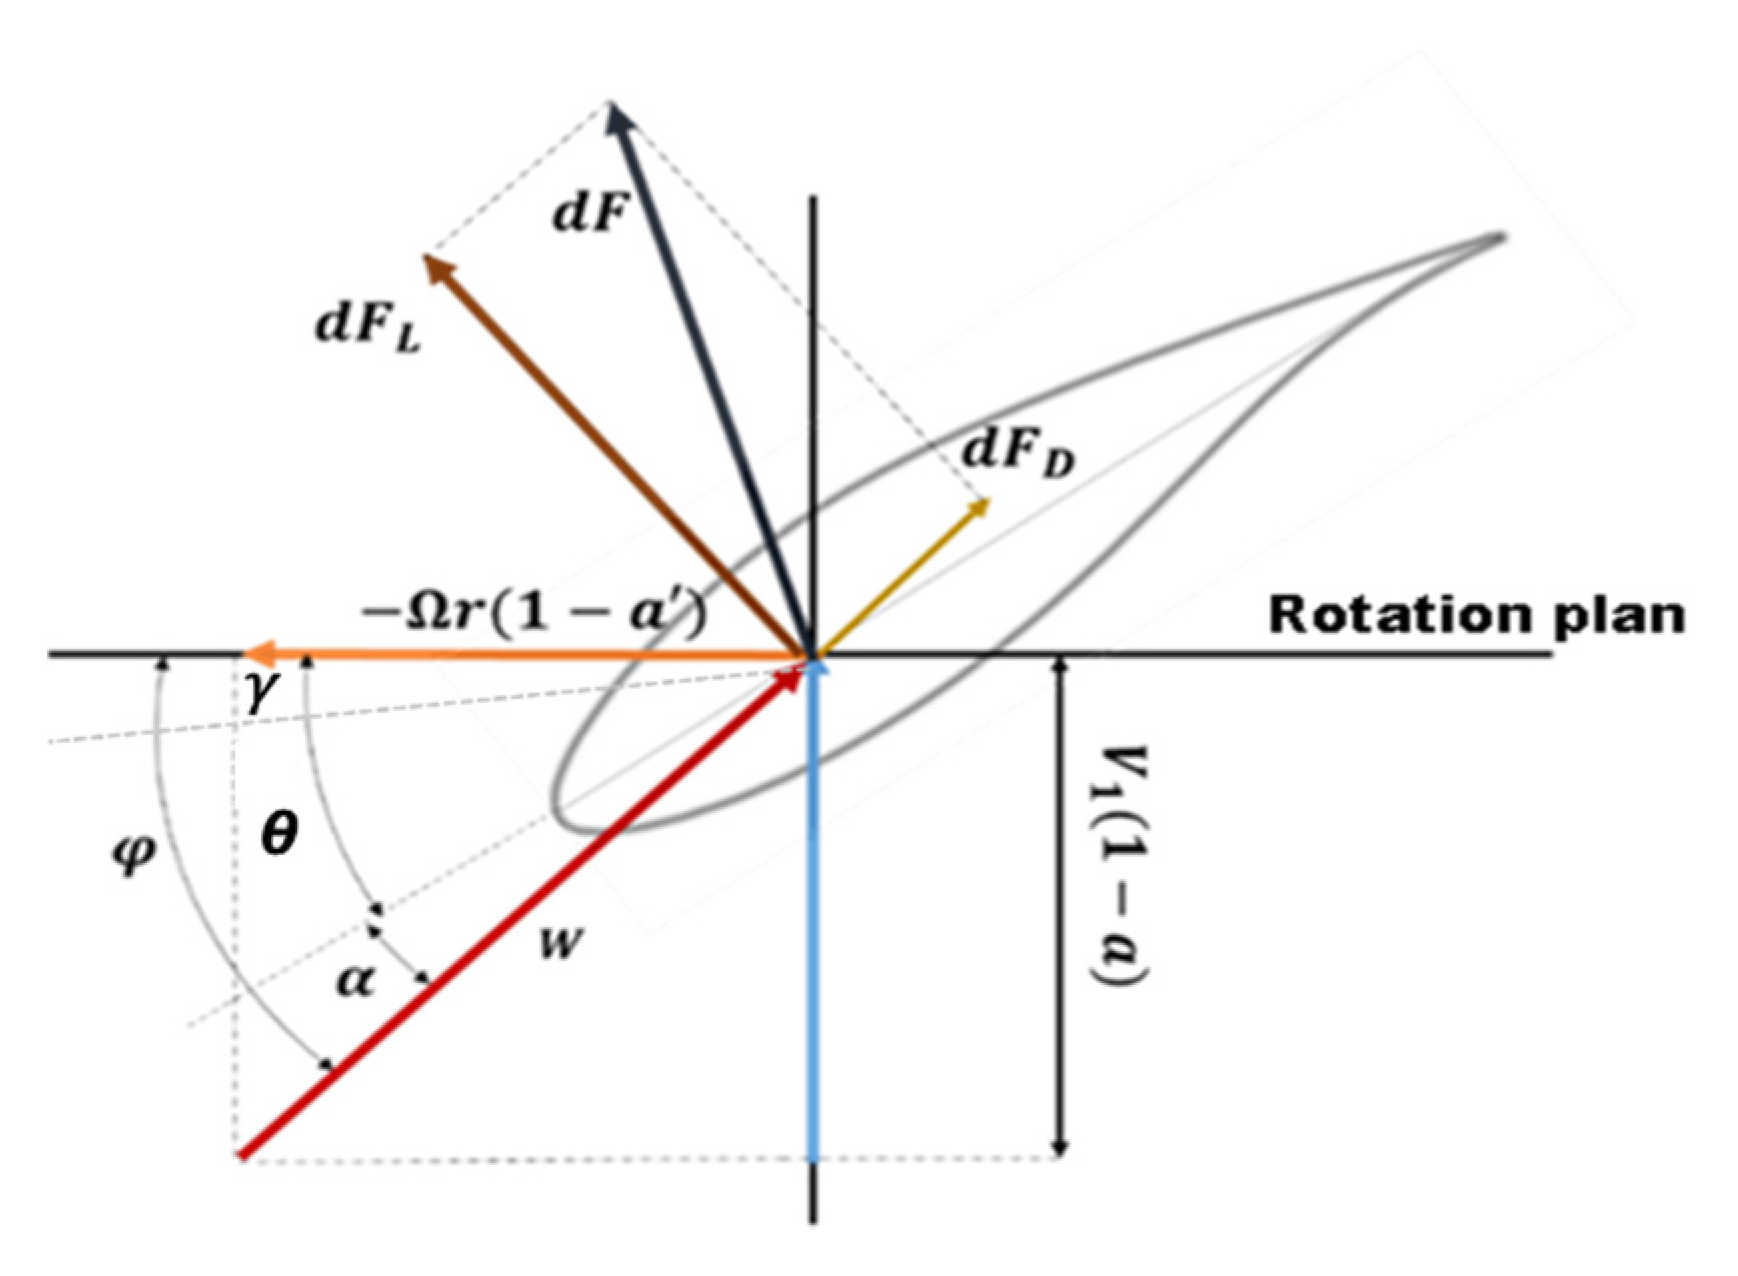
2.1. Blade Element Momentum Theory
2.2. The Annual Energy Production
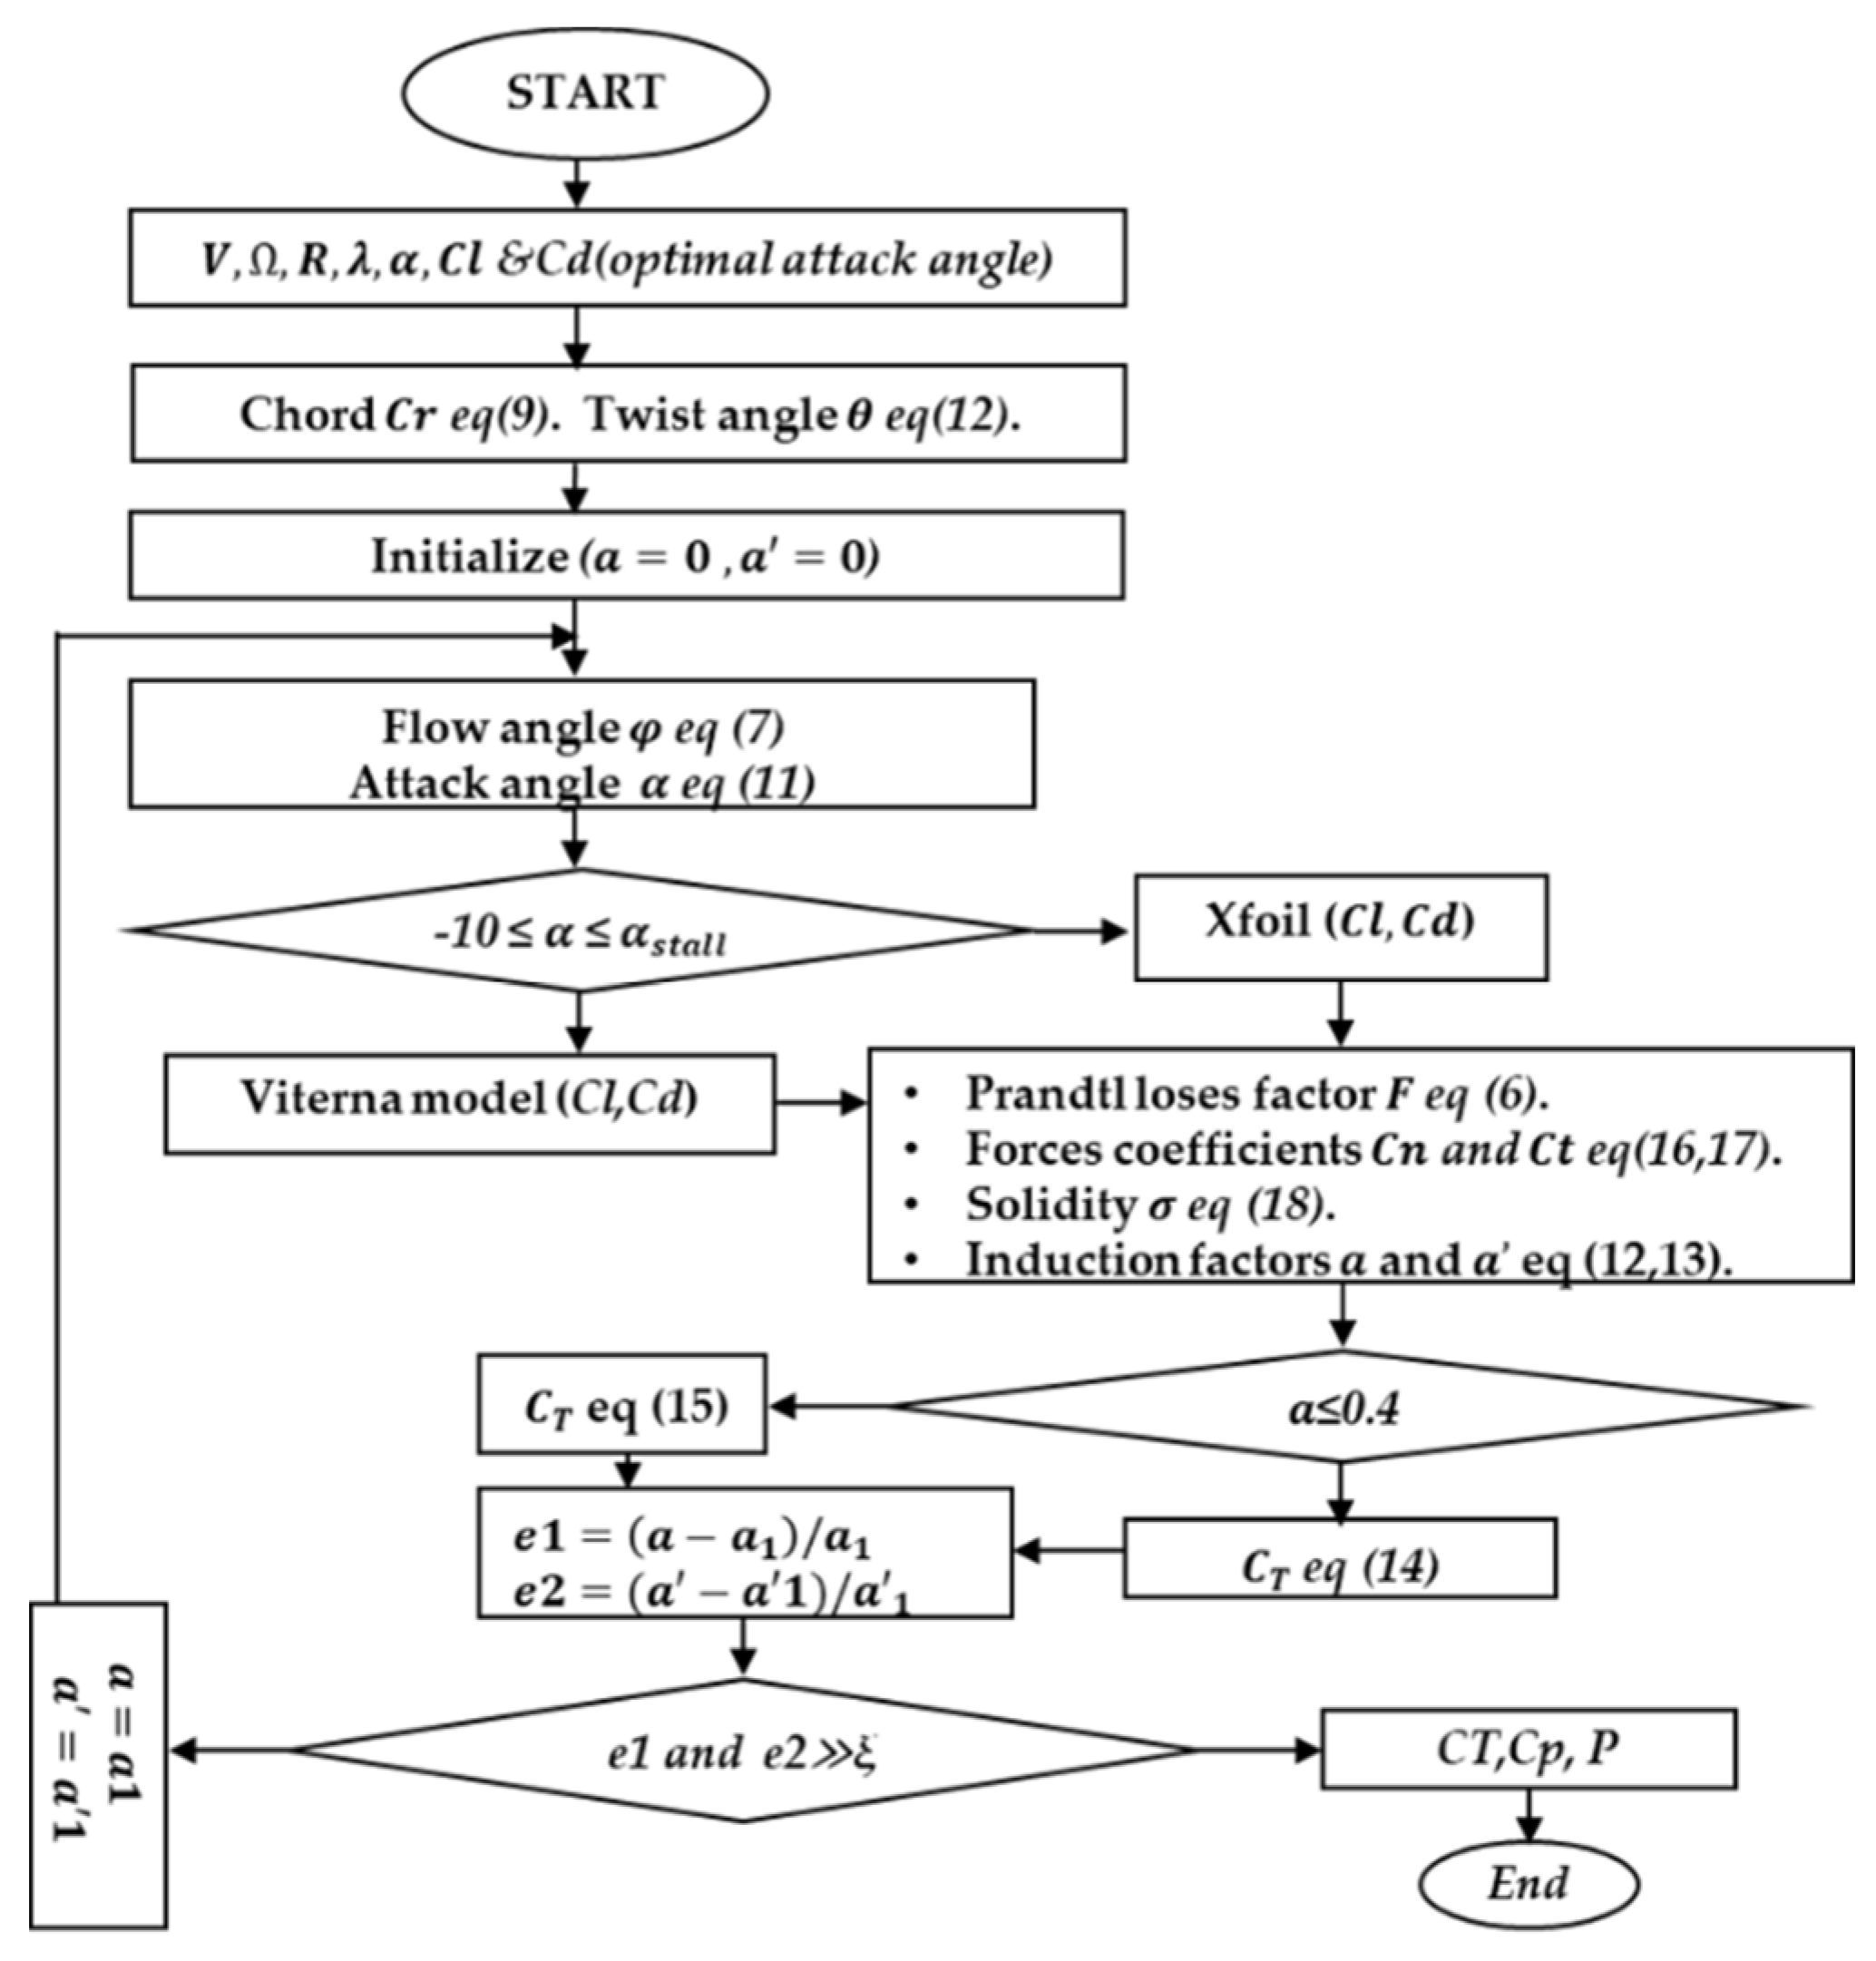
3. Methodology of Optimization
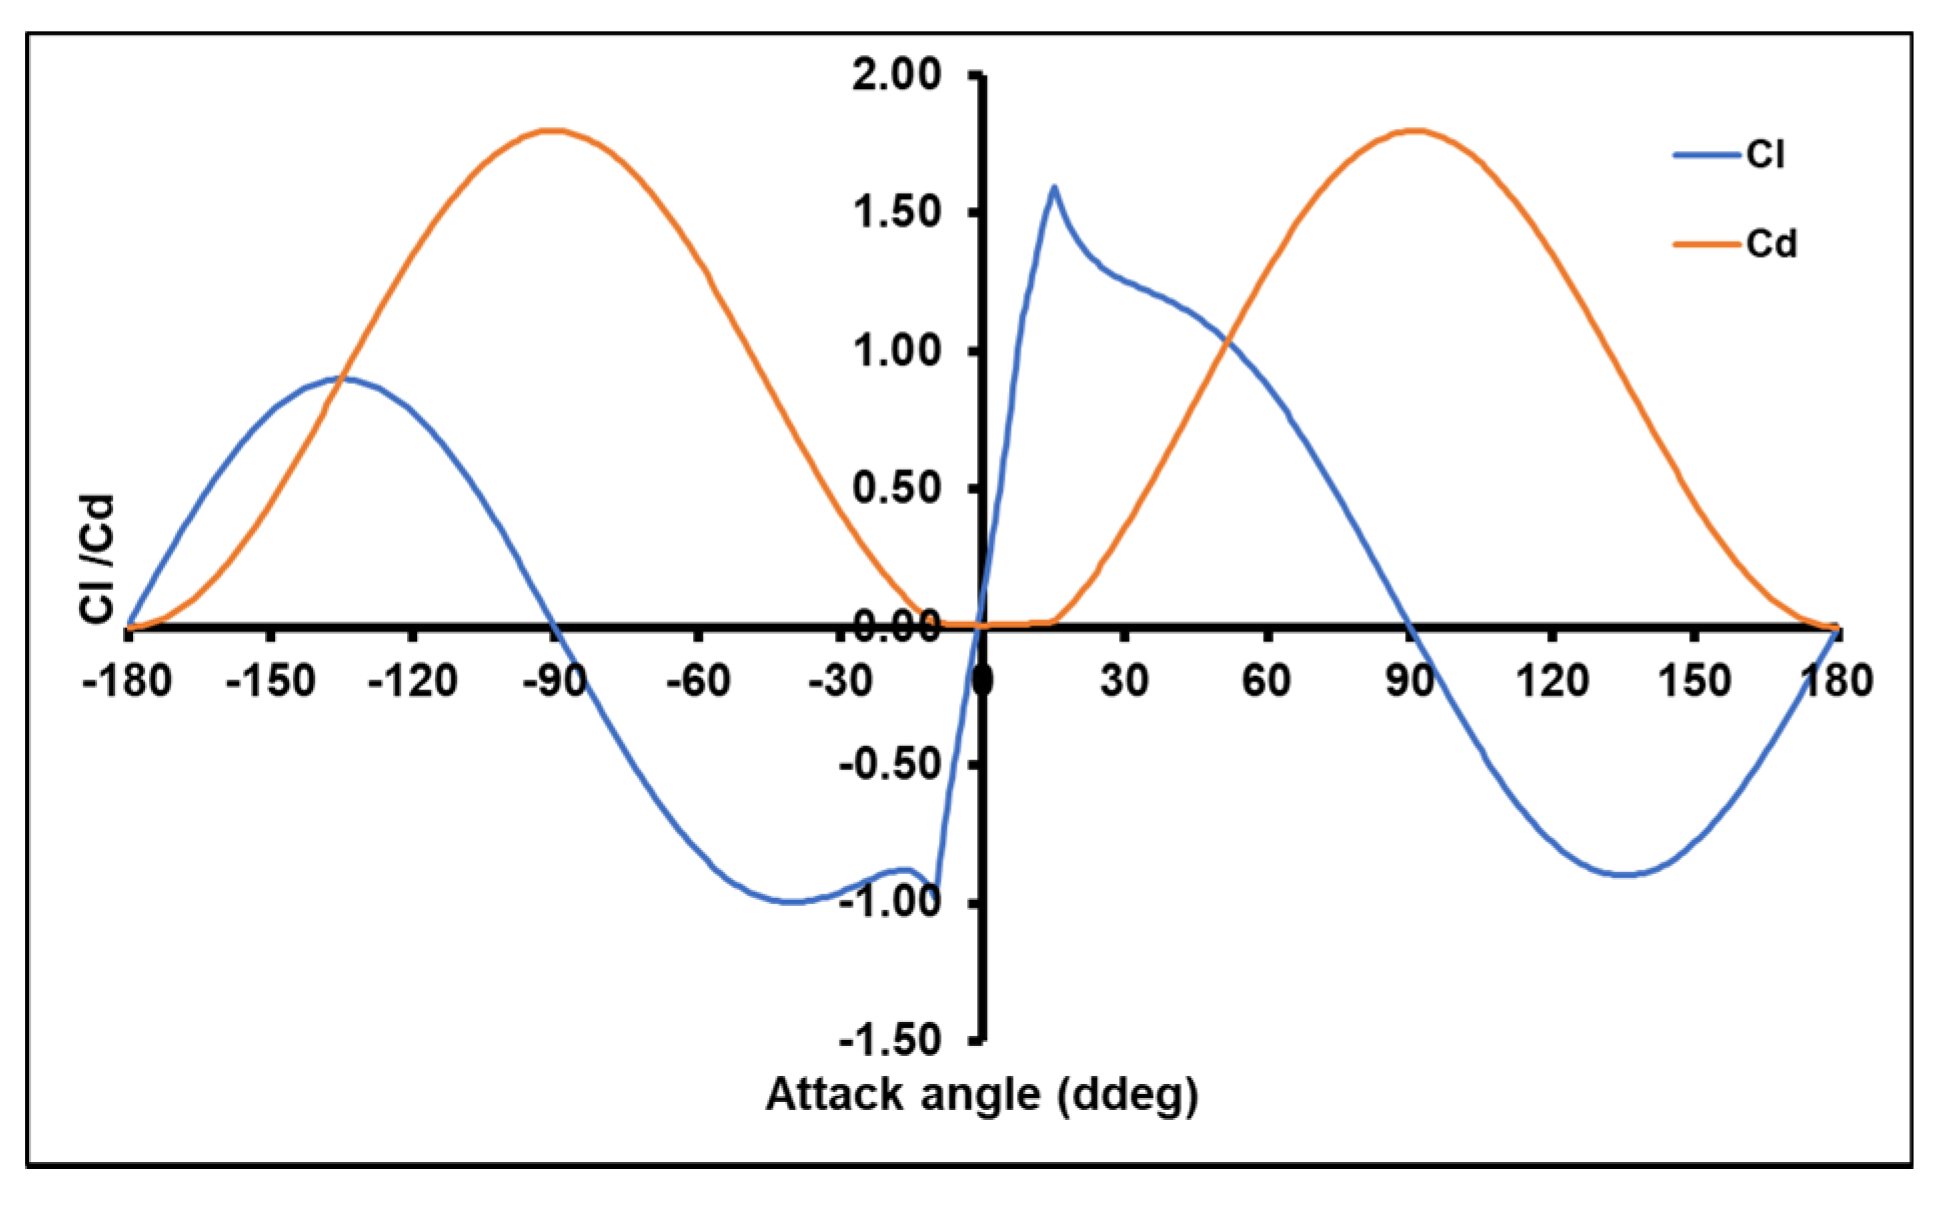
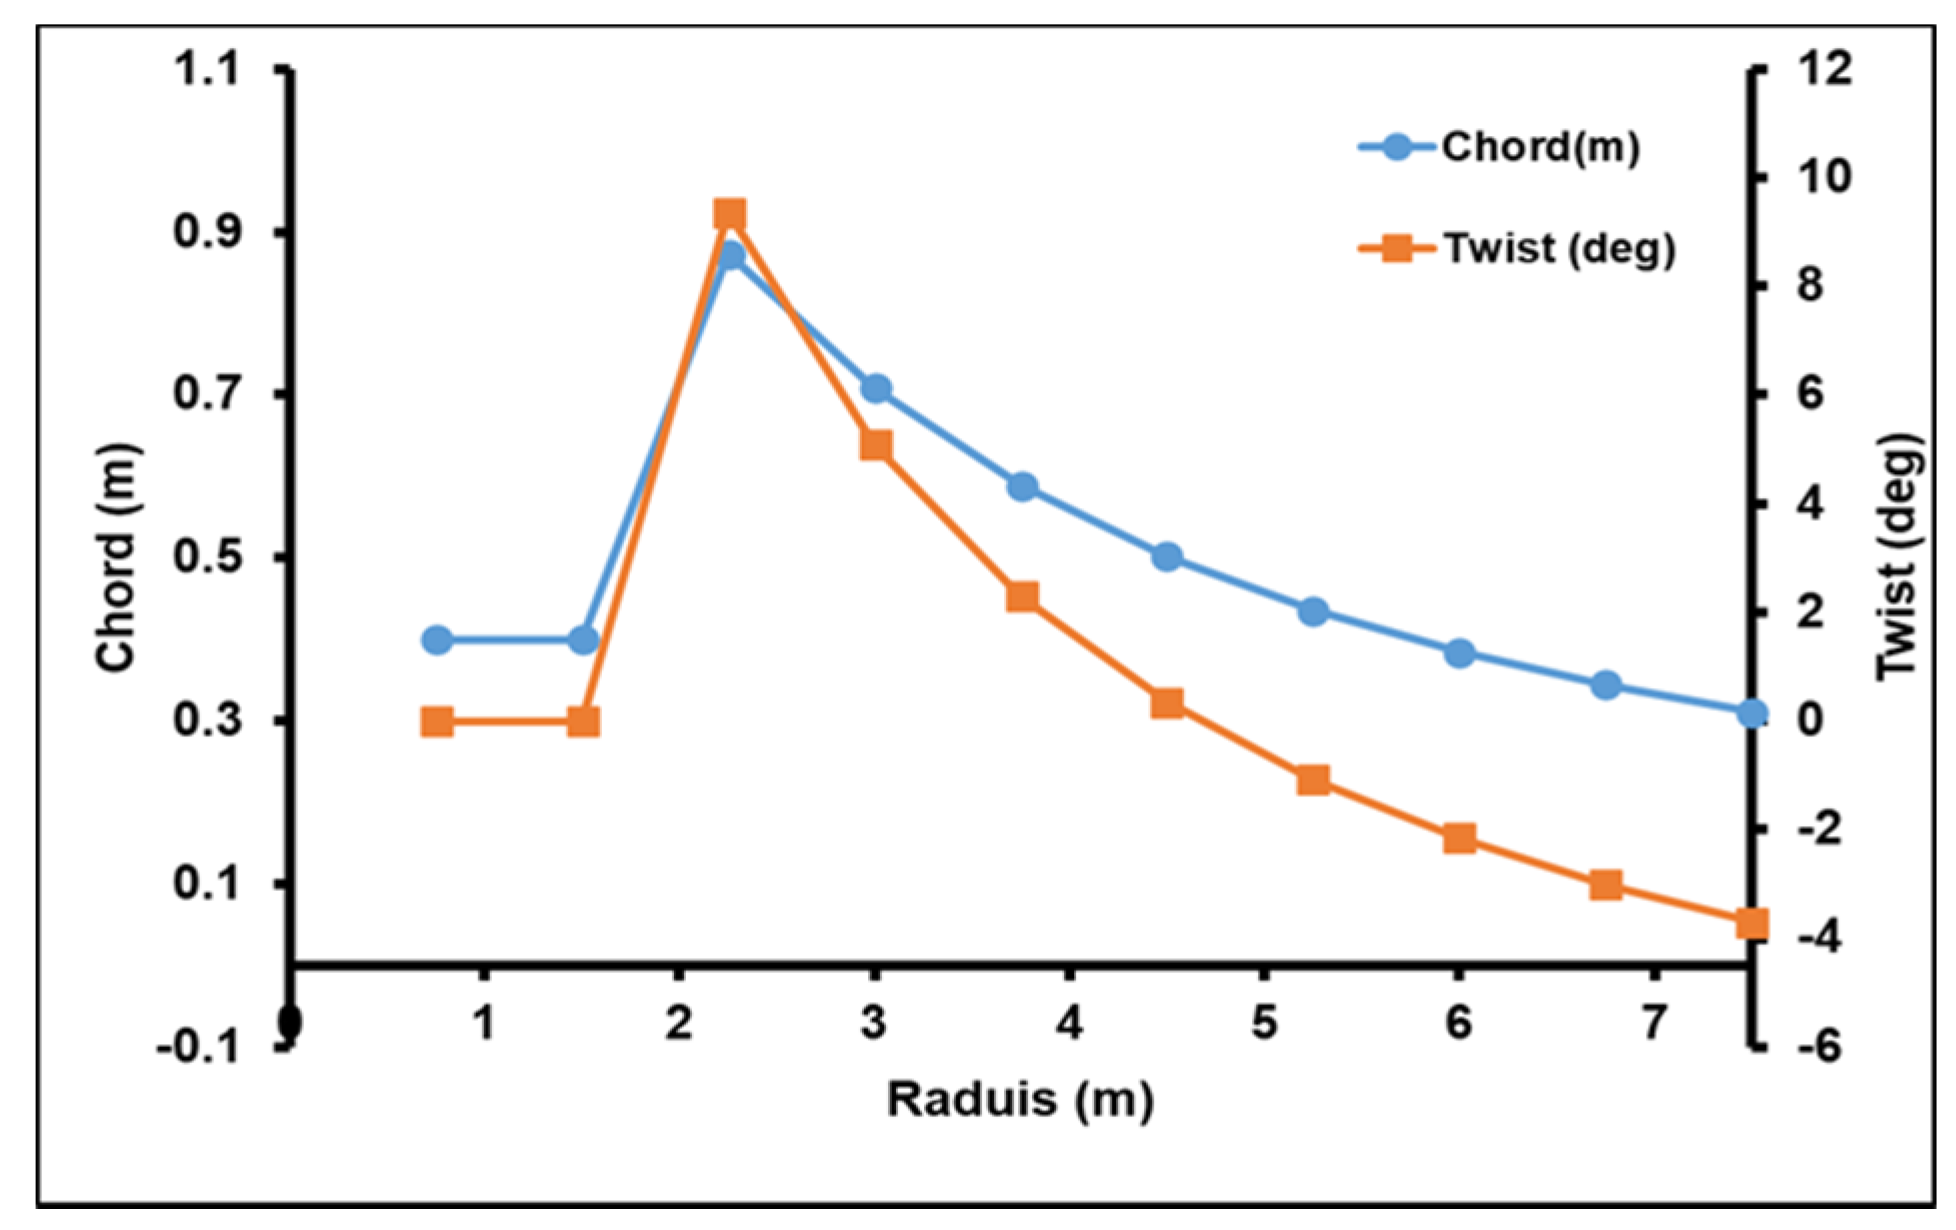
3.1. Preliminary Design
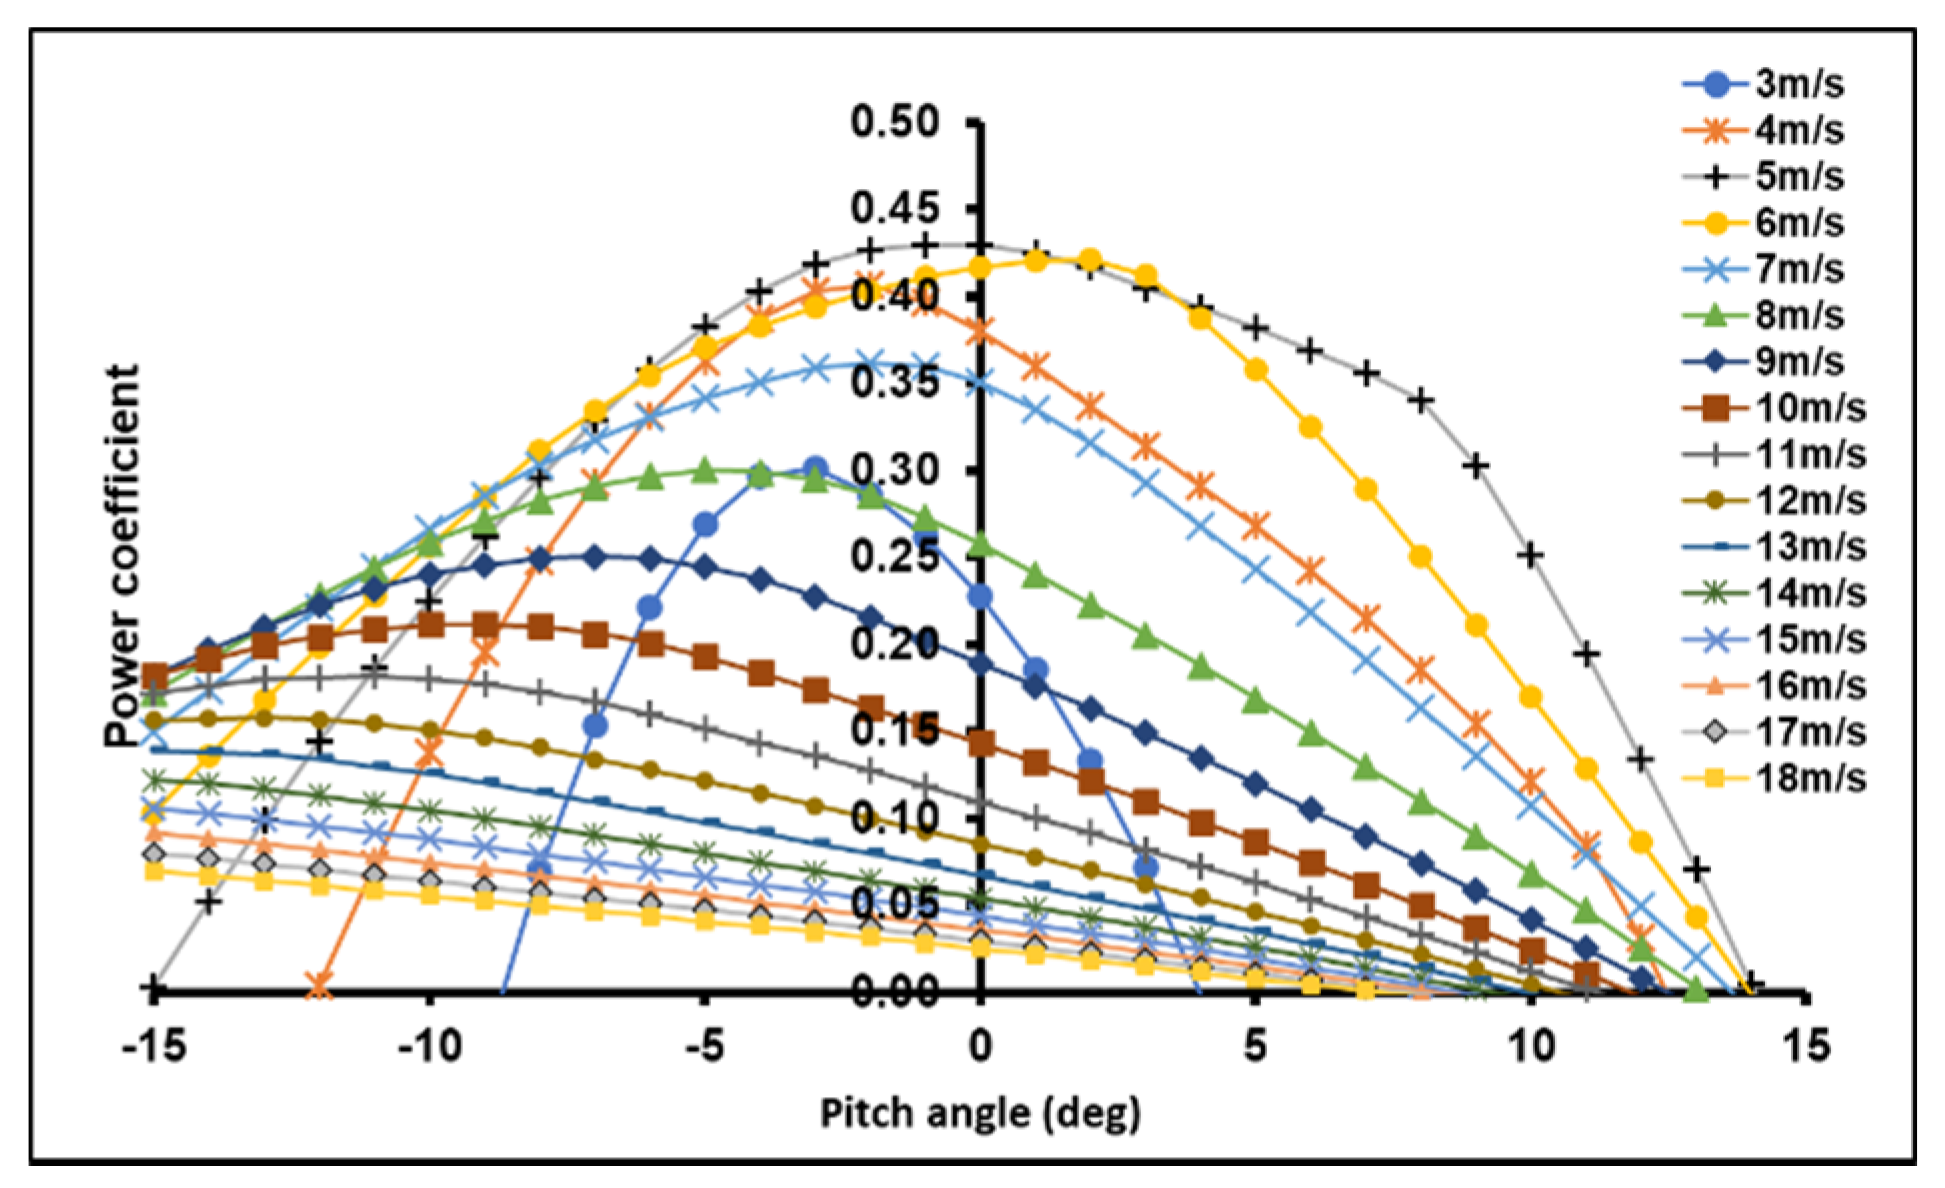
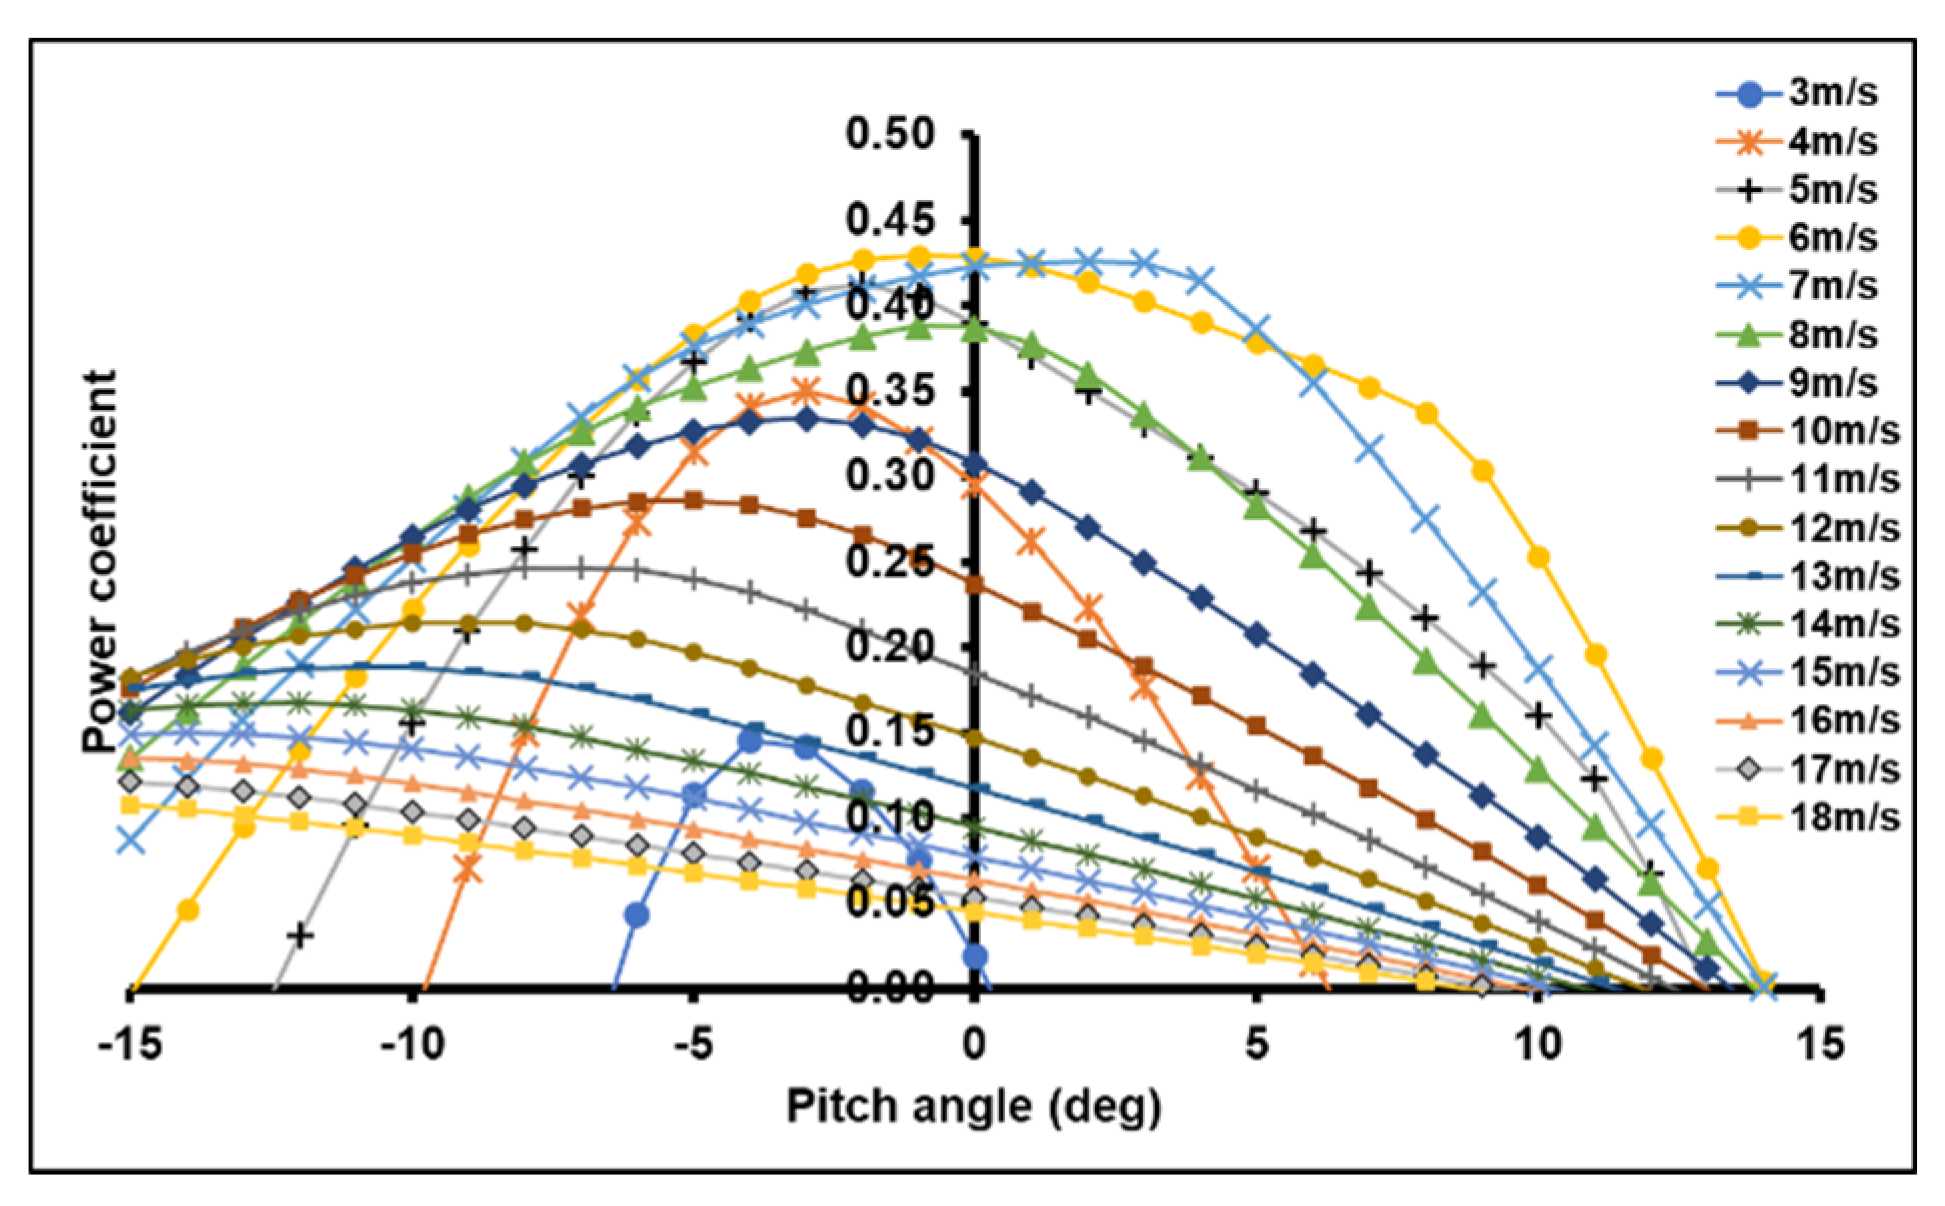
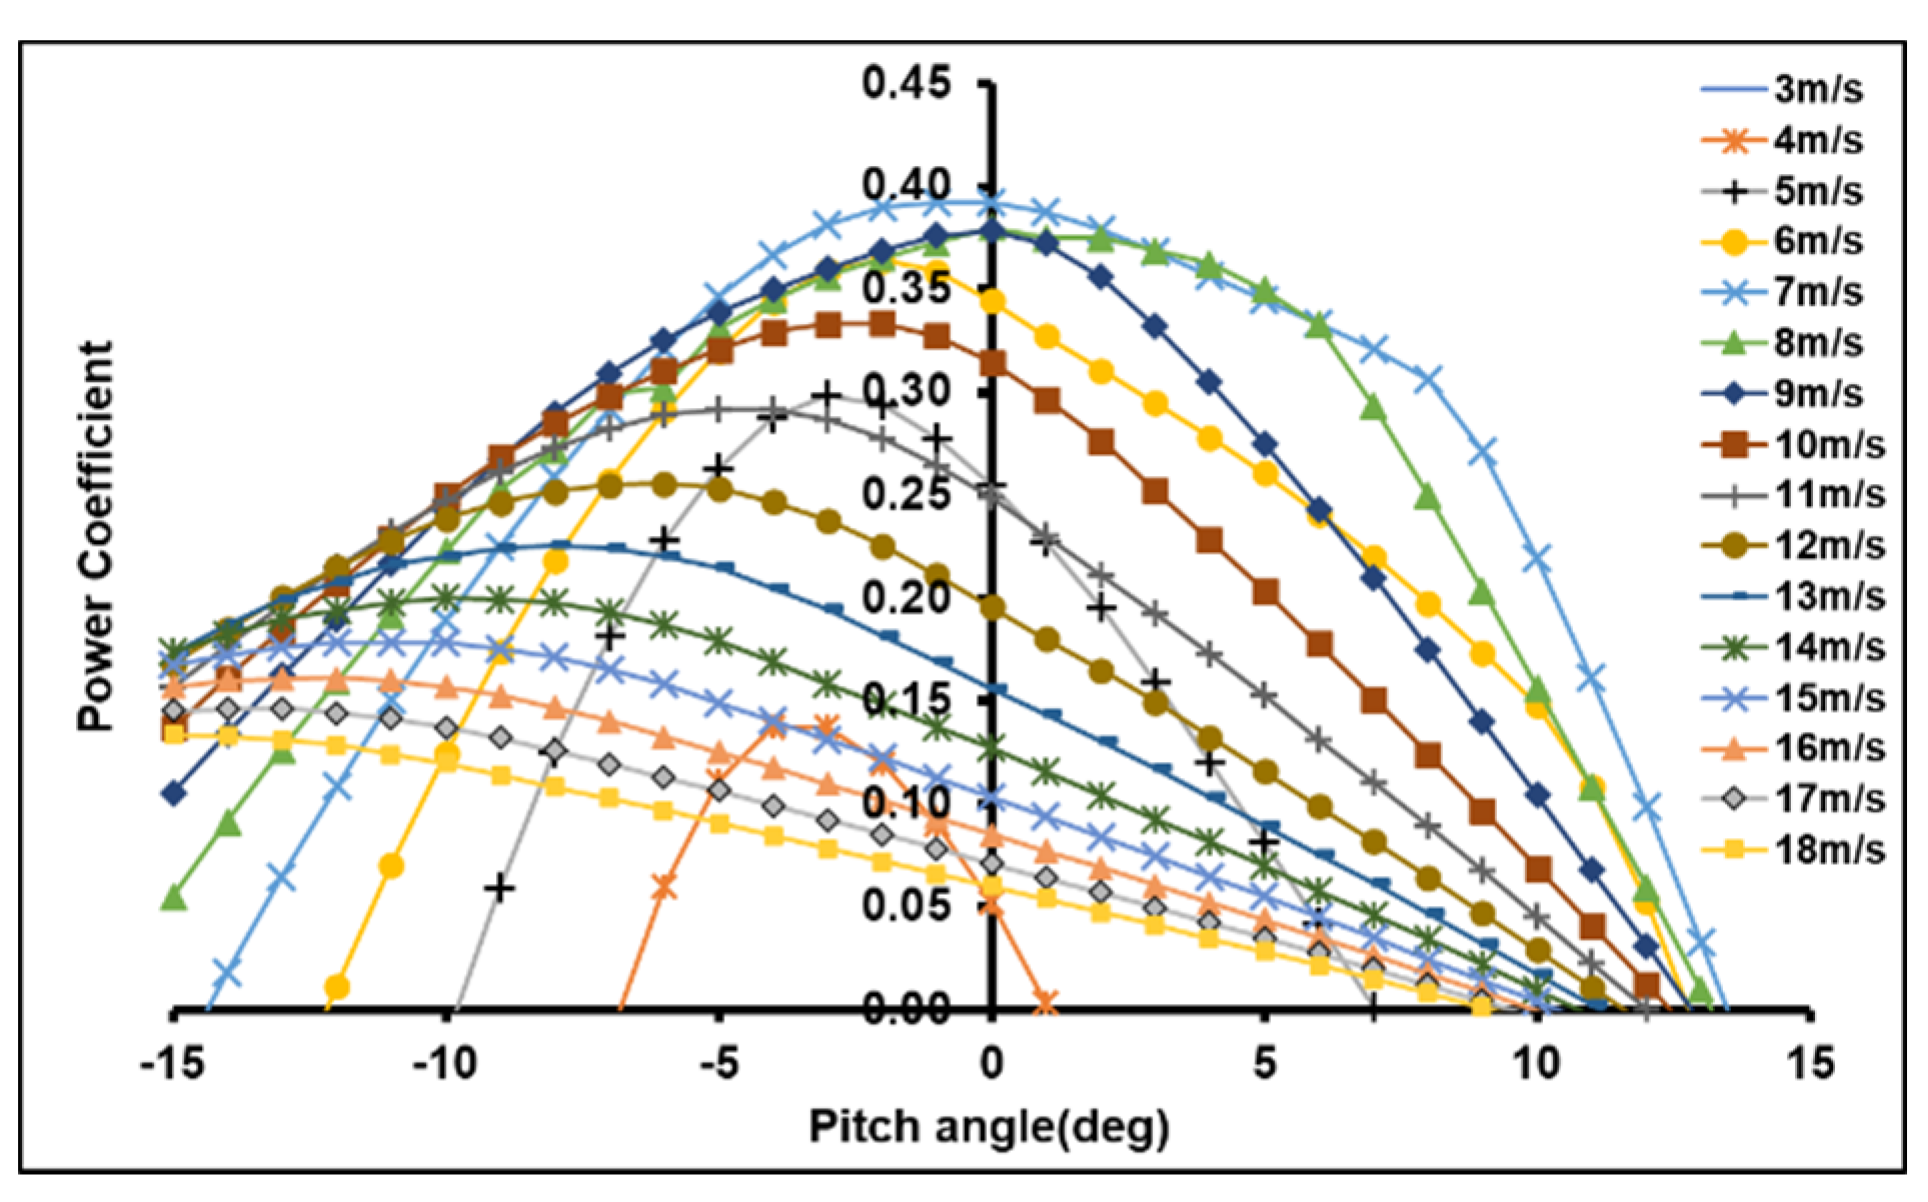
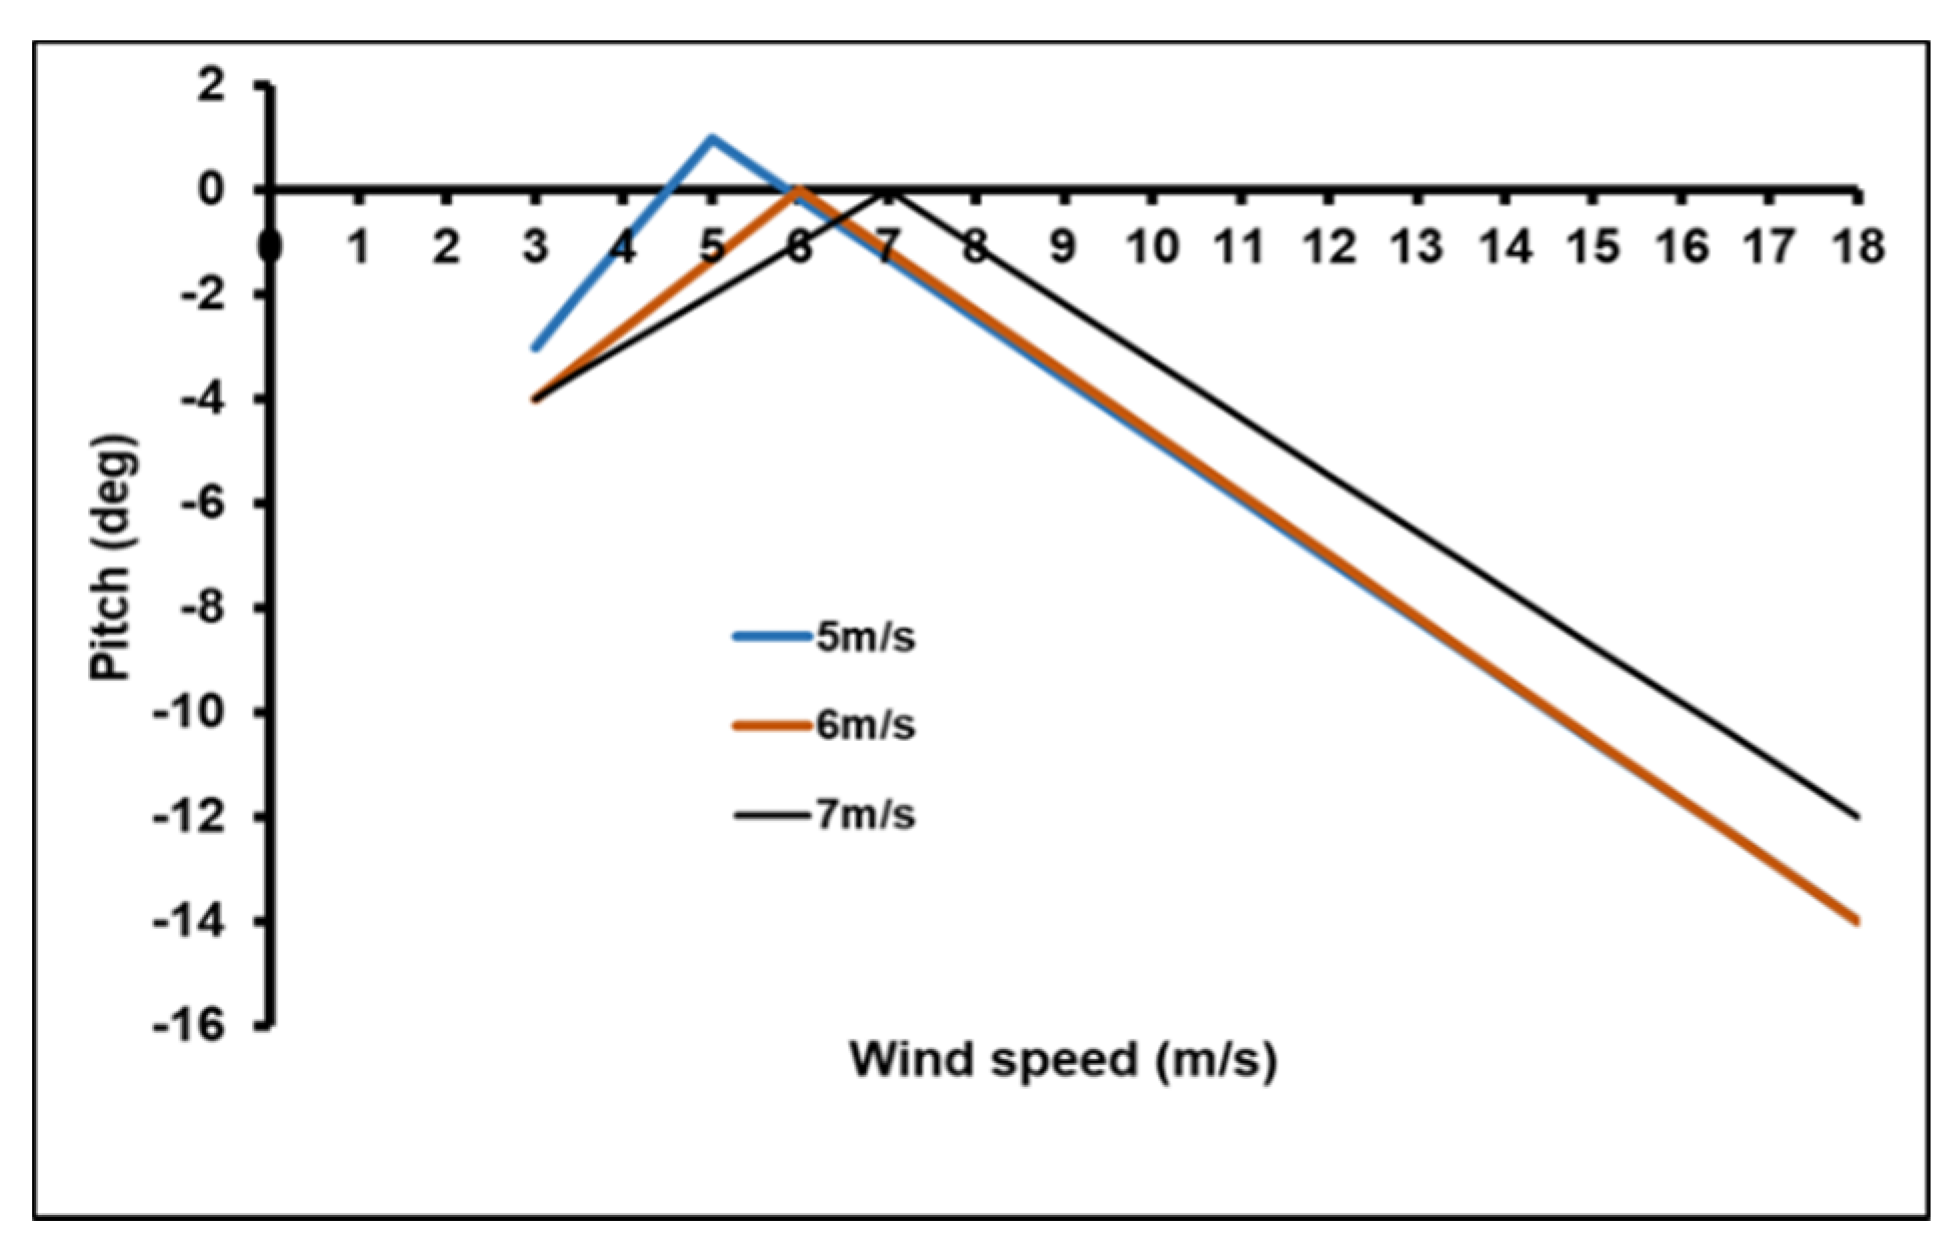
3.2. Pitch Variation
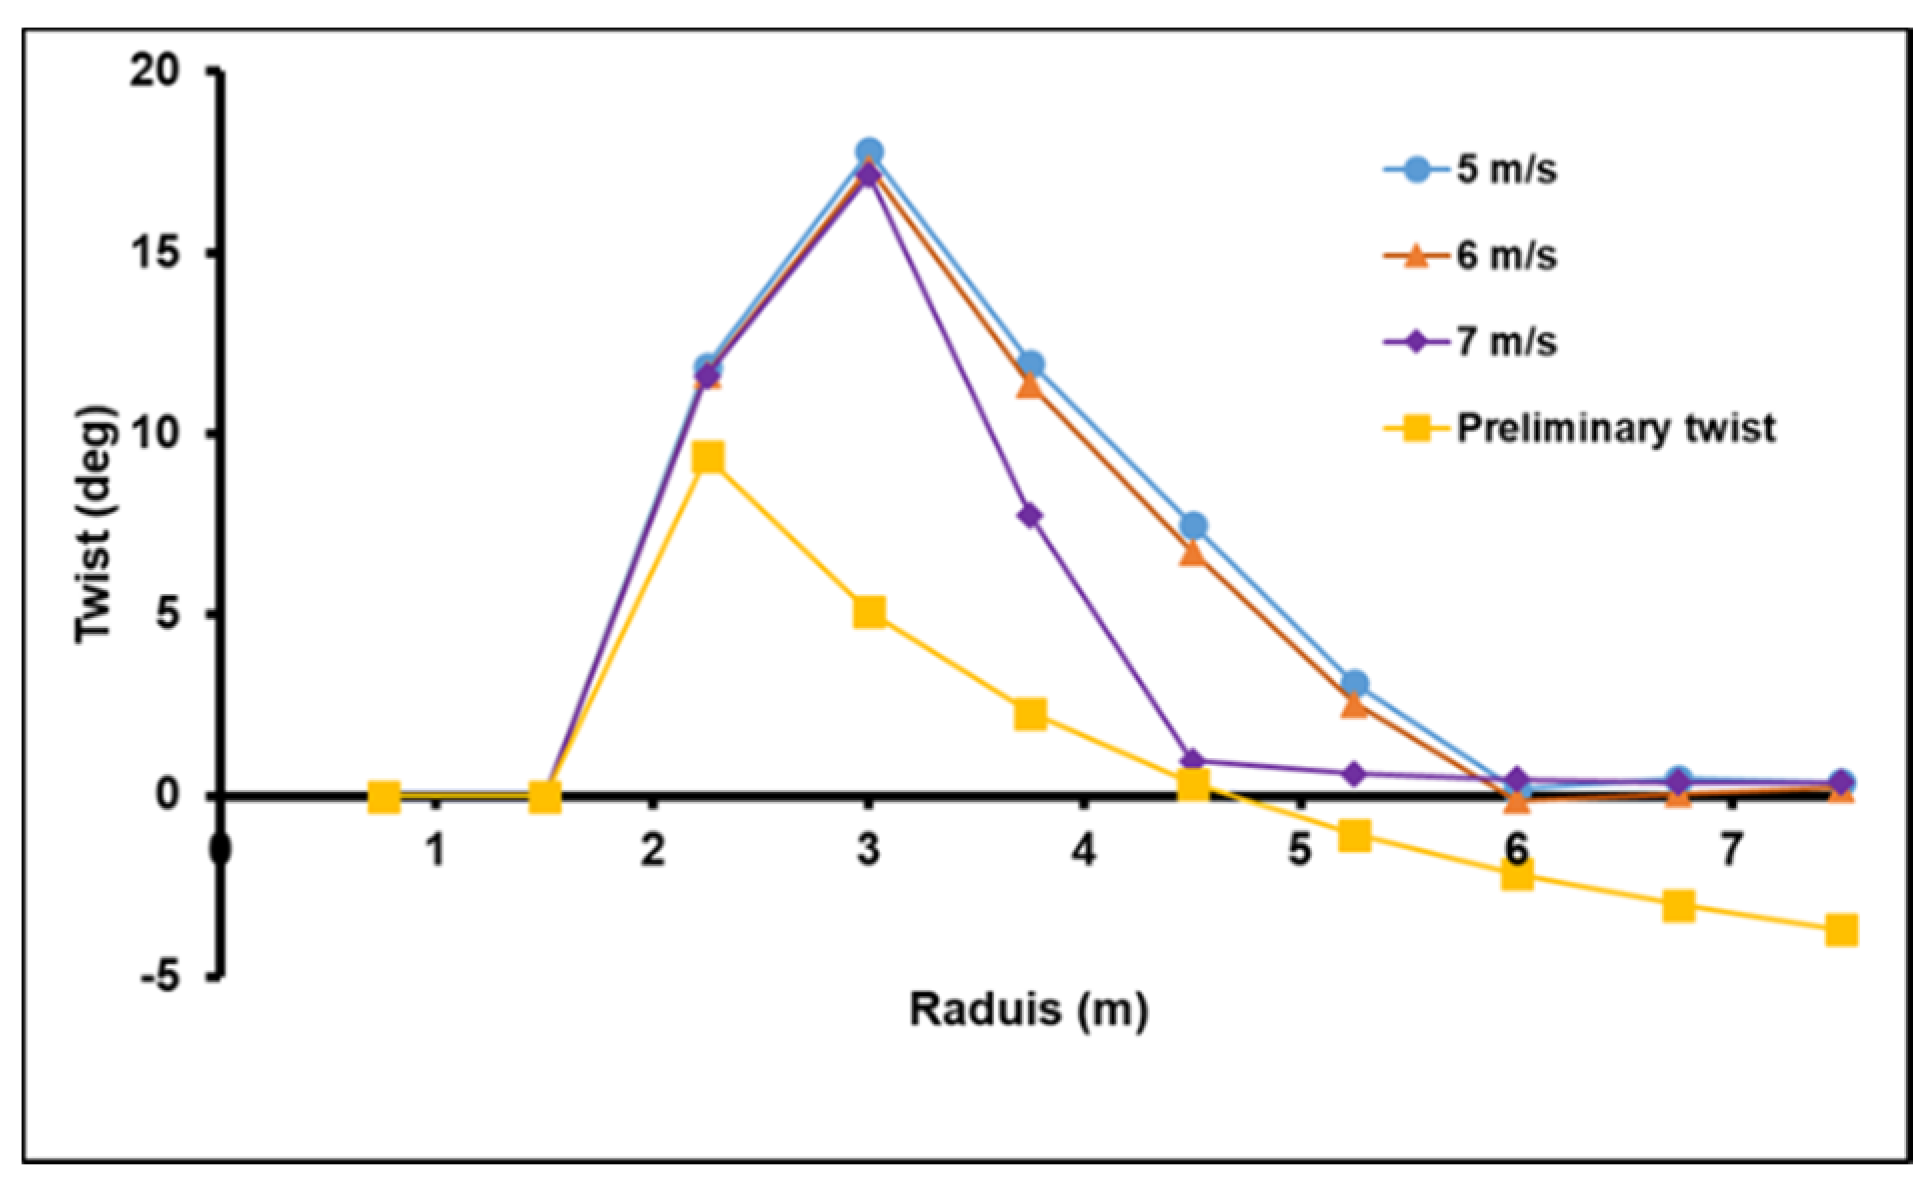
3.3. Polynomial Pitch Distribution
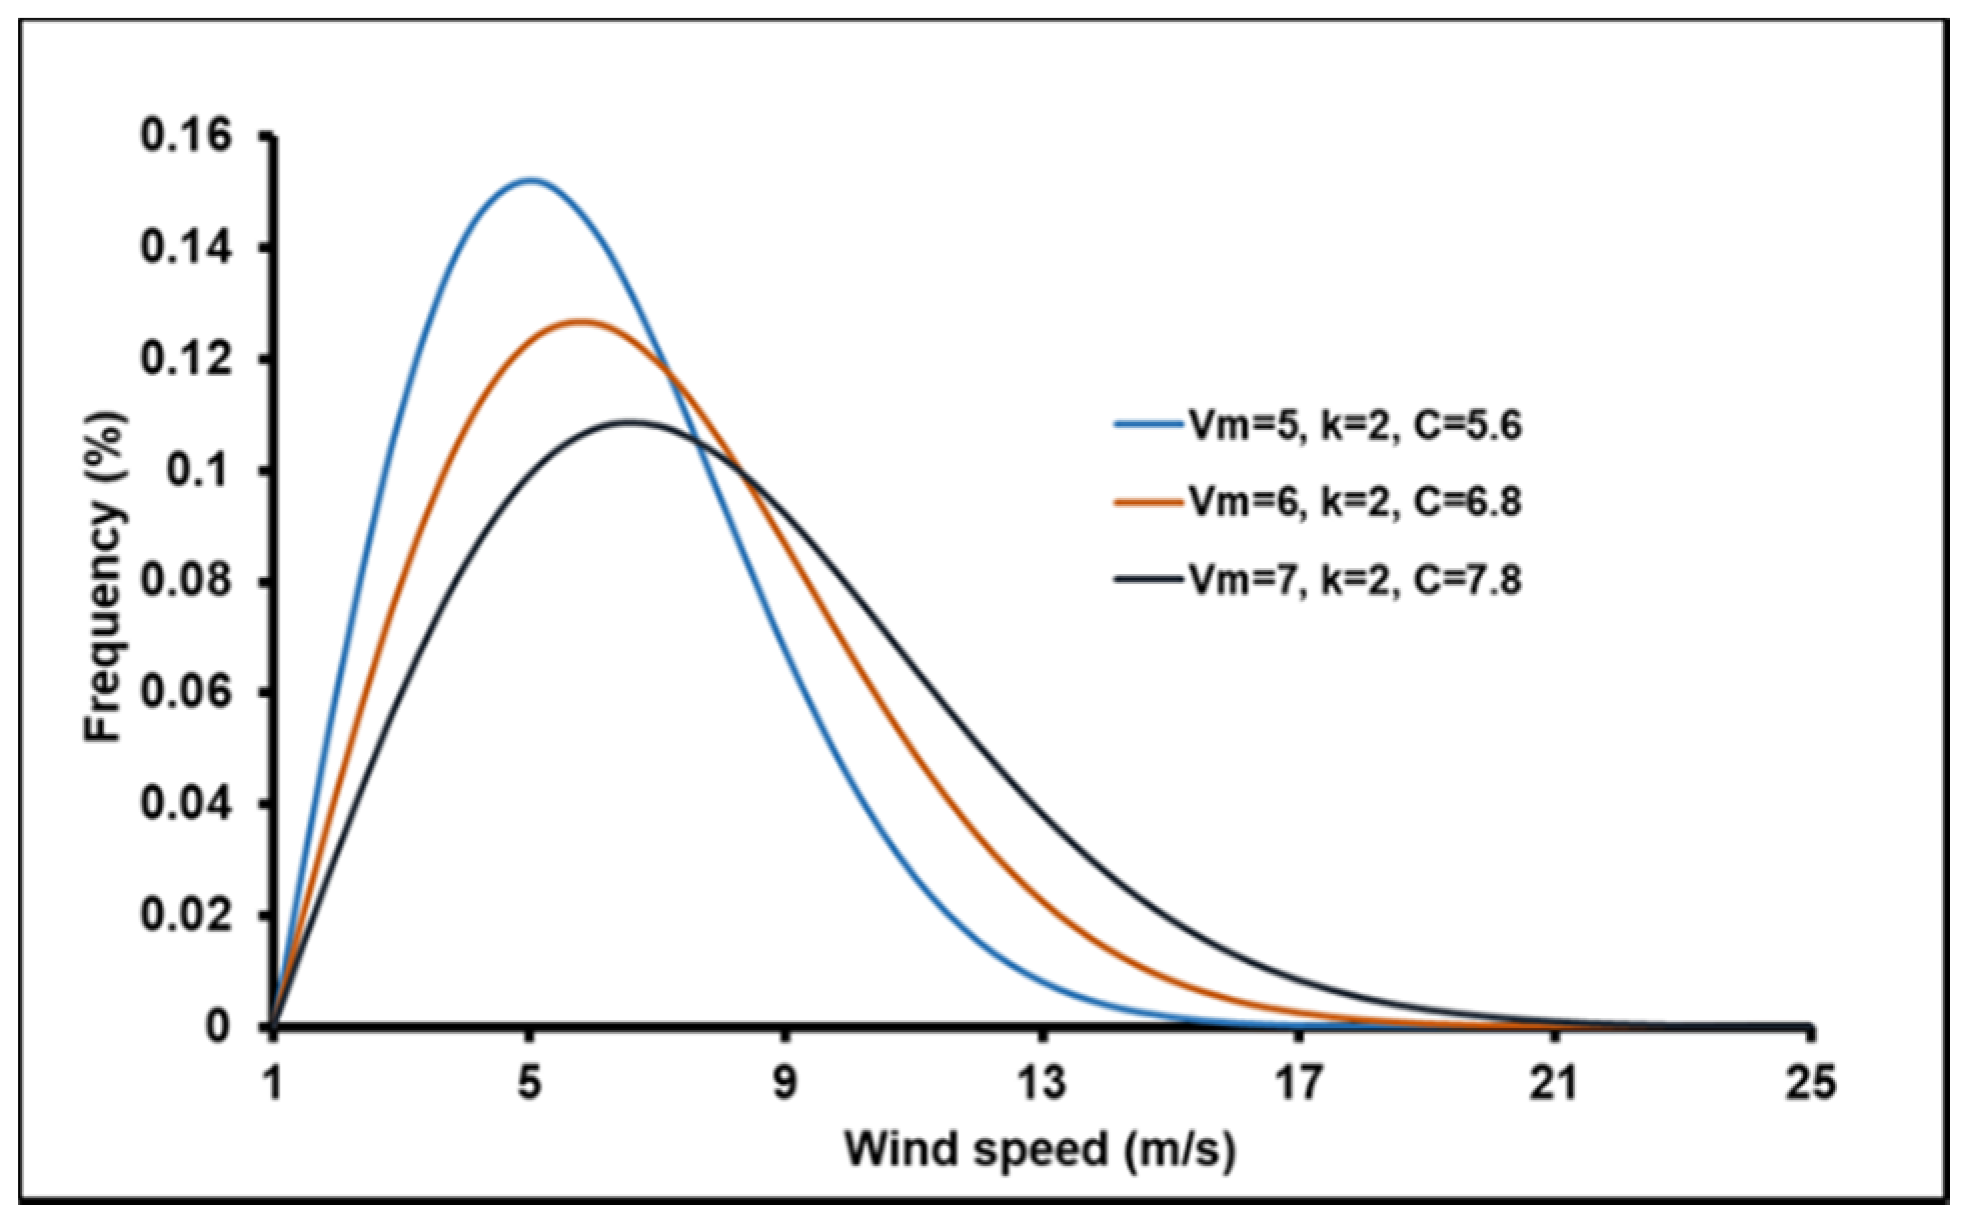
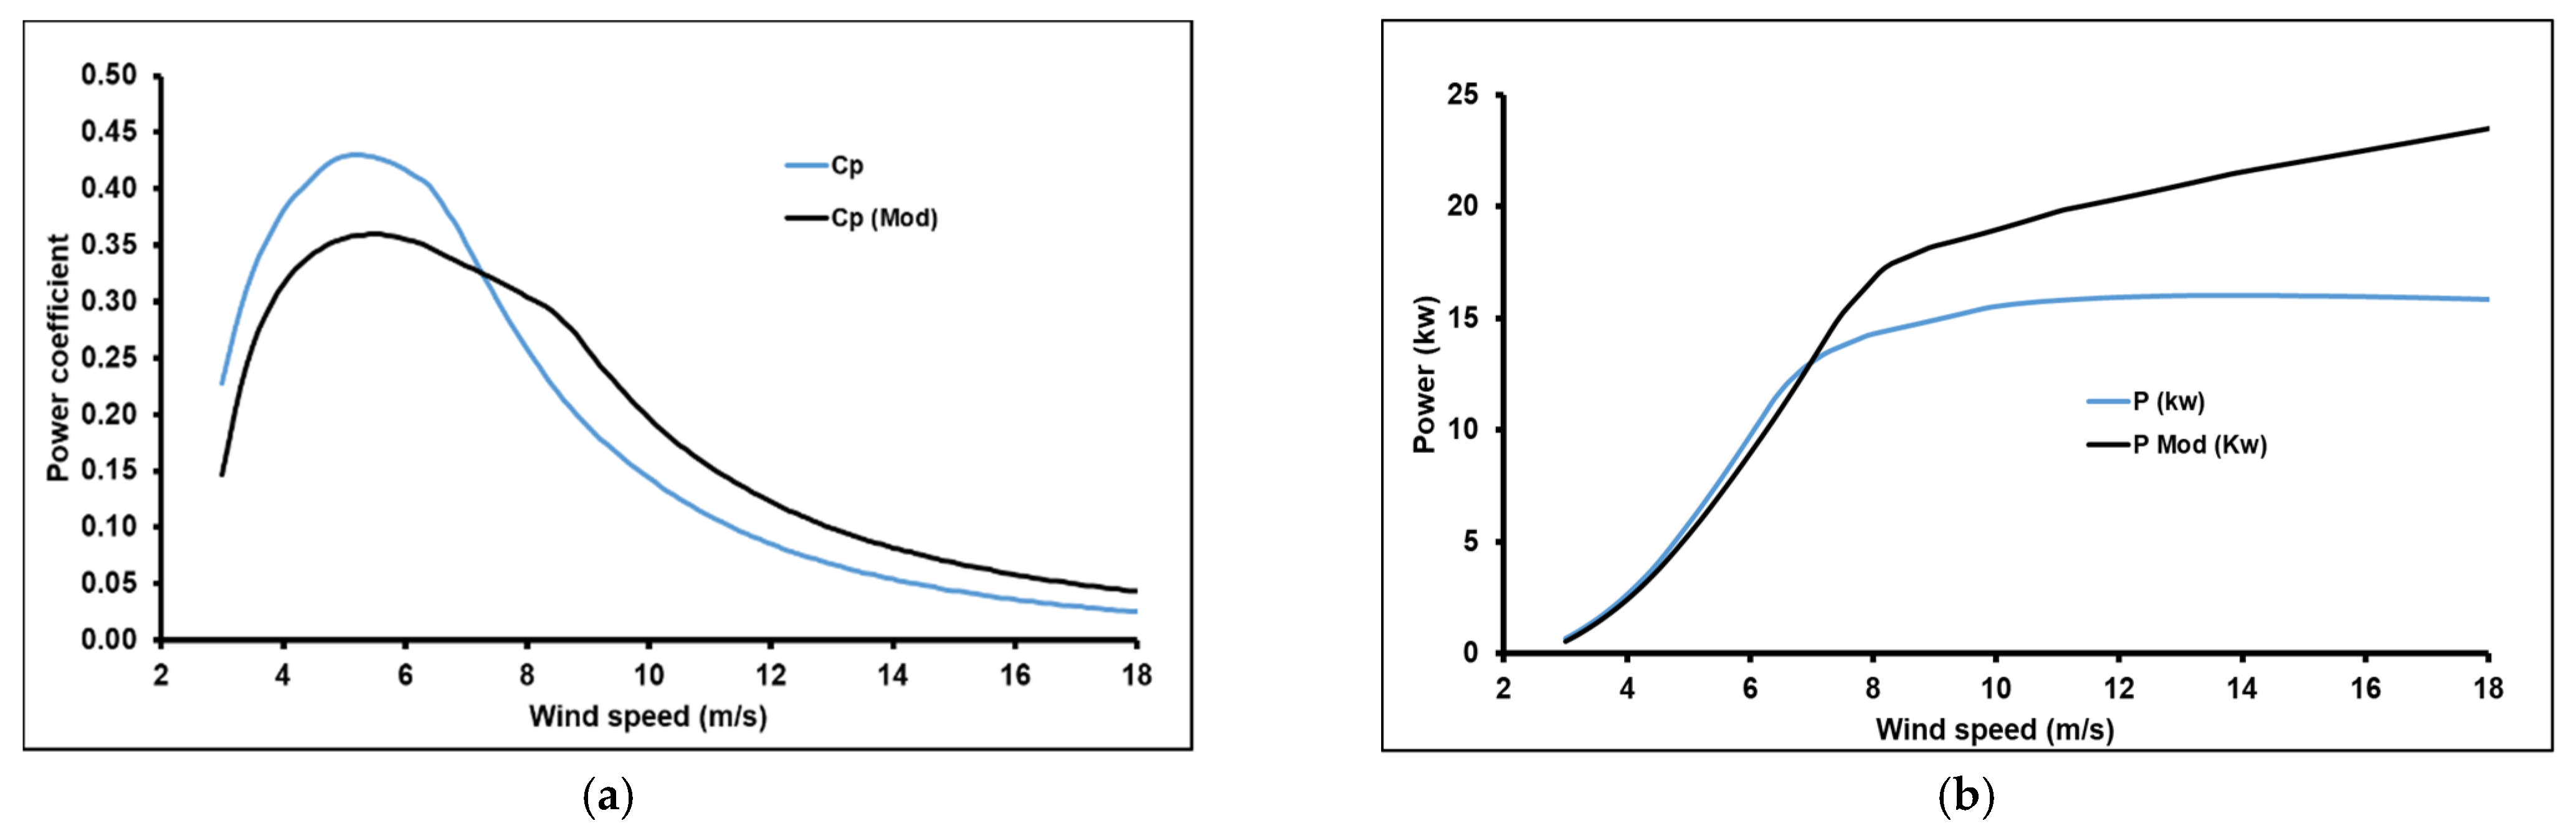
- First site (Vm = 5 m/s)
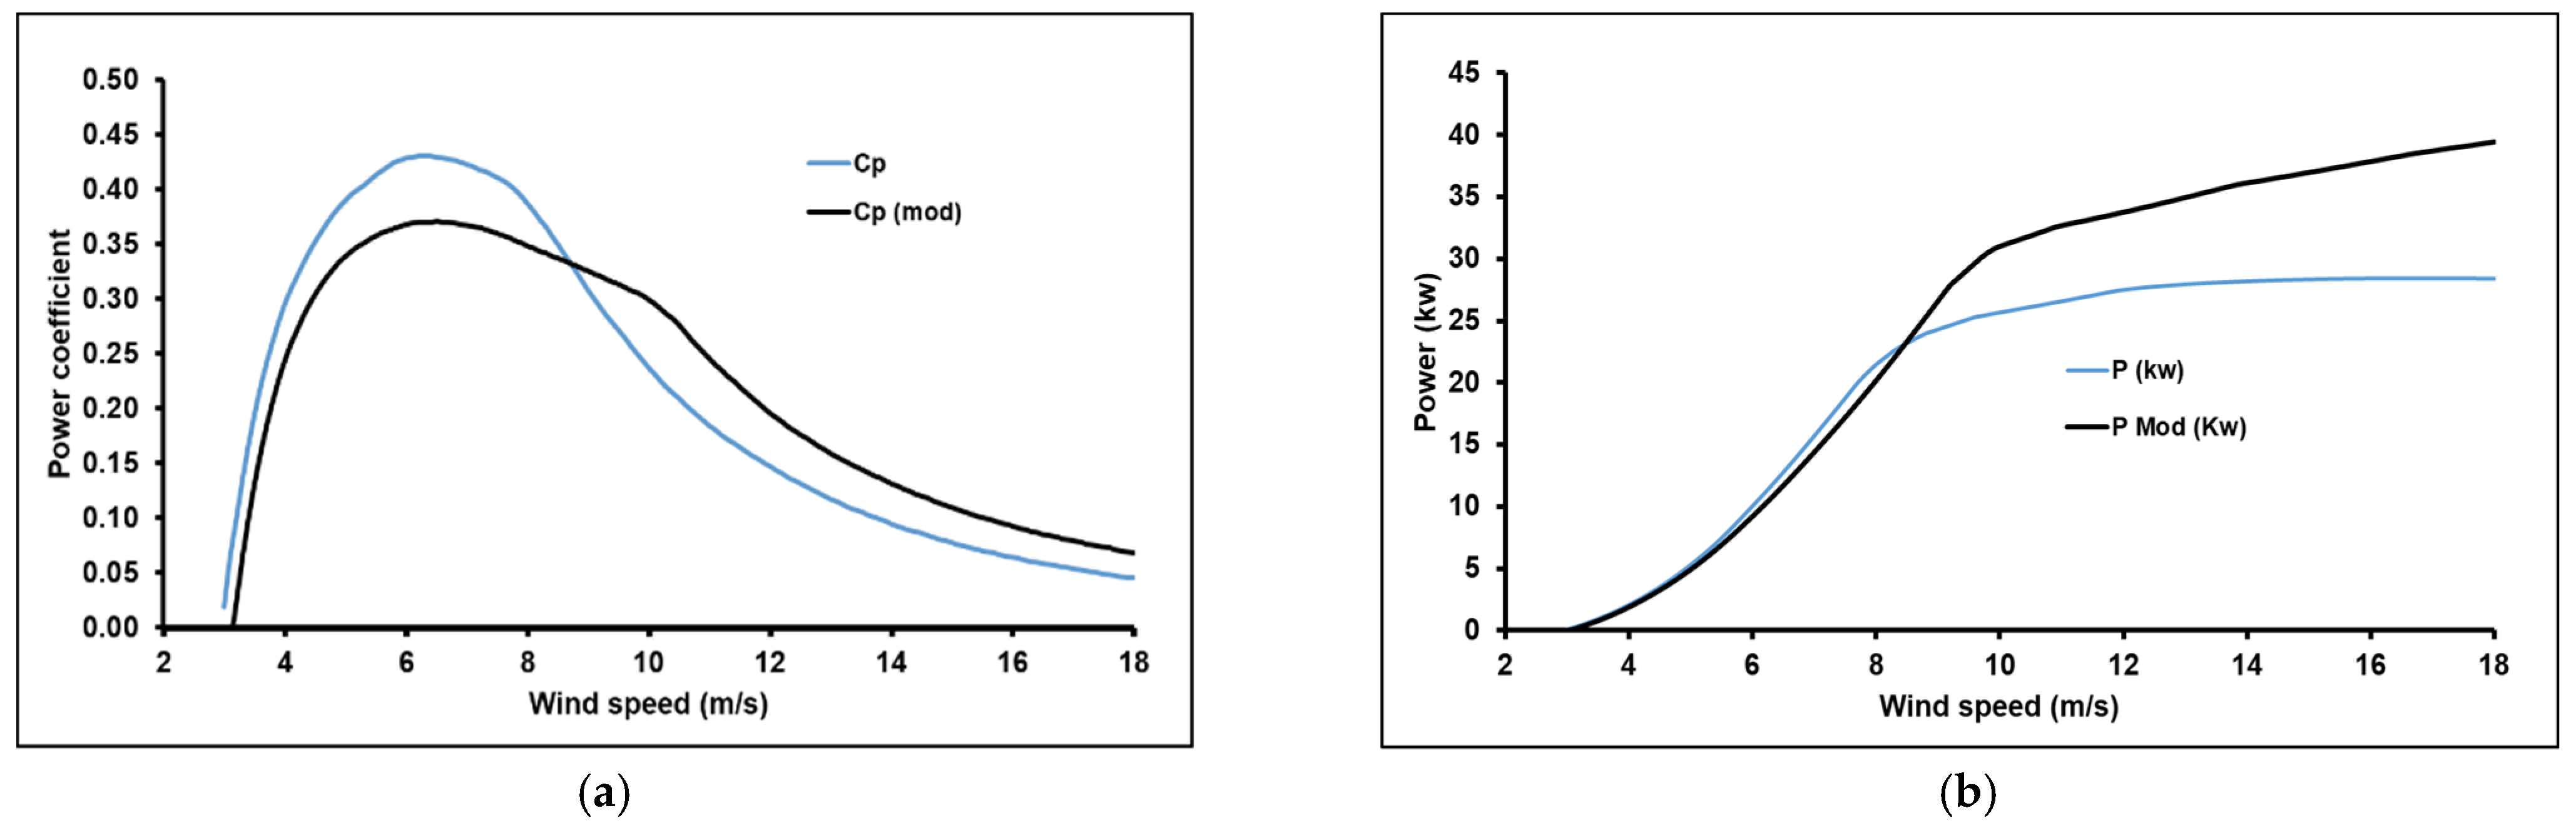
- Second site (Vm = 6 m/s)
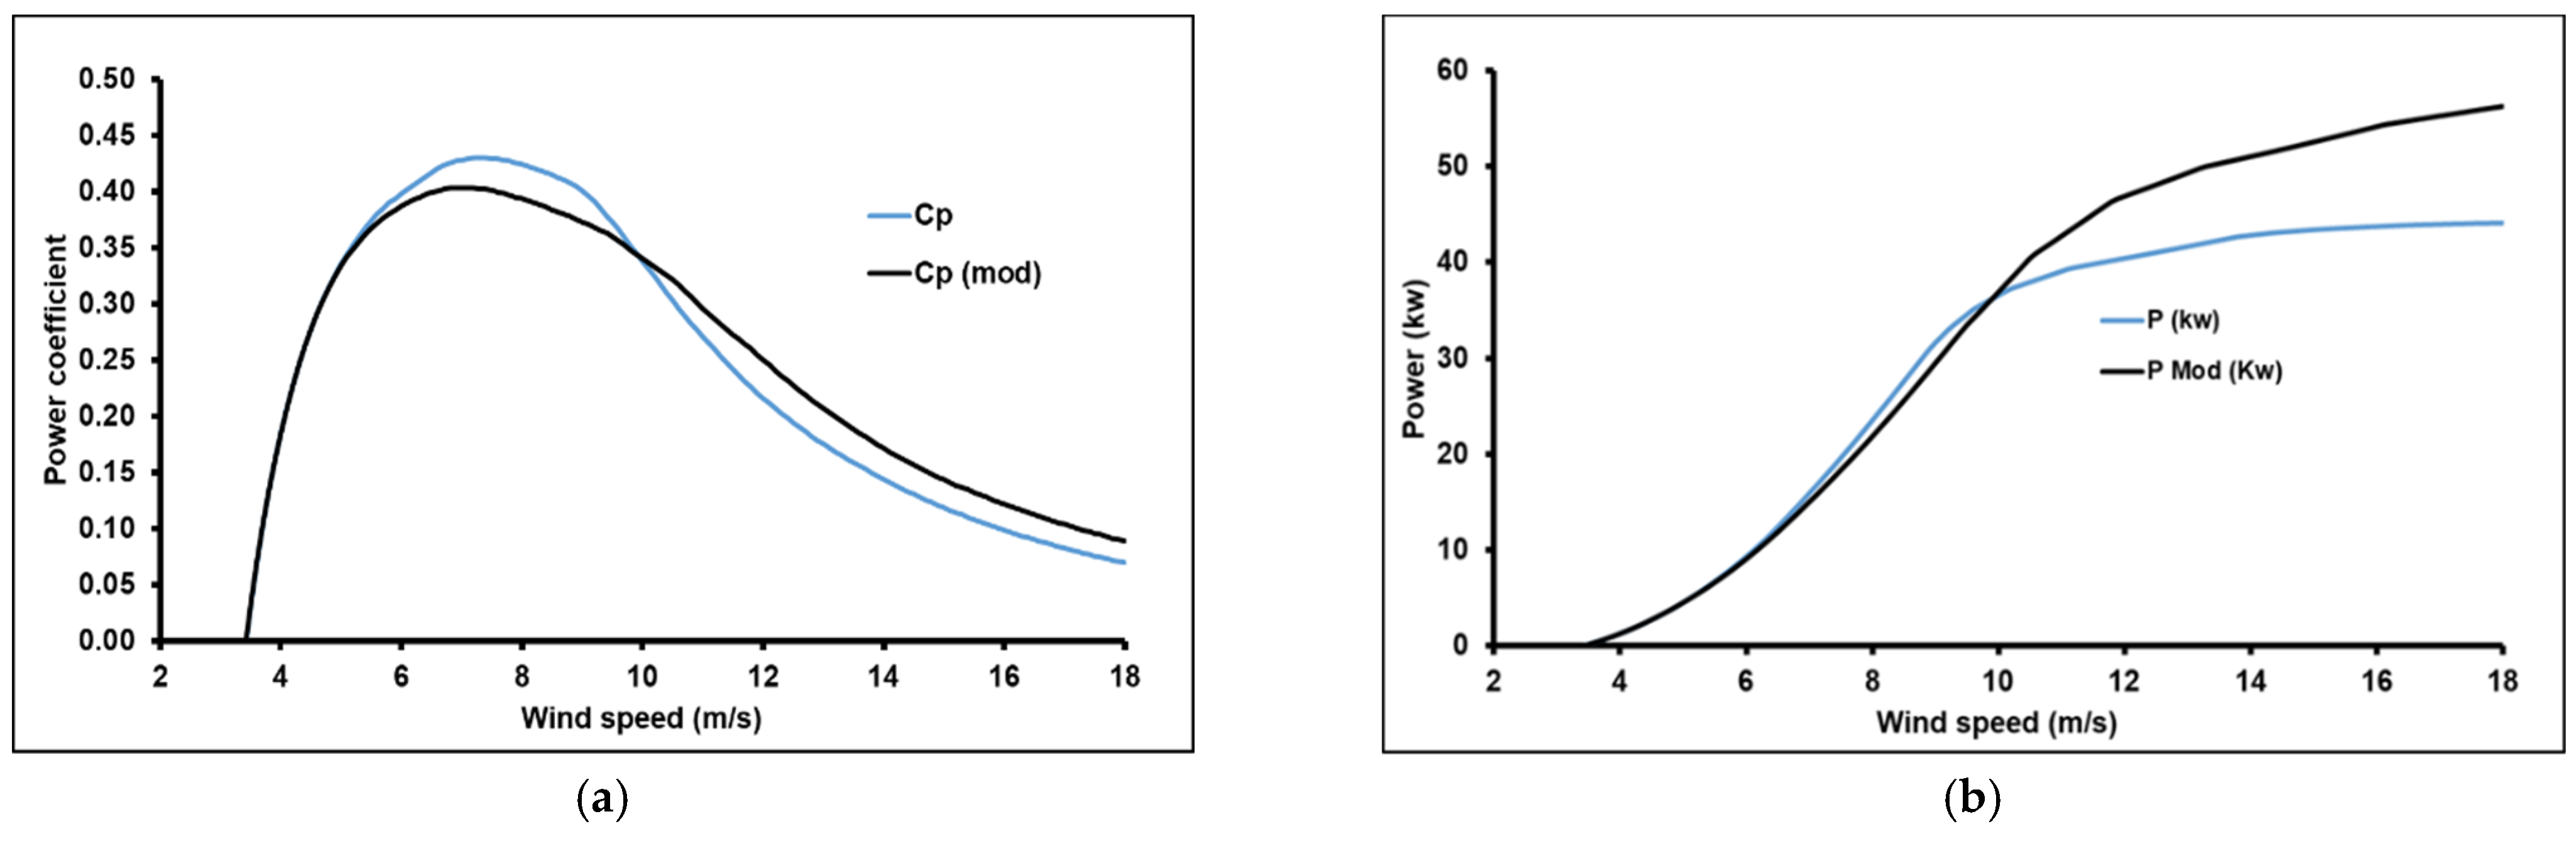
- Third site (Vm = 7 m/s)
- First site (Vm = 5 m/s)
- Second site (Vm = 6 m/s)
- Third site (Vm = 7 m/s)
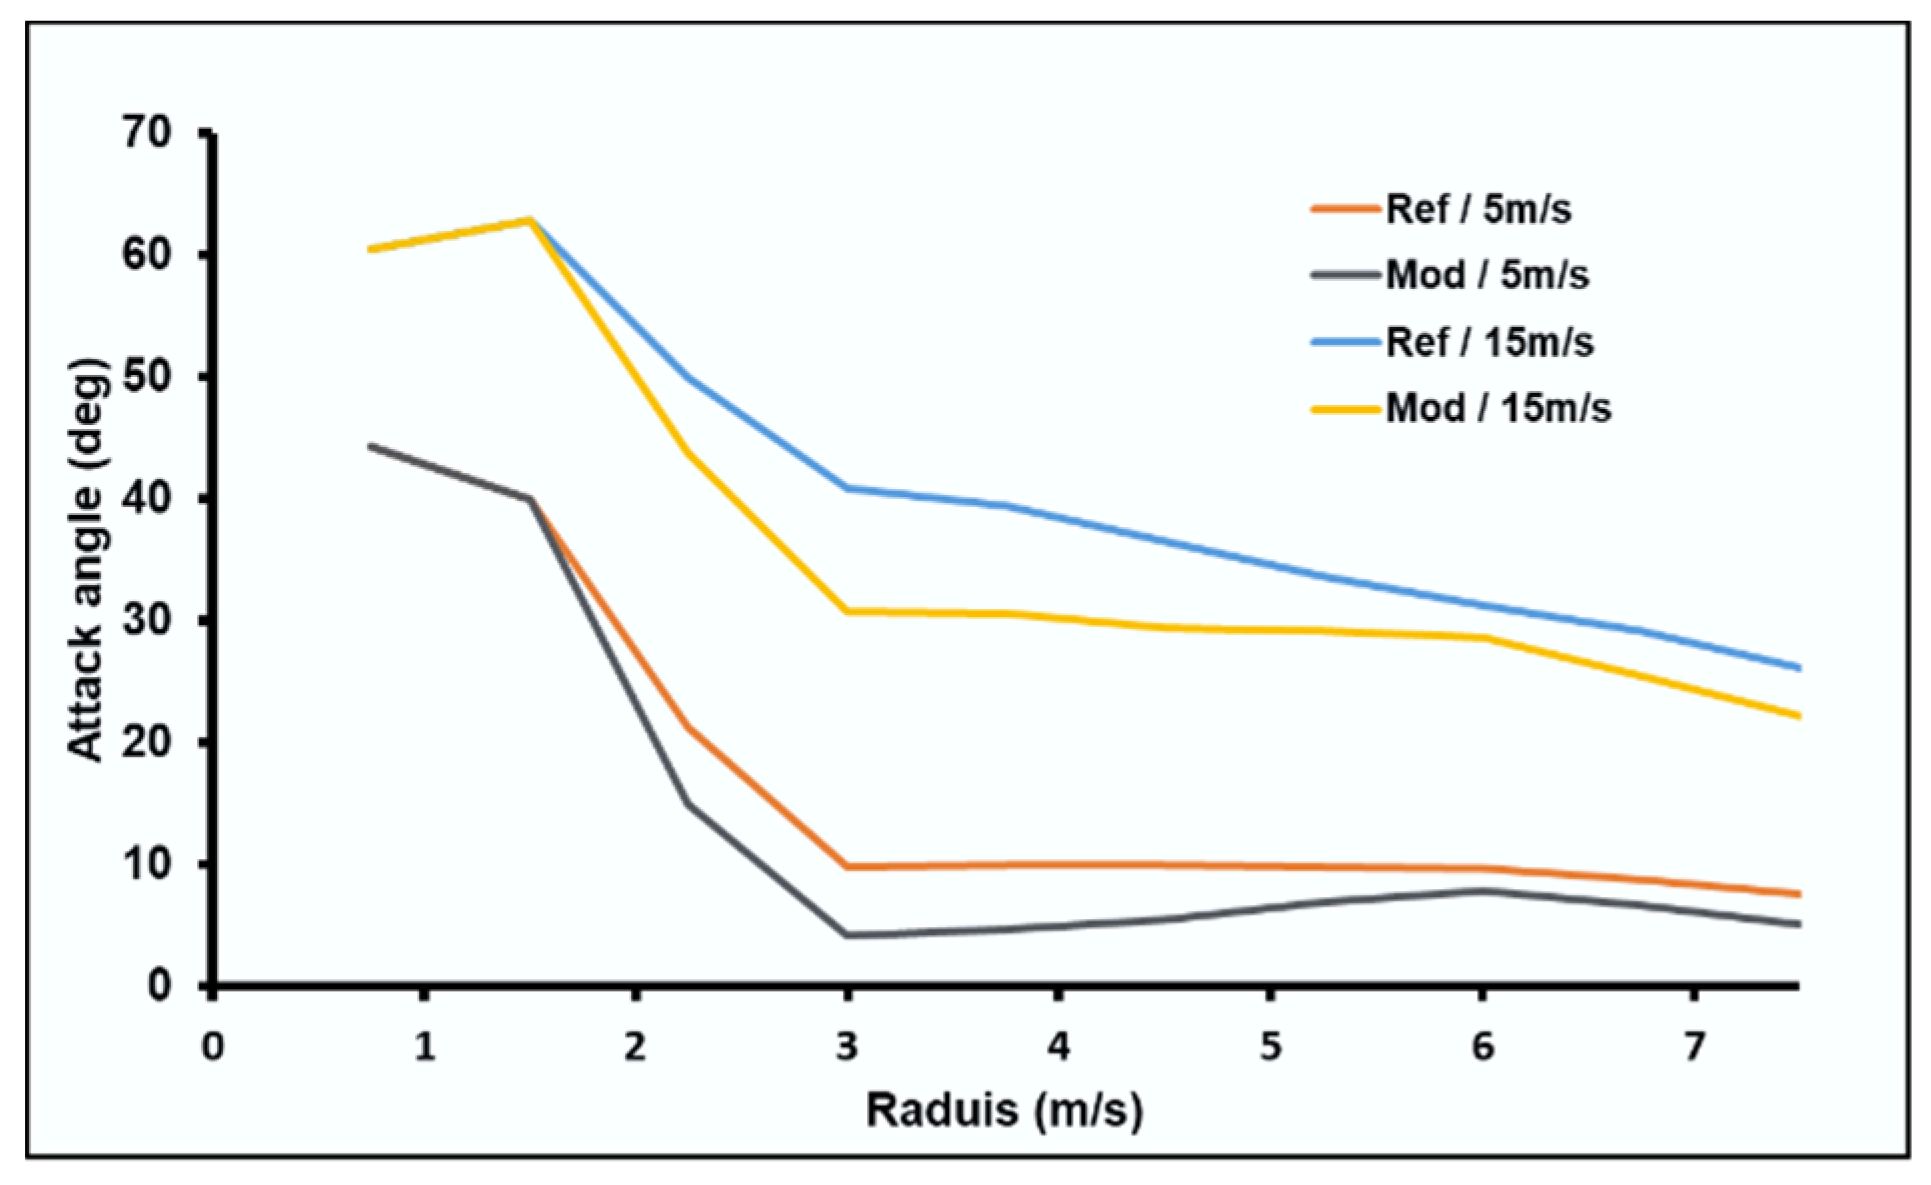
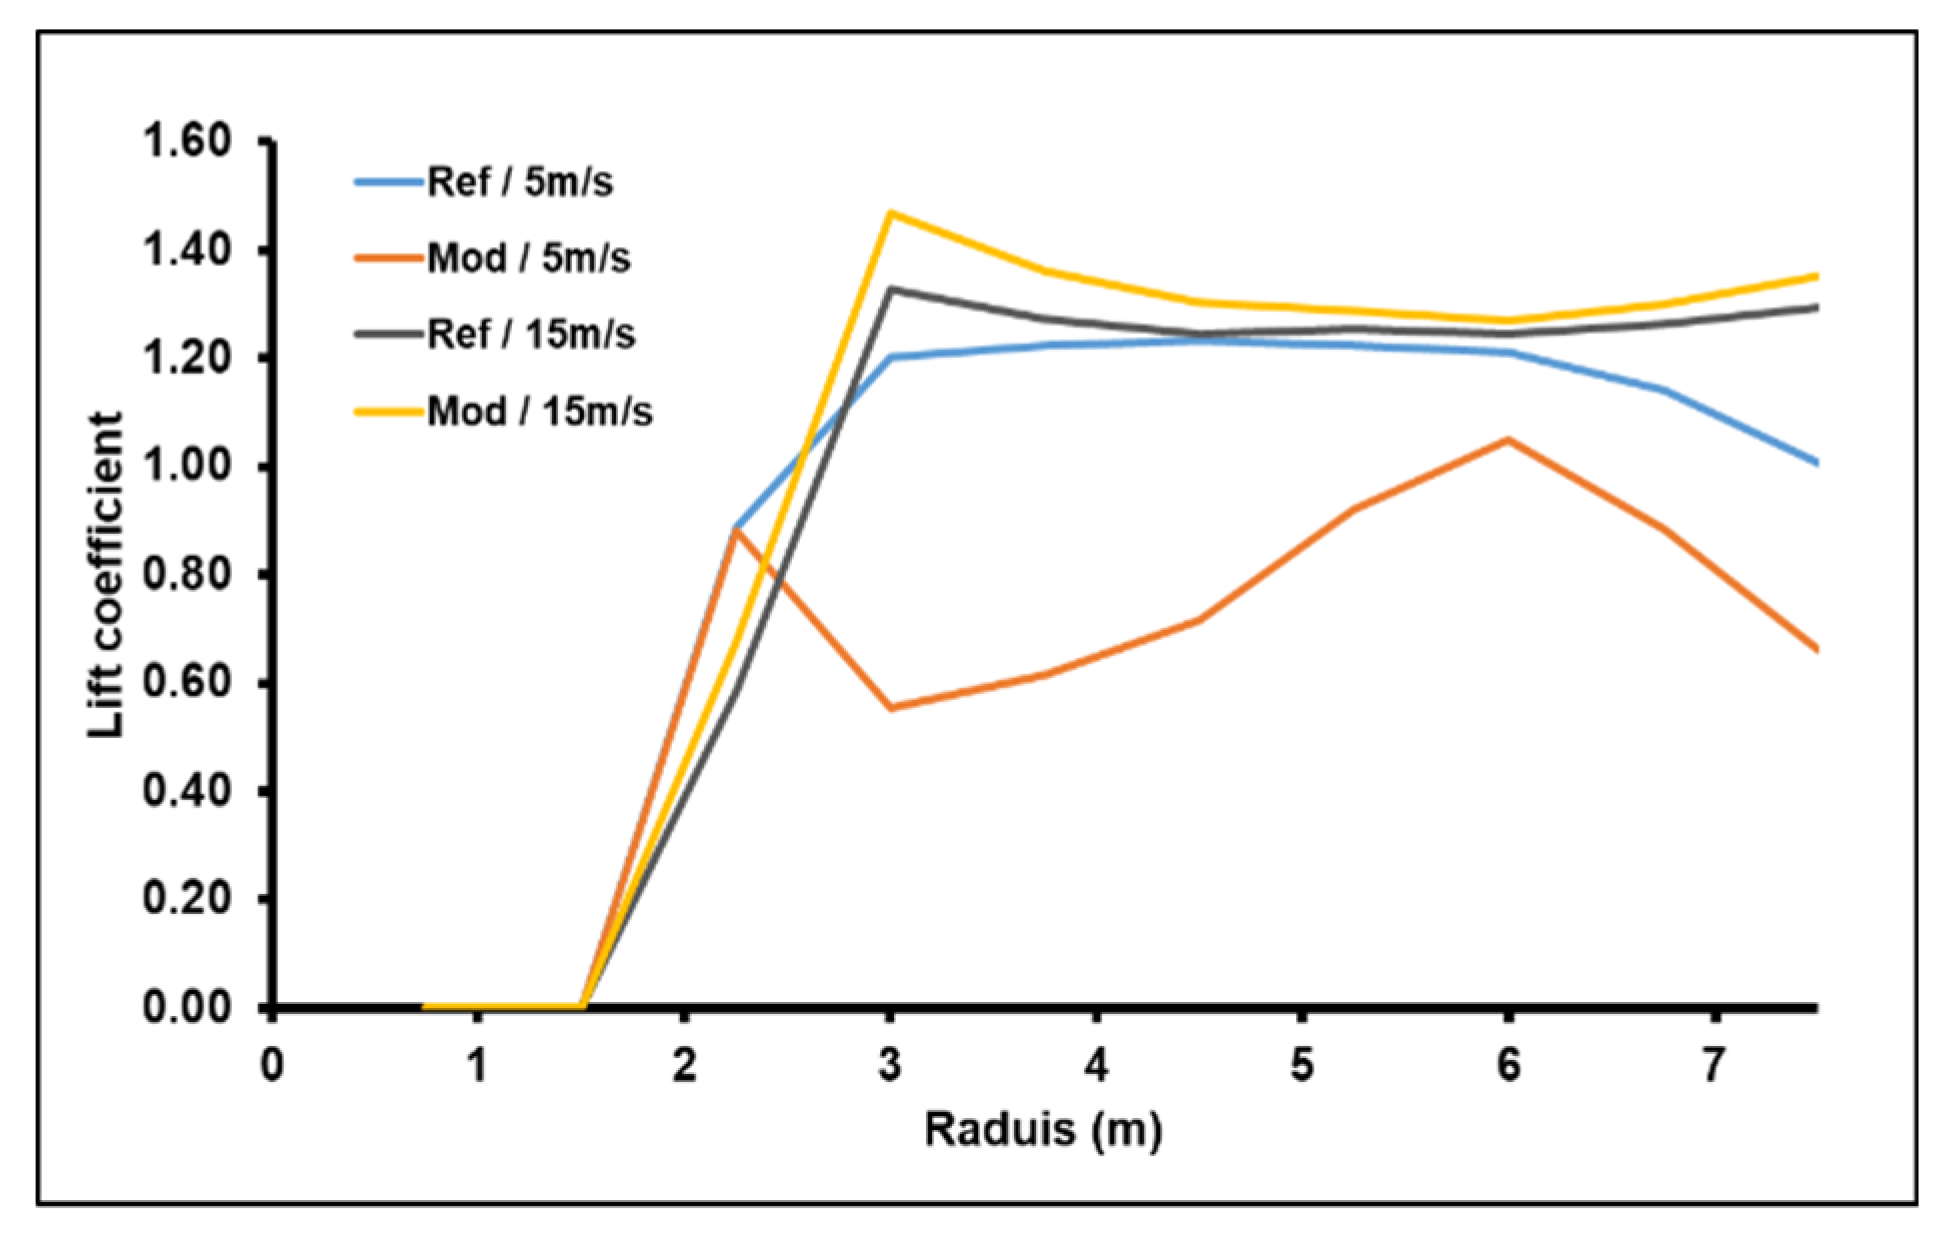
3.4. Optimized Design
4. Results and Discussion
5. Conclusions
Author Contributions
Funding
Acknowledgments
Conflicts of Interest
Nomenclature
| α | Attack angle (deg). |
| γ | Pitch angle (deg). |
| θ | Twist angle (deg). |
| σ | Solidity. |
| λ | Tip speed ratio. |
| λr | Elemental speed ratio. |
| ρ | Air density (1.225 kg/m3). |
| φ | Flow angle (deg). |
| Ω | Rotation velocity (rad/s). |
| Vm | Mean wind speed (m/s). |
| a | Axial induction factor. |
| a′ | Radial induction factor. |
| B | Blade number. |
| Cr | Chord length (m). |
| Cl | Lift coefficient. |
| Cd | Drag coefficient. |
| Cn | Normal force coefficient. |
| Ct | Tangential force coefficient. |
| CT | Thrust coefficient. |
| Cp | Power coefficient. |
| dr | Elemental radial length (m). |
| dFN | Elemental normal force (N.m). |
| dFT | Elemental tangential force (N.m). |
| dT | Elemental thrust force (N.m). |
| dQ | Elemental torque (N.m2). |
| F | Prandtl tip and root loss factor. |
| f | Wind frequency (%). |
| r | Radial position (m). |
| rh | Root radial position (m). |
| R | Radius (m). |
| V1 | Wind speed (m/s). |
| W | Relative wind (m/s). |
| AEP | Annual energy production. |
| BEM | Blade element momentum theory. |
References
- Manwell, J.F.; McGowan, J.G.; Rogers, A.L. Wind Energy Explained: Theory, Design and Application; Wiley: Chichester, UK, 2009. [Google Scholar]
- Burton, T.; Jenkins, N.; Sharpe, D.; Bossanyi, E.A. Wind Energy Handbook; Wiley: New York, NY, USA, 2012. [Google Scholar]
- Liu, X.; Wang, L.; Tangg, X. Optimized linearization of chord and twist angle profiles for fixed-pitch fixed-speed wind tur-bine blades. Renew. Energy 2013, 57, 111–119. [Google Scholar] [CrossRef]
- Capellaro, M.; Cheng, W. An Iterative Method to Optimize the Twist Angle of a Wind Turbine Rotor Blade. Wind Eng. 2014, 38, 489–498. [Google Scholar] [CrossRef]
- Sessarego, M.; Wood, D. Multi-dimensional optimization of small wind turbine blades. Renew. Wind Water Sol. 2015, 2. [Google Scholar] [CrossRef] [Green Version]
- Hassanzadeh, A.; Hassanabad, A.H.; Dadvand, A. Aerodynamic shape optimization and analysis of small wind turbine blades employing the Viterna approach for post-stall region. Alex. Eng. J. 2016, 55, 2035–2043. [Google Scholar] [CrossRef] [Green Version]
- Yang, Y.; Li, C.; Zhang, W.; Yang, J.; Ye, Z.; Miao, W.; Ye, K. A multi-objective optimization for HAWT blades design by considering structural strength. J. Mech. Sci. Technol. 2016, 30, 3693–3703. [Google Scholar] [CrossRef]
- Tahani, M.; Kavari, G.; Masdari, M.; Mirhosseini, M. Aerodynamic design of horizontal axis wind turbine with innova-tive local linearization of chord and twist distributions. Energy 2017, 131, 78–91. [Google Scholar] [CrossRef]
- Lee, S.-L.; Shin, S. Wind Turbine Blade Optimal Design Considering Multi-Parameters and Response Surface Method. Energies 2020, 13, 1639. [Google Scholar] [CrossRef] [Green Version]
- Rahgozar, S.; Pourrajabian, A.; Kazmi, S.A.A.; Kazmi, S.M.R. Performance analysis of a small horizontal axis wind turbine under the use of linear/nonlinear distributions for the chord and twist angle. Energy Sustain. Dev. 2020, 58, 42–49. [Google Scholar] [CrossRef]
- Moradtabrizi, H.; Bagheri, E.; Nejat, A.; Kaviani, H. Aerodynamic optimization of a 5 Megawatt wind turbine blade. Energy Equip. Syst. 2016, 4, 133–145. [Google Scholar] [CrossRef]
- Yang, K. Geometry Design Optimization of a Wind Turbine Blade Considering Effects on Aerodynamic Performance by Linearization. Energies 2020, 13, 2320. [Google Scholar] [CrossRef]
- Kaya, M. A CFD Based Application of Support Vector Regression to Determine the Optimum Smooth Twist for Wind Tur-bine Blades. Sustainability 2019, 11, 4502. [Google Scholar] [CrossRef] [Green Version]
- Méndez, J.; Greiner, D. Wind Blade Chord and Twist Angle Optimization Using Genetic Algorithms. In Proceedings of the Fifth International Conference on Engineering Computational Technology, Las Palmas de Gran Canaria, Spain, 12–15 September 2006. [Google Scholar] [CrossRef]
- Wang, X.; Shen, W.Z.; Wei, J.Z.; Jens, N.S.; Chen, J. Shape optimization of wind turbine blades. Wind Energy 2009, 12, 781–803. [Google Scholar] [CrossRef]
- Schubel, P.J.; Crossley, R.J. Wind turbine blade design. Energies 2012, 5, 3425–3449. [Google Scholar] [CrossRef] [Green Version]
- Derakhshan, S.; Tavaziani, A.; Kasaeian, N. Numerical Shape Optimization of a Wind Turbine Blades Using Artificial Bee Colony Algorithm. J. Energy Resour. Technol. Trans. ASME 2015, 137. [Google Scholar] [CrossRef]
- de Pinto, R.L.U.; Gonçalves, B.P.F. A revised theoretical analysis of aerodynamic optimization of horizontal-axis wind turbines based on BEM theory. Renew. Energy 2017, 105, 625–636. [Google Scholar] [CrossRef]
- Nair, M.S.; Arihant, V.; Priya, D.B.; Subramaniyam, M. Design and CFD analysis of Horizontal Axis Wind Turbine Blade with Microtab. In Proceedings of the IOP Conference Series: Materials Science and Engineering, Ufa, Russia, 10–13 September 2020; Volume 912, p. 022054. [Google Scholar] [CrossRef]
- Abdelsalam, A.M.; El-Askary, W.A.; Kotb, M.A.; Sakr, I.M. Experimental study on small scale horizontal axis wind turbine of analytically-optimized blade with linearized chord twist angle profile. Energy 2021, 216, 119304. [Google Scholar] [CrossRef]
- Hansen, M.O. Aerodynamics of Wind Turbines, 2nd ed.; Routledge: London, UK; Sterling, VA, USA, 2015. [Google Scholar]
- Debbache, M.; Derfouf, S.; Hamidat, A.; Guerira, B.; Karoua, H. Analytical Performance Study of Fixed Speed Wind Tur-bine. Appl. Sol. Energy 2018, 54, 461–467. [Google Scholar] [CrossRef]
- Buhl, M.L., Jr. A New Empirical Relationship between Thrust Coefficient and Induction Factor for the Turbulent Windmill State; Tech. Report No. 500-36834; NREL: Denver, CO, USA, 2005.
- Viterna, L.A.; Corrigan, R.D. Fixed pitch rotor performance of large horizontal axis wind turbines. In Proceedings of the DOE/NASA Workshop on Large Horizontal Axis Wind Turbines, Cleveland, HI, USA, 28–30 July 1981. [Google Scholar]
- Arikan, Y.; Arslan, Ö.P.; Çam, E. The analysis of wind data with rayleigh distribution and optimum turbine and cost analysis in elmadağ, turkey. Istanb. Univ. J. Electr. Electron. Eng. 2015, 15, 1907–1912. [Google Scholar]
- Airfoil Database. Available online: http://airfoiltools.com/ (accessed on 6 April 2020).


| Section | Blade Geometry Parameters | |||
|---|---|---|---|---|
| Number | Position (m) | Profile | Chord (m) | Twist (deg) |
| 1 | 0.75 | Circle | 0.40 | 0 |
| 2 | 1.50 | Circle | 0.40 | 0 |
| 3 | 2.25 | NACA23015 | 0.87 | 9.36 |
| 4 | 3.00 | NACA23015 | 0.70 | 5.07 |
| 5 | 3.75 | NACA23015 | 0.58 | 2.28 |
| 6 | 4.50 | NACA23015 | 0.50 | 0.34 |
| 7 | 5.25 | NACA23015 | 0.43 | −1.07 |
| 8 | 6.00 | NACA23015 | 0.38 | −2.15 |
| 9 | 6.75 | NACA23015 | 0.34 | −3.00 |
| 10 | 7.50 | NACA23015 | 0.31 | −3.69 |
Publisher’s Note: MDPI stays neutral with regard to jurisdictional claims in published maps and institutional affiliations. |
© 2021 by the authors. Licensee MDPI, Basel, Switzerland. This article is an open access article distributed under the terms and conditions of the Creative Commons Attribution (CC BY) license (https://creativecommons.org/licenses/by/4.0/).
Share and Cite
Debbache, M.; Hazmoune, M.; Derfouf, S.; Ciupageanu, D.-A.; Lazaroiu, G. Wind Blade Twist Correction for Enhanced Annual Energy Production of Wind Turbines. Sustainability 2021, 13, 6931. https://0-doi-org.brum.beds.ac.uk/10.3390/su13126931
Debbache M, Hazmoune M, Derfouf S, Ciupageanu D-A, Lazaroiu G. Wind Blade Twist Correction for Enhanced Annual Energy Production of Wind Turbines. Sustainability. 2021; 13(12):6931. https://0-doi-org.brum.beds.ac.uk/10.3390/su13126931
Chicago/Turabian StyleDebbache, Mohammed, Messaoud Hazmoune, Semcheddine Derfouf, Dana-Alexandra Ciupageanu, and Gheorghe Lazaroiu. 2021. "Wind Blade Twist Correction for Enhanced Annual Energy Production of Wind Turbines" Sustainability 13, no. 12: 6931. https://0-doi-org.brum.beds.ac.uk/10.3390/su13126931