
Analysis of Policies of Railway Operators Using SWOT Criteria and the SIMUS Method: A Case for the Bulgarian Railway Network


1
Faculty of Transport, Technical University of Sofia, 8 Kl. Ohridski Blvd., 1000 Sofia, Bulgaria
2
Institute for the Management and Innovation of Knowledge (INGENIO), Polytechnic University of Valencia, Camí de Vera, s/n, 46022 València, Spain
*
Author to whom correspondence should be addressed.
Sustainability 2021, 13(12), 6948; https://0-doi-org.brum.beds.ac.uk/10.3390/su13126948
Submission received: 14 May 2021
/
Revised: 7 June 2021
/
Accepted: 18 June 2021
/
Published: 21 June 2021
(This article belongs to the Special Issue Multi-criteria Decision Making and Sustainable Transport)
Abstract
:This study is useful for railway operators as it enables them to verify their decisions against the results of the application of the techniques of strategic planning and multi-criteria analysis. It gives railway stakeholders concise, objective and unbiased information so that they can then make decisions and also allows them to determine the strengths and sensitivity, of the best solution found. This paper presents a methodology for the assessment of the policies of railway operators using Strengths–Weakness–Opportunities–Threats (SWOT) criteria and the Sequential Interactive Modelling for Urban Systems (SIMUS) method. The methodology of the research consists of two stages. In the first stage, the alternatives of the policies for the railway operator are formulated; the criteria in the SWOT group are defined; and the values of the criteria are determined for each of the alternatives. In the second stage, the SIMUS method is applied to rank the alternatives and assess the criteria in the SWOT groups. The criteria are interpreted as objectives and linear optimizations are performed. A comparison between the desired values for each objective of the SWOT criteria and the optimum values of the objective functions obtained by SIMUS was made. The methodology was applied to the Bulgarian railway network. Three policies for railway operation were studied. The total number of 17 railway policies criteria in the SWOT group were defined and assessed—three strengths criteria, seven weaknesses criteria, three opportunities criteria and four threats criteria. The results indicated that the best strategy is A3 (some reconstruction of the railway infrastructure and new rolling stock on some lines), with the highest score of 3.76, followed by A2 (new rolling stock on some lines), with a score of 2.71. The status-quo strategy (A1) has a very low score of 0.43, that the current situation or status-quo cannot be supported. The weights of both strengths and opportunities are both of the same importance with a weight of 0.180. It was found out that the clusters Weakness and Threats are dominant with weights of 0.4 and 0.24 respectively. The results show that the weights are all practically the same, about 0.06, and therefore, no discrimination by importance is possible. The methodology makes it possible to consider the alternatives simultaneously, and in this way, the results will reflect the effect of one criterion on all others, and permit us to quantify the differences between expected and real results.
1. Introduction
The present work attempts to determine the status of the railway network, regarding its actual conditions and needs.
The Strengths–Weakness–Opportunities–Threats (SWOT) method is a useful procedure to determine strategies, and Multi-Criteria Decision Making (MCDM) is an adequate mechanism to select alternatives or projects subject to different types of criteria. There are papers published where both methods have been used jointly; in this sense, SWOT identifying strategies and MCDM determine the best strategy. This paper, even when using both procedures jointly, employs only the SWOT factors, that is Strengths–Weakness–Opportunities and Threats, the first two as internal or exogenous factors and the last two as external or endogenous factors, which constitute the criteria This approach is different from the normal procedure where the strategies are subject to a set of criteria.
This is not only a procedural novelty, but what is important about it is that using SWOT factors, the result, obtained by MCDM, incorporates something valuable, which is the analysis of the current situation, made by managers, as well as future decisions, to address a complex railway problem. In this case, performance factors are real, obtained from railway archives and statistics. These factors are not subjective, since they are based on the daily operation of the railway, and thus incorporate the goals of the management.
It is important to determine quantitatively how much an improvement in one of these factors affects the others, and how this is related to the needs of the company and the necessity to get the best service, compared with other railways networks in European countries. Consequently, using numbers for performance factors is not enough: those numbers must somehow incorporate the opinion, suggestions, results from discussions, etc., from stakeholders. This is the reason why we can consider this proposed procedure to be different from others as it uses SWOT factors as criteria to evaluate policies in an MCDM method.
The objective of this paper is to develop a methodology that can help to determine the impact of one factor on the others, and how they are related in their influence. This information is needed for the management to have balanced information of the railway status, i.e., which sectors need maximum improvement and which need to have lesser degrees of development or service.
The hypothesis of this research is that a suitable transport policy can be successfully identified using the SWOT group criteria and Sequential Interactive Modelling for Urban Systems (SIMUS) method which presents the criteria as objectives and uses the linear programming method. The ranking of alternatives is performed taking into account multiple objectives. The linear optimization models for each objective are solved consistently [1,2,3]. The research questions consist of the following issues: how to eliminate subjectivism when assessing the SWOT group criteria; how to assess the current situation as well as future consequences.
The aim of this research is to increase the level of decision making by integrating the advantages of SWOT analysis with the advantages of the SIMUS method; to assess the SWOT criteria and alternatives of strategic planning; to help transport managers in their decisions on the analysis, comparison and the selection of a suitable strategy.
The application of a novel SWOT-SIMUS approach in this paper is presented in the railway transport system. The importance of rail transport as a service is that it is an ecological means of transport with a low carbon footprint as compared to road transport.
The case of the Bulgarian railway network is presented. The current situation shows that the average technical speed of passenger trains is one of the lowest in Europe, which is the reason for the low quality of the service offered. The low quality and capabilities of rolling stock hinder the innovative development of railway infrastructure. A significant proportion of the rolling stock operated on the national railway infrastructure is obsolete and needs to be renewed and modernized. The existing structure of trains by type could be improved through the implementation of new types of trains. The alternatives for the improvement of the Bulgarian railway transport are presented and the best one is selected on the basis of the proposed approach.
The advantages of the novel SWOT-SIMUS approach are as follows: it does not use expert assessments to evaluate the criteria and rank the alternatives; it uses linear optimization for each objective which allows us to determine the score of each objective; it gives a ranking of the alternatives; the multi-criteria and multi-objective approaches to decision making are combined to increase the adequacy of the results; it also allows for the weights of the criteria to be determined if the decision-maker wants to analyse them.
2. Literature Review
Some authors consider only the problem with the formulation of the SWOT factors and their assignment to the relevant group as strengths, opportunities, threats, and weaknesses. The weights of the criteria in these cases are not determined. The application of SWOT analysis is presented in [4]. The SWOT analysis of railway freight transport is conducted in [5]. In [6] a SWOT analysis of China’s High-speed Rail was made. The strengths, opportunities, threats, and weaknesses were formulated. The SWOT analysis was used to develop city public transport strategies [7]. The SWOT analysis was applied to spatial planning in the field of environmental resources management [8]. The railway sector performance with 130 companies in Turkey was studied. The authors have elaborated methodology to determine the most influenced factors on companies’ competitiveness performances based on four approaches SWOT Analysis [9]. The data for analysis were collected based on questionnaires. The different approaches have different dimensions, but it was found that the results given are similar. The SWOT analysis was also applied to study the development strategy of automobile reverse logistics [10]; to analyse the underground pedestrian systems [11].
Some authors integrated the SWOT analysis with the Quantitative Strategic Planning Matrix (QSPM) approach. This approach has been applied to investigate ecotourism development [12]. The model of sustainable urban development based on SWOT analysis and quantitative strategic planning matrix (QSPM) was performed in [13]. A large number of SWOT criteria were introduced. Eleven strengths criteria, nine weaknesses criteria, fourteen opportunities criteria and ten threats criteria were listed and assessed through the expert method with scores from 1 to 5. The SWOT strategies were evaluated and the most attractive one was selected.
Some of the researchers combined the SWOT analysis with methods of multi-criteria analysis. Many researchers combined SWOT analysis and Analytic Hierarchy Process (AHP) or Analytic Network Process (ANP) methods. The combination of the AHP method and SWOT analysis was applied to study the strategy of development of railway transport in West Africa [14]. The authors formulated sub-criteria in each SWOT group. A total of fourteen sub-criteria was studied. The weights of the sub-criteria were determined by using AHP. The extension of SWOT analysis, named TOWS analysis, was used to determine the relationships between the internal and external factors. Four different relationships, such as SO, WO, ST, and WT were analysed through a combination of sub-criteria from these groups. So, different strategies were formulated. The air, rail, water, truck, and intermodal modes were studied to determine the transport strategy for Cape Breton Island [15]. A SWOT matrix was formed, and SWOT factors in each group were defined. The authors selected 20 factors (out of 55) to make a decision. The factors were ranked by using two methods and expert assessment (multifactor process, and AHP method). The weights were determined as average values of both methods. Finally, the transport strategies were ranked. A hybrid “three-stage” SWOT model was elaborated in [16]. The model was experimented with for the Worldwide Express Mail Service in China. The AHP method was applied to evaluate the factors in each SWOT group and the priorities. The strategic quadrilateral model and the gravity center were used to represent the market position. The effective strategy was determined taking into account the maximum and sub-maximum sub-array techniques. In [17], the authors used a combination of the AHP method and SWOT analysis with the purpose to prepare an external analysis evaluation. The SWOT matrix was applied to identify the opportunities and threats for the company. The Long-Distance Passenger Transportation on a Highway Network was analysed by using the SWOT-AHP model [18]. Five strengths criteria, four weaknesses criteria, three opportunities criteria and three threats criteria were defined and assessed by the AHP method. The logistics strategy factors in terms of Strengths, Weaknesses, Opportunities and Threats were defined and assessed in [19]. The combination of SWOT and AHP methods was used. In each SWOT group were introduced three criteria. Their weights were determined by applying the AHP method. In [20] the authors used a combination of the AHP and SWOT methods to investigate urban planning. The best strategy for the development of Urmia City was chosen. The tourism sector in Turkey was evaluated through a combination of the SWOT and AHP methods. Four strengths criteria, five weaknesses criteria, five opportunities criteria and five threats criteria were defined. The weights of criteria were determined through the AHP method [21]. The SWOT alternatives were examined. The combination of Analytic Network Process (ANP) and SWOT were applied for ranking the energy automobile industry in China [22]; for evaluating natural gas strategies [23].
In order to improve the decision-making process, another group of authors integrated more multi-criteria methods with SWOT analysis. The SWOT analysis was combined with the Decision-Making Trial and Evaluation Laboratory (DEMATEL), analytic network process (ANP), and TOPSIS and VIKOR methods [24]. The DEMATEL method was used to determine the relationship between the criteria in the SWOT group. The weights of criteria were calculated by using the ANP method. The strategies were prioritized with the TOPSIS method, and compared through the VIKOR method. The SWOT analysis was also combined with ANP and VIKOR methods in [25].
Some authors used fuzzy sets and fuzzy multicriteria methods to take into account the uncertainty of the processes. In these cases, some research combined fuzzy variants of the AHP method with SWOT analysis. The SWOT analysis was integrated with the neutrosophic (N-AHP) approach for Strategic Planning [26]. The triangular neutrosophic numbers were used. In [27] there was proposed a new combined model including the SWOT analysis and intuitionistic fuzzy AHP (IF-AHP) methods to determine the weights of the criteria in the SWOT groups. The model was applied in reverse logistics. Six strengths criteria, five weaknesses criteria, five opportunities criteria and five threats criteria were defined and assessed through the IF-AHP method. An integrated approach based on axiomatic fuzzy set (AFS) theory, analytic hierarchy process (AHP), simple additive weighting (SAW) and SWOT analysis was proposed in strategic planning [28]. A case study of the tourism industry was presented. The SWOT group criteria included four strengths criteria, four weaknesses criteria, three opportunities criteria and four threats criteria. Six alternatives were evaluated.
A hybrid approach based on Fuzzy AHP, Fuzzy TOPSIS methods and SWOT analysis was applied in [29] to assess alternative railway lines. The criteria in the SWOT group were determined through Focus Group Discussion. The combination of AHP and fuzzy TOPSIS with SWOT analysis was also demonstrated in [30]. The most appropriate strategic plan for energy cooperation was proposed, by evaluating four alternatives identified from the SWOT analysis. The methodology was used for the case of Morocco and Egypt. In [31] the authors applied the integration of the AHP method, fuzzy TOPSIS and SWOT analysis to evaluate the electricity supply chain. The total number of 48 criteria in the SWOT group were studied and ranked—12 strengths criteria, 15 weaknesses criteria, 12 opportunities criteria and 9 threats criteria. The SWOT analysis was integrated with the Fuzzy Preference Ranking Organization Method for Enrichment Evaluations (F-PROMETHEE) method for the selection of the optimal toll collection system [32]. The alternatives were analysed based on the SWOT analysis according to their strengths, weaknesses, opportunities and threats. Five groups of criteria and sub-criteria in each group were defined and assessed through fuzzy numbers and pair-wise comparison. The alternatives were ranked according to the PROMETHEE method. The city’s transportation system strategies were evaluated and prioritized based on SWOT analysis and fuzzy complex proportional assessment (COPRAS) method [33]. The authors defined six strengths criteria, eight weaknesses criteria, four opportunities and four threats criteria. Based on SWOT analysis, the strategies of transport development were proposed and evaluated using the economic, environmental, and social indices of the COPRAS method.
An integrated SWOT-FUZZY PIPRECIA model was formed to analyse and improve logistics performances [34]. The transport of goods was studied. The internal and external factors were determined. The authors listed six strengths factors, six weaknesses factors, five opportunities factors and six threats factors. The criteria evaluation was performed using a linguistic scale and fuzzy triangle numbers. The ranking of SWOT group criteria was performed. A complex model for strategic planning for a holding car manufacturer company was elaborated in [35] on the basis of a fuzzy quantitative strategic planning matrix (FQSPM) and SWOT analysis. The FQSPM method was applied to assess the uncertainty of the criteria. A large number of SWOT criteria were analysed. Their number was reduced on the basis of their weights using Gap analysis with fuzzy data ranking. Five alternatives were compared. The evaluation of the performance of the alternatives and the selection of the best one was made through a comparison using several fuzzy multi-criteria methods—ARAS-F, COPRAS-F, Fuzzy MOORA, and Fuzzy TOPSIS methods. In [36] the authors combined three methods, SWOT analysis, Hesitant Fuzzy Linguistic Analytic Hierarchical Process (HFL-AHP) and Hesitant Fuzzy Linguistic Multi-Attributive Border Approximation Area Comparison (HFL-MABAC) to prioritize health tourism strategies. The authors defined twenty-four criteria for SWOT analysis and eight alternatives. The hesitant fuzzy linguistic approach was used to take into account the uncertainty of the process.
Some authors combined the SWOT approach with mathematical optimization [37,38]. The fuzzy SWOT analysis and fuzzy linear programming were used together for supplier selection [37]. The weights of criteria in the SWOT groups were determined using linguistic variables and expert assessment. The fuzzy linear mathematical model was elaborated to determine the quantity from each supplier. The weights were used as an input to the model. Another model for supplier selection was elaborated on in [38]. The authors combined the SWOT analysis and integer linear programming (ILP). The experts assessed the criteria in the SWOT groups. The weights of criteria were calculated based on Shannon entropy. The results were applied as input for the ILP model to select a supplier. It can be concluded that in the cases of combination of SWOT analysis with mathematical optimization, the expert evaluation was also used to determine the weights of the criteria, which increases the subjectivity of decision-making.
Some authors applied a combination of SWOT analysis and political, economic, social, technological, legal and environmental (PESTLE) analysis to identify both the internal and external factors that have an impact on the studied system. In [39], the SWOT/PESTLE analysis was used to determine the factors that have a positive or negative effect on the adoption and successful implementation of a port energy management system. In [40] a SWOT/PESTLE analysis was utilized to show different policies and initiatives, related to e-mobility, renewable energies and information and communication technology, collected from five European regions. The Drain Water Heat Recovery Units in Poland were studied using a SWOT/PESTLE analysis [41].
The common denominator in all cited studies is the evaluation of the SWOT criteria; the subjective approach by using expert assessments; the application of the multi-criteria approach.
SIMUS is a multi-criteria method that does not use experts and evaluation scales. It is based on the linear programming method and this is its main advantage. The criteria are considered as objectives. The difference between this study and related research is in the absence of subjectivity, which is a novelty in this field.
3. Materials and Methods
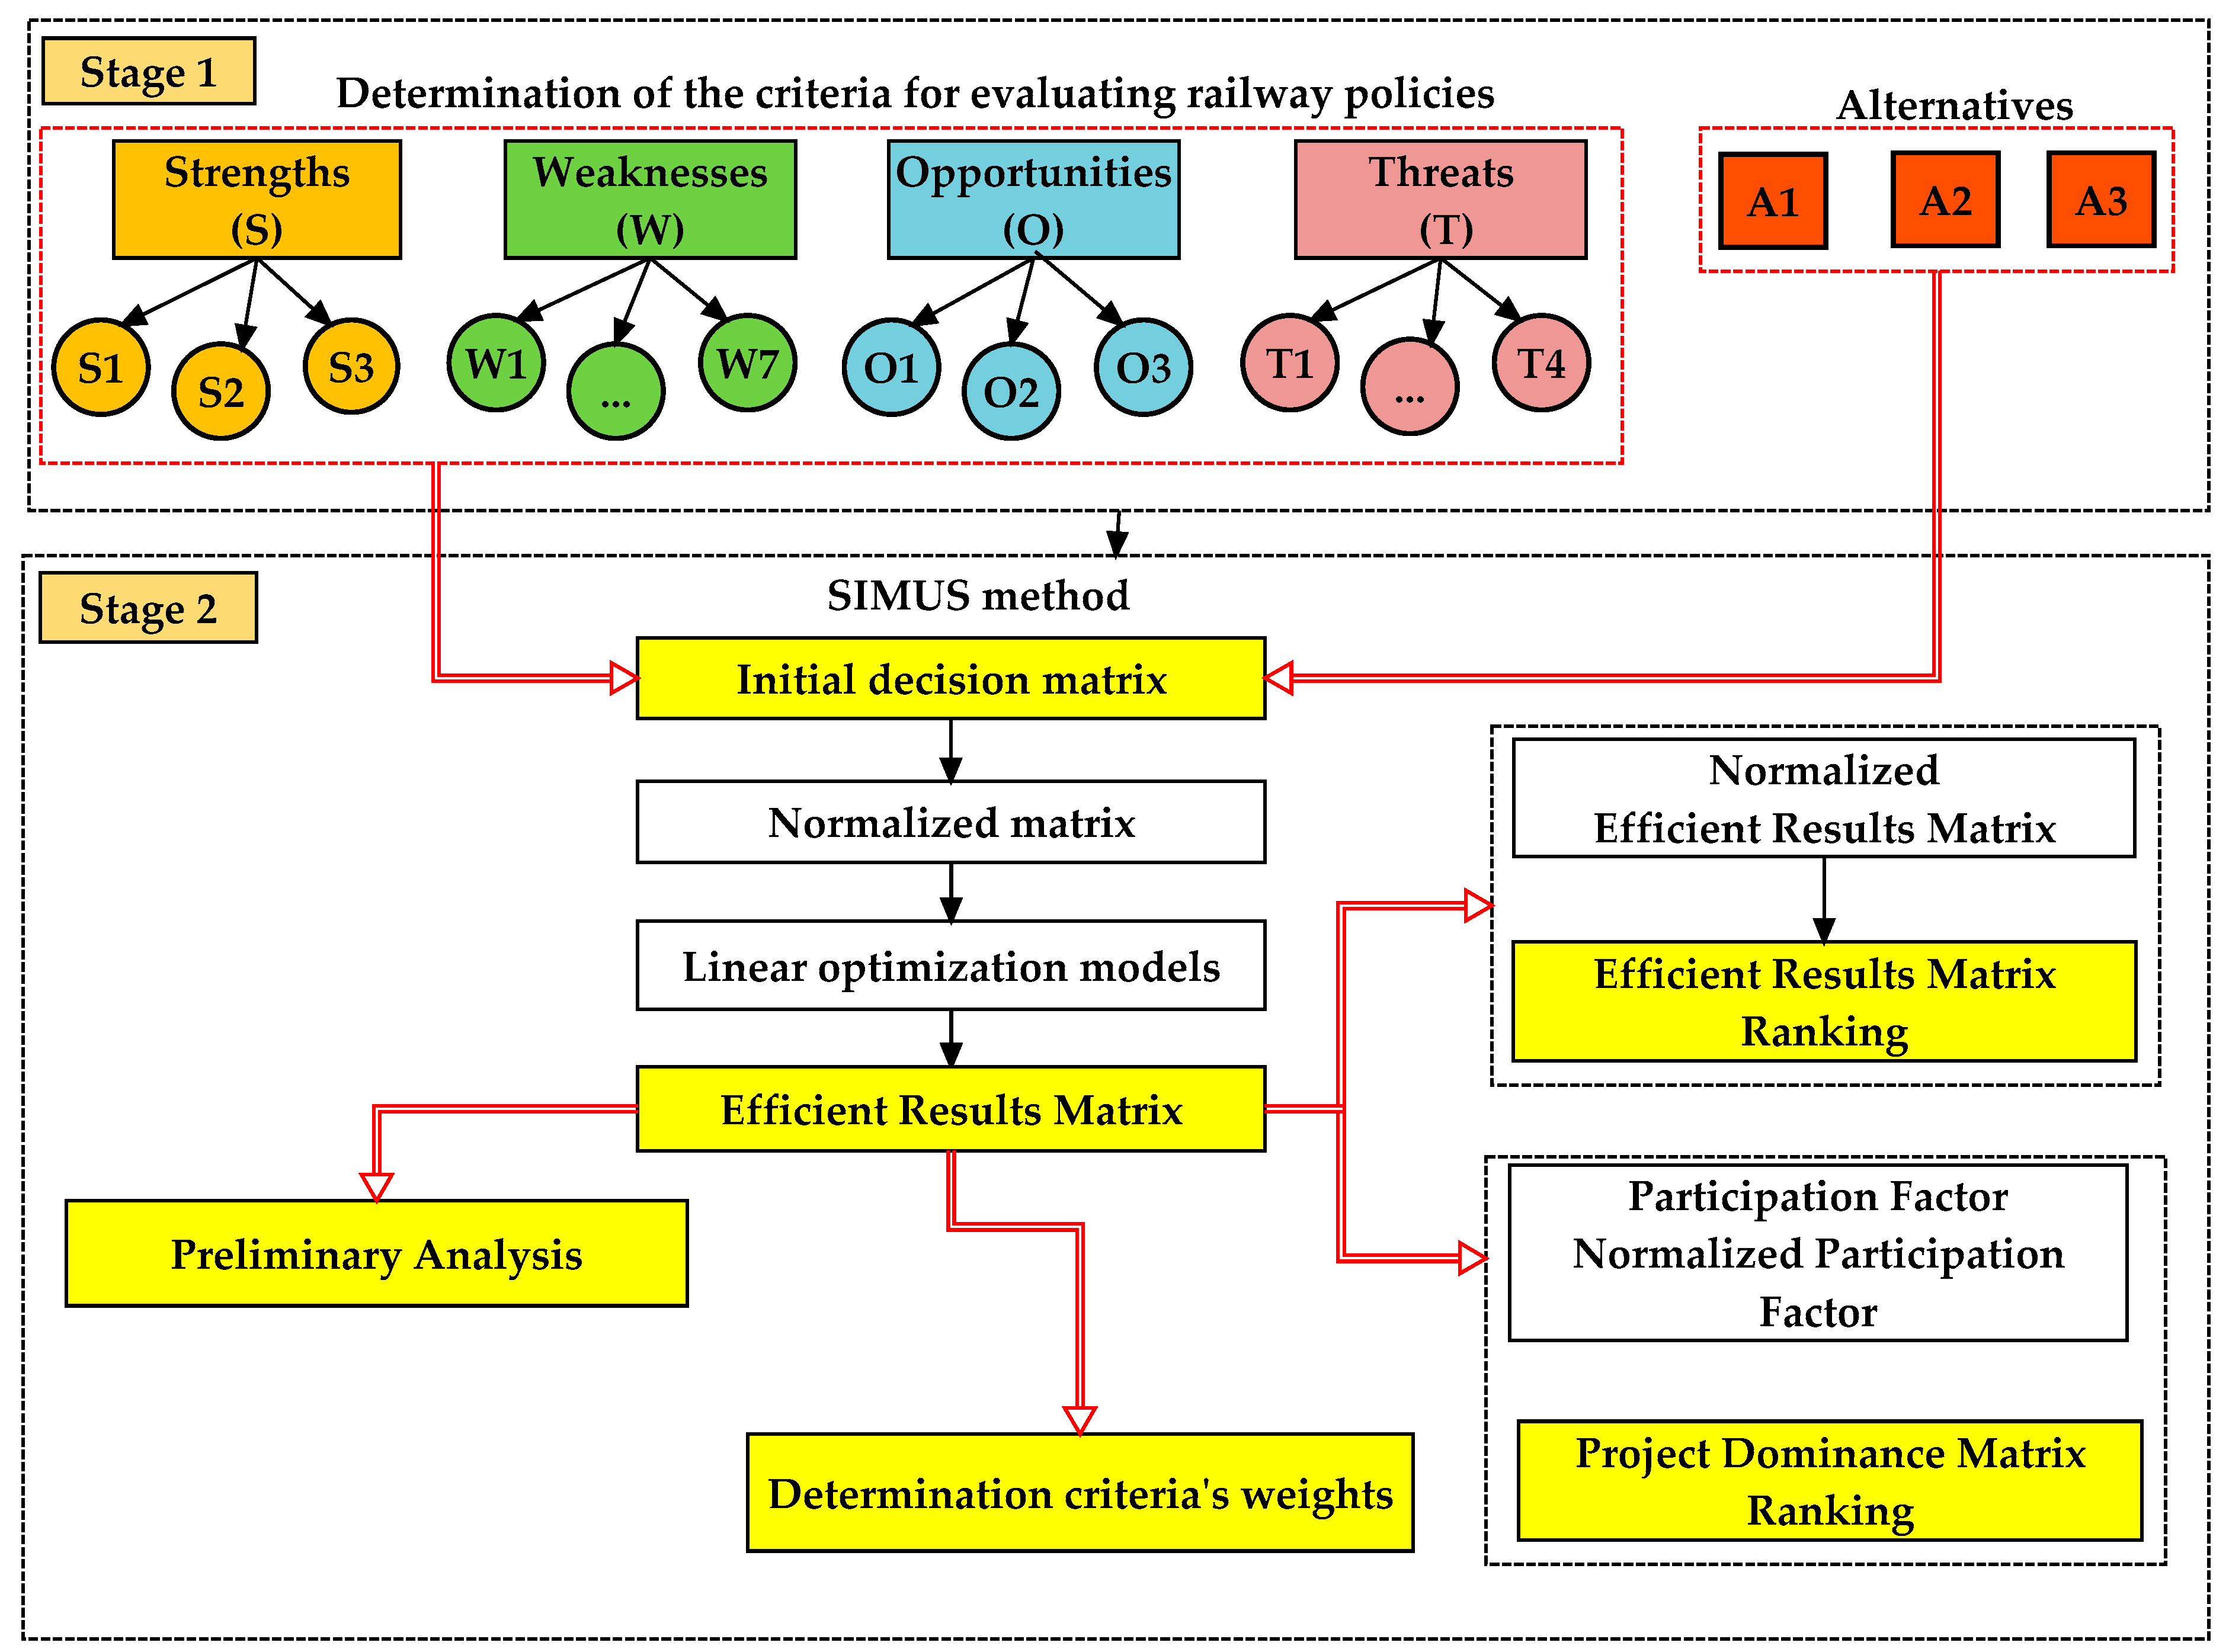
Figure 1 shows the scheme of the methodology.
The methodology of the research consists of two stages:
- -
- In the first stage, the alternatives for the policies of the railway operator are formulated; the criteria in the SWOT group are defined; the values of the criteria are determined for each alternative. In this stage, the decision matrix is formed. It should be noted that the alternatives are not SWOT strategies which are pairs of factors, for example, Strength–Opportunities strategy or another.
- -
- In the second stage, the SIMUS method is applied to rank the alternatives and assess the criteria in the SWOT groups. A comparison is made of the desired values for each objective of the SWOT criteria and the optimum values of the objective functions obtained by SIMUS.
3.1. Determination of the Alternatives
The alternatives in this research represent strategies of the railway operator about the policies for railway transport. The case for the Bulgarian railway is considered as follows: there are three alternatives, or strategies, the first of which is to maintain the state of affairs as it is; the second, to replace the rolling stock only on some lines of the network, which is a partial improvement; the third, partial improvement on some lines with replacement of some of the rolling stock and also partial improvement of the railway infrastructure.
The characteristics of the alternatives are presented as follows:
A1—Maintain the current situation in the railway service, or status quo. In this alternative, nothing is done. Only some sections are rehabilitated to increase speed according to [42].
A2—New rolling stock on some lines. It means a staged update of rolling stocks. At the moment the government has decided to purchase new rolling stock (locomotives and electric multiple units) The delivery of new locomotives is part of BDZ’s (Bulgarian State Railways) plans for modernization and improvement of the railway service. With the purchase of new rolling stock, the goal is to replace 50% of the rolling stock by 2024. BDZ already has three new locomotives, which run on trains on the Sofia–Burgas–Sofia, Sofia–Varna–Sofia and Sofia–Svilengrad–Sofia routes. It is planned that up to 16 new electric multiple units will serve fast intercity trains for trips over 3 h along the main Bulgarian railways.
A3—Some reconstruction of the railway infrastructure and new rolling stock on several lines. It means the rehabilitation of the railway lines financed under [42], and it is currently underway.
3.2. Defining the Criteria in SWOT Groups
The definition of the criteria depends on the transport policy assessment. It is necessary to define the criteria in the SWOT groups that are related to the capabilities of the transport operator and the requirements of passengers for transport. The main criteria to evaluate the transport plan in railway transport are defined in [43] as follows: transport satisfaction, trains/day; operating costs, EUR/day; the average number of train stops; reliability; average operational speed, km/h; directness. The main criteria for evaluation of the transport plan by railway and road transport in parallel routes were defined as follows: environmental criteria refer to the carbon dioxide and pollutant emissions during transportation; economic criteria include operational costs, fares, infrastructure charges, ticket price; technological criteria including the time spent travelling in hours, possibility of transportation from door to door, duration of transshipment operations; and social criteria refer to comfort, safety and reliability [43]. The criteria in the SWOT groups are defined taking into account the criteria defined in [43] related to railway planning.
In this study the SWOT criteria can be defined as quantitative and qualitative. The quantitative criteria are set with their values for each of the studied alternatives. The quality criteria are set in the following ways: with a scale for evaluating the performance of the respective criterion or by using the answer “yes” or “no”. In the first case, the following rating scale is selected: 0, 1, 2 or 3. The value “0” indicates non-fulfilment of the respective indicator; a value of “1”, “2” or “3” means low, medium or high performance respectively. In the second case, if the answer is “yes”—“1”is written, otherwise—“0”.
In this study, the following criteria in the SWOT groups (clusters) are proposed:
3.2.1. Internal to the Railway
Strengths (S), in the network, with the following criteria:
S1—Ecological transport with low CO2 emissions. The values of CO2 emissions are determined according to the electricity generated for railway traction. The electric-multiple unit trains have lower energy consumption, which allows for a reduction of the emissions with approximately the same number of trains on the lines. Naturally, power consumption increases proportionally to the speed increment; consequently, the goal of this criterion is to minimize electric consumption.
S2—Security in the network. The values of this criterion are 1 or 2, which shows the level of security. The current situation (A1) has a value of 1, while A2 and A3 have a value of 2, taking into account that the new rolling stock and the reconstructions on railway infrastructure increase the level of security of transport. The objective of this criterion is to maximize security.
S3—Reliability of the network. This criterion is assessed as 1, 2 and 3. A1 is valued as 1. A2 is assigned 2, considering that the renovation of rolling stock increases the reliability of transport. The value of 3 is appropriate A3 because it offers increased reliability—on the one hand by the rolling stock and on the other by the railway. The objective of this criterion is to maximize reliability.
Weakness (W), with the following criteria:
W1—Weak position in the transport market. This criterion can have values of 1, 2 or 3. A1 is assessed as 1. The position of railway transport on the market of transport services improves, with the improvement of the condition of the rolling stock and railway infrastructure, as quality, comfort, safety and reliability of transport increase. Value 2 denotes improving the market position of the railway due to rolling stock renewal. Value 3 shows an increase in the railway market position. The objective of this criterion is maximization.
W2—Low frequency of transportation (pair trains/day). This criterion shows the possibilities of the rail operator to meet the needs of passengers for transport. The number of trains increases when the railway infrastructure is improved. The objective of this criterion is maximization.
W3—Low operating speed (km/h). The operating speed is determined as an average of all fast and high-speed trains in the railway network. The operating speed includes the train speed and the duration of the stops at the stations along the route. In the current situation (A1), the operating speed is low, because many sections of the railway have a low permissible speed. The increase of the operational speed is achieved with the reconstruction of the infrastructure. The renovation of rolling stock allows for the reduction of downtime due to accidents, technical failures, and an insufficient number of locomotives. The value of this criterion increases when there are conditions for some trains to run at high speed. The objective of this criterion is maximization.
W4—High operating costs (EUR/day). Operating costs depend on the number of trains. Costs for investment in rolling stock, as well as for reconstruction are not taken into account. The objective of this criterion is minimization.
W5—Few direct trains. This means services between the start and endpoints with a reduced number of intermediate stops. This criterion may have the following values: 0 or 1. The current situation (A1) is characterized by two categories: Fast trains with mandatory reservation, which serve big administrative and transportation centres. Fast trains which do not require mandatory reservation and also serve additional municipal centres. The value of this criterion for the current situation (A1) is 0. The introduction of direct express intercity trains, which have reduced stops in only a few places along the route, increases the directness of the journey and reduces travel time. The renewal of the rolling stock, as well as the reconstruction of the infrastructure, increases directness, therefore, A2 and A3 have a value of 1, which means direct express routes. The objective of this criterion is maximization.
W6—Increased average number of stops. This refers to the average number of stops per train, taking into account all fast and accelerated fast trains on the railway network. Two aspects of this criterion must be considered. The first one is that the increased number of stops provides a better frequency of service to the settlements. The second is that due to the decrease in the number of stops, the operating speed increases, and the travel time between the start and end point decreases. In addition, it should be borne in mind that express intercity trains with a mandatory reservation must ensure the directness of travel, i.e., reduced number of stops along the route. In this research, the objective of this criterion is maximization as the reduced number of stops on express trains increases the directness and speed of travel.
W7—Low comfort. Travel comfort is expressed by ensuring the convenience of travelling in clean, renovated or renewed rolling stock. The values of this criterion are 0, 1 or 2; the higher the values the greater the comfort. The value of the criterion for A1is 0; for A2 is 1; and for A3 is 2, as increasing speed increases the stability of the journey. The objective under this criterion is maximization.
3.2.2. External to the Railway
Opportunities (O), with the following criteria:
O1—Possibility of a European Rail Traffic Management System (ERTMS) system. ERTMS is a new train signaling and traffic management system, created to assist interoperability by using a unique signaling and communication standard throughout Europe. There are three levels of the application of ERTMS. The new rolling stock and the reconstruction of railway infrastructure to increase the maximum speeds allow for the application of a higher level of ERTMS—level 2. Currently, the level on the main lines of the Bulgarian railway network is 1. This criterion may have the following values: 0 or 1. The objective of this criterion is maximization.
O2—Increase the speed of trains. Increasing speed depends on the quality and capabilities of the railway infrastructure. The values of this criterion are 0, 1 or 2. A high value indicates high speed. The new rolling stock allows for increased speed when there are no restrictions on the railway infrastructure. In this case, the value of the criterion is 1. When, in addition to renewed rolling stock, there is also a reconstruction of the railway infrastructure, the possibilities for high speeds increase significantly. The value of the criterion is 2 for alternative A3. The objective under this criterion is maximization.
O3—Opportunities for additional services. The values of this criterion are 0 or 1. The new rolling stock has equipment with modern information systems, and WI-FI networks on the trains. The objective under this criterion is maximization.
Threats (T), with the following criteria:
T1—Delayed purchase of rolling stock. This means a delay in the scheduled purchasing time due to financial and other reasons by the railway operator. The values of this criterion are 0 or 1. The value of 1 indicates a lack of purchase of rolling stock or delay in the purchase plan. The delayed purchase affects alternatives A2 and A3. Value 1 shows the implementation of the new rolling stock in operation on the planned routes in the railway network. Value 0 is set for the current situation (A1). The objective under this criterion is minimization.
T2—Increasing the quality of road infrastructure. Improving the condition of road infrastructure makes it possible to increase the speed of cars and buses in parallel routes to railway transport. The current situation indicates priority use of road transport. The possible values of this criterion are 0 or 1. Value 1 shows a preference for road operators. The attractiveness of railway transport services increases when it offers comfortable, high-speed and safe transport. Road infrastructure affects A1 and A2. In these cases, the railway infrastructure has to be competitive on parallel lines with road infrastructure. Alternative A3 is competitive on parallel lines with road infrastructure because the railway infrastructure was improved. The objective under this criterion is minimization.
T3—Increasing the speed of road transport. The increase in speed on motorways successfully competes with the low speeds on rail transport in the current situation. The values of this criterion are 0 or 1. The objective is minimization.
T4—Decline in traffic. The reduction of traffic may be due to various reasons such as pandemics, natural conditions and others. The reduction is not the same for different modes of transport. The value of the traffic reduction depends on the conditions offered by the carrier and the transport infrastructure. Passengers’ preferences for rail transport in pandemic conditions are reduced in favor of car travel. The values of this criterion are 0 or 1. It is equal to 0 when the reduction in traffic does not affect the position of railway transport on the transport market. The value of 1 applied otherwise. The objective here is minimization.
3.3. SIMUS Method Application and Selecting the Best Strategy
The SIMUS method is based on Linear Programming, Weighted Sum and Outranking [1,2,3]. This approach considered the criteria as objectives in Linear optimization models. The initial decision matrix is formed with alternatives in columns and criteria in rows, and the normalization of the matrix is performed. Then, the linear optimization models are formed taking each criterion as an objective, and the optimal scores for the alternatives are determined. These scores are placed in an Efficient Result Matrix (ERM). This matrix is considered to be a new decision matrix, composed of the optimal values. The SIMUS procedure applies two different multi-criteria procedures to rank the alternatives. The first is based on the Weighted Sum method and the second one uses an outranking approach forming a new matrix, called Project Dominance Matrix (PDM), that determines the best alternative. The results of both methods give the same ranking. This approach serves to validate the results. The SIMUS method also gives the marginal utilities for each criterion, and allows us to determine the robustness of the solution.
Once defined the alternatives and the corresponding criteria are defined, it is necessary to bear in mind that this MCDM analysis is not looking for optimality, because normally it does not exist in multi-criteria problems, but to reach a compromise solution, i.e., a balance between all demands established by the alternatives (strategies). The reason lies in the fact that normally criteria or objectives are sometimes opposite, and because the method is aimed at maximizing some, while minimizing others, as in the case of maximizing benefits, and at the same time minimizing costs, consequently, an intermediate solution needs to be found. This is a complex problem and there is a large array of mathematical methods to solve it. In this work, the SIMUS method was chosen among them, since it allows for modelling the scenario as close as possible, and this is of paramount importance because if the modelling is imperfect, incomplete or biased, the result or the selection of the best strategy is not reliable or credible.
4. Results and Discussion
This research includes the following technical limitations: infrastructure restrictions on the maximum permitted train speed; restrictions on the maximum number of trains on railway lines; limitations on the available number of rolling stock for train service; restrictions for implementation of the rehabilitation of the sections of the railway lines, according to the operational program transport. From the software point of view, there are no limitations. It can work with hundreds of alternatives and criteria.
4.1. Determination of the Initial Decision Matrix. Performing the SIMUS Procedure
Table 1 presents the initial decision matrix (in the case of the Bulgarian railway network) for the analysis and selection of a suitable policy for railway operators. It is formed with alternatives in columns and criteria in rows.
Alternative A1 presents the current situation and includes fast and accelerated fast passenger trains. The accelerated fast trains have mandatory seat reservations and serve major cities and transport nodes. The trains are composed of wagons. The average technical speed of movement of passenger trains is one of the lowest in Europe. At a design speed of 120–130 km/h, the movement of trains is achieved at 75–80 km/h, and in certain areas, it is limited to 40–60 km/h in order to ensure traffic safety [44]. A significant part of the rolling stock does not meet European standards regarding comfort and quality. The existing structure of trains by type could be improved through the implementation of new types of trains.
Alternative A2 offers three categories of trains—fast trains, accelerated fast trains and direct express trains. The direct express trains are intercity trains that have also mandatory seat reservations and serve major transport and administrative centres. They have a lower number of stops in comparison to accelerated fast trains. Express trains and accelerated fast trains in alternatives A2 and A3 are composed of novel EMUs. As Alternatives A2 and A3 include fewer stops the value of criterion W6 decreases. The number of trains for alternatives A2 and A3 increases due to the replacement of old rolling stock with new ones. The new electric multiple unit trains (EMU) are characterized by lower electricity consumption compared to trains composed of wagons and locomotives due to their lower mass. The inclusion in the scheme of transport of a new generation of trains leads to a reduction of electricity costs and, accordingly, of carbon dioxide emissions for the production of electricity by the power plants. The increase in electricity consumption for alternative A3 is due to the movement of trains with increased maximum speed 100–120 km in the direction Sofia–Plovdiv–Burgas (this is part of the core TEN-T network). The introduction of novel EMUs leads to a reduction of direct operating costs by 3.44% for A2, and upon completion of the rehabilitation of the railway infrastructure by 1.25% for A3 (Table 1—criterion S1).
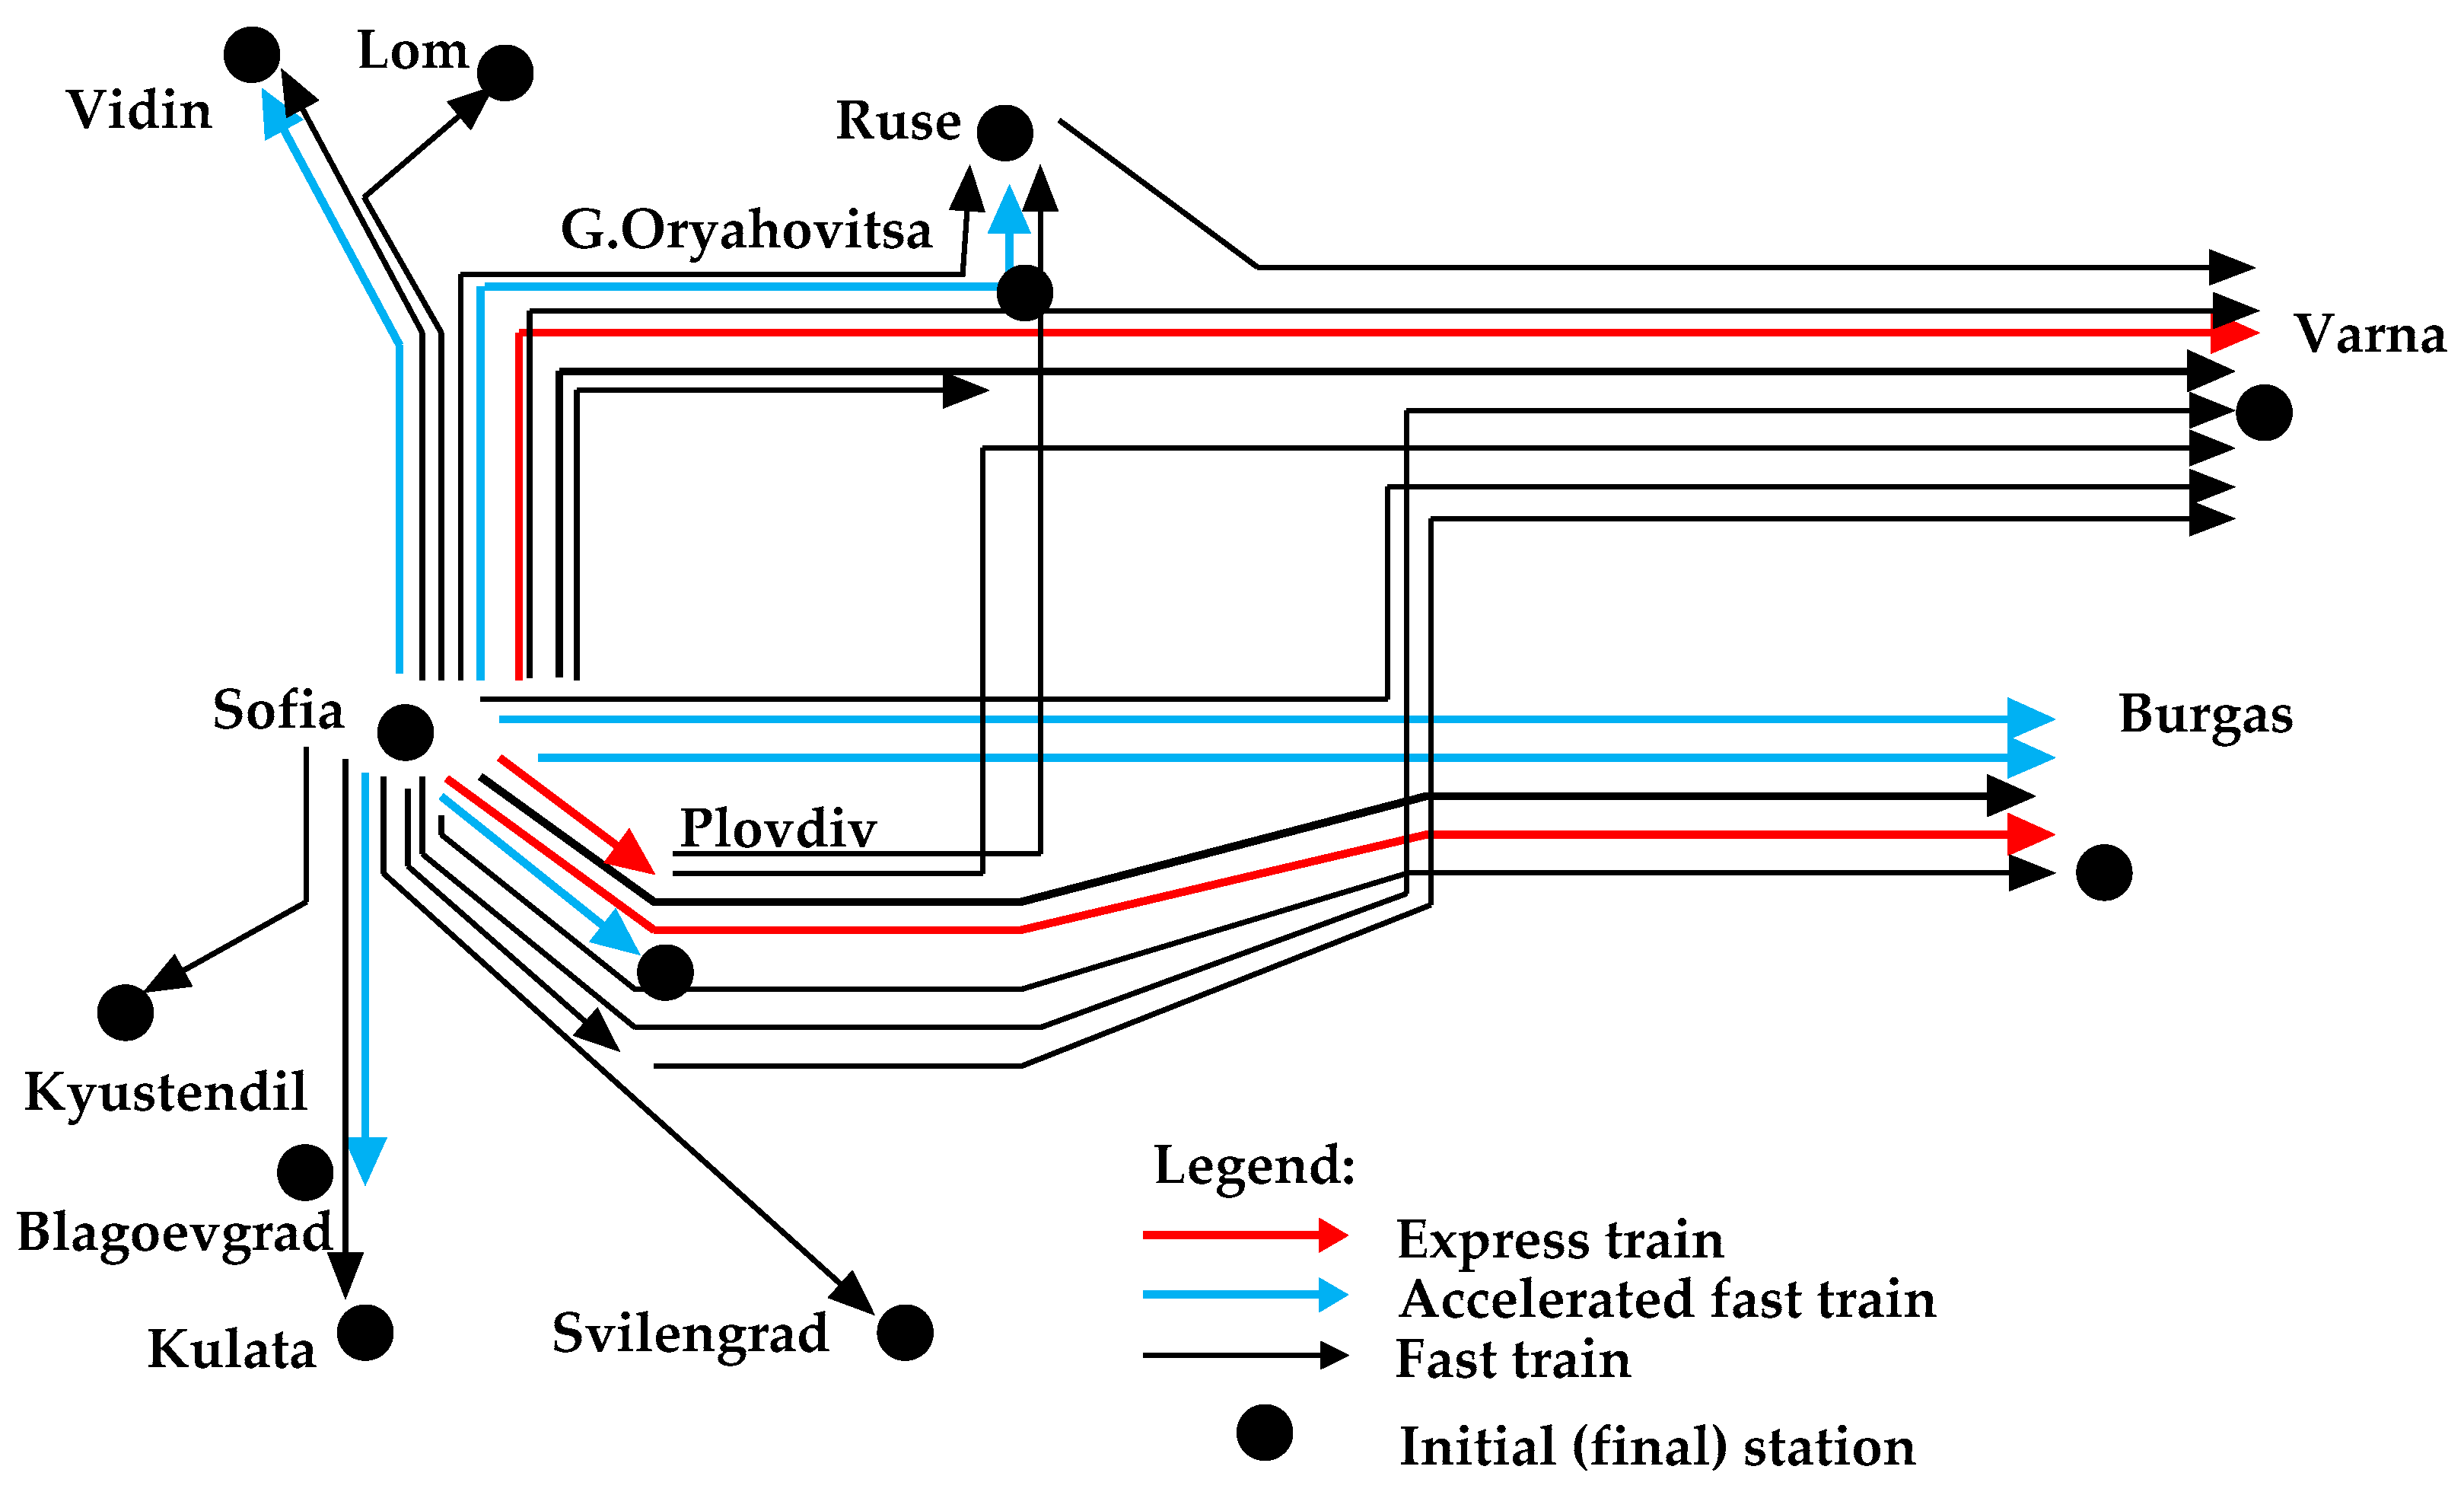
Figure 2 shows the scheme of the itineraries of the passenger trains in the Bulgarian railway network.
The values of criteria W5, O1, O3, T1–T4 are determined using scale 0, 1. The values of criteria S2, S3, W1, W7, O2 and O3 are determined using a scale of 0, 1, 2, 3.
The next step in the model is to form the normalized matrix. The normalization could be performed in different ways. This study uses the Sum of All Values method. Table 2 shows the normalized matrix, the type of actions for each criterion, the type of the operator for the restrictive conditions, the limits called “Right Hand Side” (RHS). The values of the RHS are obtained from the left normalized values and the type of action. In the case of minimum, RHS is equal to the minimum value of the row; in the case of maximum, the RHS value is equal to the maximum value of the row in the normalized matrix. The type of operator depends on the type of objective function. In the case of maximum, the operator is “≤”; in the case of minimum, the operator is “≥”.
The linear optimization models are performed by using the data in Table 2. For example, the first optimization linear model is formed for the first objective Z1(criterion S1) as follows:
where: represents the score of each alternative, .
The restrictive conditions for the optimization model are formed by using the others rows of the ERM matrix. For example, for criterion S2, the restrictive condition is:
The restrictive conditions are formed successively using all other rows in the Normalized Sum Matrix. The final restrictive condition for the first optimization model is performed by criterion T4 (objective Z17) based on the data in the last row in the Normalized Sum Matrix, as follows:
For all variables:
Similar optimization linear models are performed for all other criteria.
Table 3 shows the results of the linear optimization of each criterion. Each row represents the values of the scores of the alternatives according to the optimization models by applying each criterion as an objective function. The Efficient Results Matrix (ERM) is formed. The values of the objective functions for each linear model (LHS) are given in the last column of the table.
4.2. Preliminary Analysis
Table 4 shows a preliminary analysis and makes a comparison between the desired values for each objective for SWOT criteria, which are identified as RHS, and the optimum values of the objective functions obtained through SIMUS (LHS). The optimal values for the criteria must not be confused with the lack of optimal values for the strategies. When there is equality of the LHS and RHS, it means that the objective is satisfied 100%.
Comparing the LHS and RHS columns, it can be seen that a series of criteria coincide with the same series of objectives, regarding the mathematical symbol. For instance, S3, calling for maximization, and with an LHS value of 0.50, must be less than or equal (≤) to RHS with also a value of 0.50. Other criteria, such as W2 show, also for maximization, that LHS is less or equal than objective Z5. Another criterion such as W4, aimed for minimization, has an LHS value of 0.32, whilst it is lower than the RHS values by 0.33.
However, it is worth noting that there is also a series of criteria that shows no coincidence between LHS and RHS. While a coincidence indicates that the objective is 100% satisfied, the opposite, a lack of coincidence, shows that it is not satisfied, either in deficit or in excess. The last case appears to be contradictory, but it is not.
Assume that a criterion such as investment requires maximization, and whose LHS is greater than RHS which is the maximum amount of funding available. Consequently, this would indicate that the value of the objective surpasses the maximum amount of money available, and thus, making the objective not feasible. This is the case of W2 (frequency of trains), whose value is 0.42, and is thus larger than the objective which is 0.34. The meaning is that at present, there are more frequencies than those recommended by the software when this criterion is compared with others, with which it interacts in both ways. For criterion W6 (average number of stops), it is the opposite, since it aims for a minimum number of 0.33 and the computation shows 0.32. Remember that all these values are normalized and then correspond to integer values in the initial decision matrix. Consequently, the minimum desired number of stops determined by studies and surveys is not satisfied. It can be seen how this procedure allows for the identification of facts that perhaps were not considered at first sight, and that are also a consequence of the interaction of the criteria. For instance, it shows that there could be a link between higher frequency (W2) and operating costs (W4). Perhaps an analysis by stakeholders may show the necessity to decrease frequency, to save in operating costs. It can be seen how this procedure may pinpoint aspects that need to be examined.
Table 4 is prepared on the ERM, where each objective combines with its option, Max or Min, and LHS and RHS values. Out of the 17 objectives, there are 6 significant ones. They are objectives Z5, Z7, Z9, Z14, Z15, Z16 and are in bold.
Objective Z5 refers to the frequency of trains, which naturally must be maximum. Observe that the computed value or LHS (0.42) is greater than the maximum value established (0.34) in the original table. This means that the actual frequency is higher than expected, which is obviously something positive for passengers, but possibly not so good for railway finances, and possibly related to a strain on operating costs.
Objective Z7, operating costs, which naturally must be minimized, shows that the railway is spending a little less (0.32) than the desired (0.33). This could be related to the diminishing number of passengers or less funding available, or too high frequencies as objective 5 shows. It is interesting to have a look at what statistics say. The reference [45], shows a steady decline in the number of passengers, 2422 million passengers.km in 2006, to 1438 in 2017, with a slight recovery in 2018 and 2019 (1524 million passengers.km). That is, these statistics may confirm the lower expenditure shown in operating costs in Table 1 due to a lower number of passengers transported. As a matter of fact, and from the financial point of view, [46] shows a set of five financial indicators as IRR and NPV for investment in seven railway projects; four of them show negative returns, while IRR for capital, is the only one that shows a maximum value of 0.03. This lack of investment incentive may lead to not enough funding to have a reasonable operating cost level.
For objective Z9 (Average number of stops), interpreting the numbers from the table we find that apparently the minimum number of stops is not reached. This can be interpreted as positive or negative. Positive—as it means lower operating costs and increasing speed. Negative—as it may produce a reduction in the number of passengers.
For objective Z14 (Delayed purchase of rolling stock), it shows that RHS = 0; it then suggests that no long-term plans are in study to renovate the equipment, however, the computed value of 0.50 suggests that this must be considered as very important and in a high value. This is confirmed by the study in [47] which says, about Bulgaria, that more than 75% of all transport funding should be allocated for: 1—Public urban transport system; 2—Integrated regional and suburban public transport systems 3—Railways (infrastructure and passenger rolling stock), 4—Intermodal infrastructure for shifting freight from road to rail, 5—Bicycle lanes and paths, and 6—Traffic management systems. We believe that for the development of the sustainable transport system in the country and for reversing the current dangerous trends of the predominant use of road transport there is a need for a new approach in transport investment.
For objective Z15 (Increasing Road quality), Bulgaria has about 20,000 km of paved routes, which seems very high in a country of 7,300,000 inhabitants with only one major city—Sofia, with about 1,300,000 people, and several low medium-size cities of about 350,000 inhabitants each. The territory of Bulgaria is not very large; it is about 111,000 km2 and ranks in 16th place among 51 European countries. This fact means that its density is 266 people/km2, which is low, and decreasing. Thus, it would be worth examining the occupancy rate of the wagons which is linked with criterion W1 in the transportation market, and W4, operating cost. This objective is ambitious, and speaks very well of the road infrastructure whose value of 0.50 is higher than the RHS value of 0 (or no plans). Nevertheless, railways have the advantage of the larger quantity of passengers and freight they can transport in comparison with busses, from the point of view of weight (and thus road conservation), passengers’ comfort, fuel consumption and contamination.
Objective Z16 (Increasing speed of road transportation), with a value greater than RHS, suggests the advantage of the road system.
Objective Z17 (Decline in traffic), shows no plans since RHS = 0, and then that whatever plan comes is OK.
The results show that the areas that must be improved are related to service (speed, number of stops, travel time, directness, costs, etc.) as well as those areas where it is necessary to work together with the country road development program, due to the competition between the two systems in those zones where the road and the rails run in parallel. The case is interesting since Bulgaria has some highways with a maximum speed of 140 km/h, while new rolling stock can reach 160 km/h.
4.3. Determination of the Weights of Criteria
The SIMIUS method does not use the weights of criteria for ranking the alternatives. This method is based on Linear Programming (LP) and the use of the Simplex algorithm. Linear Programming does not use any type of weights, and for that reason, they are not needed in the SIMUS method. LP works following an iterative process until it finds the optimal solution (if it exists). LP uses a vector procedure to establish a ranking between criteria, and thus, for each iteration, every criterion gets a new significance. In this way, the criteria significance is dependent on the set of alternatives to evaluate. It is a similar concept to using Shannon entropy, to evaluate criteria weights. There is no subjectivity here, everything is objective, and then, it does not matter who or how many decision-makers intervene. The result is always the same, and based on the initial data.
In this study, the Efficient Results Matrix (ERM) is used to determine the weights of criteria with the aim to assess the impact of the SWOT criteria. For this purpose, the maximum of each row is determined. Table 5 presents the weights of the criteria for the SWOT group determined by the proposed approach.
The global weights are calculated by dividing these values by the sum of the maximum of the rows. Then, the weights of the SWOT groups are calculated. The results from the different SWOT clusters clearly show that weaknesses and threats are prevalent in the Bulgarian rail network. Both SWOT factors show sharp quantitative differences with their counterparts, i.e., strength and opportunities, both with the same importance or weight of 0.180, as shown in Table 5. However, this is also significant since it shows that both favorable conditions exist in the network. Consequently, there is room for improvement. If the criteria are considered, it can be seen that the weights in Table 5 are all practically the same, about 0.060, and therefore, no discrimination by importance is possible. However, observe that it is shown that although clusters Weakness and Threats are dominant, their criteria have the same weights as those of Opportunities and Strength.
4.4. Ranking of the Alternatives
The SIMUS algorithm produces an efficient matrix, where each of its rows is a Pareto Efficient solution, and thus, optimal. From this matrix, which is a mapping of the original matrix, SIMUS obtains two results. The first, following the Weighted sum procedure, and the second, based on Outranking. Both results coincide in their rankings, and then they mutually check their results.
The results obtained in the Efficient Results Matrix are applied to start the procedure of ranking the alternatives. The normalization sum method was applied to the Efficient Results Matrix. The results of the normalization are given in the first part of Table 6. The second part presents the steps in obtaining the ranking. First, the sum of the column is determined. Then, the participation factors, which indicate the number of satisfactions of each alternative by each objective, are determined. The normalization of the participation factor is carried out by dividing the number of criteria. The final score of the alternatives is calculated by multiplying the sum of the columns by the normalized participation factor.
As can be seen, the best strategy is A3 (some reconstruction of railway infrastructures and new rolling stock on some lines), with the highest score of 3.76, followed by A2 (new rolling stock on some lines), with a score of 2.71. Note that the status-quo strategy has a very low score of 0.43, and then, should be discarded, which is in line with stakeholders’ opinion.
The SIMUS Method uses the outranking approach to validate the results obtained using ERM ranking. Table 7 presents the results of the outranking approach where a new matrix is formed, called Project Dominance Matrix (PDM), that determines the best alternative. The number of columns and the rows in PDM is equal to the number of alternatives. The data of the ERM matrix are used. Starting from the highest value in the first row the difference between values in the same row of normalized ERM is calculated. The procedure is repeated with all the values. The net dominance is calculated as the difference between row sum and column sum. The alternatives are ranked according to the maximal value of the net dominance. It can be seen that the ranking formed using both procedures is the same.
5. Conclusions
This paper proposes a methodology for the assessment of the policies of a railway operator using SWOT criteria and the SIMUS method. The difference between this study and related research is in the elaborated approach where the SWOT criteria are presented as objectives and the ranking of the alternatives of strategic planning is conducted without the use of subjective expert evaluation.
This is a novel procedure but the important thing is that using SWOT factors the result, obtained through the SIMUS method, incorporates something valuable—the analysis of the current situation.
A methodology was suggested and applied to an actual case, and results obtained are discussed to demonstrate that the procedure is able to determine the most convenient strategy, but perhaps more importantly, to point out and quantify the strong and weak points of the Bulgarian railway network, and determine the effects that one SWOT subfactor may have on the others.
The results can be summarized as follows:
- (1)
- The best strategy is A3 (some reconstruction of the railway infrastructures and new rolling stock on some lines), with the highest score of 3.76, followed by A2 (new rolling stock on some lines), with a score of 2.71. The status-quo strategy has a very low score of 0.43, and then, should be discarded, which is in line with stakeholders’ opinion.
- (2)
- The results of the selection of the best alternative clearly show that the current situation or status-quo cannot be supported; it needs improvement and suggests on what sectors. This conclusion is really important since it confirms something that most railway and research people already know. It is evident that a scenario like the operation of railways is a very complex undertaking, where different factors are combined to produce several and differentiated effects. This procedure allows for a quantitative general evaluation of this complicated scenario.
- (3)
- The results from the different clusters clearly show that weaknesses (0.4) and threats (0.24) are prevalent in the Bulgarian rail network. Both SWOT factors show sharp quantitative differences with their counterpart, i.e., strengths and opportunities, both with the same importance or weight of 0.180. However, this is also significant since it shows that both favorable conditions exist in the network. Consequently, there is room for improvement.
- (4)
- If the criteria in the SWOT groups are considered, the results show that the weights are all practically the same, about 0.06, and therefore, no discrimination by importance is possible. However, it is worth noting that although clusters Weaknesses and Threats are dominant, their subfactors have the same weights as those of Opportunities and Strengths.
The main contribution and advantages of this procedure are as follows: (1) All alternatives are independent, and therefore, their respective results are not linked, and thus they are enclosed in their own areas. (2) The advantage of this procedure, using the Linear programming method and the SIMUS method, is that the results are found to link the four SWOT factors. (3) This real-life case makes it possible to consider the three strategies simultaneously, and thus, the results incorporate the influences of one criterion or factor on all others, and allows for quantification of the differences between the expected and real results.
This study is useful because it gives railway stakeholders concise, objective and unbiased information to enable them to take decisions. In addition, it makes it possible to determine the strength, sensitivity-wise, of the best solution found. The results presented in this paper could be useful for railway operators to identify the strong and weak points of the Bulgarian railway network, to determine the effects that one SWOT subfactor may have on the other, to determine the areas that must be improved, and to analyse whether the current situation is appropriate or needs to be improved. The results presented are also useful for the stakeholders, since they give not only values related to the best selection of the alternative, but also because each of them can be justified. These results may help stakeholders in obtaining international funding and credits for railway improvement.
For further research, the proposed procedure could be extended with other strategic analysis techniques to assess the policies for railway operators. The criteria for assessment of the transport policy could be specified and expanded according to the studied areas.
Author Contributions
Conceptualization, S.S.; methodology, S.S.; literature review, S.S.; validation, S.S., formal analysis, S.S. and N.M.; data curation, S.S.; investigation, S.S. and N.M.; writing—original draft preparation, S.S.; writing—review and editing, S.S. and N.M. All authors have read and agreed to the published version of the manuscript.
Funding
This work was supported by the National Science Fund of the Ministry of Education and Science of Bulgaria [project number No.KP-06-H27/12 of 11.12.2018 “Modelling and elaboration of complex system for selection of transport technology in transport network”].
Institutional Review Board Statement
Not applicable.
Informed Consent Statement
Not applicable.
Data Availability Statement
Data is contained within the article.
Conflicts of Interest
The authors declare no conflict of interest.
References
- Munier, N. A Strategy for Using Multi-Criteria Analysis in Decision-Making; Springer: Berlin/Heidelberg, Germany, 2011. [Google Scholar] [CrossRef]
- Munier, N. A new approach to the rank reversal phenomenon in MSDM with the SIMUS method. Mult. Criteria Decis. Mak. 2016, 11, 137–152. [Google Scholar] [CrossRef]
- Munier, N.; Hontoria, E.; Jimenez-Saez, F. Strategic Approach in Multi-Criteria Decision Making. A Practical Guide for Complex Scenarios; Springer Nature: Cham, Switzerland, 2019. [Google Scholar] [CrossRef]
- Benzaghta, M.A.; Elwalda, A.; Mousa, M.M.; Erkan, I.; Rahman, M. SWOT analysis applications: An integrative literature review. J. Glob. Bus. Insights 2021, 6, 55–73. [Google Scholar] [CrossRef]
- Ploywarin, S.; Song, Y. Analysis and development strategy of freight transportation market of Thailand railway network. In Proceedings of the 2016 International Conference on Management Science & Engineering, Olten, Switzerland, 18–20 August 2016; pp. 401–406. [Google Scholar]
- Ma, H. SWOT Analysis on China’s High-speed Rail to the Overseas. In Proceedings of the International Conference on Logistics Engineering, Management and Computer Science (LEMCS 2015), Shenyang, China, 29–31 July 2015; pp. 1259–1265. [Google Scholar]
- Makarova, I.; Shubenkova, K.; Gabsalikhova, L. Analysis of the city transport system’s development strategy design principles with account of risks and specific features of spatial development. Transp. Probl. 2017, 12, 125–138. [Google Scholar] [CrossRef] [Green Version]
- Comino, E.; Ferretti, V. Indicators-based spatial SWOT analysis: Supporting the strategic planning and management of complex territorial systems. Ecol. Indic. 2016, 60, 1104–1117. [Google Scholar] [CrossRef] [Green Version]
- Ahi, M.; Yildiz, K. Determining performance criteria of railway market: A case study. J. Open Innov. Technol. Mark. Complex. 2018, 4, 6. [Google Scholar] [CrossRef] [Green Version]
- Zhikang, L. Research on Development Strategy of Automobile Reverse. Logistics Based on SWOT Analysis. Procedia Eng. 2017, 174, 324–330. [Google Scholar] [CrossRef]
- Cui, J.; Allan, A.; Lin, D. SWOT analysis and development strategies for underground pedestrian Systems. Tunn. Undergr. Space Technol. 2019, 87, 127–133. [Google Scholar] [CrossRef]
- Mallik, S.; Rudra, S.; Samanta, R. Sustainable ecotourism development using SWOT and QSPM approach. A study on Rameswaram, Tamil Nadu. Int. J. Geoheritage Rarks 2020, 8, 185–193. [Google Scholar] [CrossRef]
- Pazouki, M.; Jozi, S.A.; Ziari, Y.A. Strategic management in urban environment using SWOT and QSPM model. Glob. J. Environ. Sci. Manag. 2017, 3, 207–216. [Google Scholar]
- Bouraima, M.; Qiu, Y.; Yusupov, B.; Ndjegwes, C. Study on the development strategy of the railway transportation system in the West African Economic and Monetary Union (WAEMU) based on the SWOT/AHP technique. Sci. Afr. 2020, 8, e00388. [Google Scholar] [CrossRef]
- Amin, S.H.; Yan, N.; Morris, D. Analysis of Transportation Modes by Evaluating SWOT Factors and Pairwise Comparisons: A Case Study. Multi-Criteria Methods Tech. Appl. Supply Chain Manag. 2018, 57. [Google Scholar] [CrossRef] [Green Version]
- Wang, X.P.; Zhang, J.; Yang, T. Hybrid SWOT Approach for Strategic Planning and Formulation in China Worldwide Express Mail Service. J. Appl. Res. Technol. 2014, 12, 230–238. [Google Scholar] [CrossRef] [Green Version]
- Bartuskova, T.; Kresta, A. Application of AHP method in external strategic analysis of the selected organization. Procedia Econ. Financ. 2015, 30, 146–154. [Google Scholar] [CrossRef] [Green Version]
- Xia, Z.; Yu, Z.; Pan, X.; Chen, F.; Zhang, N. Analysis of Long-Distance Passenger Transportation Based on a Highway Network Using the SWOT-AHP Method. ICTE 2015, 2778–2786. [Google Scholar] [CrossRef]
- Wang, X.; Wu, P.; Huang, T. Analysis of Logistic Strategy based on SWOT and AHP Methods. In Proceedings of the 2nd International Symposium on Mechanical Engineering and Material Science (ISMEMS 2017), Suzhou, China, 17–19 November 2017; Volume 134, pp. 70–74. [Google Scholar]
- Mobaraki, O. Strategic planning and urban development by using the SWOT analysis. The case of Urmia city. Rom. Rev. Reg. Stud. 2014, 10, 47–54. [Google Scholar]
- Ozdemir, Y.; Demirel, T. Prioritization of Tourism Strategies in Turkey Using a SWOT-AHP Analysis. Int. J. Bus. Ind. Mark. 2018, 3, 34–45. Available online: http://www.aascit.org/journal/ijbim (accessed on 11 May 2021).
- Wang, X.; Li, C.; Shang, J.; Yang, C.; Zhang, B.; Ke, X. Strategic Choices of China’s New Energy Vehicle Industry: An Analysis Based on ANP and SWOT. Energies 2017, 10, 537. [Google Scholar] [CrossRef] [Green Version]
- Genc, T.; Kabak, M.; Özceylan, E.; Cetinkaya, C. Evaluation of natural gas strategies of Turkey in East Mediterranean Region: A strengths-weaknesses-opportunities-threats and analytic network process approach. Technol. Econ. Dev. Econ. 2018, 24, 1041–1062. [Google Scholar] [CrossRef] [Green Version]
- Chaghooshi, A.J.; Rahmani, M.; Zarchi, M.K. Formulation and Prioritization of Strategies in Tile and Ceramic Industry: A Case Study New York. Sci. J. 2012, 5, 79–87. [Google Scholar]
- Azimi, R.; Chamzini, A.J.; Fooladgar, M.; Basir, M.H. Evaluating the strategies of the Iranian mining sector using a integrated model. Int. J. Manag. Sci. Eng. Manag. 2011, 6, 459–466. [Google Scholar] [CrossRef]
- Basset, M.A.; Mohamed, M.; Smarandache, F. An Extension of Neutrosophic AHP-SWOT Analysis for Strategic Planning and Decision-Making. Symmetry 2018, 10, 116. [Google Scholar] [CrossRef] [Green Version]
- Tavana, M.; Zareinejad, M.; Di Caprio, M.; Kavia, M.A. An integrated intuitionistic fuzzy AHP and SWOT method foroutsourcing reverse logistics. Appl. Soft Comput. 2016, 40, 544–557. [Google Scholar] [CrossRef]
- Singh, S.P.; Singh, P. An Integrated AFS-Based SWOT Analysis Approach for Evaluation of Strategies Under MCDM Environment. J. Oper. Strateg. Plan. 2018, 1, 1–19. [Google Scholar] [CrossRef]
- Wadjdi, A.F.; Firdaus, Y. Hybrid framework of decision making in military: Case study of railway planning. IOP Conf. Ser. Earth Environ. Sci. 2018, 195, 012006. [Google Scholar] [CrossRef]
- Papapostolou, A.; Karakosta, C.; Apostolidis, G.; Doukas, H. An AHP-SWOT-Fuzzy TOPSIS Approach for Achieving Cross-Border RES Cooperation. Sustainability 2020, 12, 2886. [Google Scholar] [CrossRef] [Green Version]
- Zare, K.; Tekmeh, J.M.; Karimi, S. A SWOT framework for analyzing the electricity supply chain using an integrated AHP methodology combined with fuzzy-TOPSIS. Int. Strateg. Manag. Rev. 2015, 3, 66–80. [Google Scholar] [CrossRef] [Green Version]
- Milenkovi, M.; Glavi, D.; Mladenovi, M. Decision-Support Framework for Selecting the Optimal Road Toll Collection System. J. Adv. Transp. 2018, 2018, 4949565. [Google Scholar] [CrossRef]
- Hatefi, S.M. Strategic planning of urban transportation system based on sustainable development dimensions using an integrated SWOT and fuzzy COPRAS approach. Glob. J. Environ. Sci. Manag. 2018, 4, 99–112. [Google Scholar] [CrossRef]
- Đalić, I.; Ateljević, J.; Stević, Z.; Terzić, S. An integrated SWOT—FUZZY PIPRECIA model for analysis of competitiveness in order to improve logistics performances. Facta Univ. Ser. Mech. Eng. 2020, 18, 439–451. [Google Scholar] [CrossRef]
- Akhavan, P.; Barak, S.; Maghsoudlou, H.; Antuchevičienė, J. FQSPM-SWOT for strategic alliance planning and partner selection; case study in a holding car manufacturer company. Technol. Econ. Dev. Econ. 2015, 21, 165–185. [Google Scholar] [CrossRef] [Green Version]
- Büyükozkan, G.; Mukul, E.; Kongar, E. Health tourism strategy selection via SWOT analysis and integrated hesitant fuzzy linguistic AHP-MABAC approach. Socio Econ. Plan. Sci. 2021, 74, 100929. [Google Scholar] [CrossRef]
- Amin, S.H.; Razmi, J.; Zhang, G. Supplier selection and order allocation based on fuzzy SWOT analysis and fuzzy linear programming. Expert Syst. Appl. 2011, 38, 334–342. [Google Scholar] [CrossRef]
- Ghorbani, M.; Bahrami, M.; Arabzad, M.M. An Integrated Model For Supplier Selection and Order Allocation, Using Shannon Entropy, SWOT and Linear Programming, International Conference on Leadership, Technology and Innovation Management. Procedia Soc. Behav. Sci. 2012, 41, 521–527. [Google Scholar] [CrossRef] [Green Version]
- Christodoulou, A.; Cullinane, K. Identifying the Main Opportunities and Challenges from the Implementation of a Port Energy Management System: A SWOT/PESTLE Analysis. Sustainability 2019, 11, 6046. [Google Scholar] [CrossRef] [Green Version]
- Petrauskiene, K.; Dvarioniene, J.; Kaveckis, G.; Kliaugaite, D.; Chenadec, J.; Hehn, L.; Pérez, B.; Bordi, C.; Scavino, G.; Vignoli, A.; et al. Situation Analysis of Policies for Electric Mobility Development: Experience from Five European Regions. Sustainability 2020, 12, 2935. [Google Scholar] [CrossRef] [Green Version]
- Kordana, S.; Pochwat, K.; Słýs, D.; Starzec, M. Opportunities and Threats of Implementing Drain Water Heat Recovery Units in Poland. Resources 2019, 8, 88. [Google Scholar] [CrossRef] [Green Version]
- Operational Programme on Transport and Transport Infrastructure in Bulgaria 2014–2020. Available online: http://www.optransport.bg/en/index.php (accessed on 11 May 2021).
- Stoilova, S. Methodology for Multi-criteria Selection of Transportation Technology in Transport Network. Modelling of the Interaction of the Different Vehicles and Various Transport Modes. Lecture Notes in Intelligent Transportation and Infrastructure; Sładkowski, A., Ed.; Springer: Cham, Switzerland, 2020; pp. 1–103. [Google Scholar] [CrossRef]
- Integrated Transport Strategy for the Period Until 2030. Ministry of Transport, Information Technology and Communications. Bulgaria. 2017. Available online: https://www.mtitc.government.bg/sites/default/files/integrated_transport_strategy_2030_eng.pdf (accessed on 11 May 2021).
- Statista. Passenger Rail Transport in Bulgaria 2006–2019. 2021. Available online: www.statista.com/statistics/436986/passengers-transported-by-rail-in-bulgaria-in-million-passenger-kilometres/Statista (accessed on 11 May 2021).
- Jelesov, E. Ex-Ante Comparative Analysis of Cost and Benefits of Essential Railway Infrastructure Projects in Bulgaria. 17 Medzinárodná Vedecká Konferencia Riešenie Krízových Situácií v Špecifickom Prostredí, Fakulta Špeciálneho Inžinierstva, ŽU, Žilina, 30–31. maj 2012. Available online: http://fbiw.uniza.sk/rks/2012/articles/clanky/ZZA_jelezov.pdf (accessed on 11 May 2021).
- NGO Comments on Bulgarian Operational Program Transport and the List of Transport Priority Projects for the Period 2007–2013. Available online: https://bankwatch.org/wp-content/uploads/2007/03/comments_on_TOP_en_March_2007_final.pdf (accessed on 11 May 2021).
Figure 1.
Scheme of the methodology.

Figure 2.
Scheme of the itineraries of the passenger trains.


Table 1.
Initial Decision Matrix.
| Criteria | Alternatives | ||
|---|---|---|---|
| A1 | A2 | A3 | |
| S1 | 28,370.00 | 23,511.00 | 25,225.00 |
| S2 | 1.00 | 2.00 | 2.00 |
| S3 | 1.00 | 2.00 | 3.00 |
| W1 | 1.00 | 2.00 | 3.00 |
| W2 | 37.00 | 38.00 | 38.00 |
| W3 | 63.00 | 64.00 | 80.00 |
| W4 | 52,615.00 | 50,807.00 | 51,957.00 |
| W5 | 0.00 | 1.00 | 1.00 |
| W6 | 16.19 | 15.45 | 15.45 |
| W7 | 0.00 | 1.00 | 2.00 |
| O1 | 0.00 | 1.00 | 1.00 |
| O2 | 0.00 | 1.00 | 2.00 |
| O3 | 0.00 | 1.00 | 1.00 |
| T1 | 0.00 | 1.00 | 1.00 |
| T2 | 1.00 | 1.00 | 0.00 |
| T3 | 1.00 | 1.00 | 0.00 |
| T4 | 1.00 | 0.00 | 0.00 |
Table 2.
Normalized Sum Matrix.
| Criterion | Objective | Alternatives | Action | Operator | RHS | ||
|---|---|---|---|---|---|---|---|
| A1 | A2 | A3 | |||||
| S1 | Z1 | 0.37 | 0.30 | 0.33 | Min | ≥ | 0.30 |
| S2 | Z2 | 0.20 | 0.40 | 0.40 | Max | ≤ | 0.40 |
| S3 | Z3 | 0.17 | 0.33 | 0.50 | Max | ≤ | 0.50 |
| W1 | Z4 | 0.17 | 0.33 | 0.50 | Max | ≤ | 0.50 |
| W2 | Z5 | 0.33 | 0.34 | 0.34 | Max | ≤ | 0.34 |
| W3 | Z6 | 0.30 | 0.31 | 0.39 | Max | ≤ | 0.39 |
| W4 | Z7 | 0.34 | 0.33 | 0.33 | Min | ≥ | 0.33 |
| W5 | Z8 | 0.00 | 0.50 | 0.50 | Max | ≤ | 0.50 |
| W6 | Z9 | 0.34 | 0.33 | 0.33 | Min | ≥ | 0.33 |
| W7 | Z10 | 0.00 | 0.33 | 0.67 | Max | ≤ | 0.67 |
| O1 | Z11 | 0.00 | 0.50 | 0.50 | Max | ≤ | 0.50 |
| O2 | Z12 | 0.00 | 0.33 | 0.67 | Max | ≤ | 0.67 |
| O3 | Z13 | 0.00 | 0.50 | 0.50 | Max | ≤ | 0.50 |
| T1 | Z14 | 0.00 | 0.50 | 0.50 | Min | ≥ | 0.00 |
| T2 | Z15 | 0.50 | 0.50 | 0.00 | Min | ≥ | 0.00 |
| T3 | Z16 | 0.50 | 0.50 | 0.00 | Min | ≥ | 0.00 |
| T4 | Z17 | 1.00 | 0.00 | 0.00 | Min | ≥ | 0.00 |
Table 3.
Efficient Results Matrix (ERM).
| Criterion | Objective | Alternatives | Objective Function Value (LHS) | ||
|---|---|---|---|---|---|
| A1 | A2 | A3 | |||
| S1 | Z1 | 0.00 | 0.00 | 0.00 | 0.30 |
| S2 | Z2 | 0.00 | 0.00 | 0.00 | 0.40 |
| S3 | Z3 | 0.00 | 0.00 | 1.00 | 0.50 |
| W1 | Z4 | 0.00 | 0.00 | 1.00 | 0.50 |
| W2 | Z5 | 0.52 | 0.00 | 0.00 | 0.42 |
| W3 | Z6 | 0.00 | 0.00 | 1.00 | 0.39 |
| W4 | Z7 | 0.95 | 0.00 | 0.00 | 0.32 |
| W5 | Z8 | 0.00 | 1.00 | 0.00 | 0.50 |
| W6 | Z9 | 0.00 | 0.00 | 0.98 | 0.32 |
| W7 | Z10 | 0.00 | 0.00 | 1.00 | 0.67 |
| O1 | Z11 | 0.00 | 0.00 | 0.00 | 0.50 |
| O2 | Z12 | 0.00 | 0.00 | 1.00 | 0.67 |
| O3 | Z13 | 0.00 | 1.00 | 0.00 | 0.50 |
| T1 | Z14 | 0.97 | 0.00 | 0.00 | 0.00 |
| T2 | Z15 | 0.00 | 0.00 | 1.00 | 0.00 |
| T3 | Z16 | 0.00 | 0.00 | 1.00 | 0.00 |
| T4 | Z17 | 0.00 | 1.00 | 0.00 | 0.00 |
Table 4.
Preliminary analysis.
| Criterion | Objective | Option | LHS | RHS | Objective Satisfied? | Comment |
|---|---|---|---|---|---|---|
| S1 | Z1 | Min | 0.30 | 0.30 | Yes | The objective is satisfied 100% |
| S2 | Z2 | Max | 0.40 | 0.40 | Yes | The objective is satisfied 100% |
| S3 | Z3 | Max | 0.50 | 0.50 | Yes | The objective is satisfied 100% |
| W1 | Z4 | Max | 0.50 | 0.50 | Yes | The objective is satisfied 100% |
| W2 | Z5 | Max | 0.42 | 0.34 | No | The maximum value found is greater than the established value |
| W3 | Z6 | Max | 0.39 | 0.39 | Yes | The objective is satisfied 100% |
| W4 | Z7 | Min | 0.32 | 0.33 | No | The minimum value found is lower that the established one |
| W5 | Z8 | Max | 0.50 | 0.50 | Yes | The objective is satisfied 100% |
| W6 | Z9 | min | 0.32 | 0.33 | No | The minimum value found is lower than the minimum established |
| W7 | Z10 | Max | 0.67 | 0.67 | Yes | The objective is satisfied 100% |
| O1 | Z11 | Max | 0.50 | 0.50 | Yes | The objective is satisfied 100% |
| O2 | Z12 | Max | 0.67 | 0.67 | Yes | The objective is satisfied 100% |
| O3 | Z13 | Max | 0.50 | 0.50 | Yes | The objective is satisfied 100% |
| T1 | Z14 | Min | 0 | 0 | Yes | Purchasing of rolling stock does not show any advance |
| T2 | Z15 | Min | 0.50 | 0 | Yes | The minimum value found is greater than the minimum established |
| T3 | Z16 | Min | 0.48 | 0 | Yes | The minimum value found is greater than established |
| T4 | Z17 | Min | 0 | 0 | Yes | No variation |
In bold are very important objectives.
Table 5.
Weights of objectives using the SIMUS method.
| SWOT | Criteria | Alternatives | Max of the Row | Normalized Value | Weights SWOT | ||
|---|---|---|---|---|---|---|---|
| A1 | A2 | A3 | |||||
| S | S1 | 0.00 | 1.00 | 0.00 | 1.00 | 0.060 | |
| S2 | 0.00 | 1.00 | 0.00 | 1.00 | 0.060 | ||
| S3 | 0.00 | 0.00 | 1.00 | 1.00 | 0.060 | 0.180 | |
| W | W1 | 0.00 | 0.00 | 1.00 | 1.00 | 0.060 | 0.401 |
| W2 | 0.52 | 0.74 | 0.00 | 0.74 | 0.045 | ||
| W3 | 0.00 | 0.00 | 1.00 | 1.00 | 0.060 | ||
| W4 | 0.95 | 0.00 | 0.00 | 0.95 | 0.057 | ||
| W5 | 0.00 | 1.00 | 0.00 | 1.00 | 0.060 | ||
| W6 | 0.00 | 0.00 | 0.98 | 0.98 | 0.059 | ||
| W7 | 0.00 | 0.00 | 1.00 | 1.00 | 0.060 | ||
| O | O1 | 0.00 | 1.00 | 0.00 | 1.00 | 0.060 | 0.180 |
| O2 | 0.00 | 0.00 | 1.00 | 1.00 | 0.060 | ||
| O3 | 0.00 | 1.00 | 0.00 | 1.00 | 0.060 | ||
| W | T1 | 0.97 | 0.00 | 0.00 | 0.97 | 0.058 | 0.238 |
| T2 | 0.00 | 0.00 | 1.00 | 1.00 | 0.060 | ||
| T3 | 0.00 | 0.00 | 1.00 | 1.00 | 0.060 | ||
| T4 | 0.00 | 1.00 | 0.00 | 1.00 | 0.060 | ||
| Total | 16.64 | 1.000 | 1.000 | ||||
Table 6.
Normalized Efficient Results Matrix.
| Criterion | Objective | Alternatives | ||
|---|---|---|---|---|
| A1 | A2 | A3 | ||
| S1 | Z1 | 0.00 | 1.00 | 0.00 |
| S2 | Z2 | 0.00 | 1.00 | 0.00 |
| S3 | Z3 | 0.00 | 0.00 | 1.00 |
| W1 | Z4 | 0.00 | 0.00 | 1.00 |
| W2 | Z5 | 0.41 | 0.59 | 0.00 |
| W3 | Z6 | 0.00 | 0.00 | 1.00 |
| W4 | Z7 | 1.00 | 0.00 | 0.00 |
| W5 | Z8 | 0.00 | 1.00 | 0.00 |
| W6 | Z9 | 0.00 | 0.00 | 1.00 |
| W7 | Z10 | 0.00 | 0.00 | 1.00 |
| O1 | Z11 | 0.00 | 1.00 | 0.00 |
| O2 | Z12 | 0.00 | 0.00 | 1.00 |
| O3 | Z13 | 0.00 | 1.00 | 0.00 |
| T1 | Z14 | 1.00 | 0.00 | 0.00 |
| T2 | Z15 | 0.00 | 0.00 | 1.00 |
| T3 | Z16 | 0.00 | 0.00 | 1.00 |
| T4 | Z17 | 0.00 | 1.00 | 0.00 |
| Sum of Column (SC) | 2.41 | 6.59 | 8 | |
| Participation Factor (PF) | 3 | 7 | 8 | |
| Norm. Participation Factor (NPF) | 0.18 | 0.41 | 0.47 | |
| Final Result (SC × PF) | 0.43 | 2.71 | 3.76 | |
| ERM Ranking | A3–A2–A1 | |||
Table 7.
Project Dominance Matrix (PDM) Subordinated projects—alternatives—options.
| Dominant Alternatives | A1 | A2 | A3 | Row Sum | Net Dominance |
|---|---|---|---|---|---|
| A1 | - | 2.0 | 2.4 | 4.4 | −9.8 |
| A2 | 6.2 | - | 6.6 | 12.8 | 2.8 |
| A3 | 8.0 | 8.0 | - | 16.0 | 7.0 |
| Column sum | 14.2 | 10.0 | 9.0 | - | - |
| PDM Ranking | A3–A2–A1 | ||||
Publisher’s Note: MDPI stays neutral with regard to jurisdictional claims in published maps and institutional affiliations. |
© 2021 by the authors. Licensee MDPI, Basel, Switzerland. This article is an open access article distributed under the terms and conditions of the Creative Commons Attribution (CC BY) license (https://creativecommons.org/licenses/by/4.0/).
Share and Cite
MDPI and ACS Style
Stoilova, S.; Munier, N. Analysis of Policies of Railway Operators Using SWOT Criteria and the SIMUS Method: A Case for the Bulgarian Railway Network. Sustainability 2021, 13, 6948. https://0-doi-org.brum.beds.ac.uk/10.3390/su13126948
AMA Style
Stoilova S, Munier N. Analysis of Policies of Railway Operators Using SWOT Criteria and the SIMUS Method: A Case for the Bulgarian Railway Network. Sustainability. 2021; 13(12):6948. https://0-doi-org.brum.beds.ac.uk/10.3390/su13126948
Chicago/Turabian StyleStoilova, Svetla, and Nolberto Munier. 2021. "Analysis of Policies of Railway Operators Using SWOT Criteria and the SIMUS Method: A Case for the Bulgarian Railway Network" Sustainability 13, no. 12: 6948. https://0-doi-org.brum.beds.ac.uk/10.3390/su13126948
Note that from the first issue of 2016, this journal uses article numbers instead of page numbers. See further details here.