Article

Design and Implementation of a Maximum Power Point Tracking System for a Piezoelectric Wind Energy Harvester Generating High Harmonicity

1
Department of Electrical and Electronics Engineering, Technology Faculty, Gazi University, Beşevler, Ankara TR-06500, Turkey
2
Department of Electronics, Mardin Vocational High School, Mardin Artuklu University, Mardin TR-47200, Turkey
3
Faculty of Electronics, Communications and Computers Science, University of Pitesti, 110040 Pitesti, Romania
4
Department of Systems Engineering and Automatic, Faculty of Engineering Vitoria-Gasteiz, University of the Basque Country, UPV/EHU, 01006 Vitoria-Gasteiz, Spain
*
Author to whom correspondence should be addressed.
Sustainability 2021, 13(14), 7709; https://0-doi-org.brum.beds.ac.uk/10.3390/su13147709
Submission received: 24 May 2021 / Revised: 27 June 2021 / Accepted: 2 July 2021 / Published: 9 July 2021

Abstract

:
In this work, a maximum power point tracking (MPPT) system for its application to a new piezoelectric wind energy harvester (PWEH) has been designed and implemented. The motivation for such MPPT unit comes from the power scales of the piezoelectric layers being in the order of μW. In addition, the output generates highly disturbed voltage waveforms with high total harmonic distortion (THD), thereby high THD values cause a certain power loss at the output of the PWEH system and an intense motivation is given to design and implement the system. The proposed MPPT system is widely used for many different harvesting studies, however, in this paper it has been used at the first time for such a distorted waveform to our best knowledge. The MPPT consists of a rectifier unit storing the rectified energy into a capacitor with a certain voltage called VOC (i.e., the open circuit voltage of the harvester), then a dc-dc converter is used with the help of the MPPT unit using the half of VOC as the critical value for the performance of the control. It has been demonstrated that the power loss is nearly half of the power for the MPPT-free system, the efficiency has been increased with a rate of 98% and power consumption is measured as low as 5.29 μW.
PACS:
41.20 Gz; 07.50 Ek

1. Introduction

Energy harvesting is a popular field for basic science and engineering. In the present world, many technological products have specific harvesting mechanisms. Indeed, harvesters are one of the important devices on the way of sustainable and clean energy production. Therefore, new designs and implementations get more and more interest among the scientific and technical communities in the developed and developing countries [1]. Harvesters are generally battery-free devices operating under uW or mW scale power consuming systems. Among them, wireless sensor networks are the most popular one in the harvester community. As the applications of harvesters increase, electromagnetic, electrostatic and piezoelectric types of devices flourish all over the world. According to the literature, the highest power density is obtained from piezoelectric systems when their low dimensions have been considered compared to the electrostatic and electromagnetic harvesters [1].
The most important issue for harvesters is to use them in place of batteries, since the refilling maintenance becomes hard due to environmental harsh conditions for many systems. In many harvester systems, maximum power transfer can be the half of the open circuit voltage (i.e., VOC/2), thereby there exist many maximum power point tracking (MPPT) systems applications by using VOC/2 value for the parallel connection to the energy harvester with a filtering circuit and capacitor.
According to the literature, there exist a few techniques to estimate and track the MPP point. For instance, hill-climbing (HC) [2,3] and fractional open-circuit voltage (FOCV) methods [4,5] are frequently-used ones. In the hill-climbing method, resistive matching is provided by dynamically changing the duty cycle of a dc–dc converter in discontinuous conduction mode, since it behaves like a variable resistor. Both methods can compare the power generated with a reference and thereby adjust the duty cycle of the dc–dc converter in order to keep the track of the MPP [2,3,6]. FOVC method works on the basis of the determination of VOC, where the maximum power is transmitted.
According to the literature, this value is obtained for VOC/2 for thermoelectric generators (TEGs) [7], RF antennas [7] and piezoelectric energy harvesters (PEHs) [8], whereas it stands around 4/5 VOC for photovoltaics [8]. In the FOVC applied circuits, the switching controllers [4] or digital controllers [5] are used in different subsystems, and in addition, a sensing capacitor with an analog complicated signal circuit having a discrete component is added [9].
Energy harvesters are transiently disconnected from the power management module to obtain their VOC. Then energy harvesters can be connected to a voltage divider formed by two resistors to determine the appropriate voltage ratio [8,9,10]. The resistor values are properly chosen so that the loading effect on the energy harvester and power consumption is minimized. Alternatively, the VOC is sampled using a sensing capacitor [4,5]. Although FOCV implementations need low power consumption, it may not be appropriate for the PEHs every time [2,10,11], because in many applications the required VOC values determined by FOCV increase to high values such as 100 V. Therefore the realization of the circuit can be expensive and possibly hindered by the voltage limitation of the fabrication technologies [10,12].
This work has two innovative points: First, the PWEH itself is a new designed and implemented machine, secondly the usage of the proposed MPPT system is implemented to such a high total harmonic distortion (THD) system for the first time to our best knowledge. The PWEH has its novel electromagnetic flux characteristics by repelling the tips of the piezoelectrics within a certain angle. The MPPT scheme has been implemented for the PWEH having a power scale of microwatts, which is a low power value as seen in many other harvesters, too. Although the proposed method was initially applied to a simple pieozo—beam system by Chew and Zhu [13], the validity and the performance of their technique has been tested in this paper for a high harmonic generating complicated system (i.e., PWEH) in that work. It will be demonstrated that their MPPT scheme works well with a high efficiency for such a high harmonic device operating in triple beam system.

2. Harvester Design and Theoretical Description

The design of the piezoelectric wind energy harvester (PWEH) is shown in Figure 1. It consists of a propeller rotating freely, a shaft for the transfer of the mechanical rotation to the central magnet behind the white pulley, three piezoelectric layers. The size of the propeller is 25 cm in diameter with 5 cm central region. The type is NACA 6506. The electronic part for the filtering and storing is shown in Figure 2. They are responsible for the regulation of the voltage waveforms and the storage of the harvested electrical power.
The piezoelectric layers are positioned with 120 degrees on a circular geometry at the same radial distance from the center of the shaft. Each tip of the layer has a cylindrical permanent magnet with 1 cm diameter and 5 mm thickness. The magnet in the channel of the pulley is located as the same pole with the magnets located at the tips of the piezoelectric layers. Thus, they are repelled when the central magnet on the shaft comes closer to the tips. When the propeller rotates due to the wind strength, the shaft inside the body starts to rotate too. This effect causes the pulley rotate at the right tip of the shaft in Figure 1. Note that the pulley has a magnet inside its channel. This magnet repels the other magnets at the tips of three piezoelectric layers, when it rotates. The number of magnets attached to the layers differ, because we wish a varying natural frequency for each layers due to the magnet mass. In fact, the heavy mass causes low frequency during the buckling process. To prevent the damage of the piezoelectric layers during high frequency radial move, a cylindrical polyethylene ring is positioned on the shaft as seen in the right end of the device in Figure 1.
The theory for the PWEH has been described in one of our earlier studies [14]. Therefore we will not give the details on the mathematical manipulation of the system of equations, however the equations can be summarized as follows for the sake of clarity:
d θ d t = ω ,
m 1 d 2 r 1 d t 2 = k r 1 γ d r 1 d t + α v 1 + f m   δ ( θ θ 1 ) ,
m 2 d 2 r 2 d t 2 = k r 2 γ d r 2 d t + α v 2 + f m   δ ( θ θ 2 ) ,
m 3 d 2 r 3 d t 2 = k r 3 γ d r 3 d t + α v 3 + f m   δ ( θ θ 3 ) ,
I 1 = α d r 1 d t C d v 1 d t ,
I 2 = α d r 2 d t C d v 2 d t ,
I 3 = α d r 3 d t C d v 3 d t ,
Above the variables k, m, ω, α, and C are stiffness constant of piezoelectric, mass of the layer, propeller angular speed, force factor of piezoelectric material, angular position of layer, and the capacitance of piezoelectric layer, respectively. Besides, δ, θ, r, v, fm, and I denote the functions Kronecker delta which gives “1” for θ = θi (i = 1…3) else “0”, angular position of the magnet, radial displacement to center of shaft, piezoelectric voltage, the magnetic repulsion force, and harvested current, respectively. When the propeller rotates with ω, that effect is conveyed to the radial position r for the piezoelectrics, which are denoted by 1, 2 and 3. The tip mass m1 m2 and m3 affects the natural frequencies of each layer. When the distance in radial direction varies via the buckling move, the PZT materials generate electrical current given by Equations (5)–(7). Here the electrical current is dependent on the velocity and its potential variation by time according to the formulation above [15].

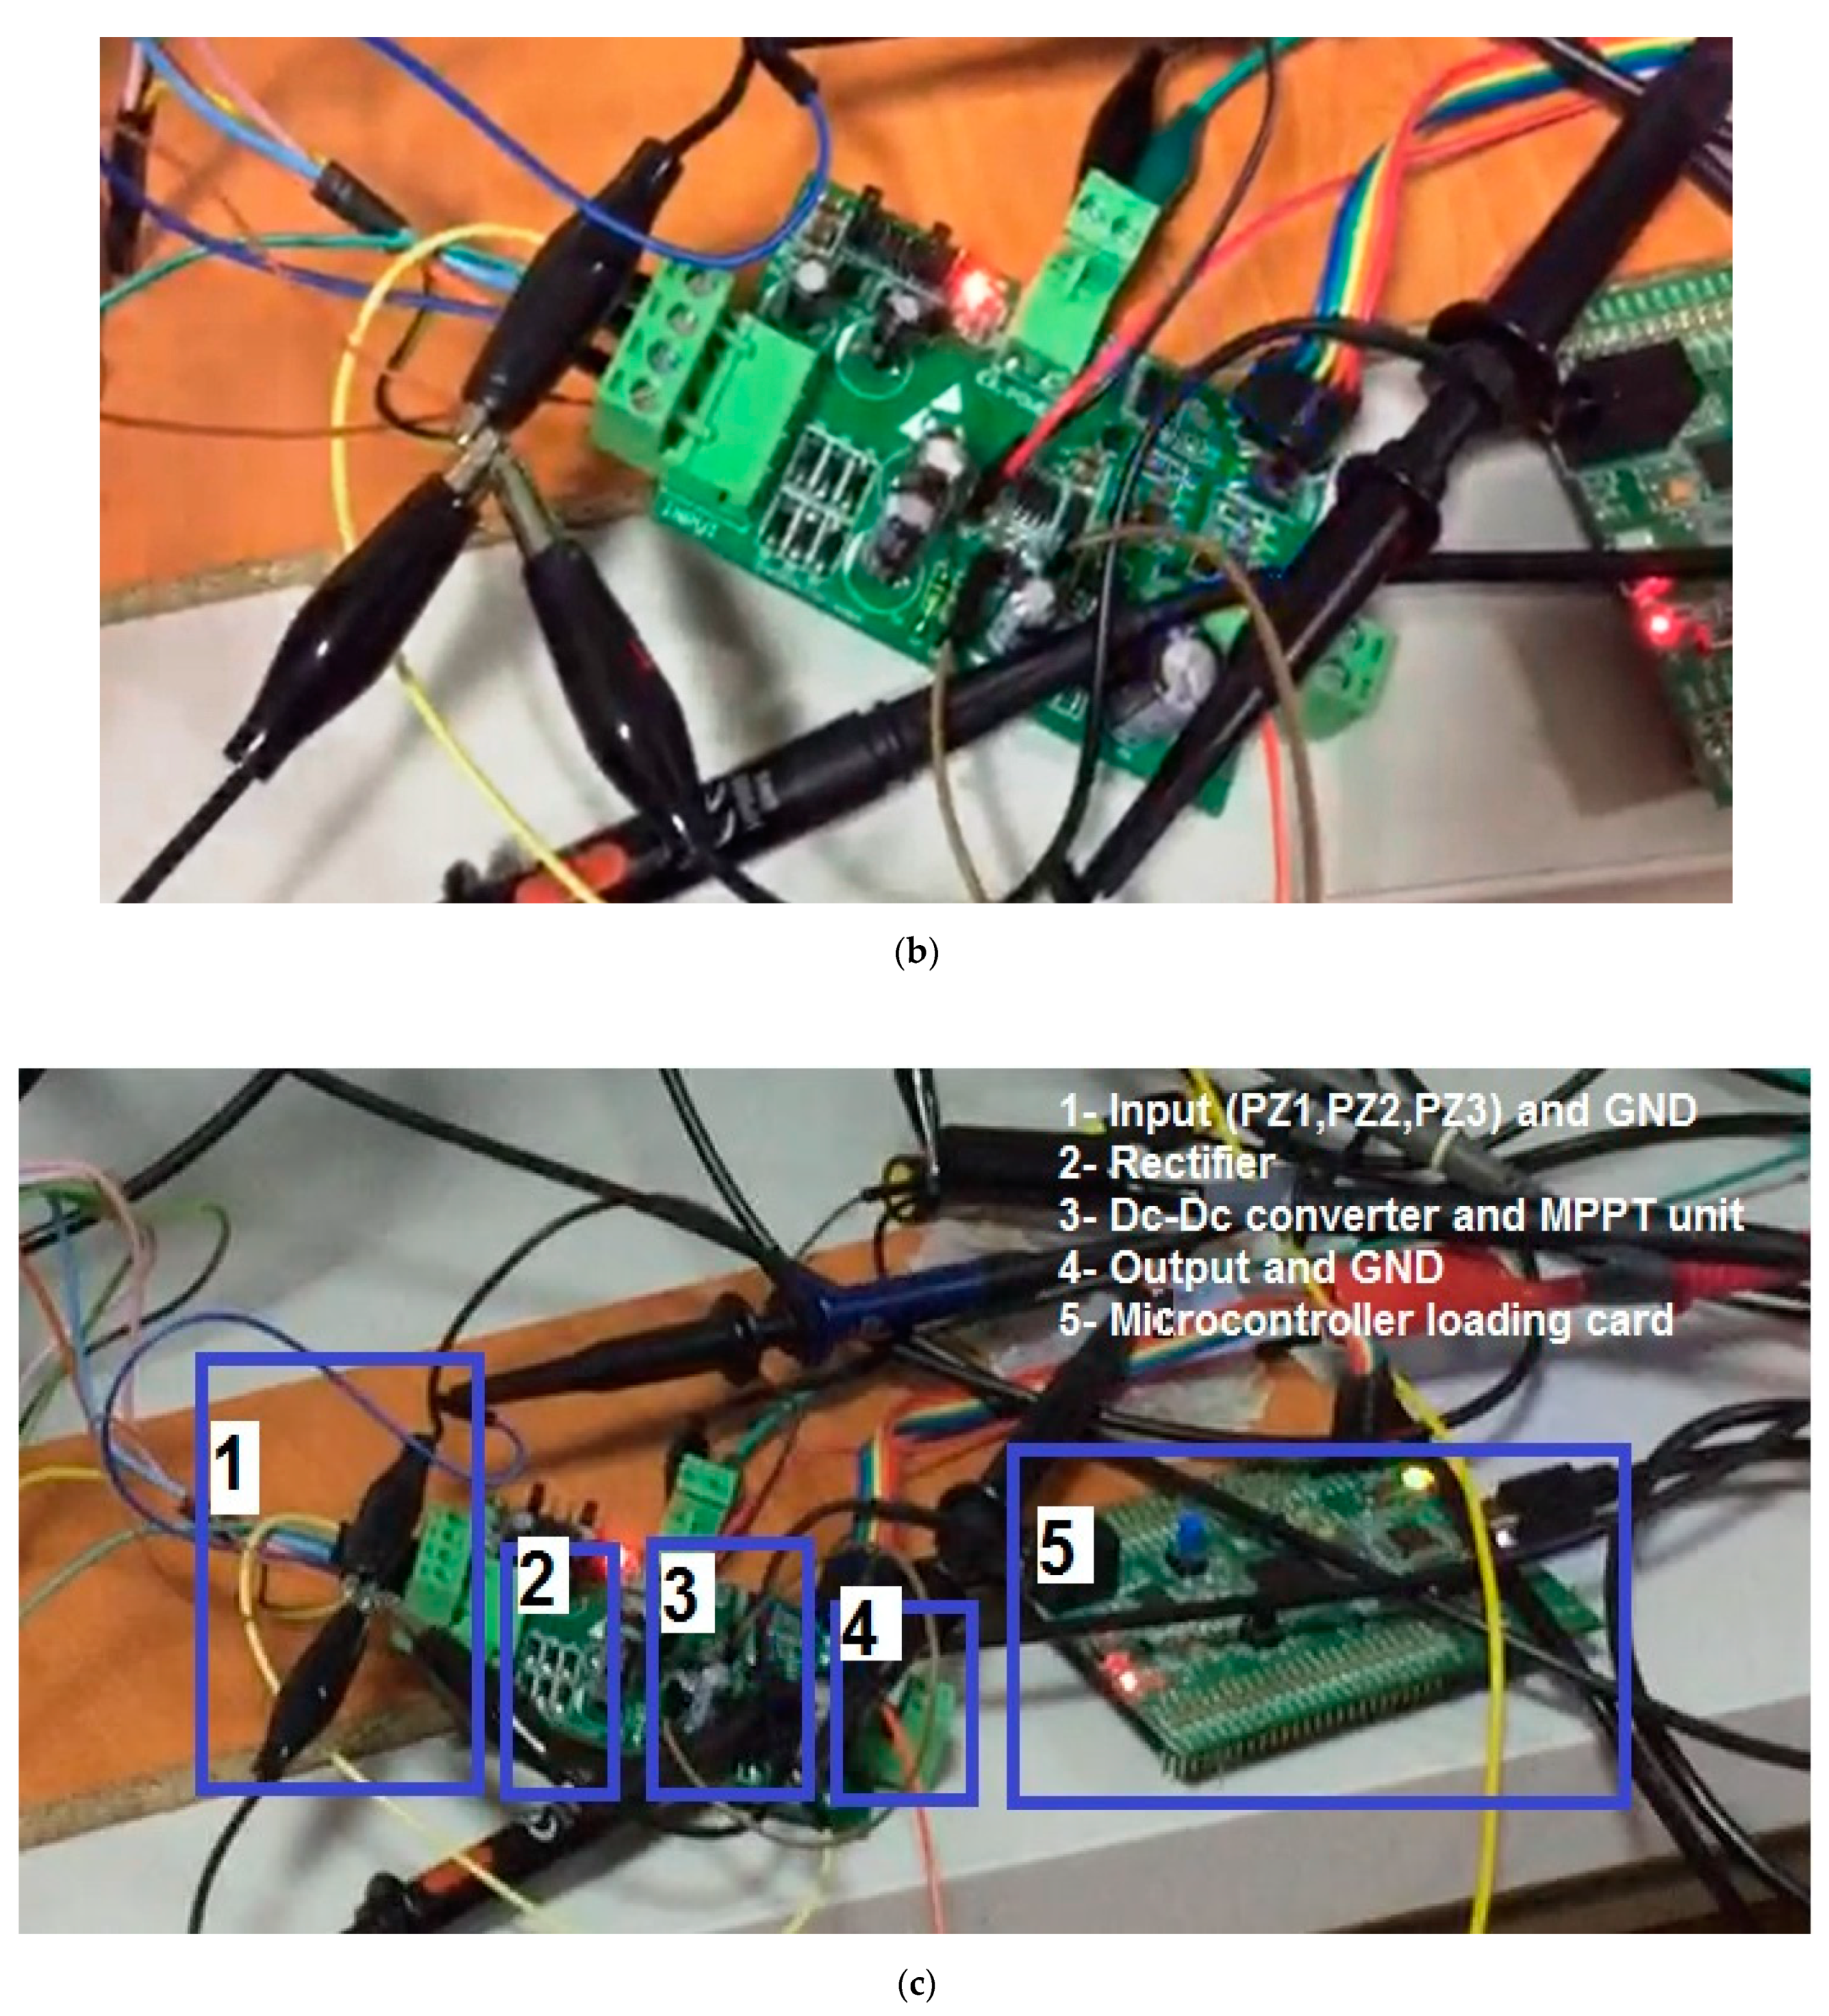
3. Experimental Setup

Each piezoelectric layer has the weight of 1.4 g. The piezoelectric capacitance and stiffness are 26 nF and 380 N/m, respectively. A NI USB-6250 DAQ data acquisition system is used during the experiments. This card can make a good precision multiple recording via its 16 analog inputs, and displacement and harvested voltages can be recorded synchronously. A Tektronix MSO DPO70000 type oscilloscope has also been used in order to see the time-dependent output variations of the circuit. Figure 2a–c presents all the experimental system with the required elements including the controller and MPPT units.
The maximum power generation can be obtained for such a working point that half of open circuit voltage (i.e., Voc) with the relevant current should be equal to the half of its closed circuit current Icc according to the literature [1,3].

4. Theoretical Results and Discussion

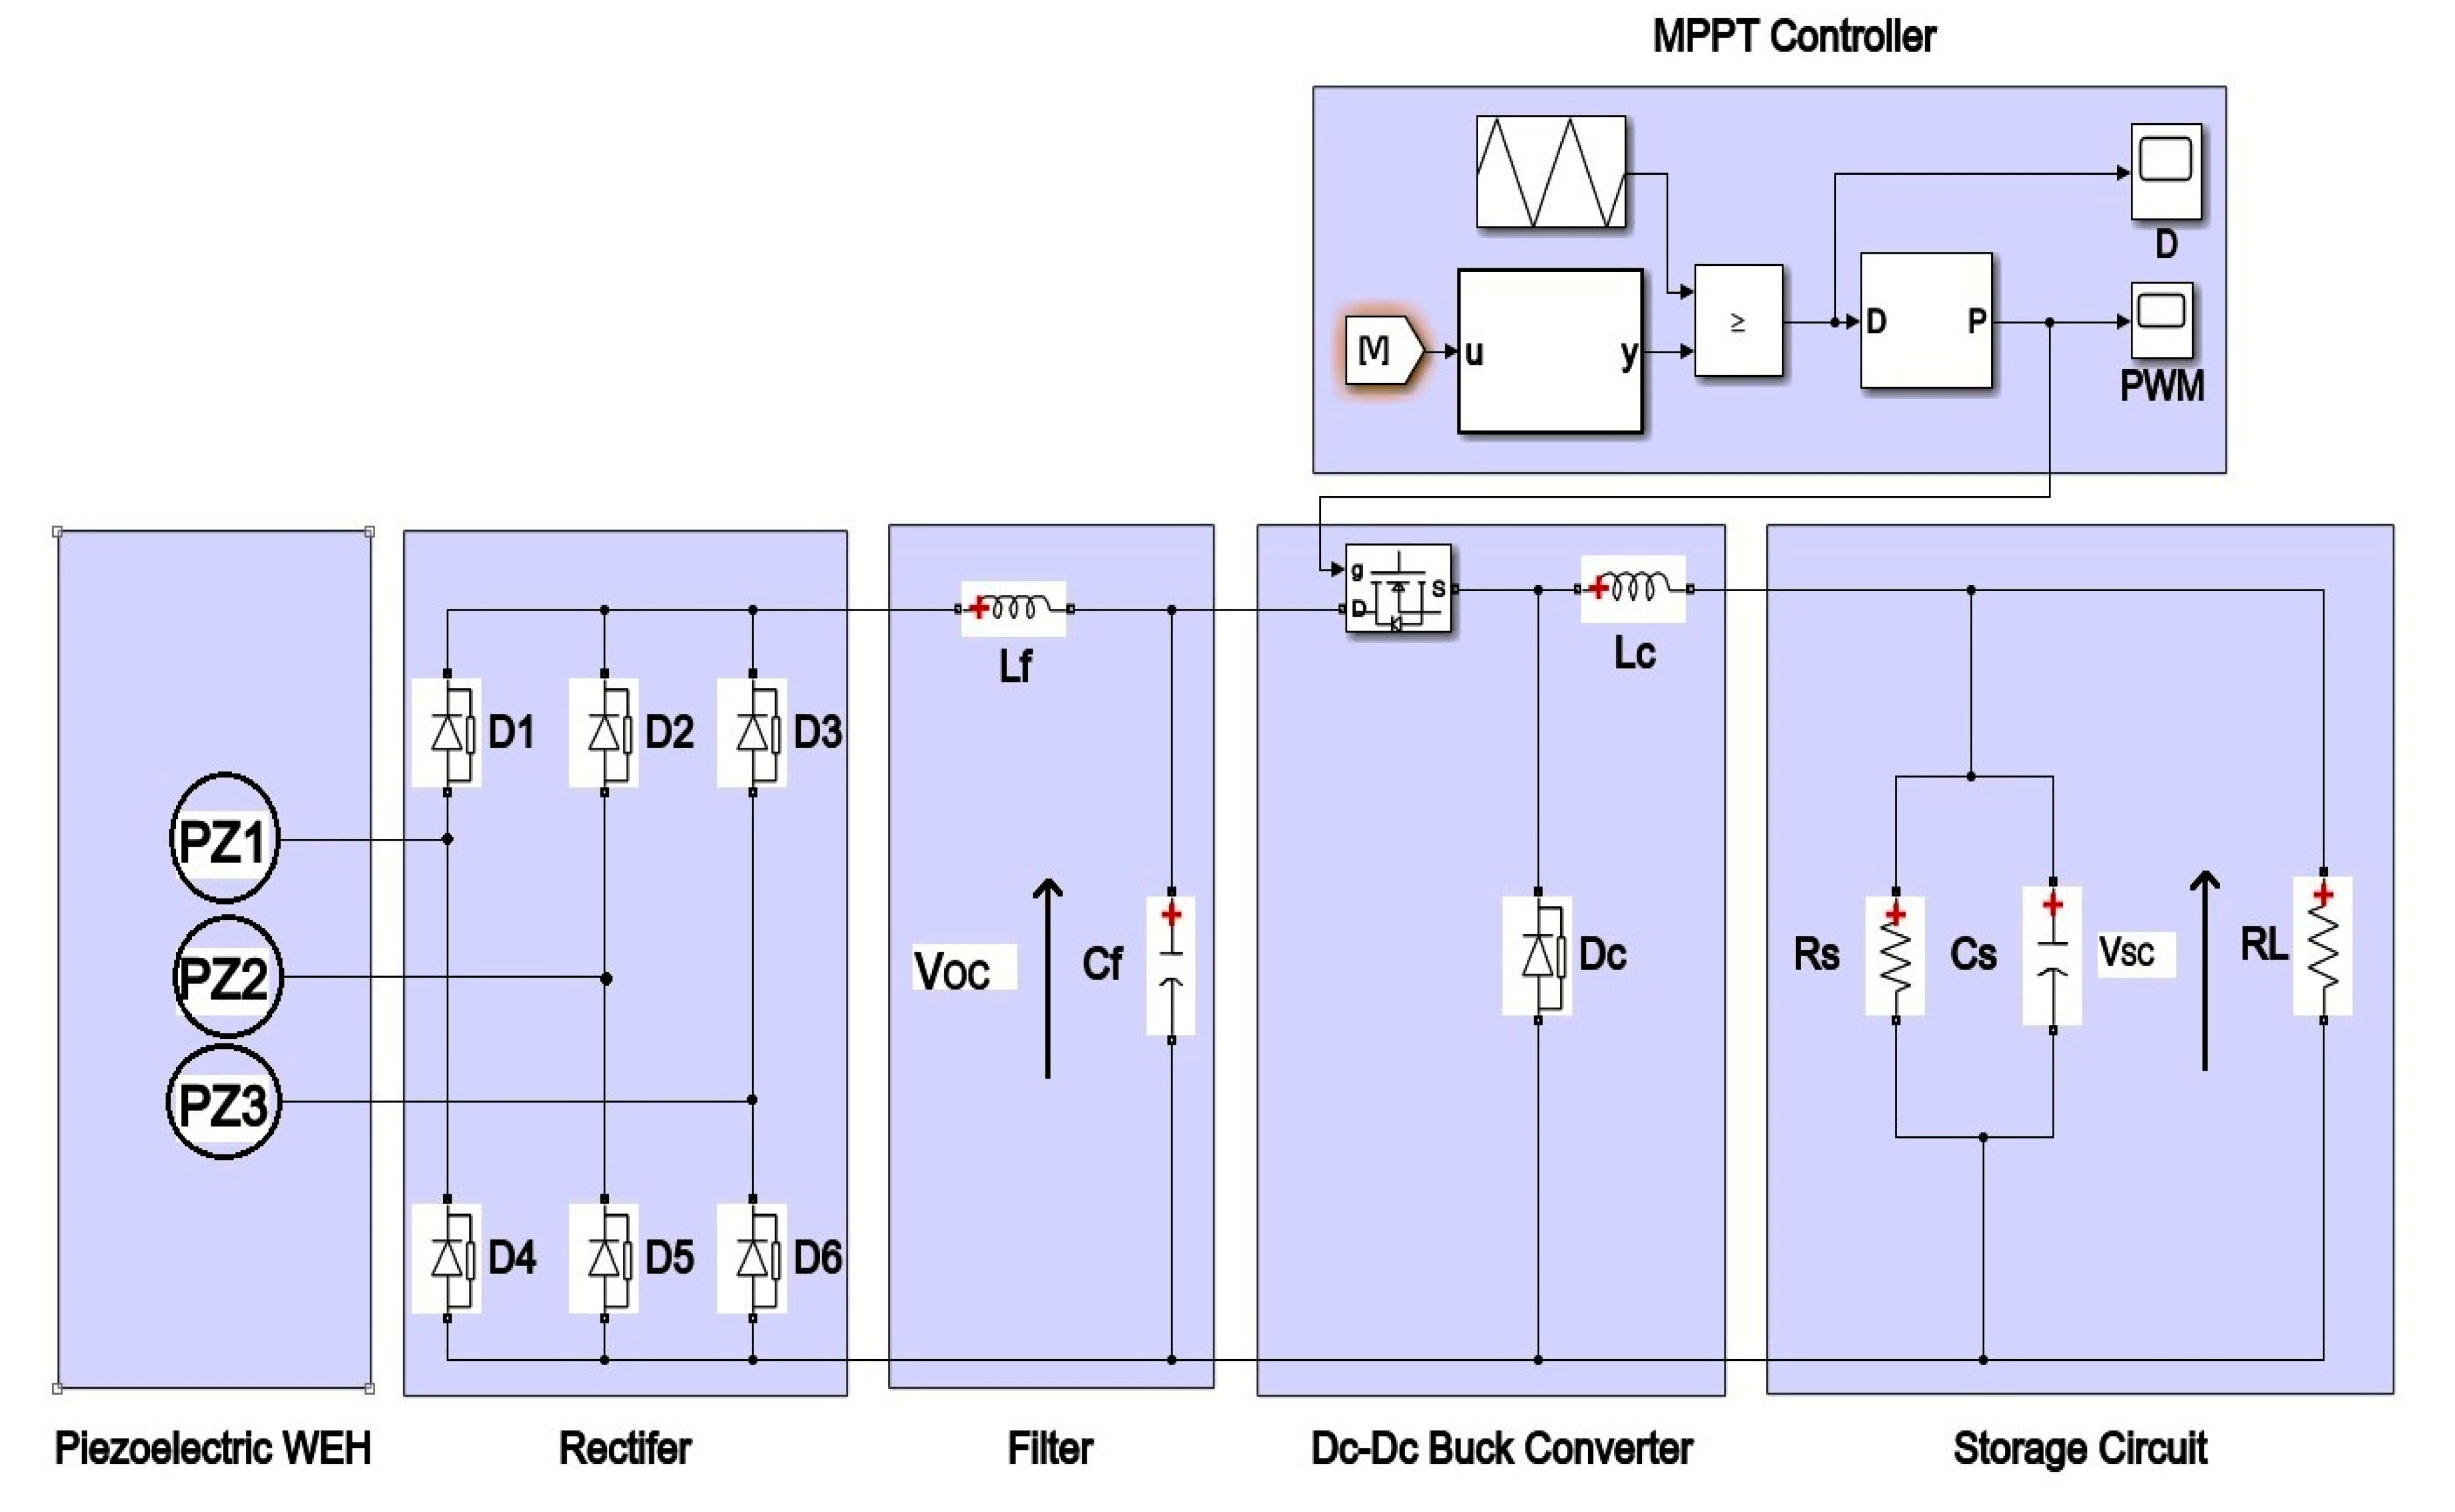
4.1. Simulation of the MPPT Control Circuit

The block diagram of the proposed MPPT controller is given in Figure 3. The harvested voltages from three piezoelectric layers are initially transferred into a rectifier circuit. Then the rectifier output is directed to a dc-dc converter. At this stage, the MPPT controller decides the power by using VOC/2. Then, the output of the converter is transmitted into a storage circuit and the battery to generate the battery voltage and state of charge (SOC) (Figure 3).
For a more detailed circuit scheme, we refer to Figure 4. This simulation diagram includes an ac-dc rectifier, a filter, a dc-dc buck converter, a MPPT controller circuit and an electrochemical battery or an electrical load RL. For instance, VPZ1, VPZ2, VPZ3 show the voltage outputs from terminals of the piezoelectric layers (PZ1, PZ2, PZ3). Besides, VOC, VOC/2, VSC, Vbat denote the dc voltage after rectification, output voltage of the buck converter, voltage level of battery, and state of charge (SOC), respectively. Before the experimental work, a detailed simulation has been performed according to Figure 4. The optimized parameters for the experimental work are ascertained as in Table 1. In power electronic studies, one should perform many simulations in order to get the optimum parameters by changing circuit element values and looking for the responses at the output. In the optimization, the MatLab package programme has been used. According to Table 1, the buck converter operates with a MOSFET element with 0.3 mH, 1.85 mF and 50 Ohm. In the controller unit, 72 V maximum input has been converted into about 12 V with 10 KHz switching frequency. In the battery unit, a lead-acid type battery has been used.

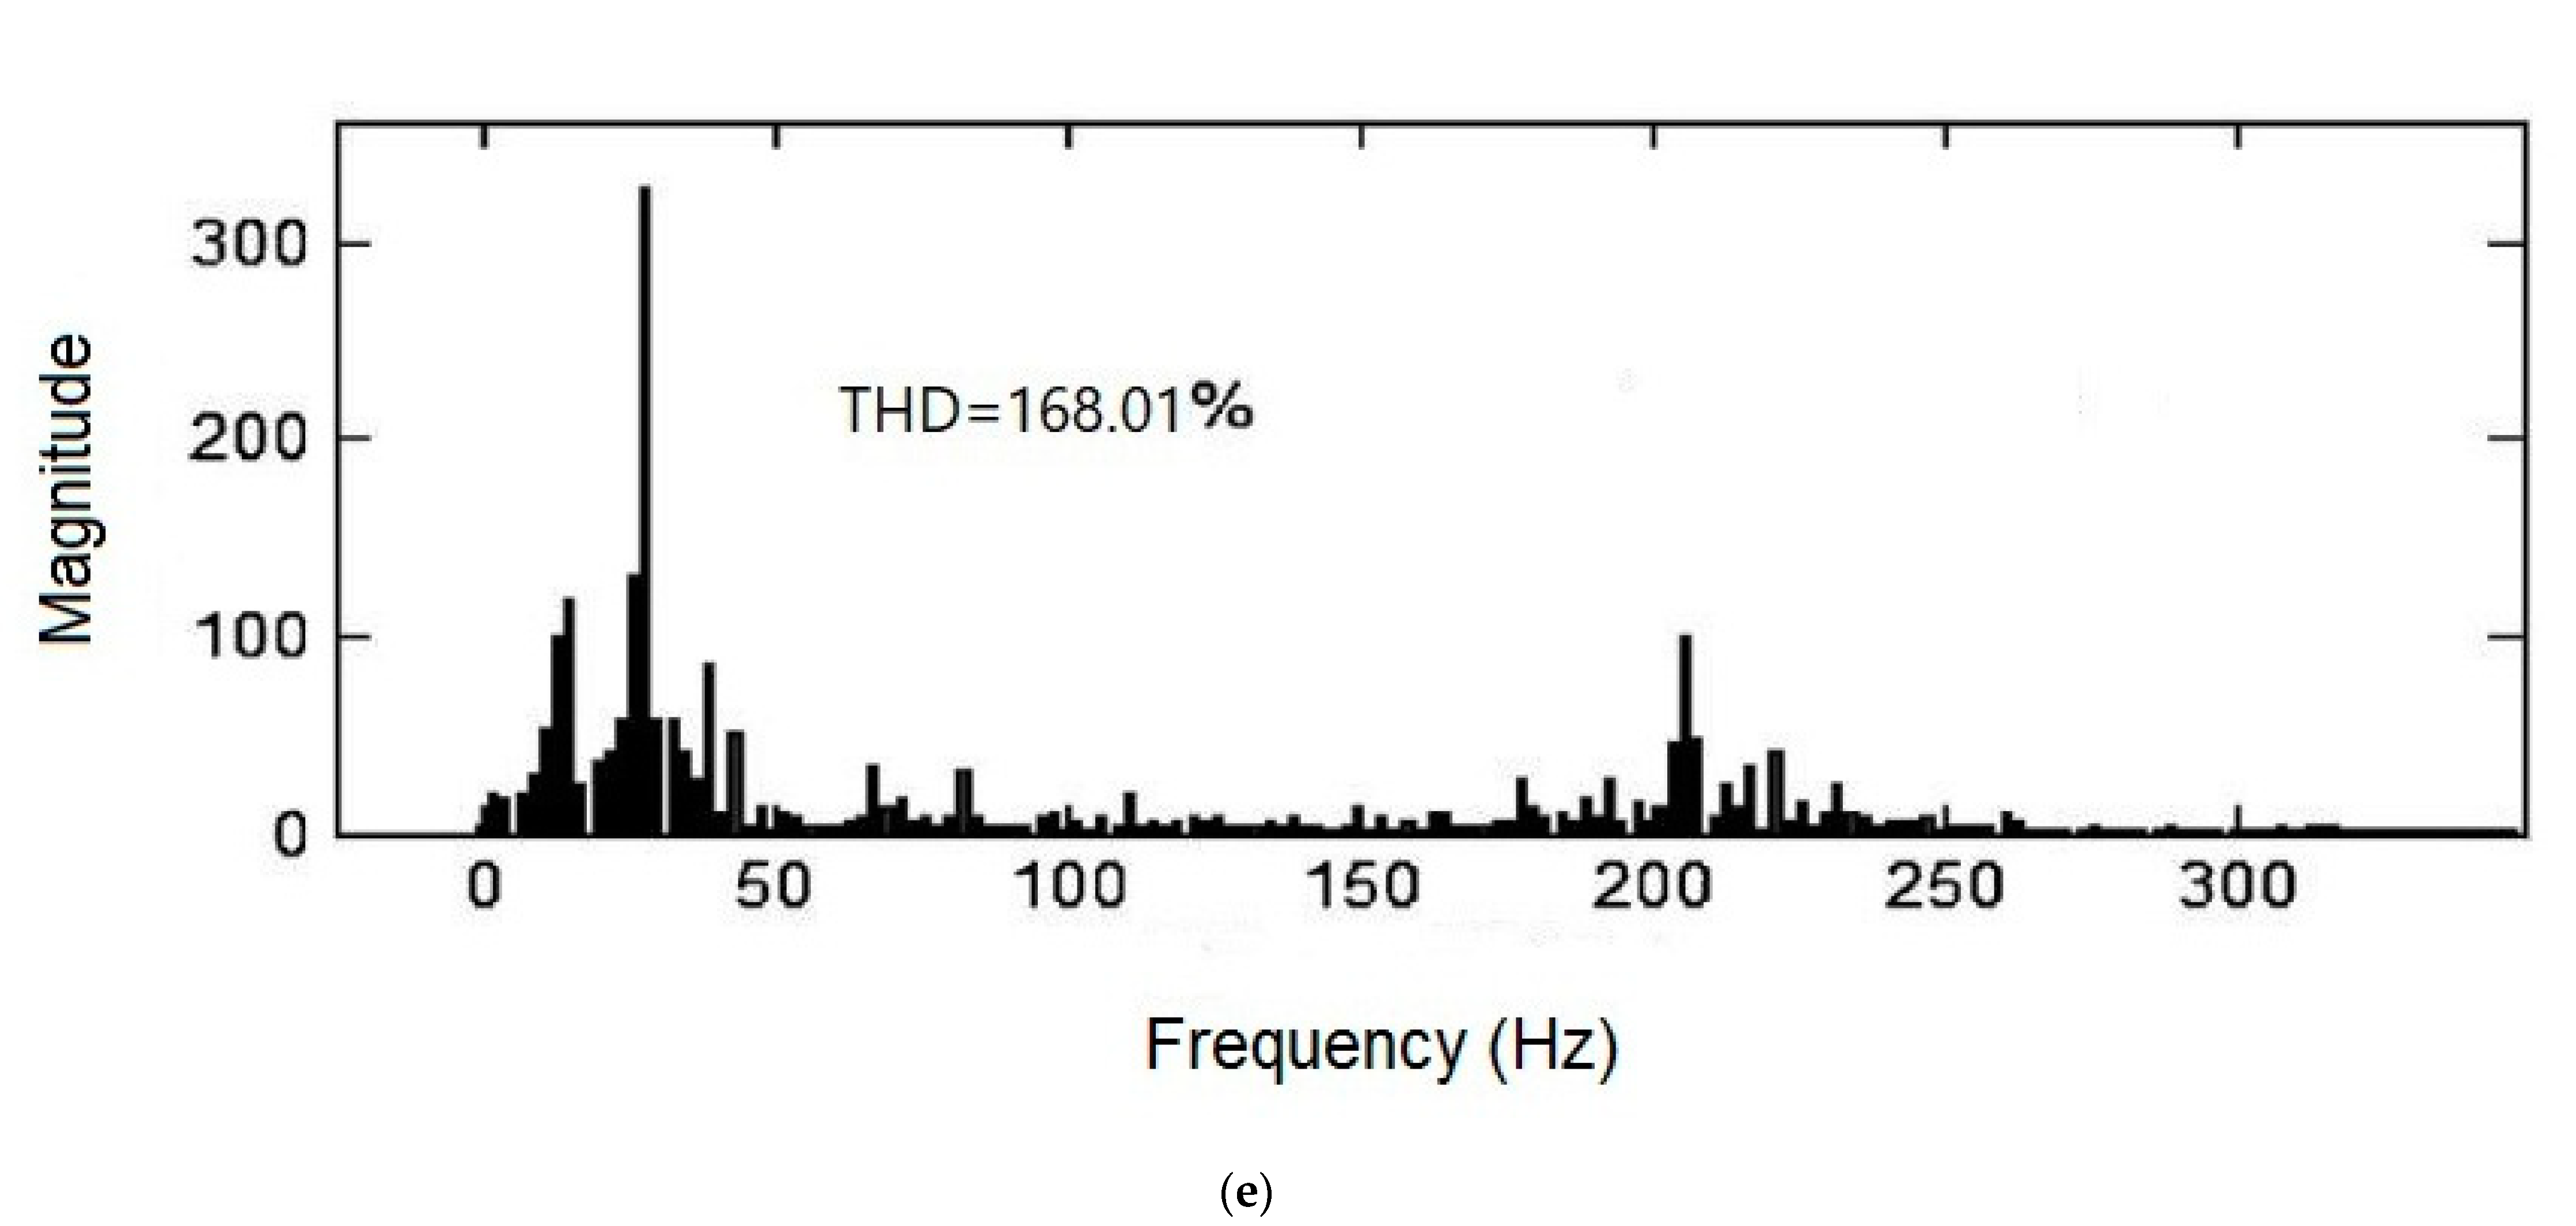
4.2. Piezoelectric Component

A sample of the harvested waveforms (i.e., input waveform for the rectifier) are shown in Figure 5a–d. In addition, a sample THD analysis is given in Figure 5e. The layers have been positioned on 120 degrees angular location for each other and they produce different waveforms in amplitude and frequency. Indeed, they have high harmonics and in some cases we observed high THD values beyond 150%. Because of the differences in natural frequencies of the layers, we expect different amplitudes from each layer, however, high THD values in pure waveforms are caused by the nonlinear nature of magnetic force and the mechanical connection with the pulley [16,17]. As seen in Figure 1, the layers are kept safe by the cylindrical polyethylene pulley and each vibration ends with a pulley contact by yielding to a complicating oscillation. Therefore, since the waveforms are too complicated, we refer that system as a triple piezoelectric system. At higher rotation rates, this effect governs especially the harmonics.

4.3. AC—DC Rectification Component

The ac—dc rectifiers have been commonly used for the conversion of an ac waveform to a dc one. Indeed, the control-free ac-dc rectifiers serve in the control mechanism of power electronic units. They govern the rectification voltage in average and the power factor itself on the power supply voltage part with other elements such as MOSFETs, HEXFETs, thyristors, bipolar transistors, RB IGBTs and IGBTs [18,19]. In this study, the waveforms of Figure 5a–c are initially applied to the input of the rectifier as seen in Figure 4. Figure 5d presents the waveform when the MPPT unit is connected at the terminals of the piezoelectric layers as in Figure 2a–c. Note that the circuit shown in Figure 4 is applied for this output. It is obvious that the MPPT unit as an electrical load causes a decrease in amplitude compared to Figure 5c.
As stated in Ref. [20], an optimal rectifier voltage Vrect is measured. Then, this value is used for the measurement of electrical energy under the maximum power. Vrect is the half of the peak voltage Vin as seen in Equation (8):
Vrect = Vin/2
The rectification of the diode bridge works with the resistive load, thereby the impedance matching condition cannot be performed well. In this case, in order to provide the exact match, the internal impedance of the PWEH can be considered as a capacitive component as in the literature [1]. Figure 6 gives a sample rectified voltage over the rectifier unit. The maximum voltage is measured as 64.7 V.

4.4. LC Output Filter Unit

The ac power is preferable for the commercial devices, because of its low cost and secure operation. On the one hand, the dc power generation is not so cheap and a conversion from ac to dc power is required for a cheap solution, since the dc circuit components become expensive especially for high voltages. It is obvious that the various rectifier components are used for the conversion. The main point for this procedure is to make the conversion in an appropriate way, i.e., without any undesired effect such as waveform ripples. If the ripple exceeds a certain value, then various effects may arise inside the system such as noise and stray flux heating [21,22]. An efficient filter can diminish these problems. The capacitor—inductor filter shown in Figure 4 presents a good filtering procedure. There, C1 and Lf on their on cannot make a qualified filtering. Strictly speaking, the first may operate for low power circuits, while the second can be used for high power circuits [23]. The use of C1 and Lf together can give better response, smoothening the fluctuations in voltage waveform. Figure 7 presents a waveform of the output filter from simulations.
According to Figure 7, in a 0.02 s time span, voltage Voc is increased to 63 V after the rectification. Here, the main achievement is to get this dc form from the high THD waveform shown in Figure 6. In order to eliminate that high THD values, the values of both the capacitor and inductor play an important role. Indeed the value of the capacitor should be high enough to preserve the voltage for certain periods in order to prevent the signal from dropping.

4.5. DC—DC Buck Converter

In the harvester applications, the power levels are generally low at the order of uW or mW [1]. This motivates one to consider an electronic interface for low power scale. According to one of our previous works [24], the buck converter has a preferable topology for the power conversion in many complicated systems. For example, computer server mainboards and communication boards are two main applications. As many converters, the buck converter provides the desired local voltage regime from a higher voltage regime. The converter operates with an active switch (MOSFET) as shown in Figure 4. In addition, the control circuit, the rectifier diode and the filtering elements are activated by the operation of this switch.
A smooth output current waveform is produced from the buck converter inductor Lc at the output, while the MOSFET-c switch is at the input of the converter. According to the tests, current has harmonic components due to the switching technique and that leads to noise. In that case, a proper decoupling with a capacitor C1 is used as a vital component as usual. In the present circuitry, a dc-dc converter including a MOSFET (MOSFET-c) and a diode (Dc) is considered. In addition, the capacitor Cs at the output filters the current ripple and distributes the stable voltage to the remaining part of the device.

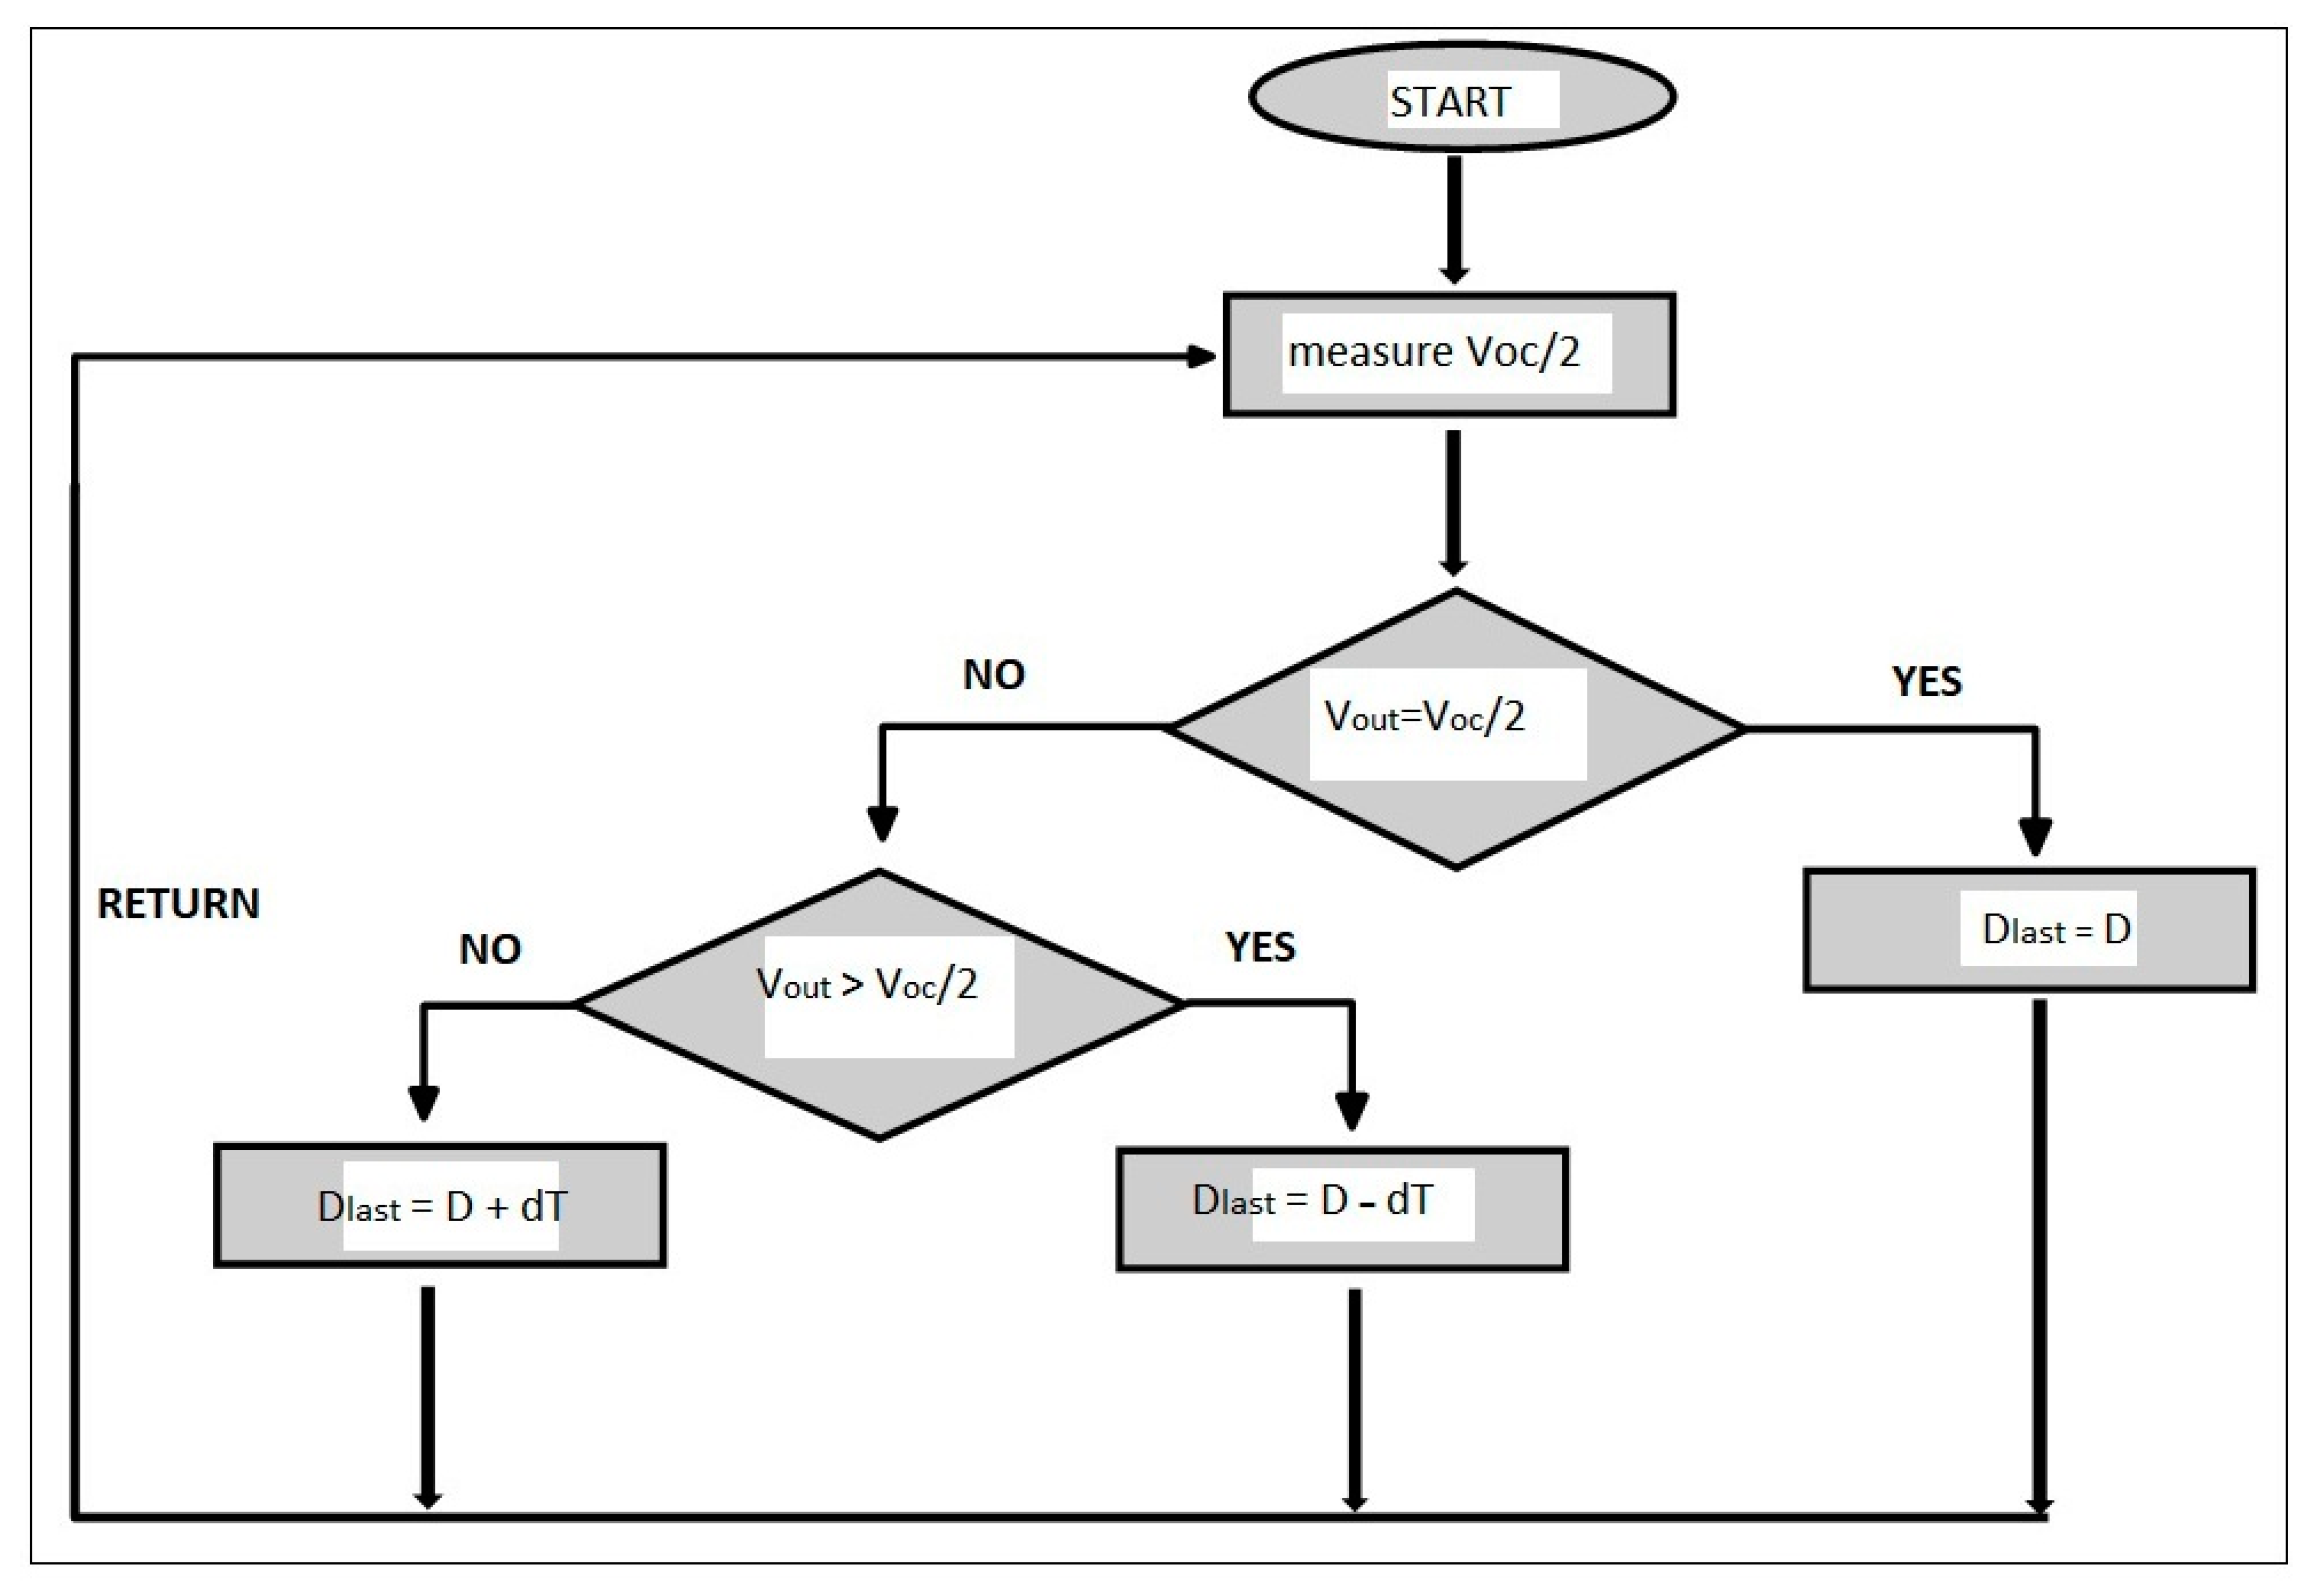
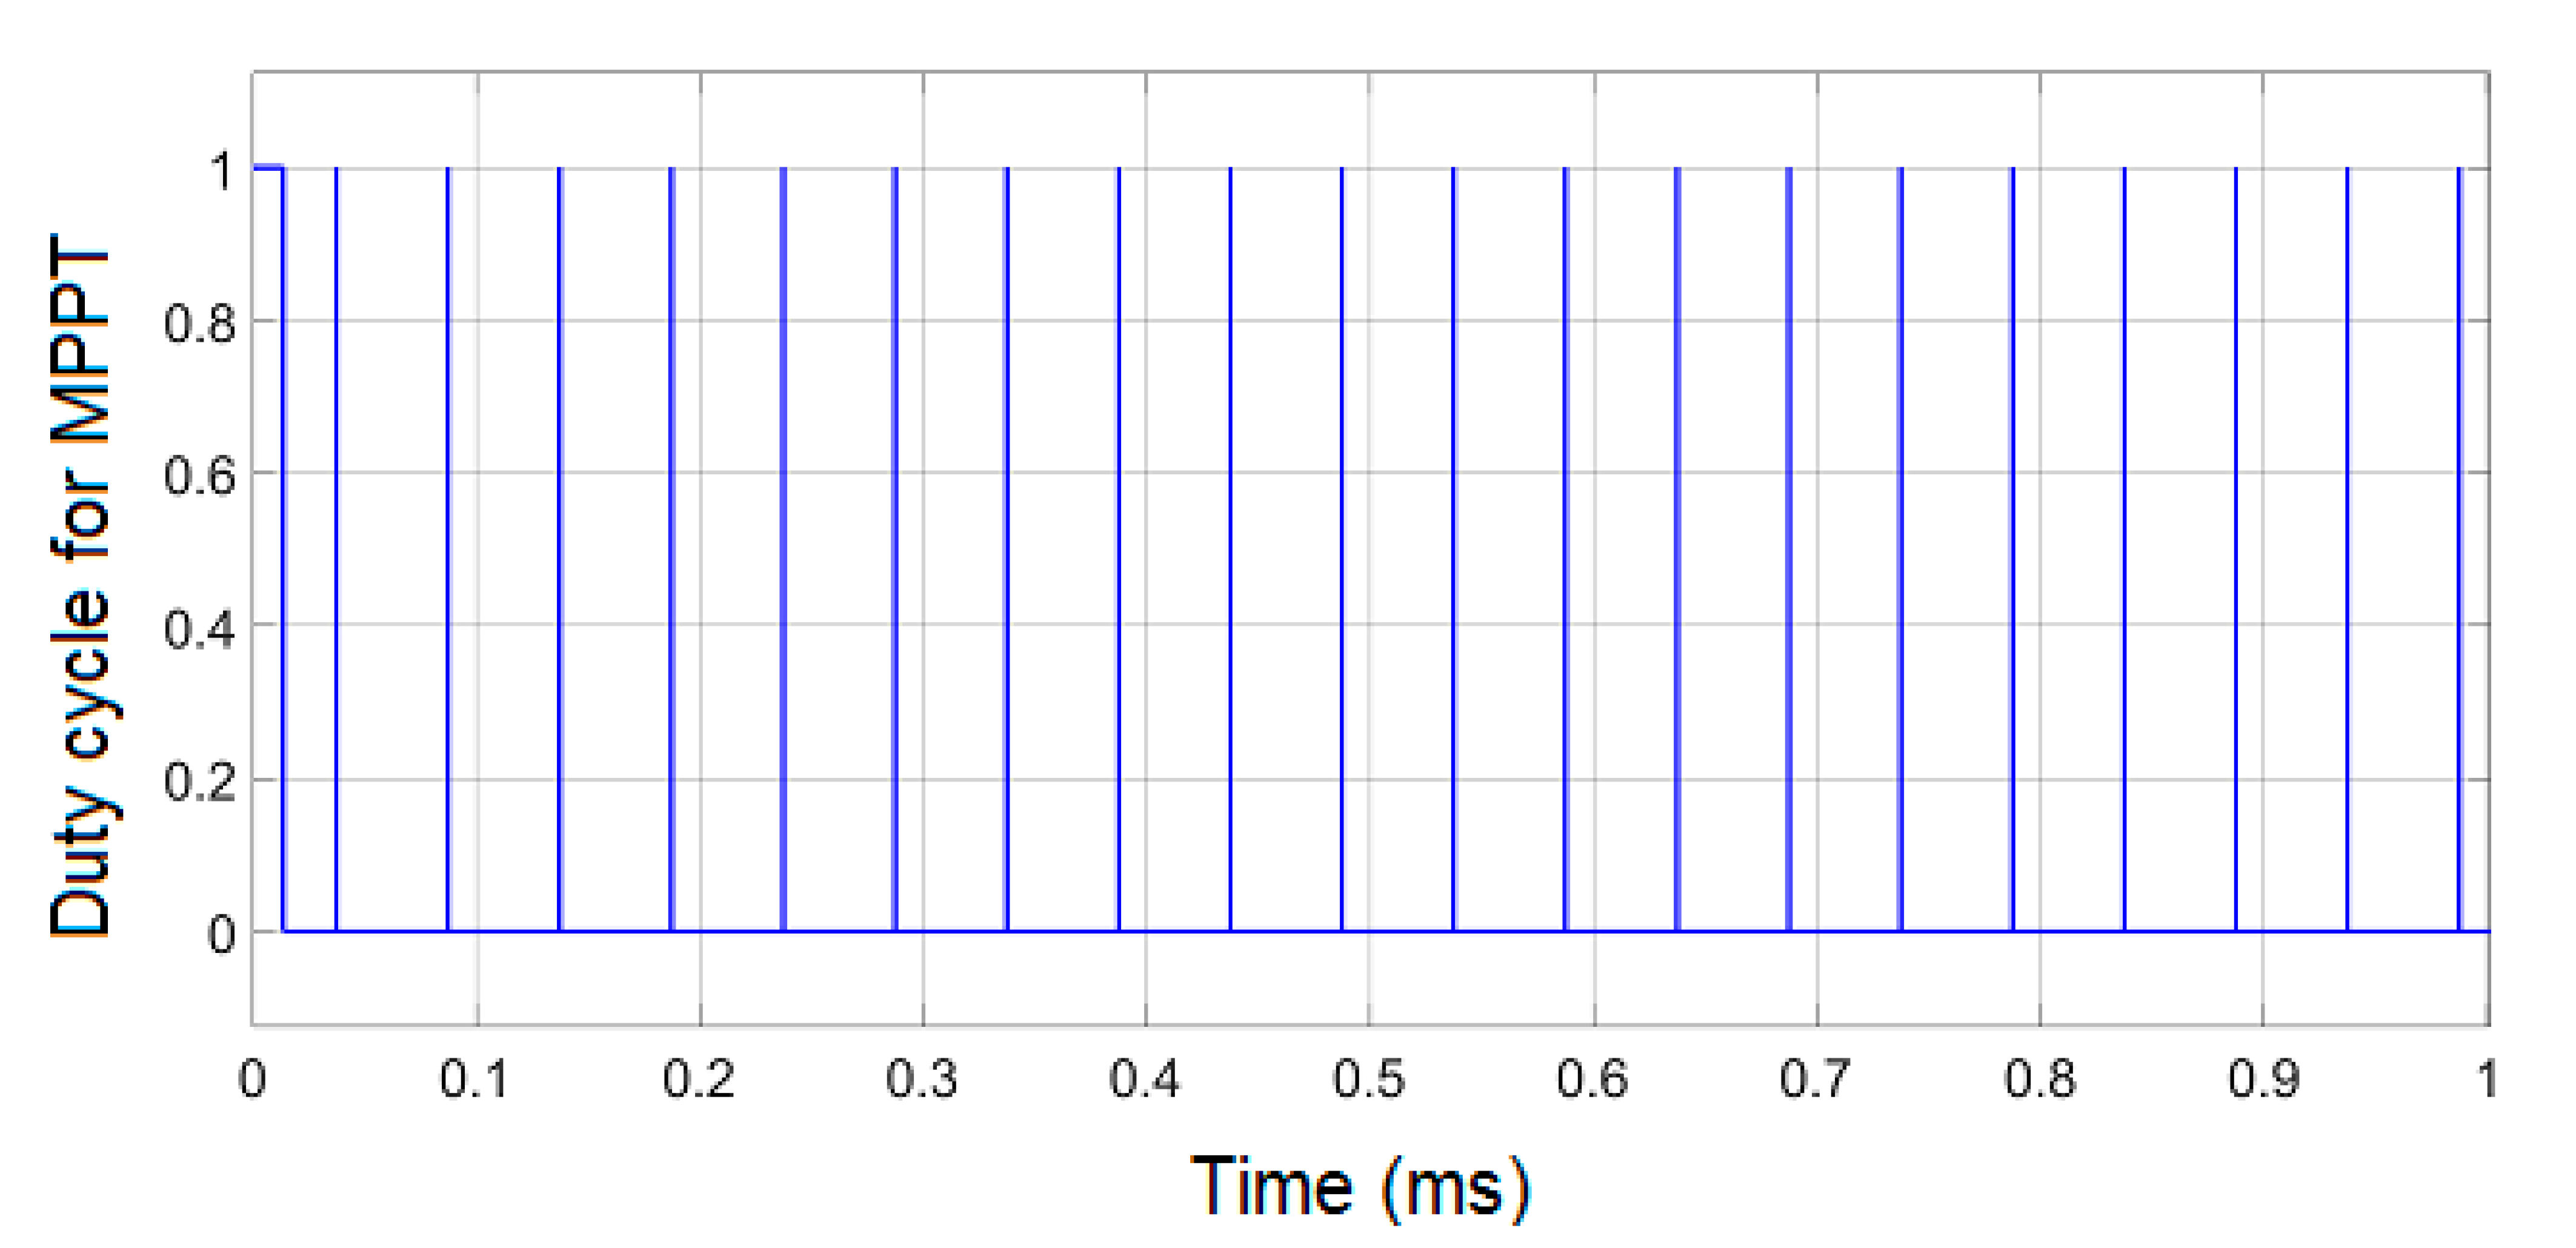
4.6. MPPT Controller

The flow chart of the MPPT algorithm is given by Figure 8. Initially the MPPT unit measures the half of Voc. Then it adjusts the voltage output at that value. If the output voltage differs from that value, the output voltage is made as closer as possible to the value Voc/2. After this adjustment, for each time step, the output value Voc/2 is used for main control parameter in accordance with the flow chart in Figure 8. Here, the open circuit voltage and the expected maximum power point voltage are denoted by Voc and Voc/2, respectively. In addition, the voltage over the output capacitor and the duty cycle are denoted by Vout and D =Vout/Voc, respectively. The variation of the duty cycle is given by dt for the determination of optimum power point.
The output voltage is directed to the buck converter at the end of that control process. A sample output waveform of the buck converter after the MPPT control step is presented in Figure 9. At the starting point of time, the controller initially increases and decreases the voltage in order to reach the stable value Vsc. Apparently, it achieves a stable output after 0.025 s according to Figure 9.
From the literature [11,12], it is known that PEHs exhibit linear electrical characteristics in which the maximum power transfer occurs at half of the rectified open-circuit voltage VOC of the PEH. Figure 10 presents a sample duty cycle waveform for the controller unit. Here, the duty cycle has several peaks changing from “0” to “1” to drive the controller.
To assign dt, D is defined. Here for instance, the ratio of output voltage and input voltage at ta= 0.3 s and tb = 0.7 s can be used as − dt and +dt values (with dt = 1 ms) for sufficient sensitivity. Since the switching frequency is Ts = 10 kHz, the values D Ts for “ON” and 1—D Ts for “OFF” are determined. Then a PWM signal is used for each time step and either D = D + dt or D = Ddt is applied according to Figure 8. The iterative feature of the algorithm continues till the VOC/2 is reached.

4.7. Lead-Acid Battery

As seen in Figure 4, a battery unit is used for the storage task. Since the power is low in harvester systems, small battery cells should be used for the aim of power storage. According to the literature [25,26], small batteries are widely used for the devices such as hearing aids, wrist watches, and wind energy harvesters, whereas the large ones work well for stand-by power circuits for telephones, pc mainboards, etc. In the present design, the battery is considered as the primary source to provide current immediately on the load. Indeed, the primary cells can be always recharged during their long life [27].
There are several types of batteries including Nickel-Cadmium, Lithium-Ion, Lead-Acid, Nickel-Metal-Hydride. In the current study, the system in Figure 4 uses a generic dynamic model for the battery. Indeed, the battery parameters are included for the charge/discharge characteristics. According to the model, the internal resistance is assumed to be constant during the charge/discharge cycles and it has not been changed with current. The battery capacity does not depend on current. That is so-called Peuk—Ert effect [28]. The model does not have any temperature dependence during the operation. In addition, the battery self—discharge effect is not considered in the model. Such an effect has a high resistance with the parallel connected terminals. As the last assumption, the memory effect is not taken into account. Since the main objective of the paper is the MPPT application for the harvester, these simplifications do not decrease the quality of the results.

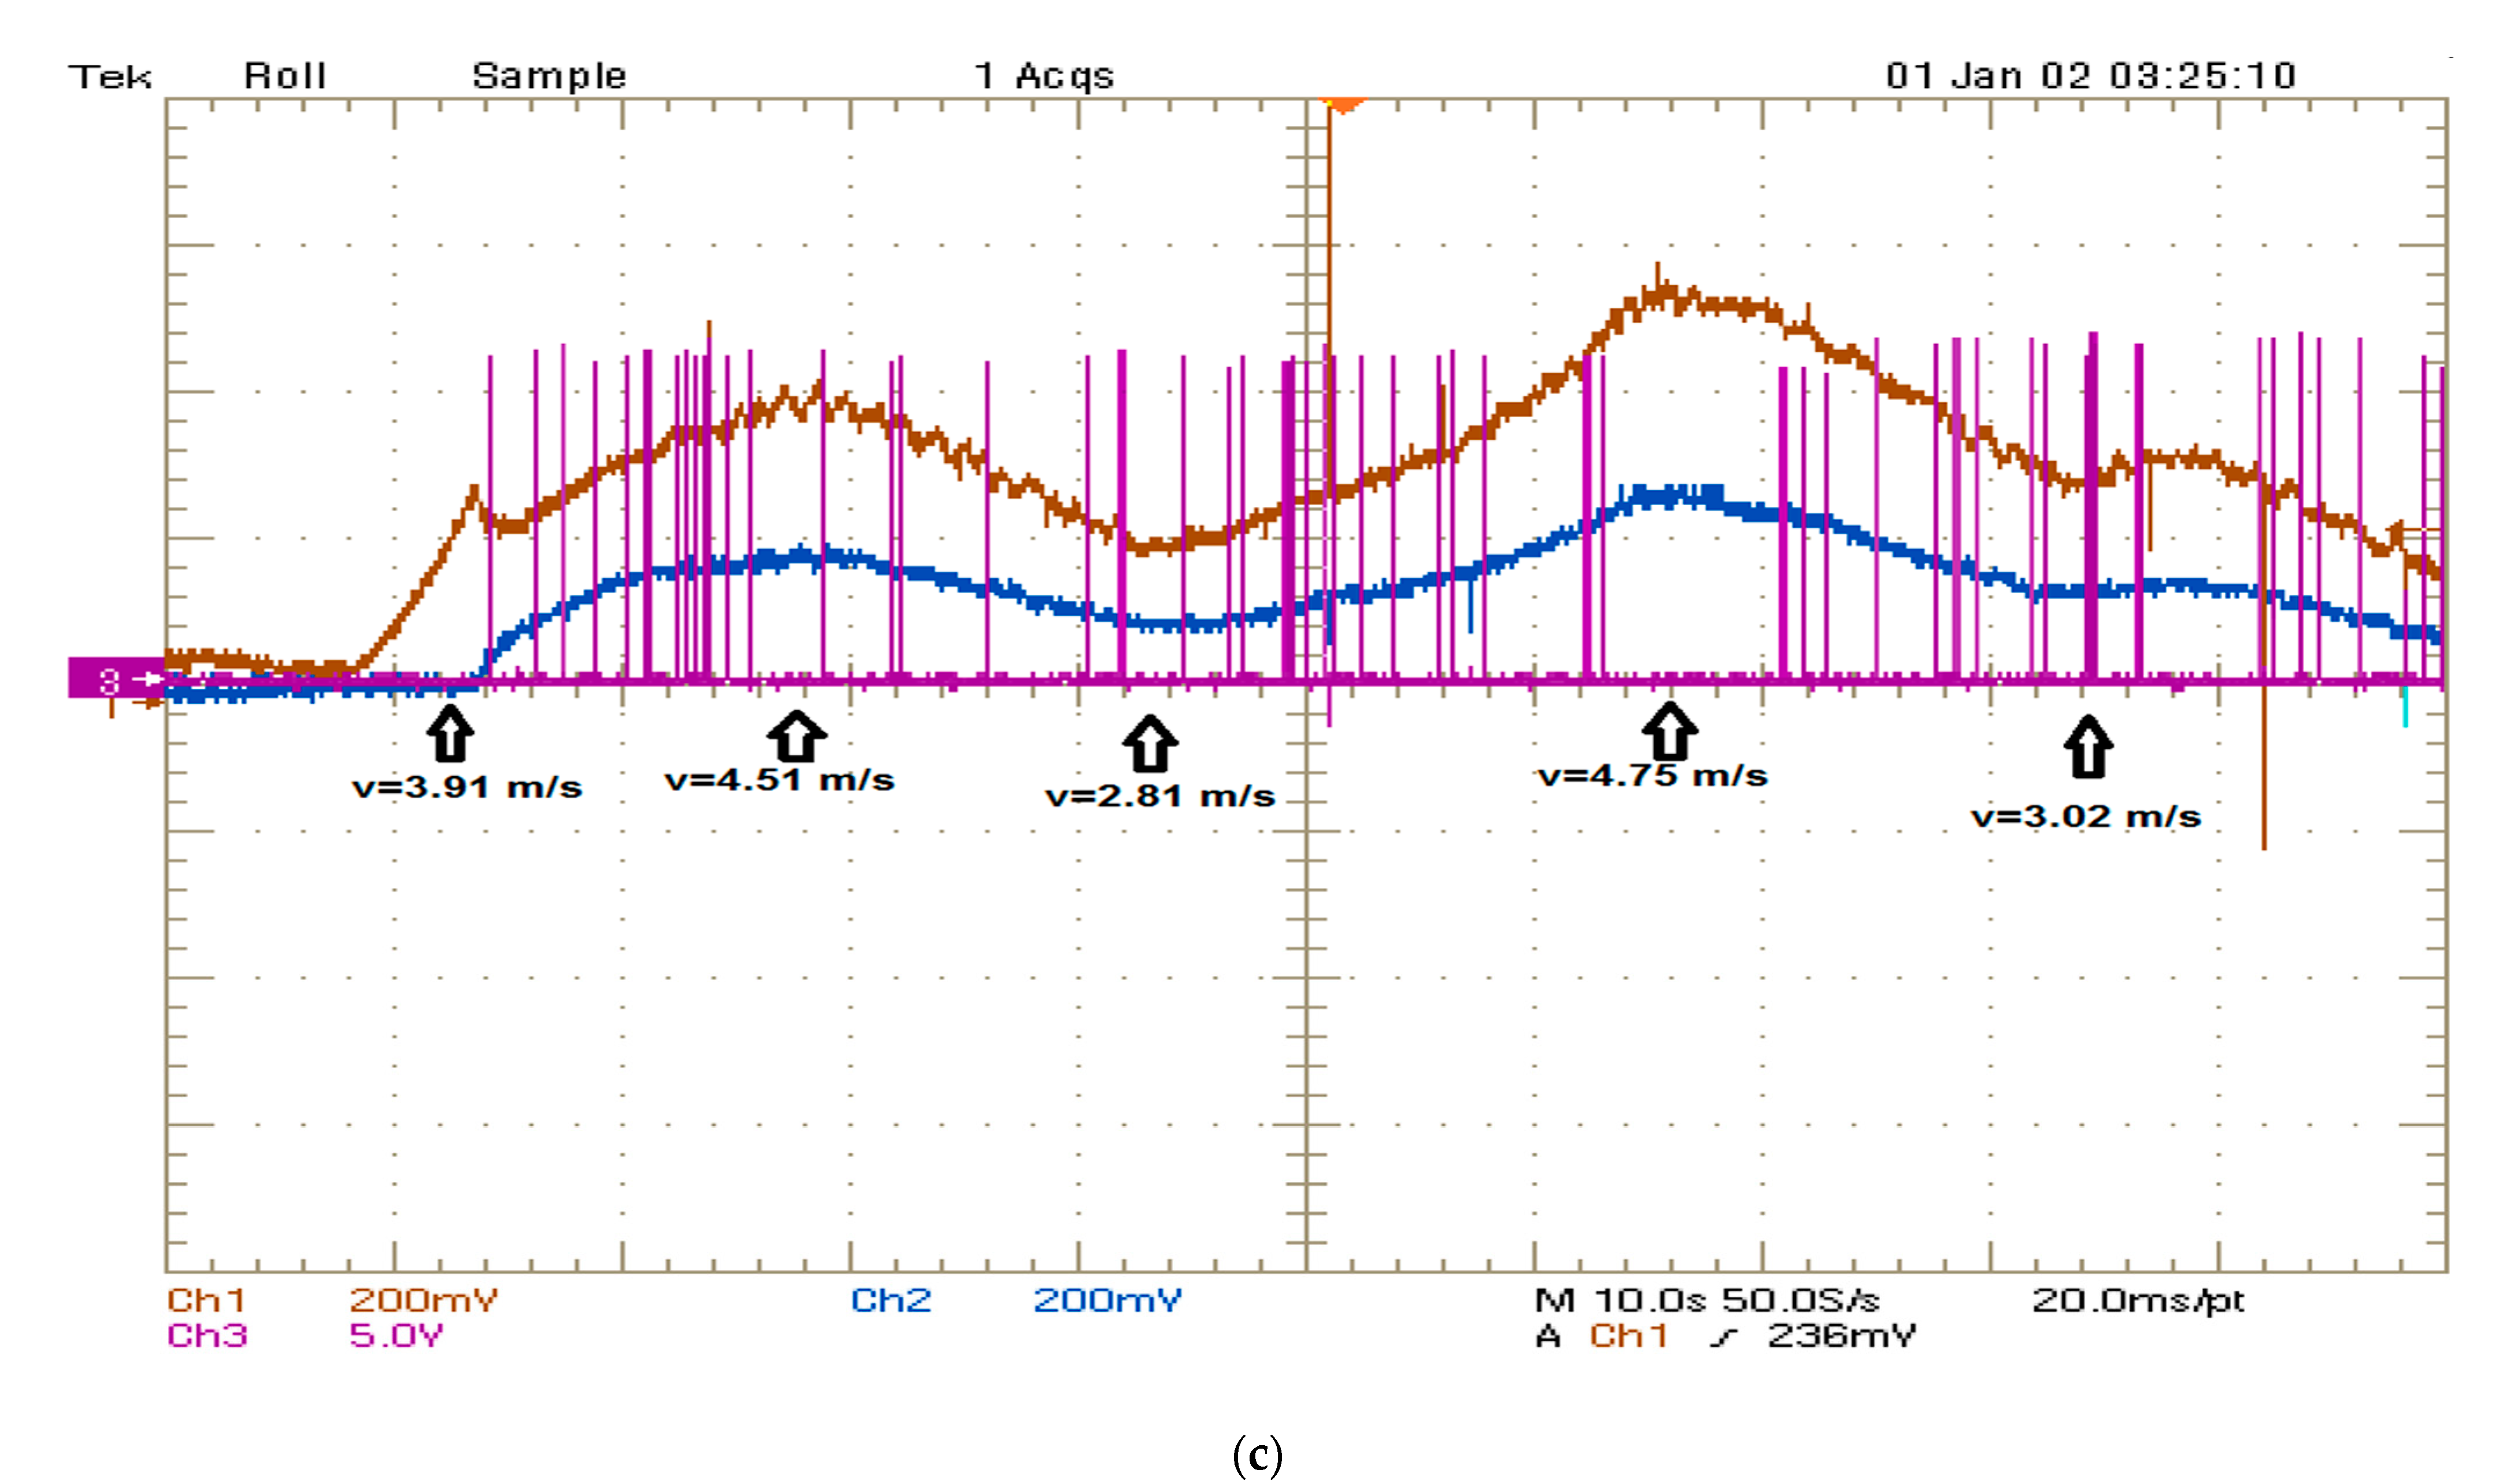
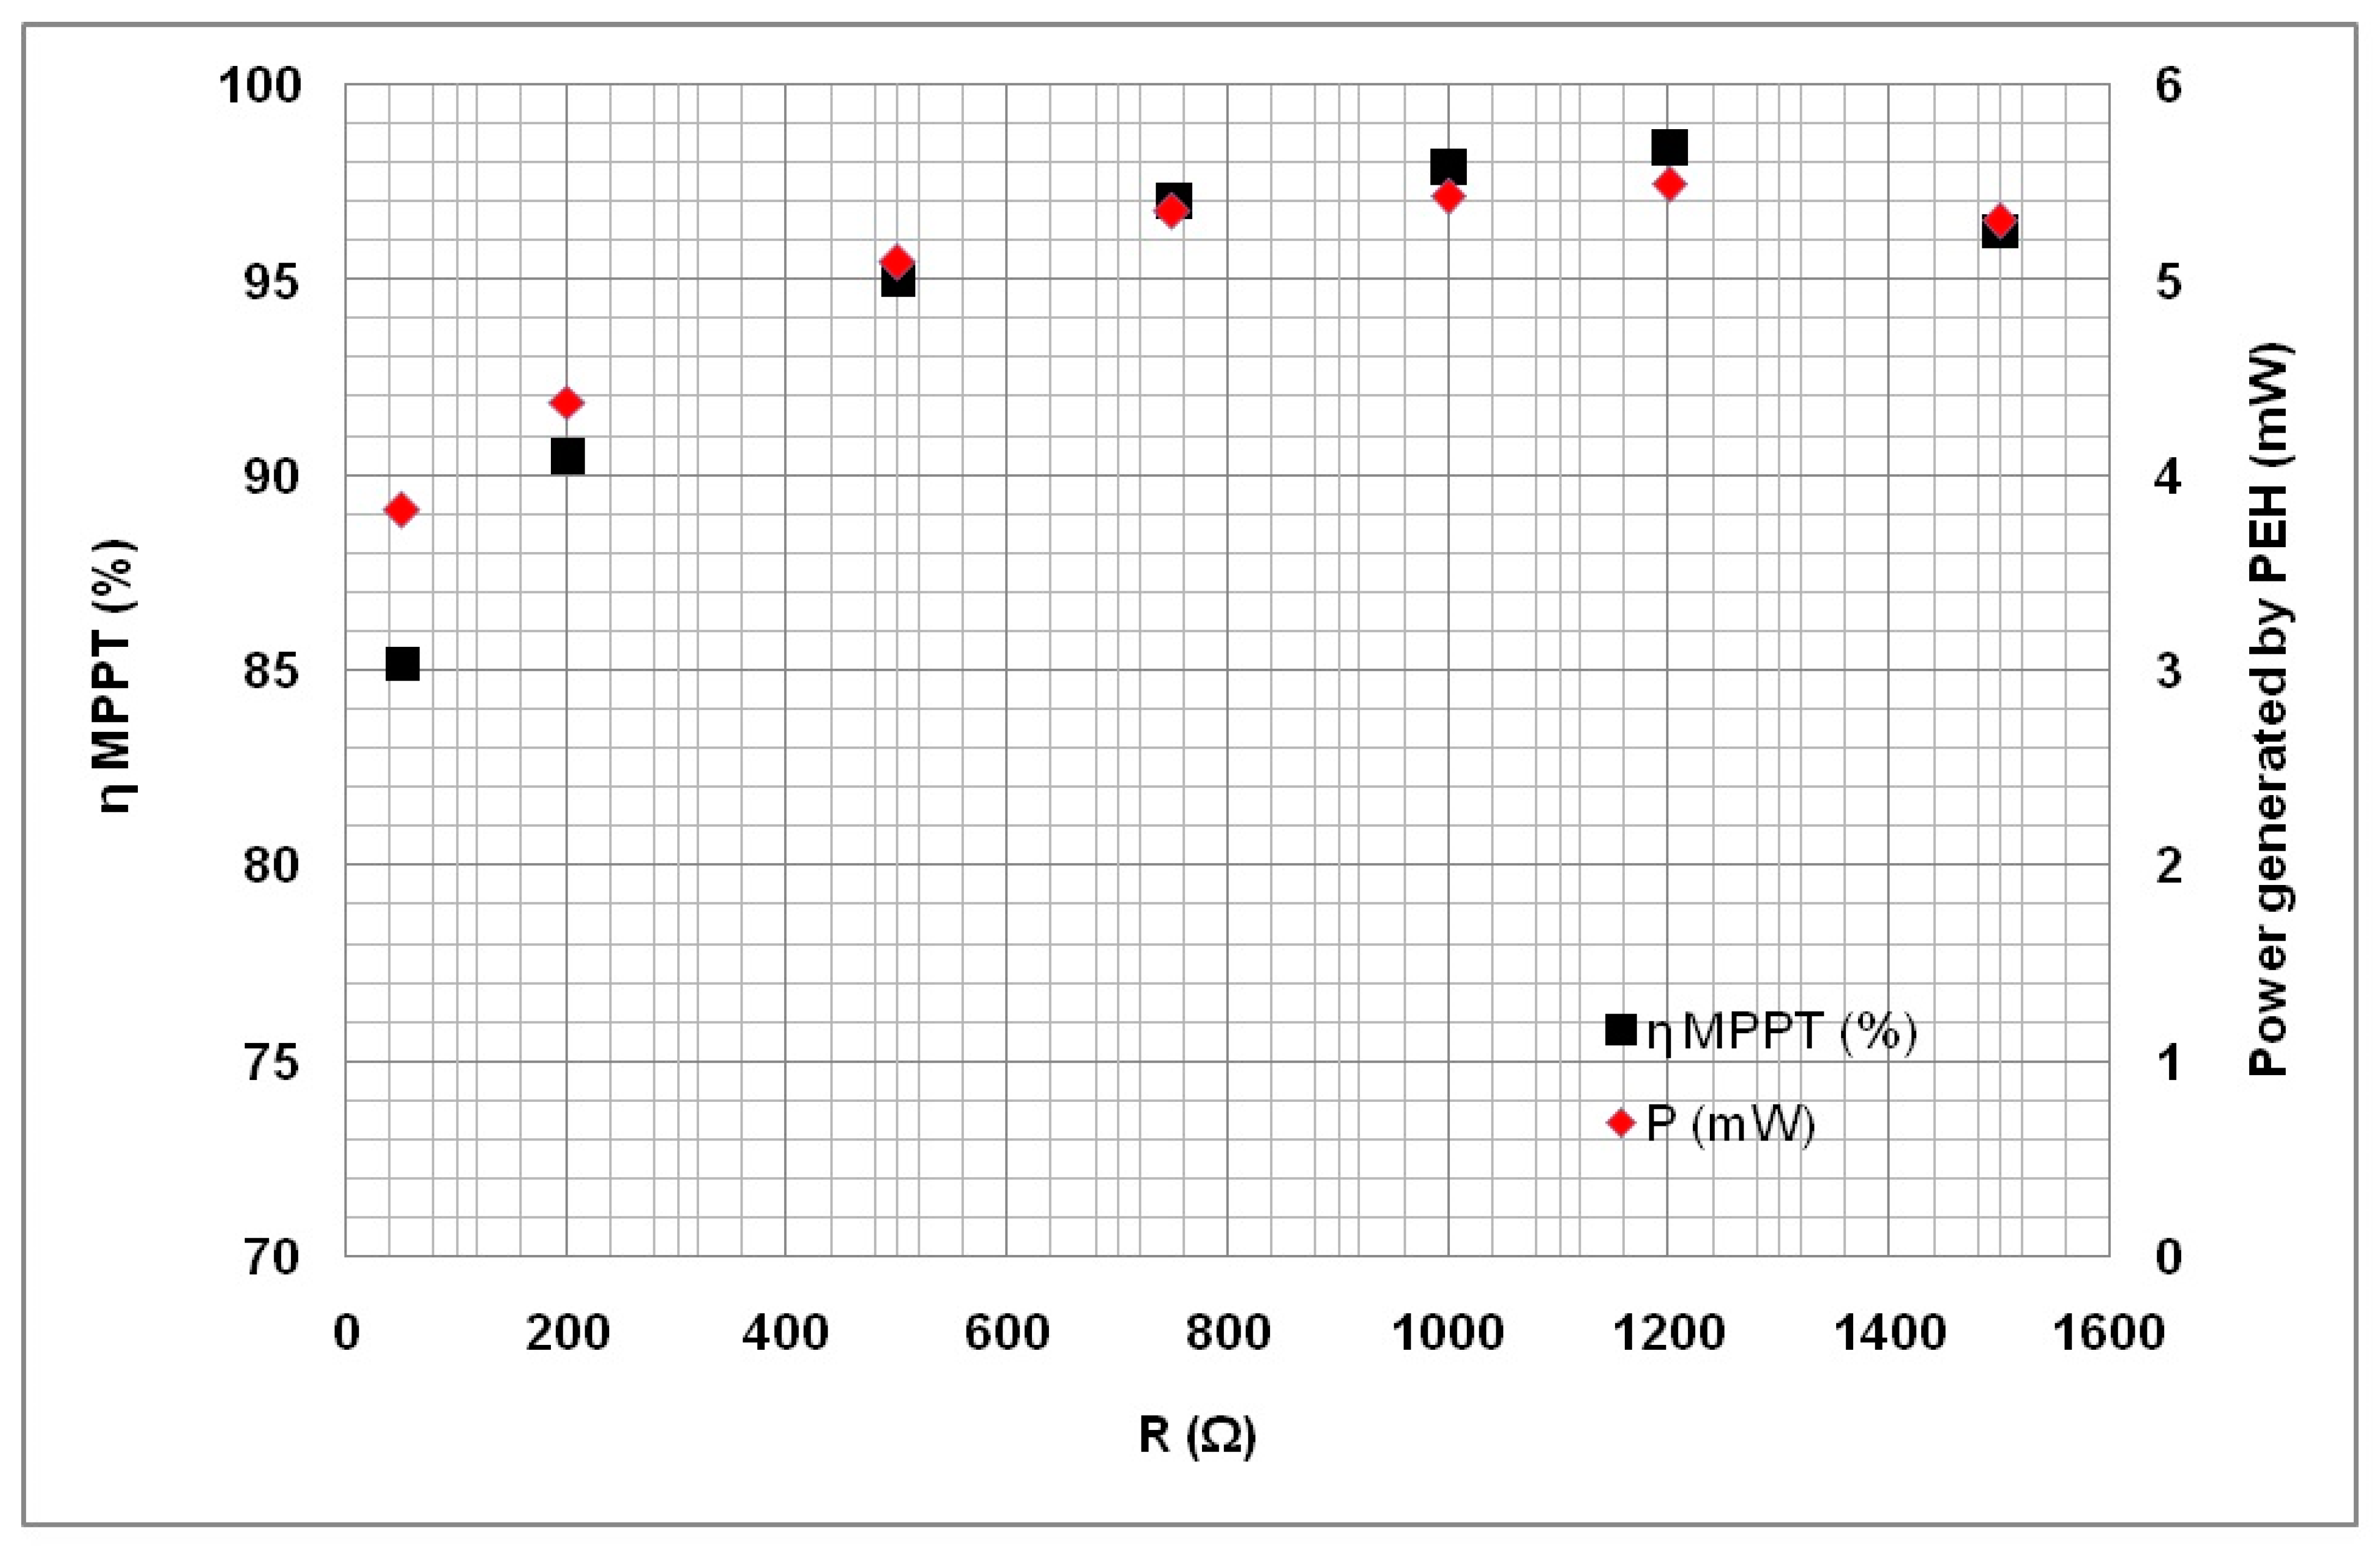
5. Experimental Results and Discussion

All the experiments have been performed in the setup shown in Figure 2. In the circuitry, the wind energy harvester, three-phase full diode bridge rectifier and filter, dc-dc buck converter, storage circuit and battery have been used. In addition, a MPPT control circuit has also been used for the optimization of the power of the system. The capacity of the capacitor and the optimal load resistance play an important role to get the maximum power from the system in such circuits. In the control circuit of the PWEH, every element has been designed and implemented into the circuitry as shown in Figure 2 and Figure 4. The experiments are performed varying wind speeds. Initially, the blades of the PWEH have been excited by a medium speed wind flow (i.e., 3 m/s). The voltage over the buck converter increases in accordance with the wind speed v. In the PWEH system, the MPP is encountered at Voc/2 as explained in Section 1. Figure 11 shows a measurement over the capacitor CS and an electrical load 100 kOhm.
Figure 11a–c prove the power variation depending on the electrical load. Although the wind speed is 4.52 m/s in Figure 11b, the wind speed 4.09 m/s in Figure 11a generates higher output voltage due to the electrical load. This is a result of so-called impedance match between the circuit and output load.
A measurement setup is required for the record of efficiency results, systematically. A variation in the electrical load significantly changes the output power. According to Figure 12, the efficiency of the PWEH can also be calculated theoretically after the determination of the maximum power. Here, the power of the equivalent circuit of the PWEH and the rectifier unit is represented as Pin and the power of the control circuit for PWEH unit is represented by Pout. Then, the ratio of the Pout/Pin provides the maximum ratio of power gain in accordance with Equation (9).
ηMPPT = (Pout/Pin) × 100%
For the maximum power transfer efficiency, there should be an optimal load value at the output. During the experimental work, several electrical loads between 50 Ohm and 1.5 kOhm have been tested. In our case, the maximum power is received at 1.2 kOhm as estimated and shown in Table 1. The experimental harvested power values and efficiencies are depicted in Figure 13 for various electrical loads. The maximum power is 5.6 mW when the inner impedance is equal to the load. According to the experiments, the efficiency becomes between 85% and 99% around the half of VOC. The experimental efficiency results in Figure 13 include the loses of the power components. Comparing the MPPT included system with the MPPT-free case, we have obtained nearly 18% power gain in most of the cases under various load conditions.
According to the experimental results, power changes between 3.82 mW and 5.49 mW. These values are close to the power values of PPWEH.
Figure 14 shows the maximum power point curves for VOC/2 versus the voltage on the CS. It is obvious that the harvested powers for various loads give different power outputs, as expected. For instance, the output power values of the lower resistances yield to 2–3 mW, however the loads such as 1.2 kOhm achieves 5.7 mW output power due to the contribution of the proposed MPPT system. Also note that the maximum power is received for the half of VOC in all cases as shown in Figure 14.
For given loads, if the output power is low without the MPPT circuit, the MPPT circuit enhances the output power. For instance, the output power 2.89 mW from the MPPT-free circuit is increased to 5.7 mW at 1.2 kOhm with 99% efficiency as shown in Figure 13. However, the efficiency decreases for lower loads such as 1 kOhm, 500 Ohm, etc., and power amount of 2.15 mW from MPPT-free circuit can be increased to 3.98 mW with 85% efficiency.

6. Conclusions

In the present study, a power optimization scheme has been applied to a new designed and developed PWEH having high harmonic distortion outputs. Although the device generates low power amount in mW scale, it can operate and harvest energy at low wind speeds compared to the conventional electromagnetic generators despite of its compact volume. The generated voltage waveforms at the output terminals of the piezoelectric layers have high THD characteristics, thereby an appropriate power optimization which does not diminish the mW scale power has been the main problem for that device. In the frame of theoretical and experimental studies, an efficient rectification and MPPT circuit combination has been designed and implemented successfully. Indeed the technique used here focuses on the Vsc = VOC/2 value for the feed-back mechanism of the MPPT. During the design and the implementation process, the harvested signals have been rectified via a full bridge rectifier and stored into a capacitor, where the charge voltage VOC/2 has been used for the maximum power generation. In the implemented system, a very low power consumption within the order of microwatts has been obtained for the control circuit. Thus, the system is ideal for low power harvesting systems.
According to the experimental tests with the wind tunnel having a variable wind speed regime, the power range of 5.7 mW has been obtained from the output terminals of the harvester system. Strictly speaking, the proposed system for the PWEH exhibits a 98.41% power efficiency with very low power consumption in the control units. According to the literature, there exist many studies including very complicated control blocks and circuits, however their power consumption is the main problem for such complicated circuit morphologies compared to ours [2,3,4,9,29,30,31]. Our tests have proven that the power consumption is only 5.29 μW and it is a good value compared to similar studies performed within the context of Hill-climbing (HC) and fractional open-circuit voltage (FOCV) methods. A power gain of 18% has been obtained compared to the MPPT-free case. The circuit is very compact with 5 cm × 8 cm dimensions and that also helps to mount the device in narrow places.

Author Contributions

Conceptualization, E.K. and D.Ö.; methodology, J.M.L.-G.; software, N.B.; validation, E.K. and J.M.L.-G.; formal analysis, D.Ö.; investigation, D.Ö.; resources, E.K.; data curation, D.Ö.; writing—original draft preparation, E.K.; writ-ing—review and editing, N.B. and J.M.L.-G.; visualization, E.K.; supervision, E.K.; project administration, E.K.; funding acquisition, E.K. and D.Ö. All authors have read and agreed to the published version of the manuscript.

Funding

The Scientific and Technological Research Council of Turkey (TUBITAK), grant number 114E017.

Institutional Review Board Statement

There was no involvement of humans or animals as the scientific object during the work.

Informed Consent Statement

Not applicable.

Data Availability Statement

Not applicable.

Conflicts of Interest

No conflict of interest.

References

  1. Bizon, N.; Tabatabaei, N.M.; Blaabjerg, F.; Kurt, E. Energy harvesting and energy efficiency. In Technology, Methods, and Applications; Springer: Berlin/Heidelberg, Germany, 2017. [Google Scholar]
  2. Kurt, E.; Mutlu, B.; Bizon, N.; Guede, J.M.L. Design and fabrication of a new micro-power scaled electromagnetic harvester. J. Energy Syst. 2019, 3, 51–66. [Google Scholar] [CrossRef] [Green Version]
  3. Kong, N.; Ha, D.S. Low-Power Design of a Self-powered Piezoelectric Energy Harvesting System with Maximum Power Point Tracking. IEEE Trans. Power Electron. 2011, 27, 2298–2308. [Google Scholar] [CrossRef]
  4. Kim, H.; Kim, S.; Kwon, C.-K.; Min, Y.-J.; Kim, C.; Kim, S.-W. An Energy-Efficient Fast Maximum Power Point Tracking Circuit in an 800-μW Photovoltaic Energy Harvester. IEEE Trans. Power Electron. 2013, 28, 2927–2935. [Google Scholar] [CrossRef]
  5. Shim, M.; Kim, J.; Jeong, J.; Park, S.; Kim, C. Self-powered 30 μW to 10 mW piezoelectric energy harvesting system with 9.09 ms/V maximum power point tracking time. IEEE J. Solid State Circ. 2015, 50, 2367–2379. [Google Scholar] [CrossRef]
  6. Chowdary, G.; Singh, A.; Chatterjee, S. An 18 nA, 87% Efficient Solar, Vibration and RF Energy-Harvesting Power Management System With a Single Shared Inductor. IEEE J. Solid State Circuits 2016, 51, 2501–2513. [Google Scholar] [CrossRef]
  7. Montecucco, A.; Knox, A.R. Maximum Power Point Tracking Converter Based on the Open-Circuit Voltage Method for Thermoelectric Generators. IEEE Trans. Power Electron. 2014, 30, 828–839. [Google Scholar] [CrossRef]
  8. Celik, K.; Kurt, E. A novel meander line integrated E-shaped rectenna for energy harvesting applications. Int. J. RF Microw. Comput. Aid. Eng. 2019, 29, e21627. [Google Scholar] [CrossRef]
  9. Shu, Y.C.; Lien, I.C.; Wu, W.J. An improved analysis of the SSHI interface in piezoelectric energy harvesting. Smart Mater. Struct. 2007, 16, 2253–2264. [Google Scholar] [CrossRef]
  10. Weddell, A.; Merrett, G.V.; Al-Hashimi, B.M. Photovoltaic Sample-and-Hold Circuit Enabling MPPT Indoors for Low-Power Systems. IEEE Trans. Circuits Syst. I Regul. Pap. 2011, 59, 1196–1204. [Google Scholar] [CrossRef] [Green Version]
  11. Tabesh, A.; Frechette, L.G. A Low-Power Stand-Alone Adaptive Circuit for Harvesting Energy from a Piezoelectric Micropower Generator. IEEE Trans. Ind. Electron. 2010, 57, 840–849. [Google Scholar] [CrossRef] [Green Version]
  12. Ottman, G.K.; Hofmann, H.F.; Bhatt, A.C.; Lesieutre, G.A. Adaptive piezoelectric energy har-vesting circuit for wireless remote power supply. IEEE Trans. Power Electron. 2002, 17, 669–676. [Google Scholar] [CrossRef] [Green Version]
  13. Gasnier, P.; Willemin, J.; Boisseau, S.; Despesse, G.; Condemine, C.; Gouvernet, G.; Chaillout, J.J. An autonomous piezoelectric energy harvesting IC based on a synchronous multi-shot technique. IEEE J. Solid-State Circ. 2014, 49, 1561–1570. [Google Scholar] [CrossRef]
  14. Chew, Z.J.; Zhu, M. Adaptive maximum power point finding using direct VOC/2 tracking method with microwatt power consumption for energy harvesting. IEEE Trans. Power Electr. 2018, 33, 8164–8173. [Google Scholar] [CrossRef] [Green Version]
  15. Kurt, E.; Cottone, F.; Uzun, Y.; Orfei, F.; Mattarelli, M.; Özhan, D. Design and implementation of a new contactless triple piezoelectrics wind energy harvester. Int. J. Hydrog. Energy 2017, 42, 17813–17822. [Google Scholar] [CrossRef]
  16. Kurt, E.; Uzun, Y. Nonlinear problems in piezoelectric harvesters undermagnetic field. In Energy Harvesting and Energy Efficiency; Springer: Berlin/Heidelberg, Germany, 2017. [Google Scholar]
  17. Uzun, Y.; Kurt, E.; Kurt, H.H. Explorations of displacement and velocity nonlinearities and their effects to power of a magnetically-excited piezoelectric pendulum. Sens. Actuators A Phys. 2015, 224, 119–130. [Google Scholar] [CrossRef]
  18. Celik, K.; Kurt, E.; Uzun, Y. Experimental and theoretical explorations on thebuckling piezoelectric layer under magnetic excitation. J. Electron. Mater. 2017, 46, 4003–4016. [Google Scholar] [CrossRef]
  19. Bouzelata, Y.; Altin, N.; Chenni, R.; Kurt, E. Exploration of optimal design and performance of a hybrid wind-solar energy system. Int. J. Hydrog. Energy 2016, 41, 12497–12511. [Google Scholar] [CrossRef]
  20. Bouzelata, Y.; Altin, N.; Chenni, R.; Kurt, E. Design and simulation of a unified power quality conditioner fed by solar energy. Int. J. Hydrog. Energy 2015, 40, 15267–15277. [Google Scholar] [CrossRef]
  21. Wang, C.; Xiao, L.; Zheng, X.; Lv, L.; Xu, Z.; Jiang, X. Analysis, Measurement, and Compensation of the System Time Delay in a Three-Phase Voltage Source Rectifier. IEEE Trans. Power Electron. 2015, 31, 6031–6043. [Google Scholar] [CrossRef]
  22. Büyük, M.; Tan, A.; Tümay, M.; Bayındır, K. Çağatay Topologies, generalized designs, passive and active damping methods of switching ripple filters for voltage source inverter: A comprehensive review. Renew. Sustain. Energy Rev. 2016, 62, 46–69. [Google Scholar] [CrossRef]
  23. Berzoy, A.; Elsayed, A. Mohammed, Improved design of controlled rectifier for reduced ripple resulting from integration of DC loadsto AC systems. IEEE PES Gen. Meet. Conf. Expos. 2014. [Google Scholar] [CrossRef]
  24. Kim, J.; Choi, J.; Hong, H. Output LC filter design of voltage source inverter considering the perfor-mance of controller. IEEE Proc. Int. Conf. Power Syst. Technol. Power. Con. 2000, 1659–1664. [Google Scholar]
  25. Bouzelata, Y.; Kurt, E.; Altın, N.; Chenni, R. Design and simulation of a solar supplied multifunc-tional active power filter and a comparative study on the current-detection algorithms. Ren. Sust. Energy Rev. 2015, 43, 1114–1126. [Google Scholar] [CrossRef]
  26. Lee, K.-M.; Lee, S.-W.; Choi, Y.-G.; Kang, B. Active Balancing of Li-Ion Battery Cells Using Transformer as Energy Carrier. IEEE Trans. Ind. Electron. 2017, 64, 1251–1257. [Google Scholar] [CrossRef]
  27. Uzun, Y.; Demirbaş, S.; Kurt, E. Implementation of a new contactless piezoelectric wind energy har-vester to a wireless weather station. Elektron. Elektrotech. 2014, 20, 35–39. [Google Scholar] [CrossRef]
  28. Faria, R.; Marques, P.; Garcia, R.; Moura, P.; Freire, F.; Delgado, J.; de Almeida, A.T. Primary and sec-ondary use of electric mobility batteries from a life cycleperspective. J. Power Sourc. 2014, 262, 169–179. [Google Scholar] [CrossRef]
  29. Doerffel, D.; Sharkh, S.A. A critical review of using the Peukert equation for determining the remaining capacity of lead acid and lithium-ion batteries. J. Power Sourc. 2006, 155, 395–400. [Google Scholar] [CrossRef]
  30. Islam, H.; Mekhilef, S.; Shah, N.; Soon, T.; Wahyudie, A.; Ahmed, M. Improved Proportional-Integral Coordinated MPPT Controller with Fast Tracking Speed for Grid-Tied PV Systems under Partially Shaded Conditions. Sustainability 2021, 13, 830. [Google Scholar] [CrossRef]
  31. Abo-Khalil, A.; Alghamdi, A. MPPT of Permanent Magnet Synchronous Generator in Tidal Energy Systems Using Support Vector Regression. Sustainability 2021, 13, 2223. [Google Scholar] [CrossRef]
Figure 1. The 3D design of the piezoelectric wind energy harvester (PWEH).
Sustainability 13 07709 g001
Figure 2. (a) Experimental setup in process for 6 m/s wind speed, (b) converter, (c) MPPT and microcontroller units.
Sustainability 13 07709 g002aSustainability 13 07709 g002b
Figure 3. The overall operation diagram for the PWEH.
Sustainability 13 07709 g003
Figure 4. Schematic for detailed simulation of the MPPT control circuit for piezoelectric wind energy harvester. In case of storage, RL electrical load is replaced by the battery.
Sustainability 13 07709 g004
Figure 5. Experimental waveforms of piezoelectric layers (VPZ1, VPZ2, VPZ3), for wind tunnel speeds at (a) 2.7 m/s, (b) 3.5 m/s, and (c) 6.1 m/s. (d) After the connection to the MPPT circuit. (e) Sample FFT of the Phase A (blue) waveform in (a) with 168 % THD.
Sustainability 13 07709 g005aSustainability 13 07709 g005bSustainability 13 07709 g005c
Figure 6. A sample experimental waveform of the rectified voltage Vrect at wind speed 6 m/s.
Sustainability 13 07709 g006
Figure 7. Sample waveform of VOC from simulation.
Sustainability 13 07709 g007
Figure 8. Flow chart of the MPPT algorithm.
Sustainability 13 07709 g008
Figure 9. Variation of the buck converter output voltage Vsc during the MPPT controller procedure in the simulation.
Sustainability 13 07709 g009
Figure 10. Simulated duty cycle in volts for MPPT control circuit.
Sustainability 13 07709 g010
Figure 11. Real waveforms of VOC (brown) and VOC/2 (blue) for different electrical loads: (a) 100 kOhm, (b) 50 kOhm (c) The PWM signal (pink), VOC (brown) and VOC/2 (blue) for 100 kOhm. The wind velocities are denoted in figures.
Sustainability 13 07709 g011aSustainability 13 07709 g011b
Figure 12. Efficiency measurement setup.
Sustainability 13 07709 g012
Figure 13. Experimental power and efficiency values versus resistive load.
Sustainability 13 07709 g013
Figure 14. Maximum power point based power generation for different resistive loads.
Sustainability 13 07709 g014
Table 1. Parameters for the optimized operation of the MPPT controller. In case of storage, RL electrical load is replaced by the battery.
Item Description Values
PZT layer parameters1.4 g26 nF380 N/m0.12 N275 Hz
Output filter, Lf, Cf0.7 mH70 mF
Buck converter Switch, Lc, Cs, RsMOSFET0.3 mH1.85 mF50 Ω
MPPT controller unit Voc, Vsc, switching frequency72 V12 V10 KHz
Load Resistance1.2 kOhms
Type of the batteryLead-acid.
Battery nominal voltage, Battery rated capacity12 V, 6.5 Ah,
Maximum capacity, fully charged voltage6.825 Ah, 12.6 V
Nominal discharge current0.1837 A
Internal resistance of battery0.018462 Ω
Publisher’s Note: MDPI stays neutral with regard to jurisdictional claims in published maps and institutional affiliations.

