
The Role of Embodied Carbon Databases in the Accuracy of Life Cycle Assessment (LCA) Calculations for the Embodied Carbon of Buildings


Abstract
:1. Introduction
1.1. Embodied Energy and Embodied Carbon
1.2. Embodied Carbon Calculations
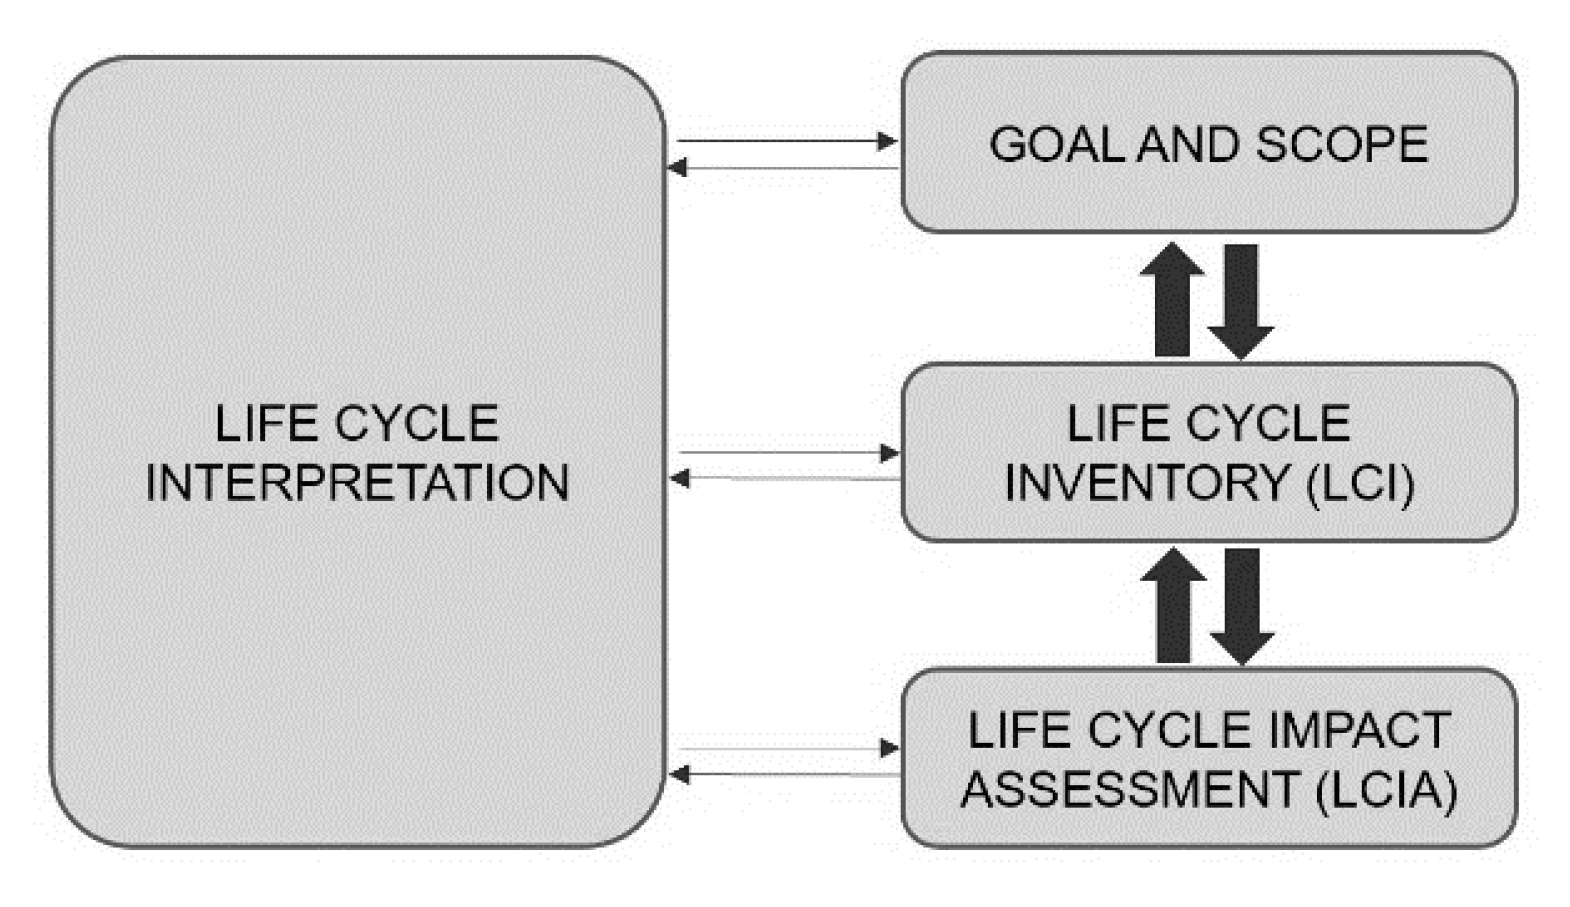
1.2.1. LCA Methodology (A1–A3, A1–A5)
1.2.2. A1–A3 Calculation
1.2.3. Embodied Carbon Factor (ECF) Databases
- Environmental Product Declarations (EPD) [11];
- Industry data;
- Government data;
- Factor from commercial LCA database (ICE database);
- PAS 2050 compliant carbon footprint;
- Factor derived/aggregated from literature.
2. Methodology
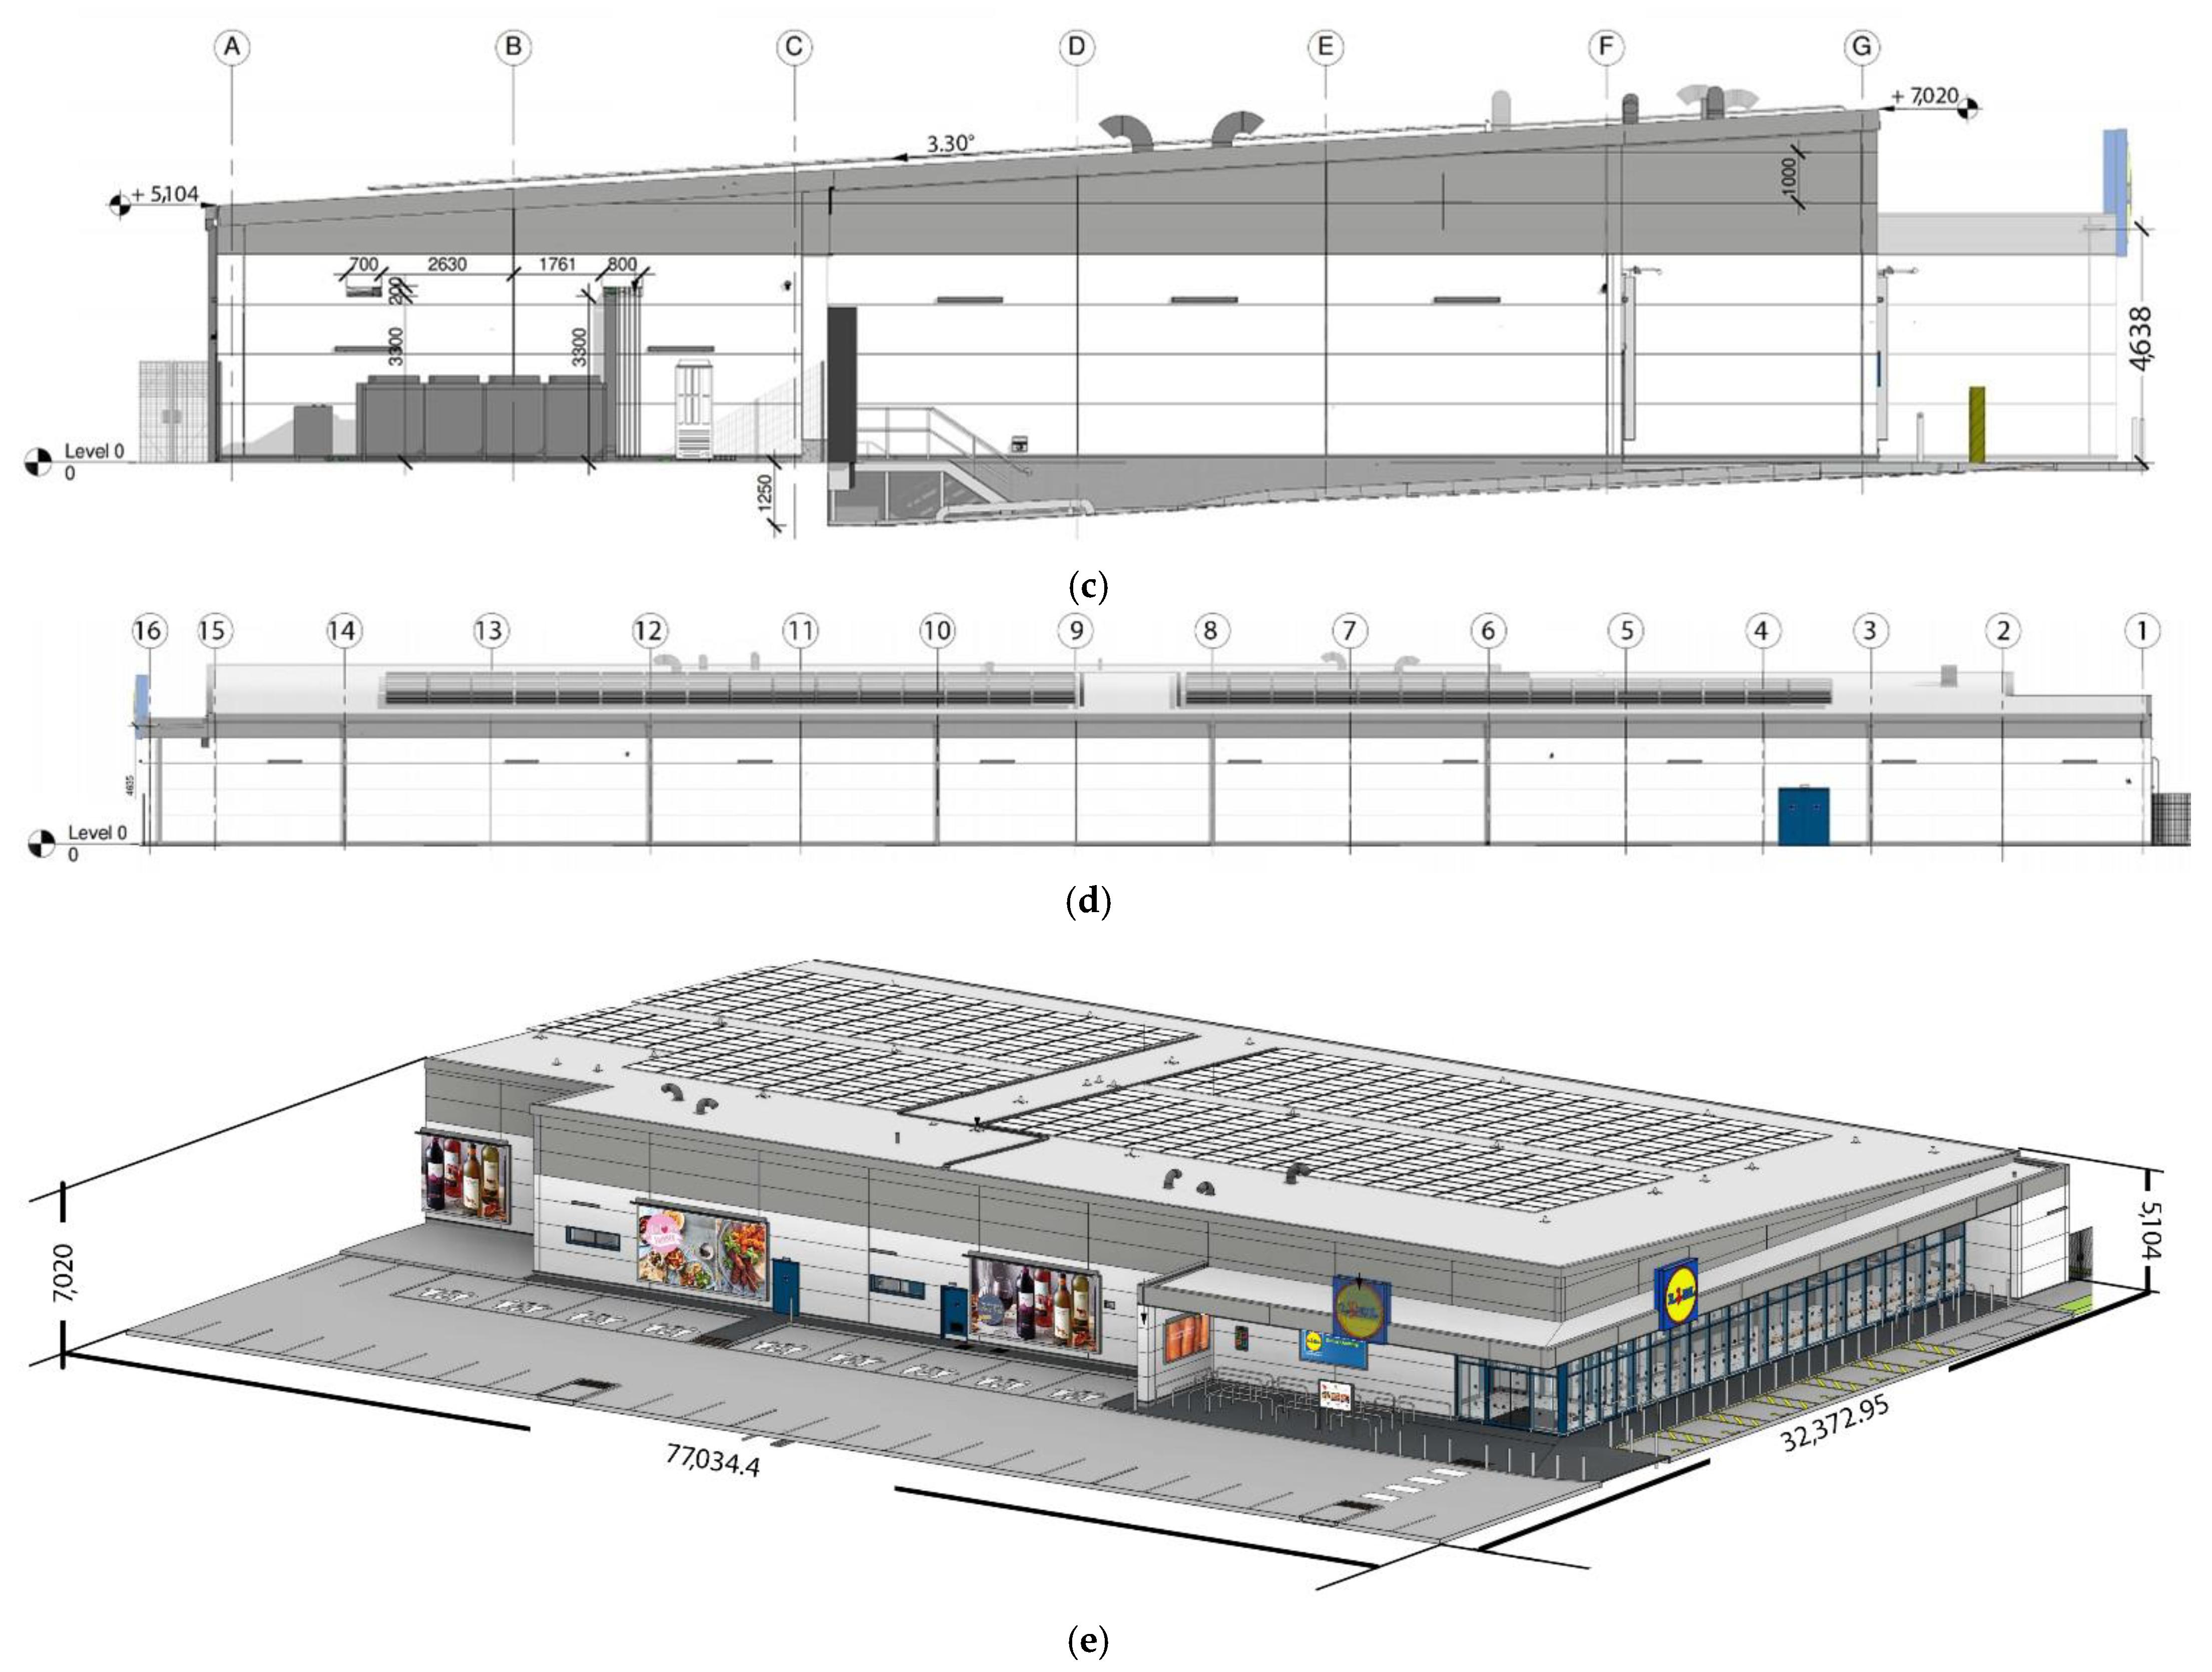
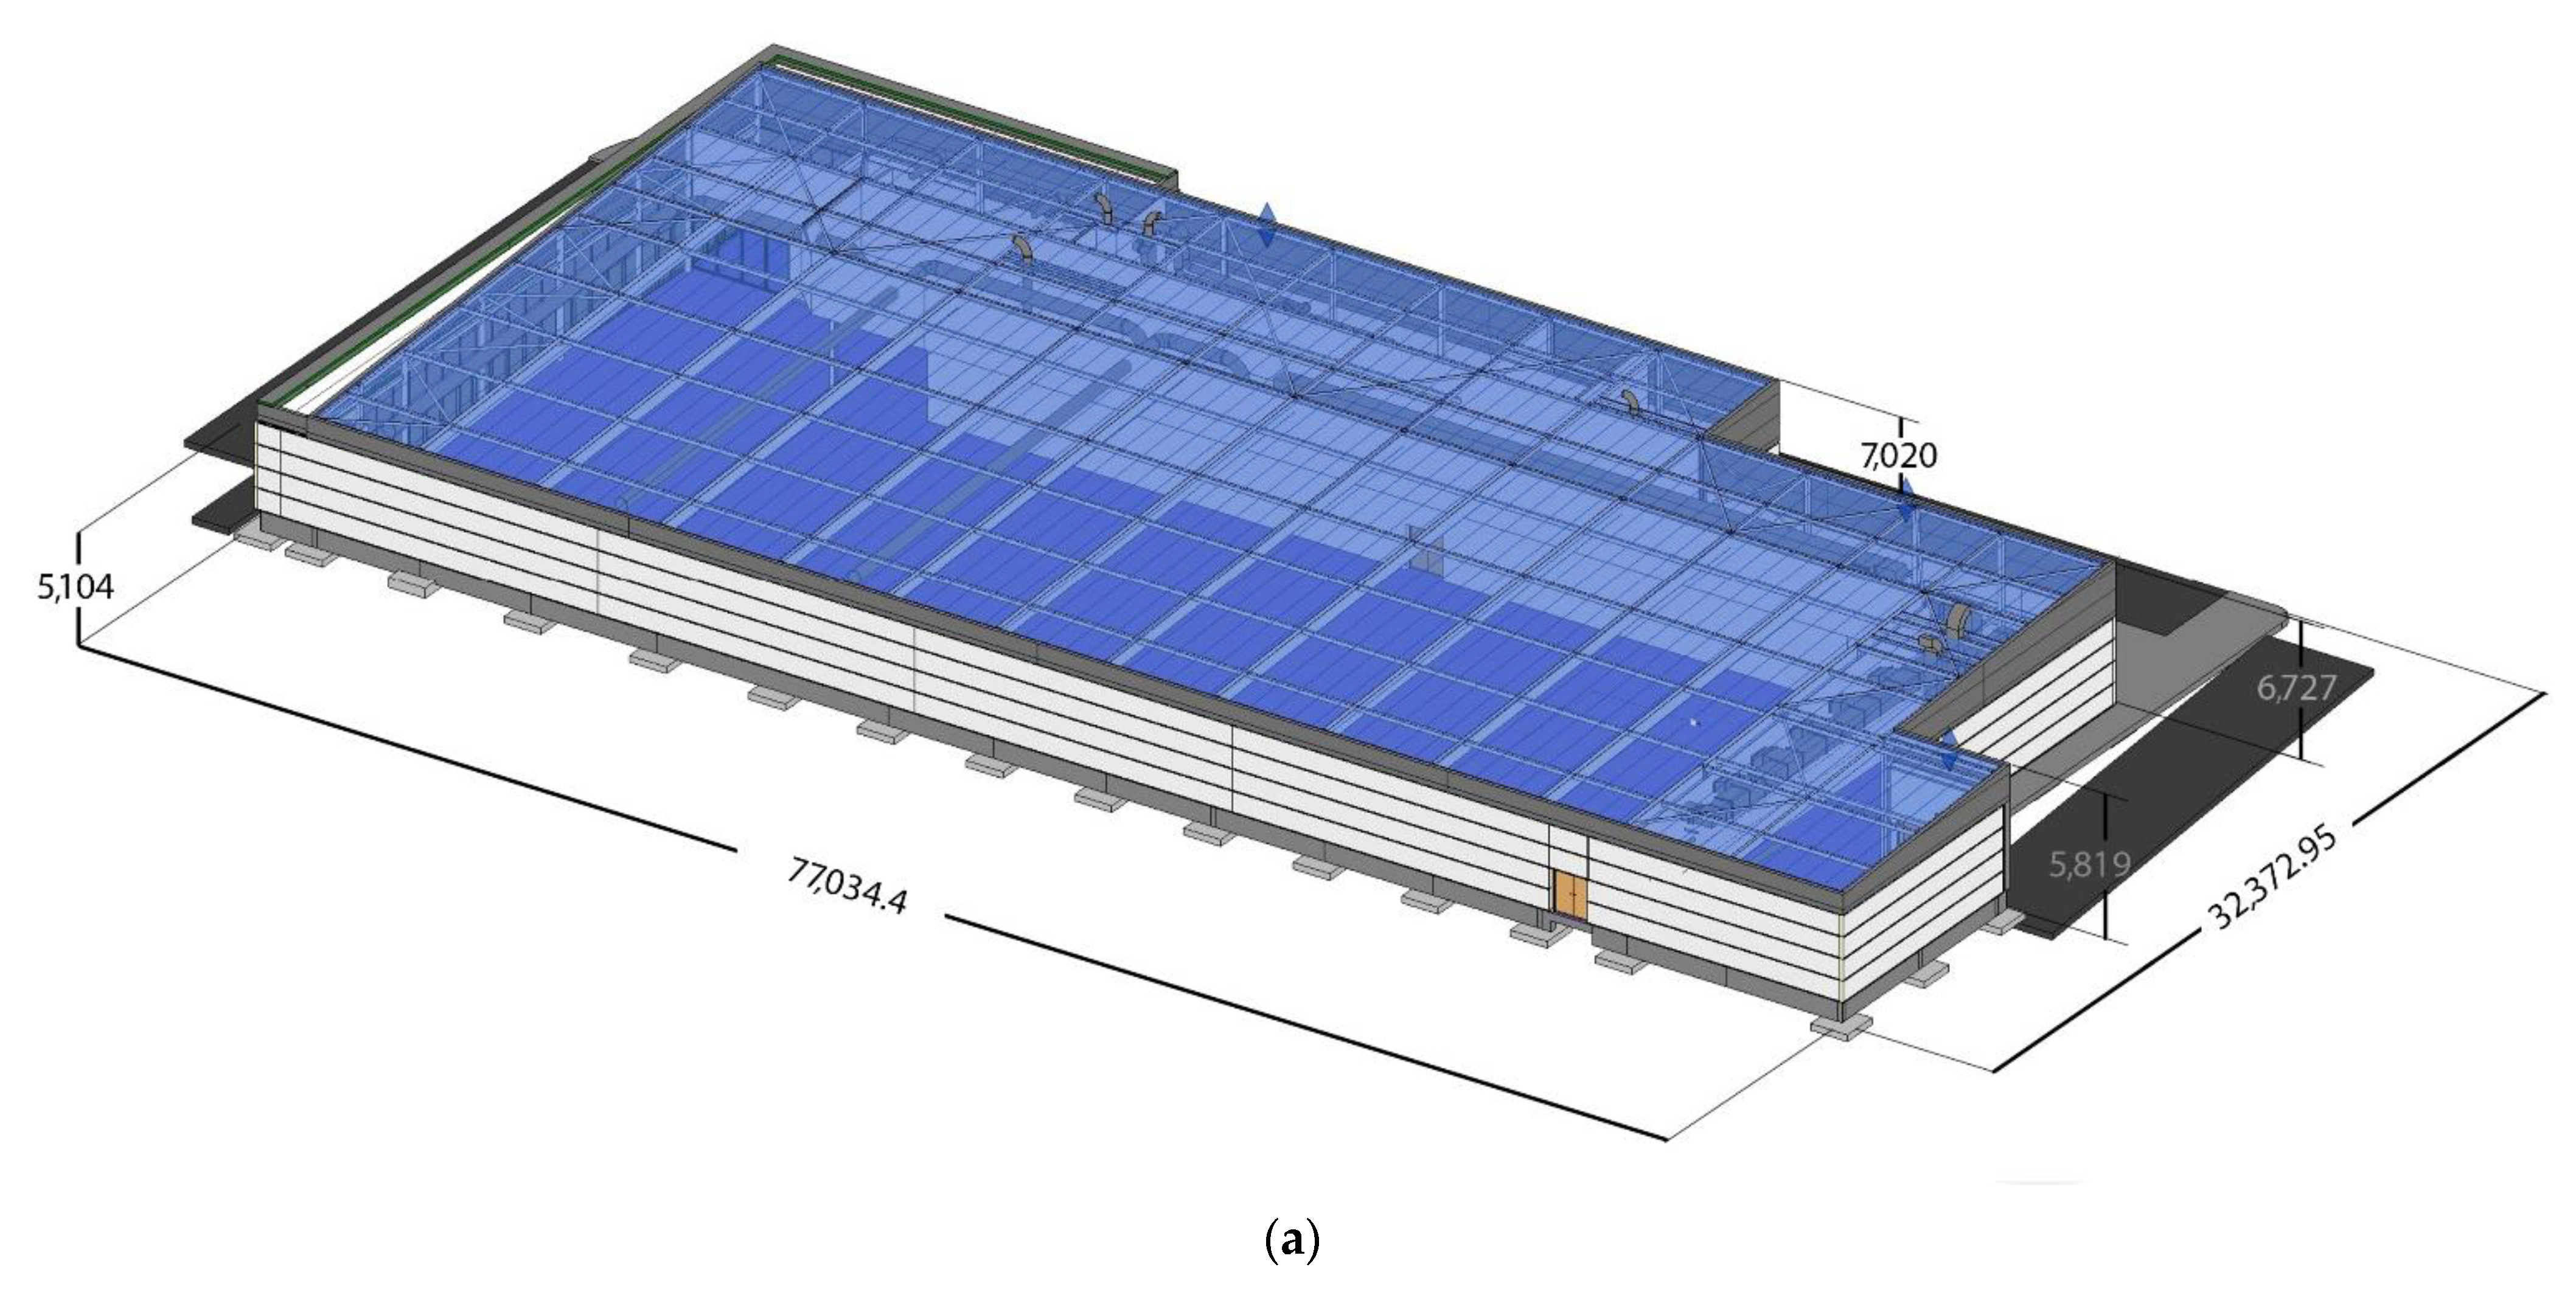
2.1. Revit® Building Information Modelling (BIM)
- Manufacturer-provided BIM building material;
- Manual recreation of BIM building material according to manufacturer details;
- Manual recreation of BIM building material according to plan specifications;
- Generic/Default materials.
BIM Delimitations
2.2. Material Weight
2.3. Embodied Carbon Calculations
3. Results and Discussion
4. Conclusions and Future Work
Author Contributions
Funding
Data Availability Statement
Conflicts of Interest
References
- UNEP. 2019 Global Status Report for Buildings and Construction Sector. 11 December 2019. Available online: https://www.unenvironment.org/resources/publication/2019-global-status-report-buildings-and-construction-sector (accessed on 1 December 2020).
- Pomponi, F.; de Wolf, C.; Moncaster, A. Embodied Carbon in Buildings, 1st ed.; Springer: Cham, Switzerland, 2018. [Google Scholar]
- Roberts, M.; Allen, S.; Coley, D. Life cycle assessment in the building design process—A systematic Literature review. Build. Environ. 2020, 185, 107274. [Google Scholar] [CrossRef]
- Kotaji, S.; Edwards, S.; Schuurmans, A. Life Cycle Assessment in Building and Construction: A State-of-the-Art Report; SETAC Press: Brussels, Belgium, 2003. [Google Scholar]
- Nassen, J.; Holmberg, J.; Wadeskok, A.; Nyman, M. Direct and indirect energy use and carbon emissions in the production phase of buildings: An input-output analysis. Energy 2007, 32, 1593–1602. [Google Scholar] [CrossRef]
- Ibn-Mohammed, T.; Greenougha, R.; Taylor, S.; Ozawa-Meidaa, L.; Acquayec, A. Operational vs embodied emissions in buildings—A review of current trends. Energy Build. 2013, 66, 232–245. [Google Scholar] [CrossRef]
- Negm, A.M.; AbdelMontaleb, A.; Bady, M.F. Estimating Carbon Emissions from Industrial Process by Using Life Cycle Assessment Too; Egypt-Japan University of Science and Technology: Alexandria, Egypt, 2013. [Google Scholar]
- Gibbons, O.P.; Orr, J.J. How to Calculate Embodied Carbon (Istructe); The Institution of Structural Engineers: London, UK, 2020. [Google Scholar]
- UK Department of Energy & Climate Change. “Gov.uk”. 5 October 2020. Available online: https://www.gov.uk/government/publications/greenhouse-gas-reporting-conversion-factors-2020 (accessed on 4 May 2021).
- Yohanis, Y.; Norton, B. Life Cycle operational and embodied energy for a generic single-story office building in the UK. Energy 2002, 22, 77–92. [Google Scholar] [CrossRef]
- Butcher, K. Embodied Carbon in Building Services—A Calculation Methodology—CIBSE TM 65; Chartered Institution of Building Services Engineers: London, UK, 2021. [Google Scholar]
- ISO. Environmental Management—Life Cycle Assessment—Requirements and Guidelines. ISO 14044; International Organization for Standardization: Geneva, Switzerland, 2006. [Google Scholar]
- ISO. ISO 14044:2006/AMD 2:2020—Environmental Management—Life Cycle Assessment—Requirements and Guidelines—Amendment 2; International Organization for Standardization: Geneva, Switzerland, 2020. [Google Scholar]
- ISO. ISO 14040:1997 Environmental Management—Life Cycle Assessment—Principles and Framework; International Organization for Standardization: Geneva, Switzerland, 1997. [Google Scholar]
- Hsu, S.; Ochsendorf, J.; Veneziano, D. Life Cycle Assessment of Materials and Construction in Commercial Structures: Variability and Limitations. Ph.D. Thesis, Massachusetts Institute of Technology, Cambridge, MA, USA, 2010. [Google Scholar]
- Omar, W.M.S.W.; Doh, J.H.; Panuwatwanish, K.; Miller, D. Assessment of the embodied carbon in precast concrete wall panels using a hybrid life cycle assessment approach in Malaysia. Sustain. Cities Soc. 2014, 10, 101–111. [Google Scholar] [CrossRef] [Green Version]
- Richardson, S. Embodied Carbon Assessment and Decision Making Under Uncertainty: Case Studies of UK Supermarket Construction; University of Reading: Reading, UK, 2017. [Google Scholar]
- Anderson, J. Constructionlca’s Guide to EPD—Infogram, Charts & Inforgraphics. 2017. Available online: http://infogr.am/47216efb-7256-4a5e-acc3-04ce046cbdf8 (accessed on 3 May 2021).
- Anderson, J. Greenspec. 2020. Available online: https://www.greenspec.co.uk/building-design/embodied-energy/ (accessed on 22 April 2021).
- Jones, G.H.C. Embodied Carbon—The ICE Database. November 2019. Available online: https://circularecology.com/embodied-carbon-footprint-database.html (accessed on 28 January 2021).
- Rogers, P.; Murray, J.; Cain, M.; Hussey, L.; James, B.; Lane, B.; Robertson, C.; Simpson, M. Specification for Sheet metal Ductwork: Low, Medium and High. Pressure/Velocity Air Systems; Publications BESA Publications: Penrith, Cumbri, 2016. [Google Scholar]
- Ecofys, Fraunhofer Institute for Systems and Innovation Research; Öko-Institut. Methodology for the Free Allocation of Emission Allowances in the EU—Sector Report for the Mineral. Wool Industry; European Commission: Brussels, Belgium, 2012. [Google Scholar]
- Crawford, R.; Stephan, A.; Prideaux, F. EPiC Database—Polymethyl Methacrylate (PMMA); University of Melbourne: Melbourne, Australia, 2019. [Google Scholar]
- Nazari, A. Handbook of Low Carbon Concrete; Butterworth-Heinemann: Amsterdam, The Netherlands, 2016. [Google Scholar]


| Building Element | Structural Element | Component | Component Details |
|---|---|---|---|
| Substructure | Floors | Floor | Floor: Floor-Upper 160 mm Concrete |
| Structural Foundations | Foundation Slab | Foundation Slab: Standard with tiles | |
| Structural Foundations | Pile Cap | Pile Cap: 1500 × 1500 × 500 | |
| Structural Foundations | Wall Foundation | Wall Foundation: Standard | |
| Envelope | Roofs | Basic Roof | Metal roof panels, flat soffit-NBS 20–50–55/150 |
| Roofs | Basic Roof | Metal single skin, 125 mm insulation | |
| Framing | Structural Columns | Square Hollow Sections-Column | RHS200 × 100 × 6.3 SHS80 × 80 × 8 SHS150 × 150 × 5 SHS200 × 200 × 6.3 SHS250 × 250 × 6.3 |
| Structural Columns | UC-Universal Columns-Column | UC152 × 152 × 23 UC152 × 152 × 30 UC203 × 203 × 46 | |
| Structural Framing | Circular Hollow Sections | CHS114.3 × 5 | |
| Structural Framing | Light Gauge-Kingspan Multibeam Purlins | M205065180 | |
| Structural Framing | Light Gauge-Kingspan Multibeam Rails | M205065180 | |
| Structural Framing | PFC-Parallel Flange Channels | PFC150 × 75 × 18 PFC200 × 75 × 23 | |
| Structural Framing | Plate | Plate: 10 × 100 PLT | |
| Structural Framing | Rectangular Hollow Sections | RHS140 × 80 × 6.3 RHS200 × 100 × 6.3 | |
| Structural Framing | Square Hollow Sections | SHS150 × 150 × 5 SHS180 × 180 × 6.3 | |
| Structural Framing | UB-Universal Beams | UB203 × 133 × 25 UB203 × 133 × 25 UB254 × 146 × 31 UB305 × 165 × 54 UB406 × 140 × 39 UB533 × 210 × 122 UB610 × 229 × 101 UB686 × 254 × 125 | |
| Envelope | Walls | External wall type 1 | Longspan insulated cladding panels (1000 mm) fixed to primary steel columns |
| Walls | External wall type 2 | 365 mm concrete wall (80 mm insulation) faced with 20 mm render to external side, painted white concrete face internally (grey plinth at ground level externally) | |
| Walls | External wall type 3 | Canopy end wall −2 × 60 mm Cladding panels fixed back to Secondary steelwork via top hats. Grey rendered plinth externally at ground level | |
| Walls | Internal wall type 1A (300mm) Internal wall type 1B (399 mm) Internal wall type 1C (428 mm) | Metal stud twin frame + 15 mm Duraline on each side | |
| Walls | Internal wall type 2 | 146 mm metal stud + 15 mm Duraline on each side | |
| Walls | Internal wall type 3 | 70 mm metal stud + 15 mm Duraline on each side | |
| Walls | Internal wall type 4 | 70 mm metal stud + 15 mm Duraline on one side | |
| Walls | Internal wall type 5 | 92 mm metal stud + 15 mm Duraline on one side | |
| Walls | Internal wall type 6 | 140 mm blockwork + 15 mm Plaster on each side | |
| Walls | Internal wall type 7 | 140 mm concrete + 15 mm Plaster on each side | |
| Curtain wall | Windows | Curtain wall opening | 2100 mm × 4000 mm clear opening |
| Windows | Curtain wall type 1 | 1430 mm × 4000 mm curtain wall | |
| Windows | Curtain wall type 2 | 1050 mm–2050 mm × 4000 mm curtain wall |
| Component | Assigned Component | Assigned Material in BIM Model | Material Layer Details |
|---|---|---|---|
| Floor | Floor: Floor-Upper 160 mmConc-CorusComFlor51 | Concrete 15 MPa | |
| Foundation Slab | Foundation Slab: Standard with tiles | Cast-in-Place Concrete | |
| Pile Cap | Pile Cap: 1500 × 1500 × 500 | Cast-in-Place Concrete | |
| Wall Foundation | Wall Foundation: Standard | Cast-in-Place Concrete | |
| Basic Roof | Kingspan Insulated Panels-Metal Insulating Sandwich Panel Roofing System-Quad Core Trapezoidal Roof Panel-KS1000RW 120 mm | NBS Kingspan Insulated Panels PIR Foam Board PIR Insulation | |
| NBS Kingspan Insulated Panels Steel Profiled Sheet Quad-Core Trapezoidal Roof Panel KS1000RW External Weather Sheet | |||
| NBS Kingspan Insulated Panels Steel Profiled Sheet Quad-Core Trapezoidal Roof Panel KS1000RW Internal Liner Sheet | |||
| Basic Roof | Metal single skin, 125 mm insulation | Default Roof–metal single skin | |
| Default Roof–Generic insulation 125 mm | |||
| Square Hollow Sections-Column | RHS200 × 100 × 6.3 SHS80 × 80 × 8 SHS150 × 150 × 5 SHS200 × 200 × 6.3 SHS250 × 250 × 6.3 | Metal-Steel 50–355 | |
| UC-Universal Columns-Column | UC152 × 152 × 23 UC152 × 152 × 30 UC203 × 203 × 46 | Metal-Steel 50–355 | |
| Circular Hollow Sections | CHS114.3 × 5 | Metal-Steel-S275 | |
| Light Gauge-Kingspan Multibeam Purlins | M205065180 | Metal-Steel-S275 | |
| Light Gauge-Kingspan Multibeam Rails | M205065180 | Metal-Steel-S275 | |
| PFC-Parallel Flange Channels | PFC150 × 75 × 18 PFC200 × 75 × 23 | Metal-Steel-S275 | |
| Plate | Plate: 10 × 100 PLT | Metal-Steel-S275 | |
| Rectangular Hollow Sections | RHS140 × 80 × 6.3 RHS200 × 100 × 6.3 | Metal-Steel-S275 | |
| Square Hollow Sections | SHS150 × 150 × 5 SHS180 × 180 × 6.3 | Metal-Steel-S275 | |
| UB-Universal Beams | UB203 × 133 × 25 UB203 × 133 × 25 UB254 × 146 × 31 UB305 × 165 × 54 UB406 × 140 × 39 UB533 × 210 × 122 UB610 × 229 × 101 UB686 × 254 × 125 | Metal-Steel-S275 | |
| External wall type 1 | Flamstyl S ArcelorMittal-1000 mm Horizontal: 180 mm | ArcelorMittal-Mineral Wool | Thermoplastic Resin |
| Pre-painted Steel ArcelorMittal Construction HAIRULTRA | Steel, paint finish, ivory, glossy | ||
| Pre-painted Steel ArcelorMittal Construction INTÉRIEUR | Polymethyl Methacrylate | ||
| External wall type 2 | External wall type 2 | Portland Cement Concrete | Concrete |
| Insulation/Support Frame | |||
| Paint-White Lining | |||
| External wall type 3 | External wall type 3 | Cladding, Vertical Ribbed | |
| Insulation/Support Frame | |||
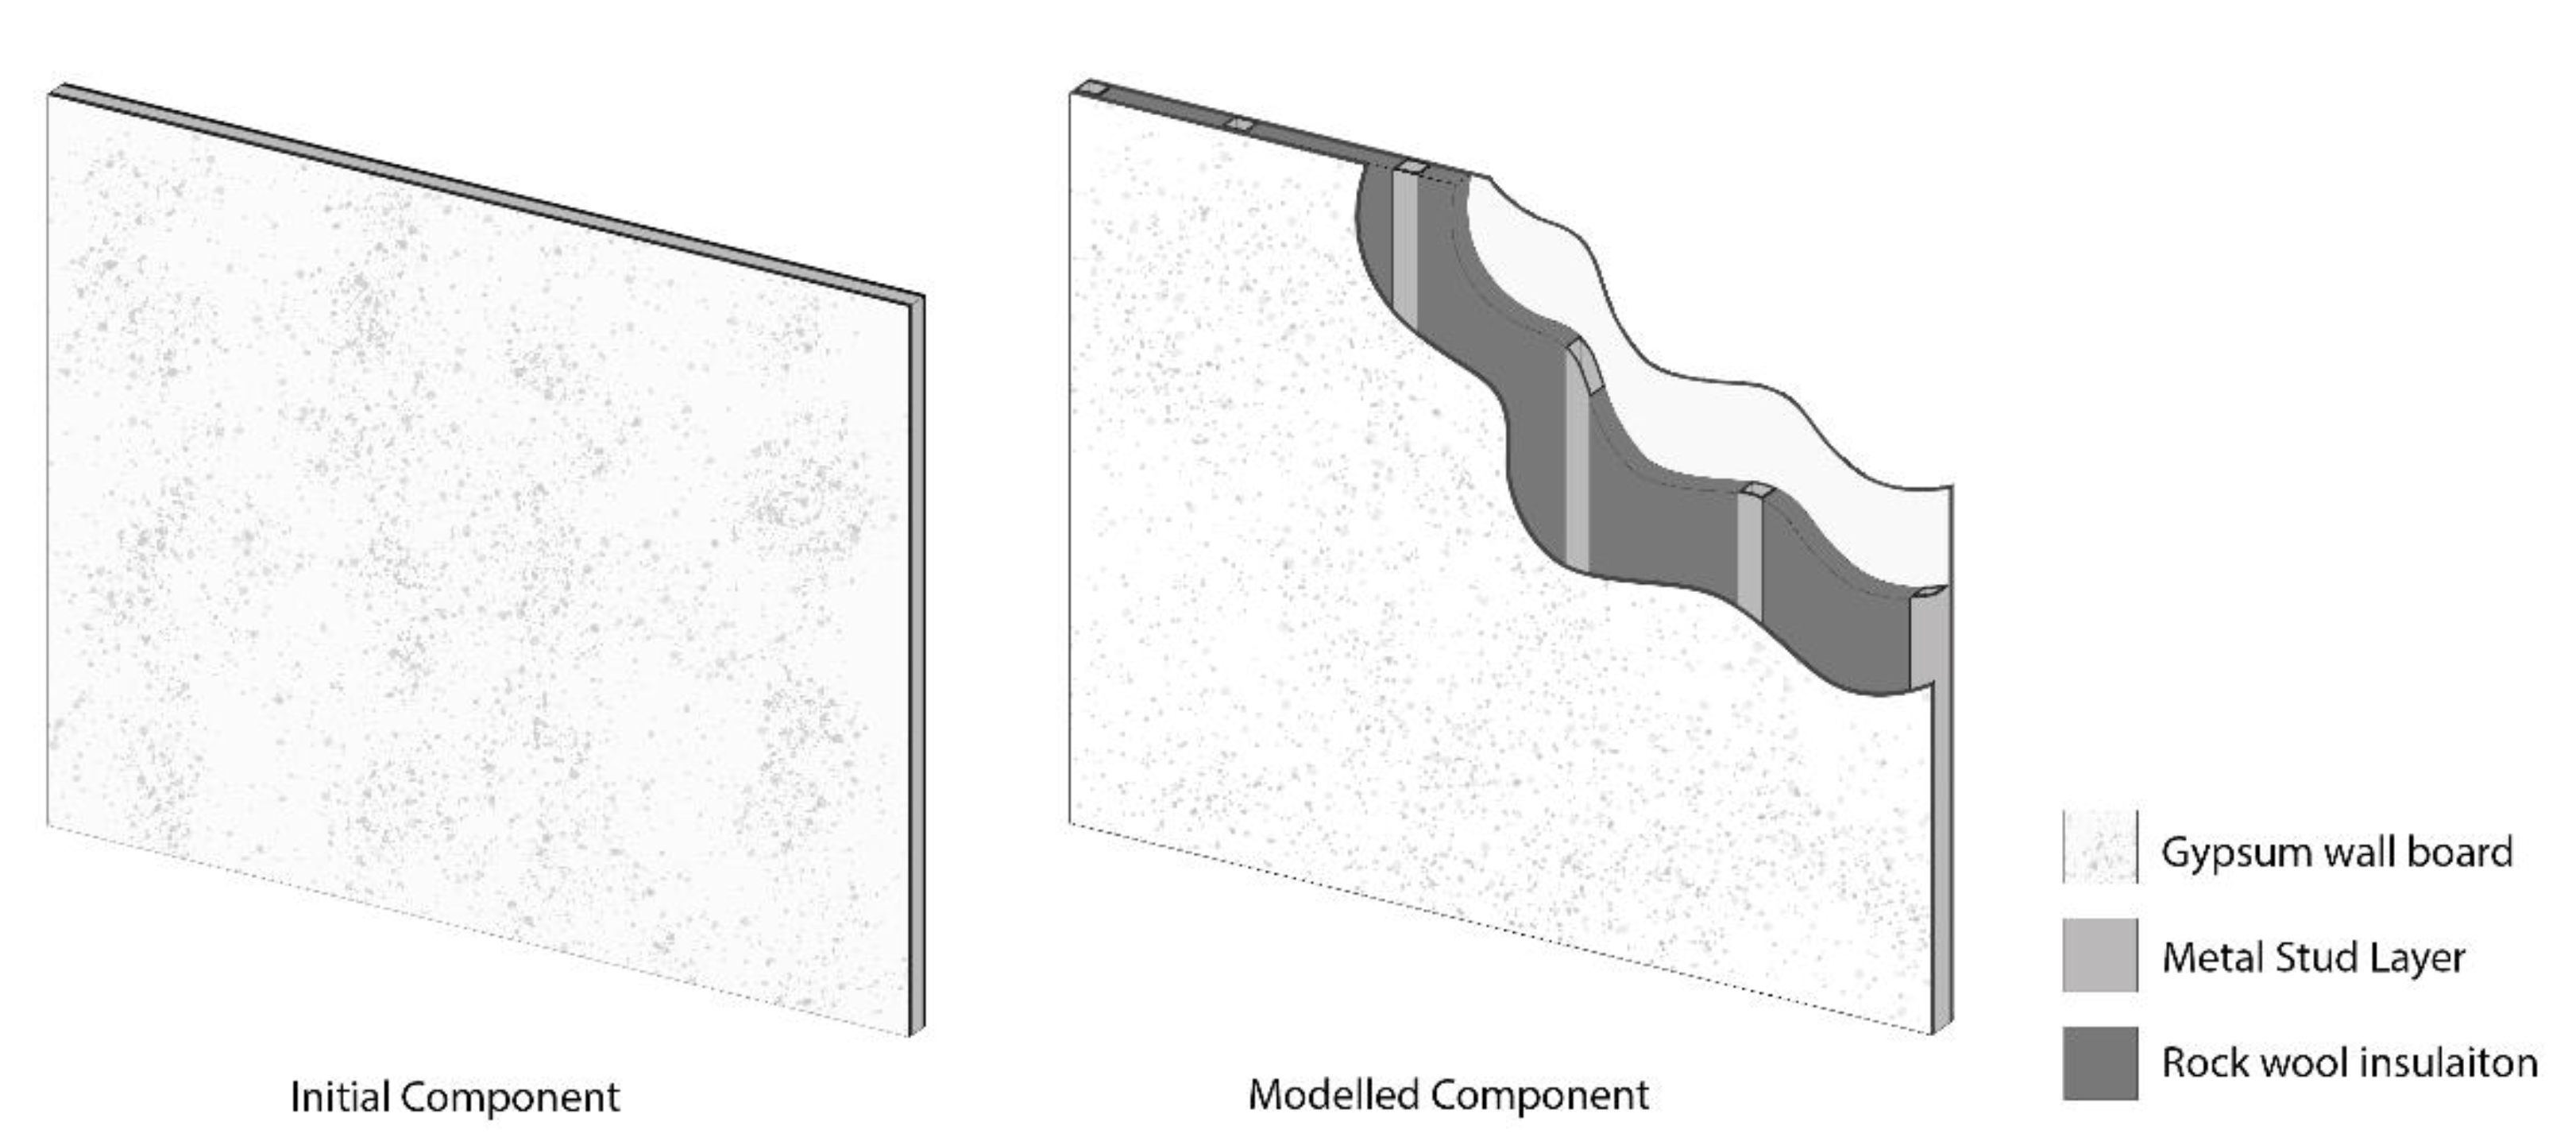
| Internal wall type 1 | Internal wall type 1A (300 mm) Internal wall type 1B (399 mm) Internal wall type 1C (428 mm) | Gypsum Wall Board | |
| Light gauge steel framing, thermal air layer | Metal Stud Layer | ||
| Rock Wool | |||
| Internal wall type 2 | Internal wall type 2 | Gypsum Wall Board | |
| Light gauge steel framing, thermal air layer | Metal Stud Layer | ||
| Rock Wool | |||
| Internal wall type 3 | Internal wall type 3 | Gypsum Wall Board | |
| Light gauge steel framing, thermal air layer | Metal Stud Layer | ||
| Rock Wool | |||
| Internal wall type 4 | Internal wall type 4 | Gypsum Wall Board | |
| Light gauge steel framing, thermal air layer | Metal Stud Layer | ||
| Rock Wool | |||
| Internal wall type 5 | Internal wall type 5 | Gypsum Wall Board | |
| Light gauge steel framing, thermal air layer | Metal Stud Layer | ||
| Rock Wool | |||
| Internal wall type 6 | Internal wall type 6 | Common brick | |
| Plaster | |||
| Internal wall type 7 | Internal wall type 7 | Concrete-Precast Concrete-35 MPa | |
| Plaster | |||
| Curtain wall opening | Schueco ASS 77 PD-HI Family-2D-1 OF-150 mm: Type 2D | Soda Lime Glass | |
| Aluminium | |||
| Curtain wall type 1 | Schueco Façade UCC 65 SG Family-03: Type 1 | Soda Lime Glass | |
| Aluminium | |||
| Curtain wall type 2 | Schueco Façade UCC 65 SG Family-13: Type 1 | Soda Lime Glass | |
| Aluminium |
| Wall Type | Layer Details of Modelled Material in Revit® |
|---|---|
| (A) Internal wall type 1A, layer details in Revit® BIM software |  |
| (B) Internal wall type 1B, layer details in Revit® BIM software |  |
| (C) Internal wall type 1C, layer details in Revit® BIM software |  |
| (D) Internal wall type 2, layer details in Revit® BIM software |  |
| (E) Internal wall type 3, layer details in Revit® BIM software |  |
| (F) Internal wall type 4, layer details in Revit® BIM software |  |
| (G) Internal wall type 5, layer details in Revit® BIM software |  |
| Wall Type | Assigned Material in BIM Model | Unit Weight kg/m3 | Initial Component Weight (kg) | Modelled Component Weight (kg) |
|---|---|---|---|---|
| Internal wall type 1A | Light gauge steel framing, thermal air layer | 7850.0 kg/m3 | 583,049.2 kg | 64,644.6 kg |
| Internal wall type 1B | Light gauge steel framing, thermal air layer | 7850.0 kg/m3 | 6758.8 kg | 753.6 kg |
| Internal wall type 1C | Light gauge steel framing, thermal air layer | 7850.0 kg/m3 | 420,240.7 kg | 46,589.6 kg |
| Internal wall type 2 | Light gauge steel framing, thermal air layer | 7850.0 kg/m3 | 141,260.3 kg | 25,143.5 kg |
| Internal wall type 3 | Light gauge steel framing, thermal air layer | 7850.0 kg/m3 | 38,849.5 kg | 3289.1 kg |
| Internal wall type 4 | Light gauge steel framing, thermal air layer | 7850.0 kg/m3 | 52,948.1 kg | 4458.8 kg |
| Internal wall type 5 | Light gauge steel framing, thermal air layer | 7850.0 kg/m3 | 223,159.2 kg | 24,751.0 kg |
| Category | Family and Type | Material: Name | Material: Weight (kg) | |
|---|---|---|---|---|
| Floors | Floor: Floor-Upper_160 mmConc-CorusComFlor51 | Concrete, Cast-in-Place-C15 | 14,674.397 kg | |
| Structural Foundations | Foundation Slab: Standard with tiles | Default Mass Floor | 1190.908 kg | |
| Pile Cap: 1500 × 1500 × 500 | Concrete-Cast-in-Place Concrete | 97,024.061 kg | ||
| Wall Foundation: Standard | Concrete, Cast In Situ | 4.813 kg | ||
| Mechanical | Rectangular Duct: Standard, Fitting Round Duct: Standard, Fitting | Steel | 4528.741 kg | |
| Roofs | Kingspan Insulated Panels-Metal Insulating Sandwich Panel Roofing System-Quad Core Trapezoidal Roof Panel-KS1000RW 120 mm | NBS_KingspanInsulatedPanels_PIRFoamBoard_PIRInsulation | 12,965.762 kg | |
| NBS_KingspanInsulatedPanels_SteelProfiledSheet_QuadCoreTrapezoidalRoofPanel_KS1000RW_ExternalWeatherSheet | 19,720.414 kg | |||
| NBS_KingspanInsulatedPanels_SteelProfiledSheet_QuadCoreTrapezoidalRoofPanel_KS1000RW_InternalLinerSheet | 29,468.400 kg | |||
| Metal single skin, 125 mm insulation | Default Roof–metal single skin | 43.790 kg | ||
| Default Roof–Generic insulation 125 mm | 178.040 kg | |||
| Structural Columns | RHS200 × 100 × 6.3 SHS80 × 80 × 8 SHS150 × 150 × 5 SHS200 × 200 × 6.3 SHS250 × 250 × 6.3 | UB203 × 133 × 25 UC152 × 152 × 23 UC152 × 152 × 30 UC203 × 203 × 46 | Metal-Steel 50–355 | 20,982.768 kg |
| Structural Framing | CHS114.3 × 5 M205065180 M205065180 PFC150 × 75 × 18 PFC200 × 75 × 23 10 × 100 PLT RHS140 × 80 × 6.3 RHS200 × 100 × 6.3 SHS150 × 150 × 5 SHS180 × 180 × 6.3 | UB203 × 133 × 25 UB203 × 133 × 25 UB254 × 146 × 31 UB305 × 165 × 54 UB406 × 140 × 39 UB533 × 210 × 122 UB610 × 229 × 101 UB686 × 254 × 125 UC152 × 152 × 23 | Metal-Steel-S275 | 64,730.549 kg |
| Walls | External wall type 1 | ArcelorMittal–Mineral Wool | 244,027.357 kg | |
| Prepainted_Steel-ArcelorMittal_Construction_HAIRULTRA-35 | 27,644.390 kg | |||
| Prepainted_Steel-ArcelorMittal_Construction_INTÉRIEUR | 3213.457 kg | |||
| Cladding, Vertical Ribbed | 11,376.568 kg | |||
| External wall type 2 | Concrete | 9764.194 kg | ||
| Insulation/Support Frame | 8.912 kg | |||
| Paint-White Lining | 0.557 kg | |||
| External wall type 3 | Cladding, Vertical Ribbed | 6747.893 kg | ||
| Insulation/Support Frame | 19.551 kg | |||
| Internal wall type 1A (300 mm) Internal wall type 1B (399 mm) Internal wall type 1C (428 mm) | Default Wall | 768.253 kg | ||
| Internal wall type 1A (300 mm) Internal wall type 1B (399 mm) Internal wall type 1C (428 mm) Internal wall type 2 | Internal wall type 3 Internal wall type 4 Internal wall type 5 | Gypsum Wall Board | 36,163.635 kg | |
| Internal wall type 1A (300 mm) Internal wall type 1B (399 mm) Internal wall type 1C (428 mm) Internal wall type 2 | Internal wall type 3 Internal wall type 4 Internal wall type 5 | Metal Stud Layer | 169,630.170 kg | |
| Internal wall type 1A (300 mm) Internal wall type 1B (399 mm) Internal wall type 1C (428 mm) Internal wall type 2 | Internal wall type 3 Internal wall type 4 Internal wall type 5 | Rock Wool | 33,027.235 kg | |
| Internal wall type 6 | Brick, Common | 25,933.089 kg | ||
| Internal wall type 6 Internal wall type 7 | Plaster | 4467.497 kg | ||
| Internal wall type 7 | Concrete-Precast Concrete-35 MPa | 12,790.706 kg | ||
| Curtain wall | Schueco ASS 77 PD-HI Family-2D-1 OF-150 mm: Type 2D Schueco Façade UCC 65 SG Family-03: Type 1 Schueco Façade UCC 65 SG Family-13: Type 1 | Alu | 2678.138 kg | |
| Schueco ASS 77 PD-HI Family-2D-1 OF-150 mm: Type 2D Schueco Façade UCC 65 SG Family-03: Type 1 Schueco Façade UCC 65 SG Family-13: Type 1 | Glass | 8094.866 kg | ||
| Windows | AWS60BD 2 Vents: AWS60BD 2 Vents | Glass | 191.179 kg | |
| Total | 862,078.845 kg | |||
| Material Name | Method One ECF Source | Method Two ECF Source | Method Three ECF Source |
|---|---|---|---|
| Concrete, Cast-in-Place-C15 Default Mass Floor Concrete-Cast-in-Place Concrete Concrete, Cast In Situ Concrete | Concrete | ICE-Concrete, General | ICE-Concrete, General |
| Concrete-Precast Concrete-35 MPa | Concrete | ICE-precast AAC block | ICE-Concrete 35/45 |
| Steel | Metals | ICE-steel pipe | ICE-steel pipe |
| QuadCoreTrapezoidalRoofPanel_KS1000RW_ExternalWeatherSheet | Metals | ICE-Aluminium sheet EU | ICE-Aluminium sheet EU inc transport |
| QuadCoreTrapezoidalRoofPanel_KS1000RW_Internal Liner Sheet | Metals | ICE-Steel | ICE-Steel, organic coated sheet |
| Default Roof–metal single skin | Metals | ICE-Steel | ICE-Steel, organic coated sheet |
| Metal-Steel 50-355 | Metals | ICE-Steel section | ICE-steel section UK open sections |
| Metal-Steel-S275 | Metals | ICE-Steel section | ICE-steel section UK open sections |
| Prepainted_Steel-ArcelorMittal_Construction_HAIRULTRA-35-CORAL-4309-[RAL_3000] | Metals | ICE-Steel | ICE-Steel, organic coated sheet |
| Cladding, Vertical Ribbed | Metals | ICE-aluminium sheet general EU including imports | ICE-aluminium sheet general EU including imports |
| Metal Stud Layer | Metals | ICE-Steel | ICE-Steel |
| Aluminium | Metals | ICE-aluminium general EU including transport | ICE-aluminium extruded profile EU including transport |
| PIRFoamBoard_PIRInsulation | Insulation | ICE-Insulation | ICE-Insulation |
| Default Roof–Generic insulation 125 mm | Insulation | ICE-Insulation | ICE-Insulation |
| ArcelorMittal–Mineral Wool | Insulation | ICE-Insulation | ec.europa.eu-glass wool |
| Insulation/Support Frame | Insulation | ICE-Insulation | ec.europa.eu-glass wool |
| Rock Wool | Insulation | ICE-Insulation | ICE-Insulation |
| Default Wall | Plasterboard | ICE-plasterboard | ICE-plasterboard |
| Gypsum Wall Board | Plasterboard | ICE-plasterboard | ICE-plasterboard |
| Plaster | Plasterboard | ICE-plasterboard | ICE-plasterboard |
| Brick, Common | Bricks | ICE-generic brick | ICE-generic brick |
| Prepainted_Steel-ArcelorMittalConstruction INTÉRIEUR 12 WHITE 912 | Plastics: average plastics | ICE-Rubber | PMMA.pdf |
| Paint-White Lining | Average construction | ICE-paint | ICE-paint |
| Method One EC (kgCO2e) | Method Two EC (kgCO2e) | Method Three EC (kgCO2e) | |
|---|---|---|---|
| Concrete, Cast-in-Place-C15 Default Mass Floor Concrete-Cast-in-Place Concrete Concrete, Cast In Situ Concrete | 16,534.20 kgCO2e | 12,682.80 kgCO2e | 12,682.80 kgCO2e |
| Concrete, Cast-in-Place-C15 | 1978.1 kgCO2e | 3581.4 kgCO2e | 2058.0 kgCO2e |
| Default Mass Floor | 160.5 kgCO2e | 123.1 kgCO2e | 123.1 kgCO2e |
| Concrete-Cast-in-Place Concrete | 13,078.8 kgCO2e | 10,032.3 kgCO2e | 10,032.3 kgCO2e |
| Concrete, Cast In Situ | 0.6 kgCO2e | 0.5 kgCO2e | 0.5 kgCO2e |
| Concrete | 1316.2 kgCO2e | 1009.6 kgCO2e | 1009.6 kgCO2e |
| Concrete-Precast Concrete-35 MPa | 1724.2 kgCO2e | 2276.7 kgCO2e | 3581.4 kgCO2e |
| Steel | 21,597.1 kgCO2e | 13,676.8 kgCO2e | 13,676.8 kgCO2e |
| QuadCore_Trapezoidal_Roof_Panel_KS1000RW_ExternalWeatherSheet | 94,044.7 kgCO2e | 129,760.3 kgCO2e | 64,892.0 kgCO2e |
| QuadCore_Trapezoidal_Roof_Panel_KS1000RW_Internal_LinerSheet | 140,531.9 kgCO2e | 87,521.1 kgCO2e | 90,173.3 kgCO2e |
| Default Roof–metal single skin | 208.8 kgCO2e | 130.1 kgCO2e | 134.0 kgCO2e |
| Metal-Steel 50-355 | 100,064.7302 kgCO2e | 32,523.3 kgCO2e | 51,599.0 kgCO2e |
| Metal-Steel-S275 | 301,353.4338 kgCO2e | 98,961.3 kgCO2e | 153,575.3 kgCO2e |
| PrepaintedSteel_ArcelorMittal_Construction_HAIRULTRA-35-CORAL | 131,833.3 kgCO2e | 82,103.8 kgCO2e | 84,591.8 kgCO2e |
| Cladding, Vertical Ribbed | 86,433.70 kgCO2e | 41,616.40 kgCO2e | 41,616.40 kgCO2e |
| Metal Stud Layer | 808,949.3 kgCO2e | 503,801.6 kgCO2e | 503,801.6 kgCO2e |
| Aluminium | 12,771.8 kgCO2e | 17,859.7 kgCO2e | 4569.7 kgCO2e |
| PIRFoamBoard_PIRInsulation | 24,178.6 kgCO2e | 18,670.7 kgCO2e | 18,670.7 kgCO2e |
| Default Roof–Generic insulation 125mm | 13.2 kgCO2e | 678.3 kgCO2e | 678.3 kgCO2e |
| ArcelorMittal–Mineral Wool | 455,062.215 kgCO2e | 351,399.4 kgCO2e | 180,580.2 kgCO2e |
| Insulation/Support Frame | 53.10 kgCO2e | 41.00 kgCO2e | 21.10 kgCO2e |
| Rock Wool | 61,589.2 kgCO2e | 47,559.2 kgCO2e | 47,559.2 kgCO2e |
| Default Wall | 92.3 kgCO2e | 299.6 kgCO2e | 299.6 kgCO2e |
| Gypsum Wall Board | 4343.3 kgCO2e | 14,103.8 kgCO2e | 14,103.8 kgCO2e |
| Plaster | 536.5 kgCO2e | 1742.3 kgCO2e | 1742.3 kgCO2e |
| Brick, Common | 6348.4 kgCO2e | 5523.7 kgCO2e | 5523.7 kgCO2e |
| PrepaintedSteel_ArcelorMittal_Construction_INTÉRIEUR-12-WHITE | 10,739.4 kgCO2e | 9158.4 kgCO2e | 49,487.2 kgCO2e |
| Paint-White Lining | 0.0 kgCO2e | 1.3 kgCO2e | 1.3 kgCO2e |
| Total | 2293.84 tonneCO2e | 1487.76 tonneCO2e | 1359.70 tonneCO2e |
| Category | Material: Weight (tonne) | Method One EC (tonneCO2e) | Method Two EC (tonneCO2e) | Method Three EC (tonneCO2e) |
|---|---|---|---|---|
| Curtain Panels | 169.11 | 331.94 | 252.72 | 148.34 |
| Floors | 14.67 | 1.98 | 1.52 | 1.52 |
| Roofs | 62.37 | 258.98 | 236.76 | 174.55 |
| Structural Columns | 20.98 | 100.06 | 32.52 | 51.60 |
| Structural Foundations | 98.22 | 13.24 | 10.16 | 10.16 |
| Structural Framing | 64.73 | 308.69 | 101.35 | 157.35 |
| Walls | 416.48 | 1237.08 | 807.92 | 785.58 |
| Windows | 10.96 | 20.18 | 29.77 | 18.38 |
| Mechanical | 4.53 | 21.60 | 13.68 | 13.68 |
| TOTAL | 862.079 | 2293.84 | 1487.76 | 1359.70 |
Publisher’s Note: MDPI stays neutral with regard to jurisdictional claims in published maps and institutional affiliations. |
© 2021 by the authors. Licensee MDPI, Basel, Switzerland. This article is an open access article distributed under the terms and conditions of the Creative Commons Attribution (CC BY) license (https://creativecommons.org/licenses/by/4.0/).
Share and Cite
Mohebbi, G.; Bahadori-Jahromi, A.; Ferri, M.; Mylona, A. The Role of Embodied Carbon Databases in the Accuracy of Life Cycle Assessment (LCA) Calculations for the Embodied Carbon of Buildings. Sustainability 2021, 13, 7988. https://0-doi-org.brum.beds.ac.uk/10.3390/su13147988
Mohebbi G, Bahadori-Jahromi A, Ferri M, Mylona A. The Role of Embodied Carbon Databases in the Accuracy of Life Cycle Assessment (LCA) Calculations for the Embodied Carbon of Buildings. Sustainability. 2021; 13(14):7988. https://0-doi-org.brum.beds.ac.uk/10.3390/su13147988
Chicago/Turabian StyleMohebbi, Golnaz, Ali Bahadori-Jahromi, Marco Ferri, and Anastasia Mylona. 2021. "The Role of Embodied Carbon Databases in the Accuracy of Life Cycle Assessment (LCA) Calculations for the Embodied Carbon of Buildings" Sustainability 13, no. 14: 7988. https://0-doi-org.brum.beds.ac.uk/10.3390/su13147988