
Analysis of Green Traffic Development in Zhoushan Based on Entropy Weight TOPSIS

1
School of Economics and Management, Zhejiang Ocean University, Zhoushan 316022, China
2
School of Port and Transportation Engineering, Zhejiang Ocean University, Zhoushan 316022, China
*
Author to whom correspondence should be addressed.
Sustainability 2021, 13(14), 8109; https://0-doi-org.brum.beds.ac.uk/10.3390/su13148109
Submission received: 10 June 2021
/
Revised: 8 July 2021
/
Accepted: 8 July 2021
/
Published: 20 July 2021
(This article belongs to the Special Issue Entrepreneurship and Sustainable Firms and Economies)
Abstract
:Green transportation is a kind of urban transportation system with low pollution and multiple urban environments. At present, the development of green transportation in China is progressing and gradually occupying a relatively important position. In order to understand the development of green transportation in China, based on the concept of green transportation, this paper analyzes the development of green transportation in Zhoushan as an example, and selects the data from three aspects: basic indicators, means of transportation and road construction in Zhoushan City. The entropy weight method is used to determine the entropy value and weight of each index, and the index evaluation system is established. In addition, the ideal solution method was used to calculate the relative closeness degree to analyze the development of green transportation in Zhoushan city from 2016 to 2018. According to the relative proximity degree calculation data, it can be shown that the calculation value of 2017 is larger than that of 2018. The results show that the development of green transportation in Zhoushan in 2017 is the best, followed by 2018. The above results help to understand the current development status of Zhoushan green transportation, further understand the existing problems and the important factors affecting the development of Zhoushan green transportation. In order to promote the development of urban green transportation in China, suggestions are put forward on the basis of the analysis of the development of Zhousan’s green transportation to promote the development of green transportation in Zhoushan from four aspects: strengthening the construction of urban road transportation system, optimizing transportation, improving the infrastructure of new energy vehicles and promoting the concept of green transportation.
1. Introduction
Green transportation emphasizes the "green nature" of the city, and its essence is to establish a transportation system to maintain the sustainable development of the city so as to meet people’s traffic demands and achieve the maximum traffic efficiency with the least social cost. At present, the development of urban green transportation in China is still in a weak position. The main problems are as follows: the green transportation mode lacks integration and level flattening; under the background of stock planning, the development of land use and green transportation system is misplaced; and the demand management system of green transportation lacks perfection and coordination [1].
Lucid waters and lush mountains are invaluable assets. Promoting the development of green transportation is an inevitable choice for changing the mode and adjusting the structure of transportation and is an important part of building a "beautiful new area". Since 2015, with the theme of "Building Green Island traffic and building a beautiful archipelago New Area", Zhoushan has launched the construction of green transportation city in an all-round way, mainly including further optimizing BRT line 1, optimizing the bus network, improving the coverage of bus stops and using energy-saving and environmentally friendly products to create a slow-moving green highway system, so as to reduce the pollution to the ecological environment. A total investment of 1.945 billion yuan has been made, with an annual energy saving of 40,000 tons of standard coal and an annual reduction of carbon dioxide emissions of more than 100,000 tons. The green transportation infrastructure has been upgraded, and the Zhoushan sea crossing bridge has been selected as one of the "top ten most beautiful highways in Zhejiang Province"; the comprehensive transportation information platform has been established and improved, which can realize the full coverage of data sharing and online payment; and the energy-saving and environmental protection of transportation equipment has been vigorously promoted. At present, good results have been achieved in the establishment of a green transportation city in Zhoushan City. According to the statistics of the Zhoushan Transportation Bureau, the total highway mileage of Zhoushan City has reached 1948.37 kilometers, and the highway density has reached 134 kilometers/100 square kilometers. By the end of 2018, the city had 53 road passenger stations, 2679 passenger buses with 55,876 seats, 295 bus lines and 143 bus operating lines inside and outside the province, and the total number of bus access villages reached 100%. Furthermore, the city has 150 transportation terminals and 237 berths. There are 81 routes on the water. In addition, it has realized a two-hour traffic circle among the main islands.
Based on the concept of green transportation in this paper, understanding the development of green transportation in China at present is the objective, and taking Zhoushan’s green transportation development as an example, it can be further understood the existing problems and the important factors affecting the development of Zhoushan’s green transportation can be identified. Therefore, we can put forward the corresponding suggestions. In addition, Zhoushan can provide the basis for green transport development in our country to promote the development of green traffic in Chinese cities.
From the theoretical basis of research, Chen Xumei, et al. [2] proposed the sustainable development strategy of urban traffic from two aspects of urban planning and design and urban traffic planning by introducing the concept of green transportation. Lin Feilong (2004) [3] discussed the sustainable development of urban traffic from the perspective of developing green transportation and analyzed the relationship between green transportation and urban traffic sustainable development and then proposed corresponding green transportation development strategies. Chen Hongzhuan [4] first analyzed the current situation of urban traffic planning and development in China and pointed out the current problems based on the investigation of the present situation of urban traffic planning in China and the analysis of the factors that restrict the development of China’s traffic at present. Then, based on sustainable development, he put forward some suggestions on green transportation planning. Jiang Yuhong, et al. [5] analyzed the traffic status of Ma’anshan City from the perspective of urban green transportation and sustainable development and then proposed some strategies to realize urban green transportation. Luís Carvalho, et al. [6] extracted relevant experience from three cities that have implemented green transportation policies, which are Curitiba (Brazil), Gothenburg (Sweden) and Hamburg (Germany), and then decomposed the relevance of GUTP in providing various incentives for the process of clean technology innovation. Manoj K. Jha, et al. [7] believed that there were many definitions of sustainability and green transportation, but previous work mainly described these qualitatively, so the author conducted a quantitative analysis on sustainable development and green transportation from the perspective of road design and maintenance. Lu Huapu [8] believed that China is in the stage of rapid urbanization and resource crisis, and eco-cities, with the coordinated development of society, economy and nature, will be the future development direction of Chinese cities. Urban transportation systems have a strong influence and guidance on urban land use and spatial development patterns, and there is a strong interactive feedback relationship between them. He first introduced the complexity and multi-objective of urban system, as well as the Enlightenment from the case practice, and referred to the experience of foreign countries. In addition, he looked forward to the future development of cities and transportation and put forward suggestions for the development of transportation between cities. From the perspective of development, Alan T. Murray [9] discussed the strategic aspects of service access, evaluated the use of commercial Geographic Information System (GIS) in public transport in Brisbane, Australia and developed a strategic analysis method which effectively proved that the modification of the public transport system was reasonable from a local government perspective in the case of low system efficiency. Jotin khisty, et al. [10] proposed a sustainable footprint framework and model and used the data from the Atlanta and Chicago metropolitan areas to demonstrate how to apply the model in real life by analyzing the impact of transportation and other infrastructure systems on regional sustainable development. Xiao, Y, et al. [11] proposed a simulated annealing algorithm with hybrid exchange rules to solve FCVRP and demonstrated the good performance of the algorithm on both traditional CVRP and FCVRP in substantial computation experiments. The results of this experiment show that, compared with the CVRP model, the fuel consumption of the FCVRP model is reduced by 5% on average. From the measure of green traffic development, Fu Li, et al. [12] believed that green transportation is an effective means to achieve sustainable development of urban transportation, and the sustainable development of transportation is the concrete embodiment of the concept of sustainable development in the field of transportation. Then, they analyzed and evaluated the traffic development status of Shenzhen from 2000 to 2007 by using AHP, and finally, put forward the strategies to promote the development of green transportation in Shenzhen. Wen Huiying, et al. [13] first analyzed the previous transportation evaluation methods and their shortcomings. In addition, considering the demand of passenger transport and freight transport comprehensively, the evaluation index system of green transport development level in medium-sized cities is established, and the relevant evaluation criteria are defined. They evaluated the development level of green transportation in Heyuan City by establishing a cloud matter element evaluation model and concluded that the evaluation method can judge the current situation and trend of urban green traffic development. In order to clarify the positive contribution of low-carbon travel to the green development of urban transportation, Zeng Zhaoxia, et al. [14] used SPSS and DEAP analysis tools to analyze the data of low-carbon travel in Guangzhou from 2005 to 2012, and then obtained the impact of the implementation of low-carbon travel policy in Guangzhou on the development of green transportation in recent years. Jin Dan, et al. [15] combined the DPSIR conceptual model and the AHP-entropy method to evaluate the development level of green transportation in Xuzhou according to the relevant data of Xuzhou from 2008 to 2015. The results showed that the overall development of green transportation in Xuzhou was on the rise in the past eight years. Moreover, it can be seen the number of bus signs, per capita GDP, motor vehicle pollutant emissions and public recognition of green travel are not only important indicators but are also the main limiting factors. Liu yunlong, et al. [16] used the DEMATEL-ISM integration method to study the mechanism of the urban green traffic development and analyzed the various factors’ relationship and influence degree. The results showed that the environmental quality is the important factor affecting the development of urban green traffic and that we should advocate green travel and vigorously develop public transportation to reduce the energy consumption to improve environmental quality. The green transportation construction proposed by the National New Urbanization Plan (2014–2020) and the construction of a diversified green urban transportation system are the fundamental solutions to solve a series of traffic problems in China’s river valley cities. Wang Qi, et al. [17] evaluated the development level of green transportation in Lanzhou from 2011 to 2017 by using the entropy weight method and a grey relational degree analysis and concluded that although the development level of green transportation in Lanzhou has been improved, its overall development level is not high. Based on this, they put forward suggestions for the development of green transportation in valley-type cities. Based on the above research results, this paper introduces the entropy weight TOPSIS model to analyze the development of green transportation in Zhoushan to understand the current development status of green transportation in Zhoushan. Furthermore, we can understand the existing problems and the important factors affecting the development of green transportation in Zhoushan. In addition, the corresponding suggestions are put forward to promote the development of green in Zhoushan. Therefore, the development status of urban green transportation in China can be also understood.
There are two main innovations in this paper:
- The topic has a certain innovation. The research of this paper focuses on Zhoushan City and takes the development level of green transportation in Zhoushan City as the research object, which narrows the research scope and makes the research more targeted.
- There is an innovation in the research methods. At present, most of the studies on green transportation adopt the Analytic Hierarchy Process (AHP), and the index weight is too subjective. If there are too many indicators, they may not pass the consistency test. In this paper, the entropy weight TOPSIS is used for the comprehensive evaluation of green traffic. The characteristics of this model are that there is no restriction on the distribution form of sample data and the number of data, and the determination of the weight is more objective.
2. Research Method
2.1. Entropy Weight Method
According to Information Theory, entropy is a measure of uncertainty. For an attribute, entropy can be used to determine the discrete degree of this attribute. The smaller the information entropy value is, the greater the dispersion degree of the attribute is, the more information it provides and the greater the influence (weight) on the comprehensive evaluation will be. On the contrary, the greater the information entropy value is, the smaller the dispersion degree of the attribute is, the less information it will provide and the smaller the influence (weight) on the comprehensive evaluation will be. In addition, if an attribute’s values all are equal, then the attribute does not work in the comprehensive evaluation. Therefore, the information entropy can be used to calculate the weight of each attribute to provide a basis for the comprehensive evaluation of multiple attributes [18].
The entropy weight method is an objective weighting method. Firstly, the judgment matrix is formed and standardized according to the variation degree of each attribute. Secondly, the entropy weight and entropy weight of each attribute are calculated. Finally, the quotient weight of each attribute is used to weight all the attributes, so as to obtain a more objective evaluation result.
The steps of entropy weight method to calculate the weight of each attribute are as follows:
Step 1: There are m alternatives and n evaluation attributes to form the initial evaluation matrix:
, one attribute have one information entropy . In addition, .
Step 2: Calculate the proportion of the attribute value of the ith alternative method for the jth index .
Step 3: Calculate the entropy of the jth index , ; in addition,
Step 4: Calculate the entropy weight of the jth index ,
2.2. Technique for Order Preference by Similarity to Ideal Solutions
The Technique for Order Preference by Similarity to Ideal Solutions (TOPSIS) is a sorting method which approximates to ideal solutions. The main idea of this method is that, first, according to the positive ideal solution and negative ideal solution of each index, the optimal scheme and the worst scheme are constituted by the positive ideal solution and the negative ideal solution, respectively. The positive ideal solution is the optimal value of an evaluation index, the negative ideal solution of all the evaluation indexes constitutes the optimal scheme, the negative ideal solution of all evaluation indexes constitutes the worst scheme, the weighted Euclidean distance between the price scheme and the best and worst alternatives and, finally, the scheme is evaluated by comparing their proximity [19].
The steps to evaluate multi-index and multi-scheme with the TOPSIS method are as follows:
Step 1: The decision expert gives the decision matrix for m schemes and n indices
Step 2: The raw data of the decision matrix is normalized according to the following method, from which we we get :
Cost indicators:
Benefit index:
where represents the maximum value of the j-th index, and represents the minimum value of the j-th index.
Step 3: Combine the index weight with R to the weighted aggregation, then we get the weighted decision matrix
Step 4: consists of the optimal and worst values of each index to form the optimal scheme and the worst scheme , respectively: ,
where , ,
Step 5: Calculate the sum of distances between each scheme, the optimal scheme and the worst scheme, and the calculation formula is as follows:
,
Step 6: Calculate the relative proximity of each scheme ,
Step 7: Rank the alternatives according to the relative proximity. The greater the relative proximity, the better the scheme is.
2.3. Entropy Weight TOPSIS Method
The entropy weight TOPSIS model is a method that uses the entropy weight method to determine the index weight and calculates the proximity degree to determine the importance degree. This method has the advantages of making full use of the original data with small loss of information, and the calculated results are objective and scientific. When using the TOPSIS method to evaluate, the calculation of the weight is very vital. The weight of each index in TOPSIS method is given by experts, which has certain subjectivity. Therefore, in order to eliminate this subjectivity, this paper first uses the entropy weight method to calculate the weight, and then uses TOPSIS to evaluate and analyze it. The calculation steps of entropy weight
TOPSIS method are as follows:
Step1: Make the initial decision matrix standardized, that is, use the classification of indicators, such as cost index and benefit index, to normalize the initial decision matrix. Then, we get where represents the maximum value of the j-th index and represents the minimum value of the j-th index.
Step 2: Calculate the entropy of the j-th index :
where , , when , represents the proportion of attribute values of the ith alternative method under the j-th index.
Step 3: Calculate the entropy weight of the j-th index :
Step 4: Combine the index weight with the index weight to the weighted aggregation. Then, we get the weighted decision matrix
Step 5: Use the optimal and worst values of each index to form the optimal scheme and the worst scheme.
where , ,
Step 6: Calculate the sum of distances between each scheme and the optimal scheme and the worst scheme, and the calculation formula is as follows:
Step 7: Calculate the relative proximity of each scheme ,
Step 8: Rank the alternatives according to the relative proximity. The greater the relative proximity, the better the scheme is.
3. Case Study
3.1. Selection of Evaluation Index
In this paper, the road construction and traffic tools are analyzed from three aspects. Basic indicators and means of transportation can reflect people’s living standard and living ability to a certain extent, and road construction can reflect the distribution of roads and greening in Zhoushan City, as shown in Table 1 below:
3.2. Analysis of Green Traffic Development Based on Entropy Weight TOPSIS
3.2.1. Index Layer Data and Standardization
According to Table 1 green transportation development evaluation index in zhoushan, find out the corresponding data of 2016–2018 three years as shown in Table 2.
According to the previous section, indicators are divided into benefit indicators and cost indicators. Benefit indicators mean that the larger the index value, the better, while cost indicators are on the contrary. Different indicators have different standardized treatment methods. All the above indicators are benefit indicators. According to Formula (2), we can get the standardized decision matrix, as shown in Table 3 below.
3.2.2. Calculate Entropy and Entropy Weight
According to Formulas (3) and (4), the entropy value and entropy weight are calculated, and the following Table 4 is obtained.
3.2.3. Establishing Weighted Normalized Decision Matrix Z
The weighted normalized decision matrix Z is obtained by multiplying the matrix obtained from the standardized index layer data, and the diagonal matrix is obtained by calculating the entropy weight, as shown in the following matrix:
3.2.4. Calculate Relative Proximity
According to Formulas (5) and (6), the optimal scheme and the worst scheme composed of the optimal value and the worst value of each index are obtained.
According to Formulas (7) and (8), the distance between each scheme and the optimal scheme and the worst scheme is calculated.
According to Formula (9), we can obtain the comprehensive relative proximity degree:
From the above formula, it can be concluded that: 0.5305 > 0.5212 > 0.3719, that is, the development in 2017 is better than that in 2018 and better than that in 2016.
The relative proximity can be calculated based on basic indicators :
0.0019 > 0.0005 > 0.0003
The relative proximity can be calculated based on Vehicle :
0.0051 > 0.0040 > 0.0011
The relative proximity can be calculated based on road construction :
0.0062 > 0.0014 >0.0002
According to the above calculation results, zhoushan green transportation development evaluation result of 2016–2018 are listed and ranked, and the following Table 5 is obtained.
4. Evaluation Analysis and Suggestions
The smaller the entropy value is, the larger the entropy weight is, which indicates that the index is more important and contains more information than others, which should be focused on. It can be seen from Table 4 that the entropy value of motorcycles is the smallest and its entropy weight is the largest, followed by other vehicles. This shows that, in the process of Zhoushan’s green transportation development, motorcycles and other vehicles occupy a large proportion. According to the entropy weight TOPSIS model, the analysis of Zhoushan’s green transportation development from 2016 to 2018 shows that its development in 2017 is better than that in 2018 and better than that in 2016. In order to promote the development of green transportation in Zhoushan, the following suggestions are put forward.
4.1. Strengthen the Construction of Urban Road Traffic System
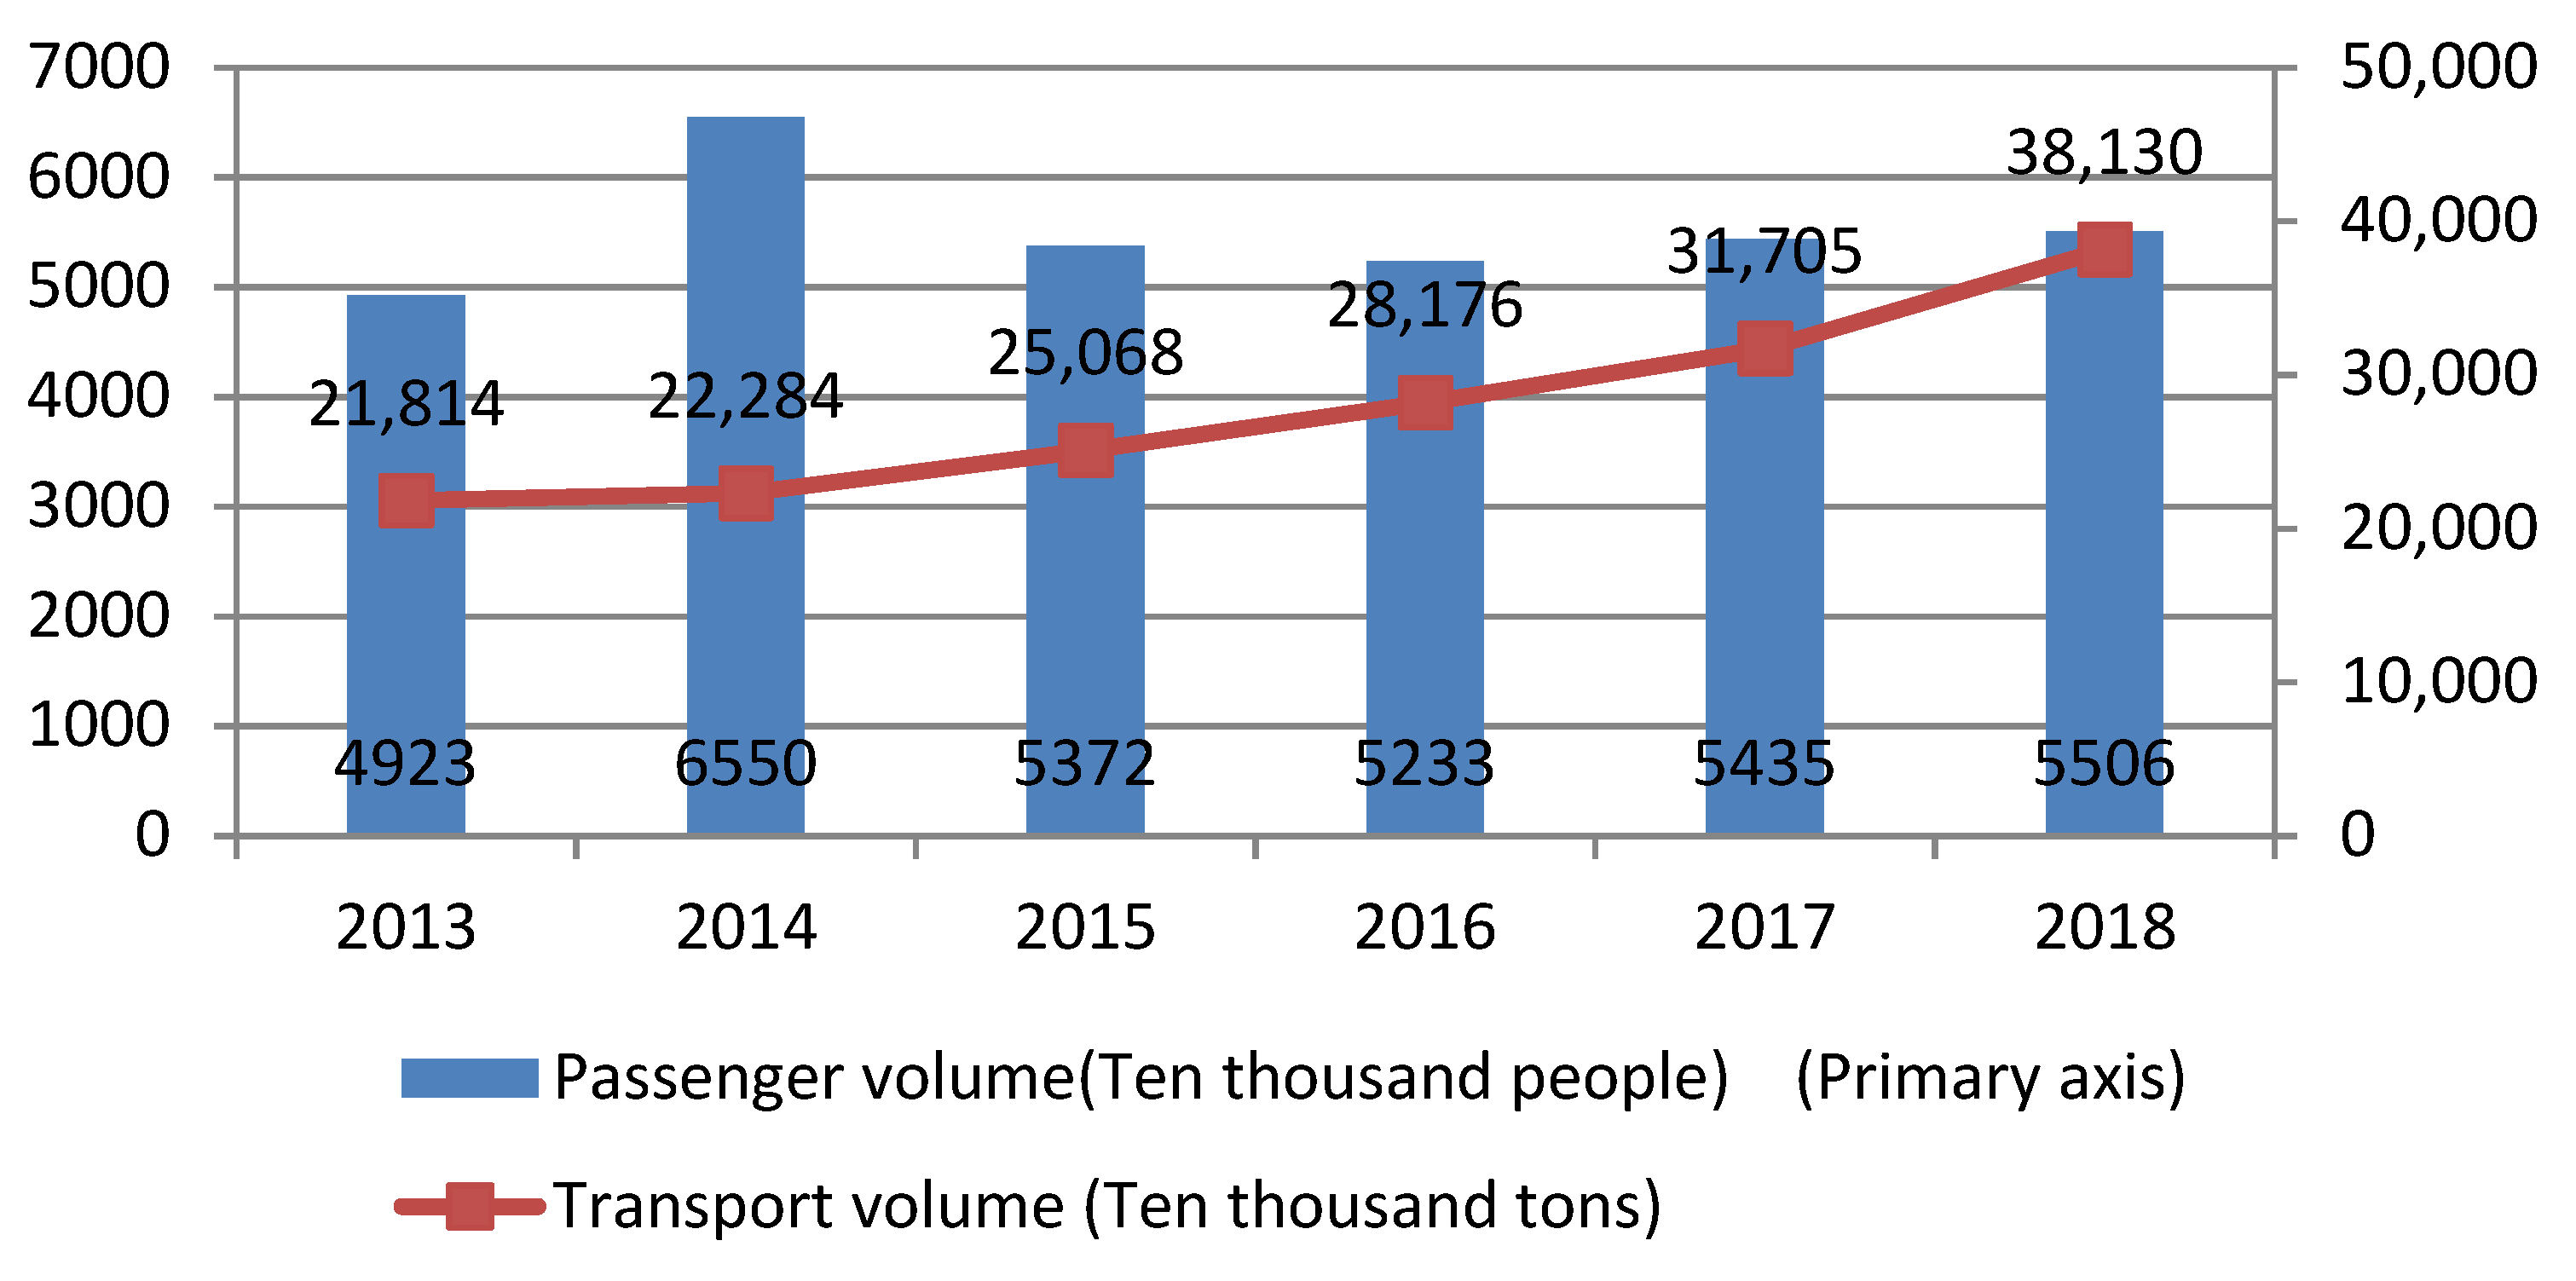
As China (ZheJiang) Pilot Free Trade Zone’s place, Zhoushan’s development situation is considerable. However, due to the limitation of geographical location, the traffic conditions of Zhoushan are not in line with its future development orientation. At present, the external traffic of Zhoushan is mainly highway transportation. It can be seen from Figure 1, with the continuous development of Zhoushan and the continuous growth of transportation demand, the single mode of transportation leads to the limitation of Zhoushan’s external traffic links. Therefore, it is necessary to improve the infrastructure of Zhoushan vehicles and strengthen the construction of the urban road traffic system.
4.2. Optimize Transportation
It can be seen from Table 4 that the entropy weight of vehicle index layer is greater than that of other index layers, so we should focus on the management of Zhoushan traffic and travel.
4.2.1. Develop Public Transport Vigorously
Above all, it is necessary to build a green and efficient public transport system. On the basis of existing line management, vehicle scheduling, voice intercom, emergency command and other functions, we should not only optimize the allocation of public transport resources and improve efficiency, but also improve the construction of an intelligent bus dispatching system and build a "public transport data brain". We will promote the replacement of clean energy buses and gradually eliminate traditional fuel buses. Secondly, it is also important to improve the priority service capacity of public transport. We can accelerate the construction of public transport stations, ensure the priority of public transport right of way and promote the construction of public transport priority facilities at road intersections.
4.2.2. Control Private Car Travel
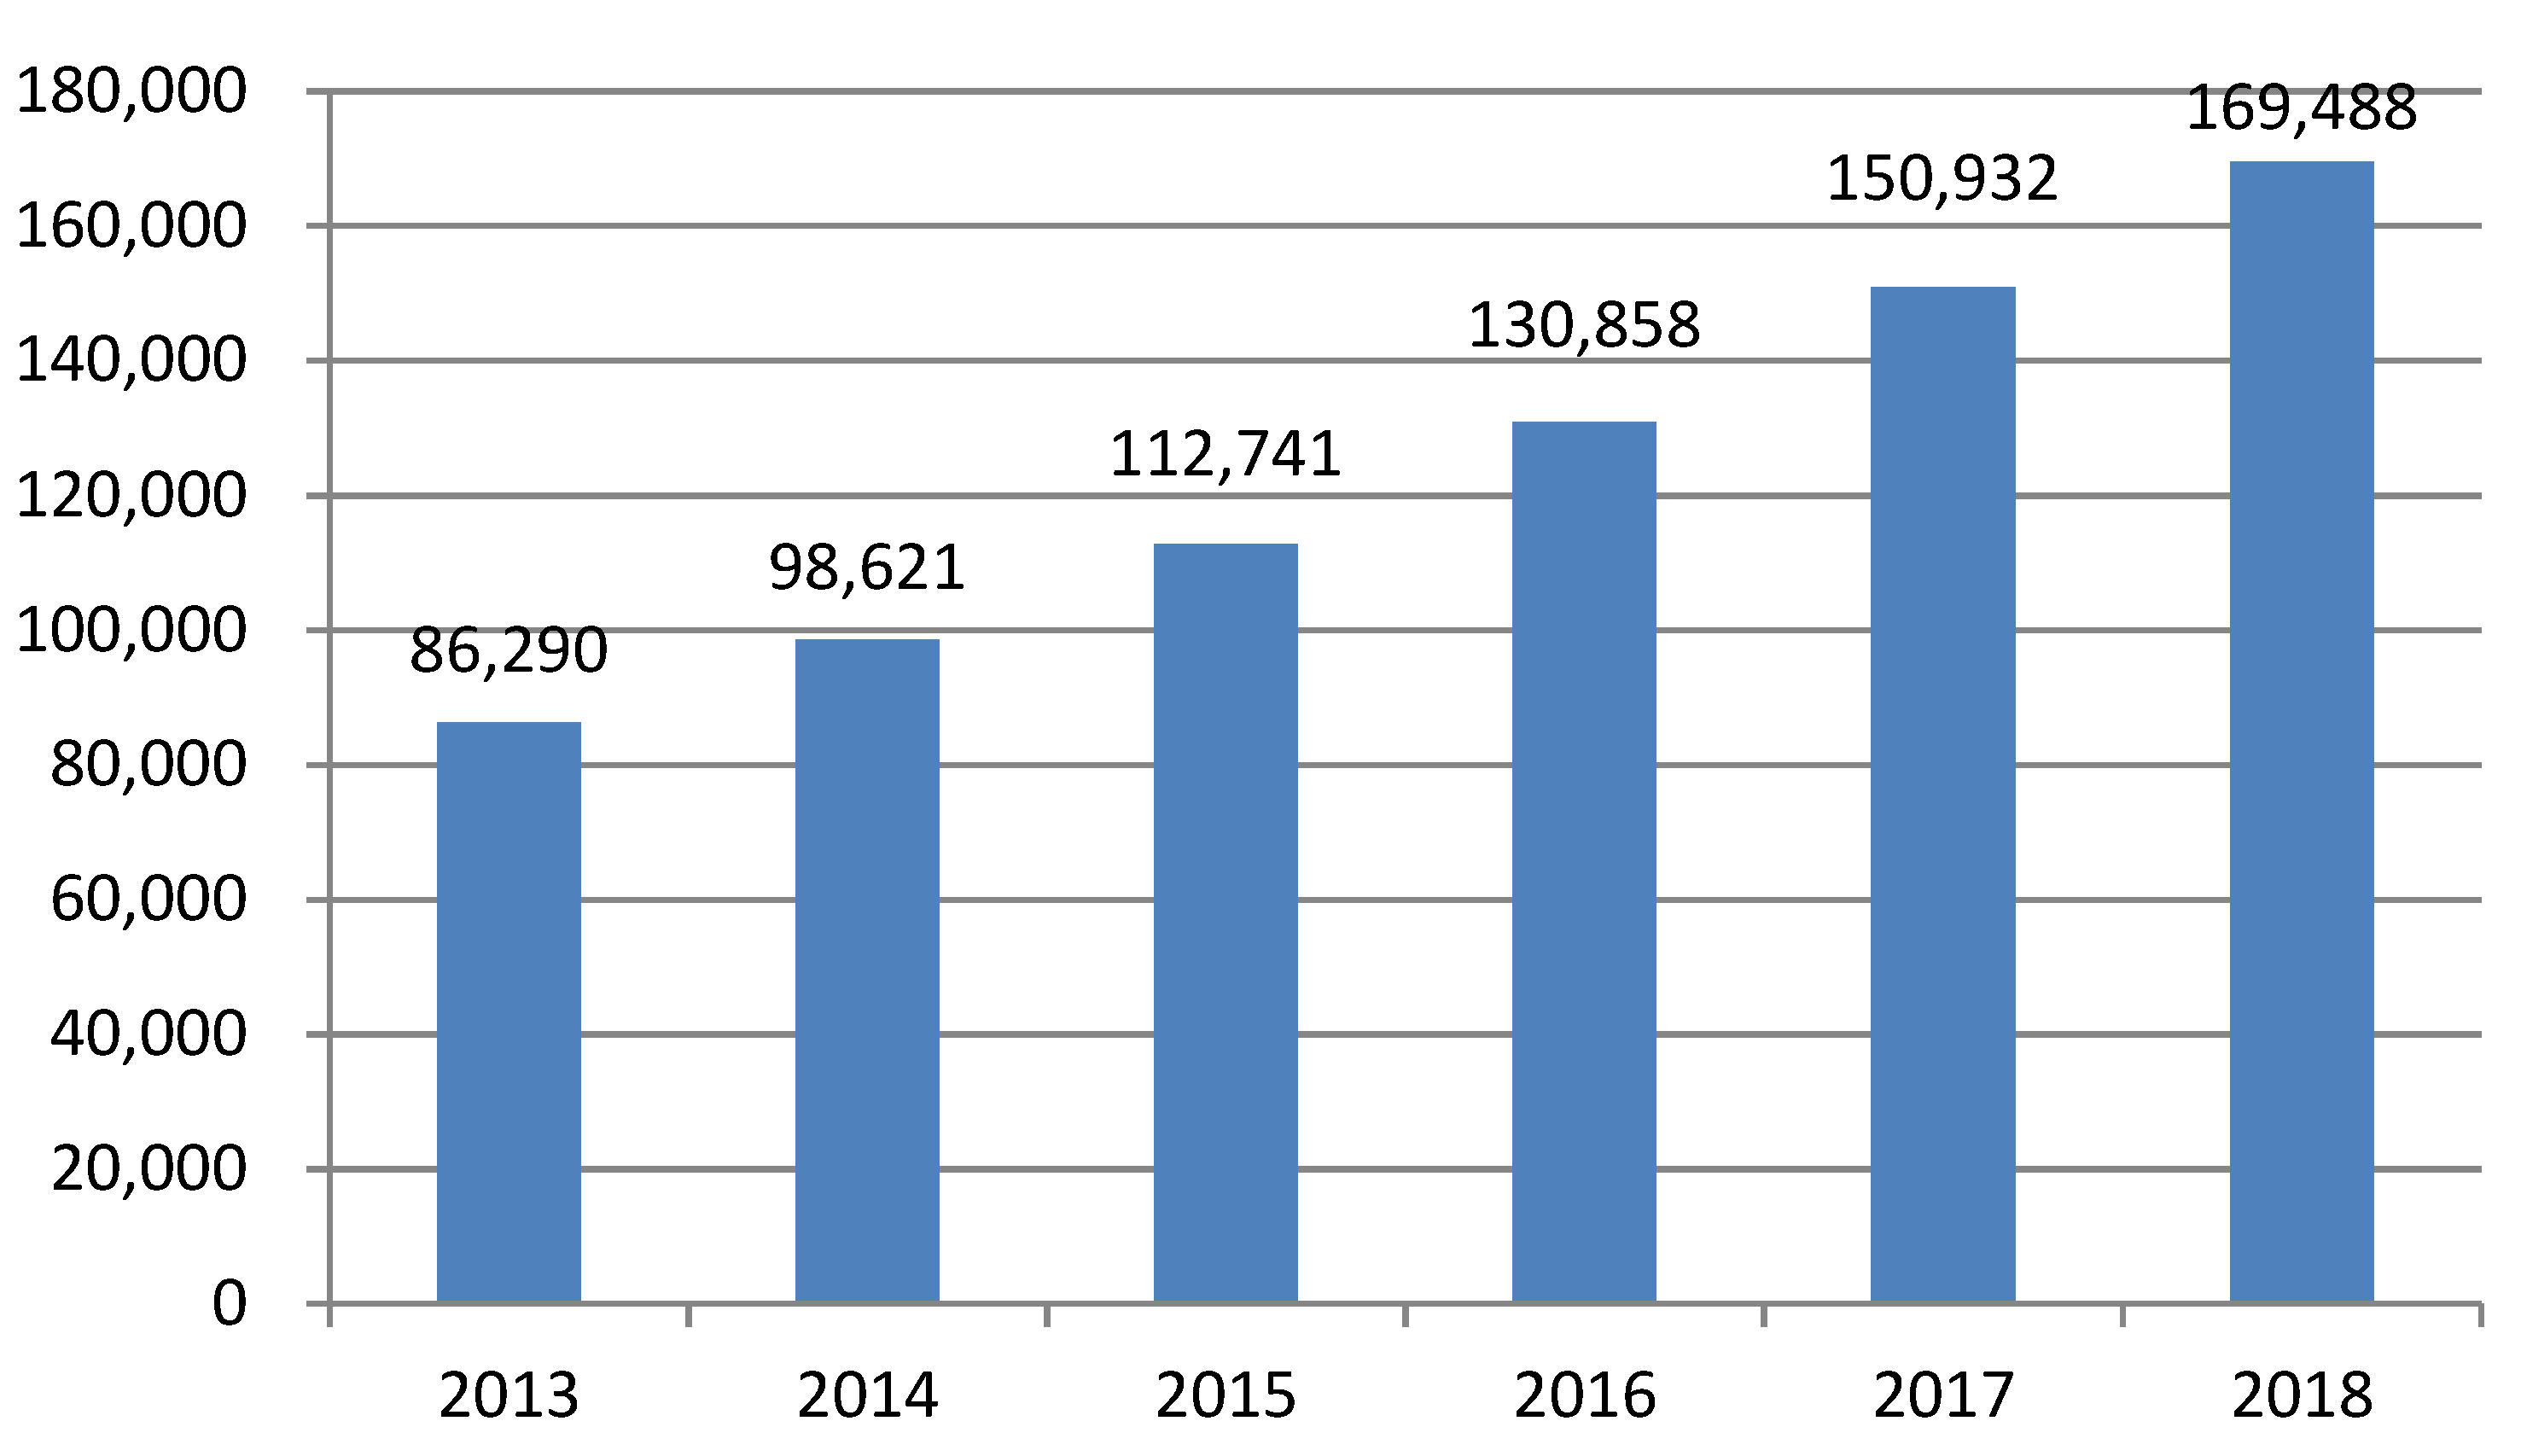
It can be seen from Figure 2, with the improvement of people’s living standards, and due to the inconvenience of leaving the island, the number of private cars is increasing, but this also causes traffic congestion and environmental pollution. Therefore, based on the idea of green transportation, it is necessary to control the travel of private cars.
4.2.3. Green Shipping Development
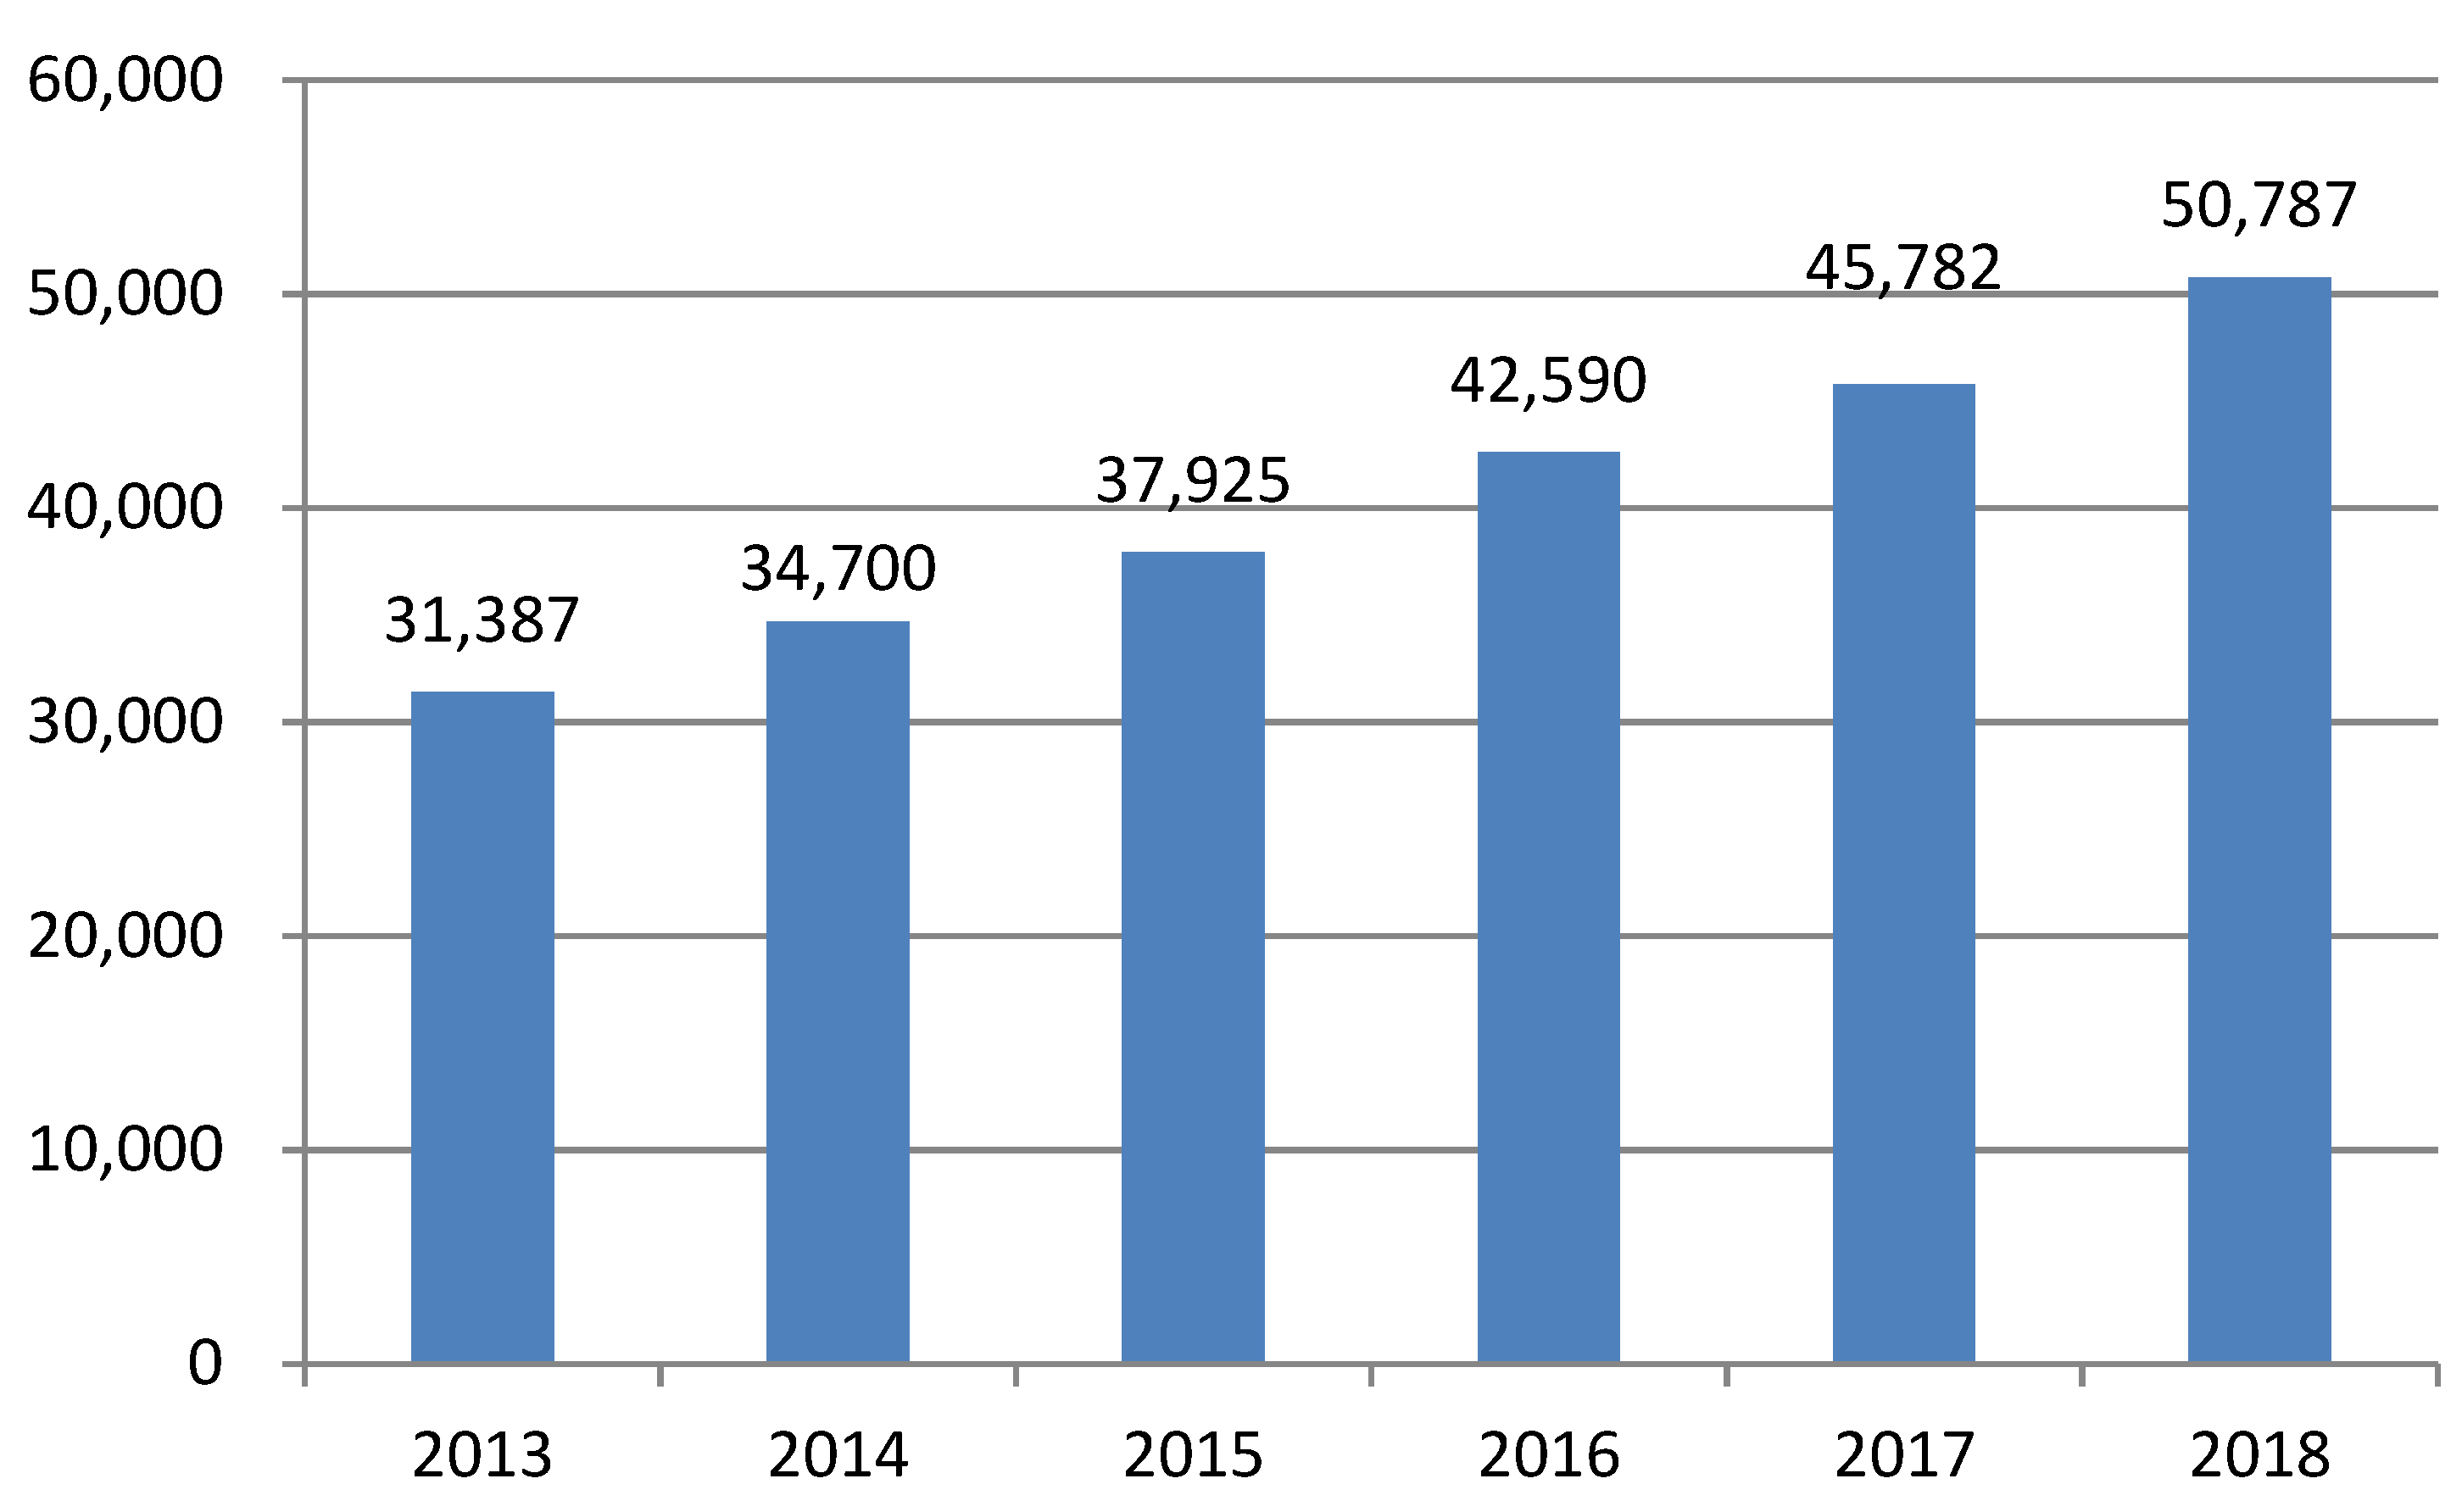
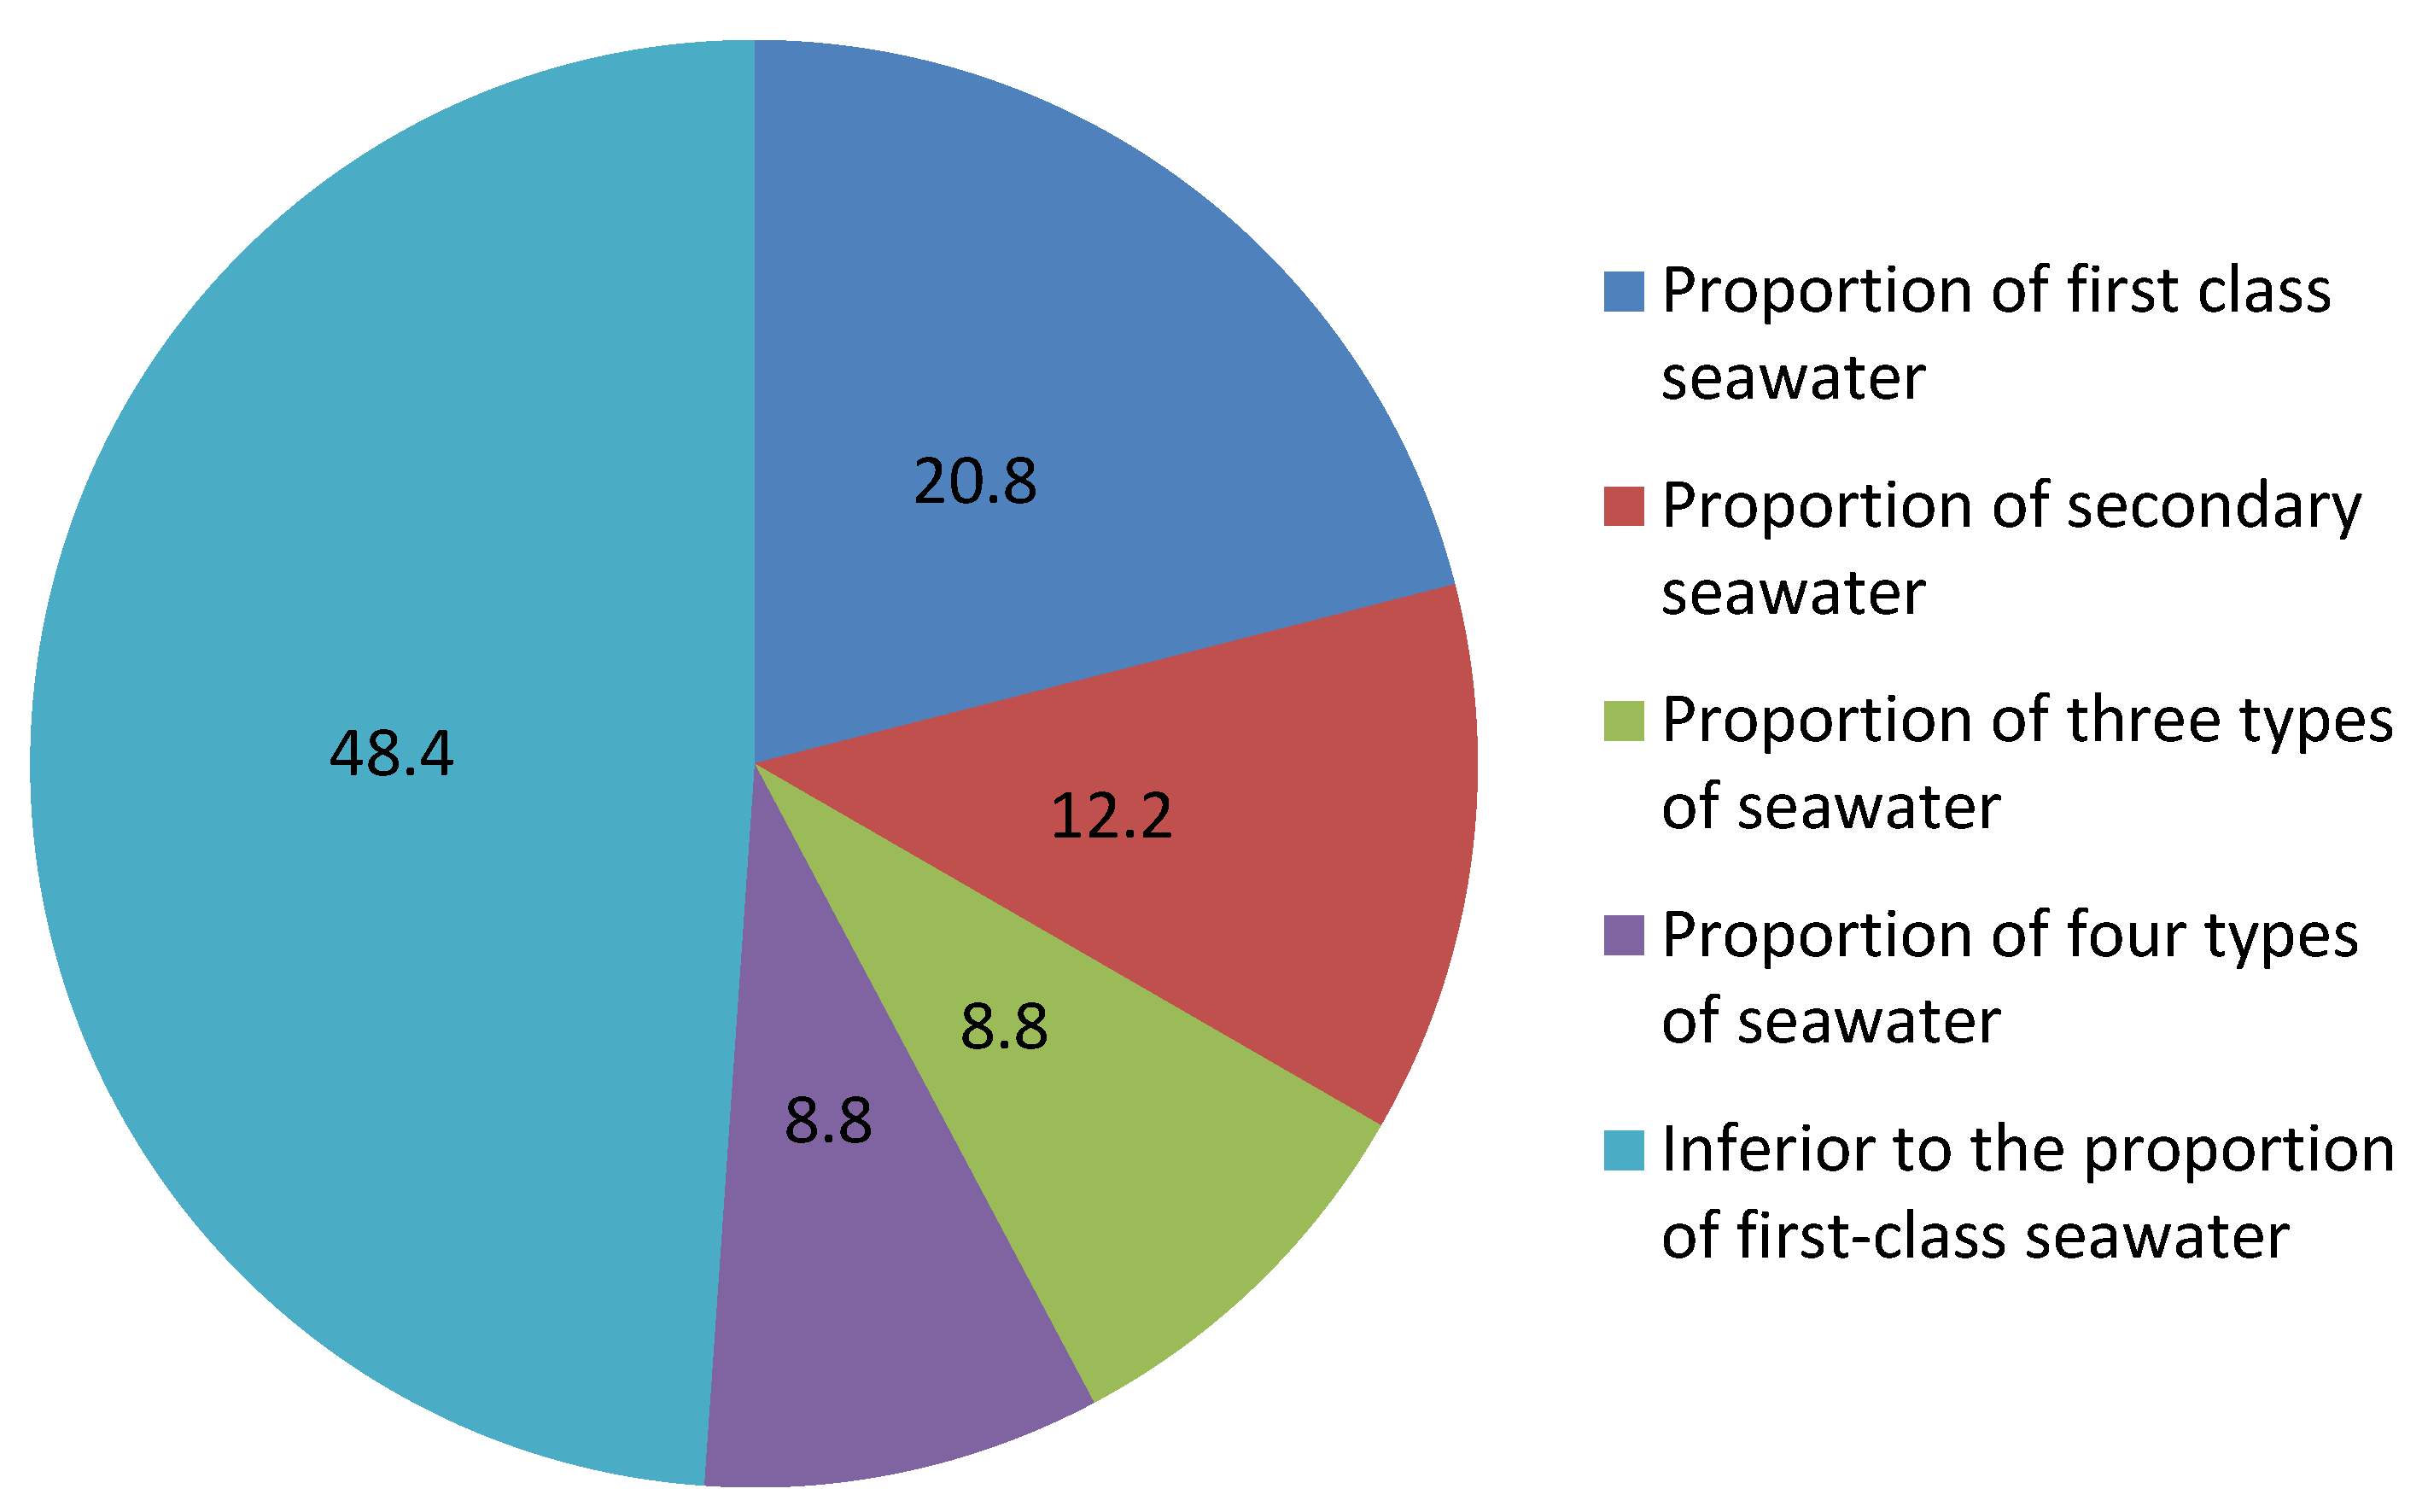
Pollutant emissions from ships is one of the important factors that cause air pollution and health problems. Ningbo Zhoushan port is a large port. It can be seen from Figure 3, with the deepening of China’s opening to the outside world, the volume of shipping trade and port throughput are increasing, and the emission of pollutants from shipping also increase. It can be seen from Figure 4 that Zhoushan’s coastal marine water quality is good, but the first class and inferior class of seawater occupies a large proportion. Therefore, in order to strengthen the control and treatment of pollutants discharged from ships further, we should comprehensively promote the pollution protection of ships and ports and promote the development of green shipping.
4.3. Improve The Infrastructure of New Energy Vehicles
With the environmental pollution caused by automobile exhaust emissions, the government’s support for the new energy vehicle industry and the enhancement of people’s awareness of environmental protection, new energy vehicles will replace the traditional fuel vehicles gradually. Therefore, we must speed up the improvement of new energy vehicle infrastructure. The most important problem to solve is the establishment of charging station in new energy vehicle based on battery and the storage and transportation of hydrogen in new energy vehicles based on hydrogen energy.
4.4. Promote The Concept of Green Transportation
To establish a perfect green transportation system, it needs not only the planning of the relevant government but also the support of the people. Therefore, we should adopt incentive mechanisms through TV, banners and other publicity means to promote the green transportation concept and encourage people to choose green travel modes such as public transport and walking.
5. Conclusions
In recent years, with the rapid development of China’s urbanization process and the improvement of people’s living standards, the number of private cars has also increased rapidly, which greatly facilitates people’s travel to a certain extent. However, the increasingly serious traffic congestion and automobile exhaust emissions have caused resource shortage, serious urban energy consumption, ecological environment damage and air pollution. The transportation system can not only solve the above problems, but also reduce the cost of construction and maintenance and promote social equity. Therefore, it is indispensable to develop green transportation [20,21].
Green transportation is the only way to realize the sustainable development of transportation. The core of green transportation is the extensibility of resources, the environment and the system, and the goal is to pursue the freedom of human rights, including human and environmental rights, social harmony, safety and health. Taking Zhoushan as an example, this paper analyzes the development of green transportation in Zhoushan from 2016 to 2018 by using the entropy weight TOPSIS method and calculates the gap between the development value and the ideal solution and the relative progress. The results show that the development of green transportation in Zhoushan in 2017 is better than that in 2018, and some suggestions such as strengthening the construction of urban road transportation system, optimizing transportation and perfecting the infrastructure of new-energy vehicles are put forward to promote the development of green transportation in Zhoushan, which provides a theoretical basis for the development of green transportation in Zhoushan in the later period.
Although the evaluation index system of urban green traffic established in this paper has been thoroughly studied and refined, it still needs to be improved in many aspects. In addition, the scientific quality and authoritativeness of selected values of some evaluation indices have yet to be determined, so further in-depth research is needed in the later work. In addition, according to the existing relevant research results and data, the value standards of some measurement indicators determined in this paper can be further studied with the help of new ideas and new methods in the future.
Author Contributions
Conceptualization, Z.S. and Q.Z.; methodology, Z.S.; software, Q.Z.; validation, Z.S., Q.Z. and Q.F.; formal analysis, Q.Z.; investigation, Q.Z.; resources, Z.S.; data curation, Q.Z.; writing—original draft preparation, Q.F.; writing—review and editing, Q.F.; supervision, Z.S.; project administration, Z.S. All authors have read and agreed to the published version of the manuscript.
Funding
This research received no external funding.
Institutional Review Board Statement
Not applicable.
Informed Consent Statement
Not applicable.
Data Availability Statement
The data in this article are all from the Zhoushan Statistical Yearbook.
Acknowledgments
We would like to thank the School of Economics and Management of Zhejiang Ocean University for its financial support and graduate student Xiao Yuan for her selfless help in the process of writing this paper.
Conflicts of Interest
The authors declare no conflict of interest. The funders had no role in the design of the study; in the collection, analyses, or interpretation of data; in the writing of the manuscript, or in the decision to publish the results.
References
- Pang, Z.; Xie, B. The connotation, characteristics and development strategy of urban green transportation—Based on the practical experience of foreign countries. Planner 2020, 36, 20–25. [Google Scholar]
- Chen, X.; Yuan, Q.; Gao, S. Sustainable development of urban transportation under the concept of green transportation. Compr. Transp. 2002, 2, 26–27. [Google Scholar]
- Lin, F. Green transportation: An effective means to realize sustainable development of urban transportation. In Ecological Economics: Analysis of Green Transportation Development Based on Entropy TOPSIS Method: A Case Study of Zhoushan; Chen, H., Ed.; Foshan, China, 2004; Volume 7, pp. 26–28. [Google Scholar]
- Chen, H. Thinking on the construction of green transportation system based on Sustainable Development. Ecol. Econ. 2006, 1, 117–120. [Google Scholar]
- Jiang, Y.; Guo, X. Urban transportation development strategy based on green transportation concept. J. Hefei Univ. Technol. Nat. Sci. Ed. 2009, 32, 1086–1090. [Google Scholar]
- Carvalho, L.; Mingardo, G.; Van Haaren, J. Green Urban Transport Policies and Cleantech Innovations: Evidence from Curitiba, Göteborg and Hamburg. Eur. Plan. Stud. 2012, 20, 375–396. [Google Scholar] [CrossRef]
- Jha, M.K.; Ogallo, H.G.; Owolabi, O. A Quantitative Analysis of Sustainability and Green Transportation Initiatives in Highway Design and Maintenance. Procedia-Soc. Behav. Sci. 2014, 111, 1185–1194. [Google Scholar] [CrossRef] [Green Version]
- Lu, H. Prospect of green transportation system of low carbon cities in the future. People’s Forum Acad. Front. 2015, 17, 27–38. [Google Scholar]
- Murray, A.T. Strategic analysis of public transport coverage. Socio-Econ. Plan. Sci. 2001, 35, 175–188. [Google Scholar] [CrossRef]
- Amekudzi, A.A.; Khisty, C.J.; Khayesi, M. Using the sustainability footprint model to assess development impacts of transportation systems. Transp. Res. Part A Policy Pract. 2009, 43, 339–348. [Google Scholar] [CrossRef]
- Xiao, Y.; Zhao, Q.; Kaku, I.; Xu, Y. Development of a fuel consumption optimization model for the capacitated vehicle routing problem. Comput. Oper. Res. 2012, 39, 1419–1431. [Google Scholar] [CrossRef]
- Fu, L.; Yang, S.; Zhao, Y.; Chen, H. Sustainable development strategy of urban transportation based on green transportation concept. China Popul. Resour. Environ. 2011, 21, 367–370. [Google Scholar]
- Wen, H.; Yang, R.; Zhang, Z.; Qi, W. Evaluation of green transportation development level of medium-sized cities. Urban Transp. 2017. [Google Scholar] [CrossRef]
- Zeng, Z.; Li, M.; Liu, D. A study on the effect of low carbon travel on green transportation development based on data envelopment analysis. J. Xinyang Norm. Univ. (Nat. Sci. Ed.) 2019, 32, 415–420. [Google Scholar]
- Jin, D.; Dong, X. Evaluation of Urban Green Transportation Development Based on DPSIR Model. Ecol. Econ. 2018, 34, 79–85. [Google Scholar]
- Liu, Y.; Sun, X.; Huang, C. Analysis of Influencing Factors and Mechanism of Urban Green Transportation Development. Math. Pract. Underst. 2020, 50, 284–292. [Google Scholar]
- Wang, Q.; Qian, Y.; Zeng, J.; Guang, X. Research on green transportation development in river valley cities under the background of new urbanization: A case study of Lanzhou. Ecol. Econ. 2020, 36, 95–99. [Google Scholar]
- Rauter, R.; Globocnik, D.; Perl-Vorbach, E.; Baumgartner, R.J. Open innovation and its effects on economic and sustainability innovation performance. J. Innov. Knowl. 2019, 4, 226–233. [Google Scholar] [CrossRef]
- Abubakar, A.M.; Elrehail, H.; Alatailat, M.A.; Elçi, A. Knowledge management, decision-making style and organizational performance. J. Innov. Knowl. 2019, 4, 104–114. [Google Scholar] [CrossRef]
- Philipson, S. Sources of innovation: Consequences for knowledge production and transfer. J. Innov. Knowl. 2020, 5, 50–58. [Google Scholar] [CrossRef]
- Antunes, H.D.J.G.; Pinheiro, P.G. Linking knowledge management, organizational learning and memory. J. Innov. Knowl. 2020, 5, 140–149. [Google Scholar] [CrossRef]
Figure 1.
Passenger and transport volume over the years.

Figure 2.
Number of small vehicles over the years.

Figure 3.
The throughput of Zhoushan over the years.

Figure 4.
The water quality status in 2017.


Table 1.
Evaluation on the development of green transportation in Zhoushan.
| Target Layer A | ||
|---|---|---|
| Evaluation on the development of green transportation in Zhoushan | Basic indicators | Population |
| Annual average wage of On-the-job employees | ||
| GDP | ||
| Vehicle | Large and medium sized cars | |
| Small car | ||
| Other vehicles | ||
| Motorcycles | ||
| Motorized fishing boats | ||
| Road construction | Road length | |
| Road area | ||
| Green coverage area |
Table 2.
Original data of index layer.
| 2016 | 2017 | 2018 | |
|---|---|---|---|
| Population ten thousand people | 97.33 | 97.15 | 96.90 |
| Annual average wage of on-the-job employees / yuan | 57,759 | 63,581 | 69,634 |
| GDP /ten thousand yuan | 10,761,943 | 12,197,751 | 13,166,986 |
| Large and medium sized cars / vehicle | 8128 | 8796 | 9336 |
| Small car / vehicle | 130,858 | 150,932 | 169,488 |
| Other vehicles / vehicle | 963 | 969 | 1031 |
| Motorcycles / vehicle | 30,107 | 37,570 | 30,642 |
| Motorized fishing boats / vessel | 7629 | 7333 | 7286 |
| Road length /km | 730.72 | 839.80 | 856.55 |
| Road area /ten thousand m2 | 1393.43 | 1500.38 | 1537 |
| Green coverage area / hectare | 16,191.35 | 16,405.03 | 6641.91 |
Data source: Zhoushan statistical yearbook.
Table 3.
Standardization of index layer data.
| 2016 | 2017 | 2018 | |
|---|---|---|---|
| Population ten thousand people | 1.000 | 0.581 | 0.000 |
| Annual average wage of on-the-job employees / yuan | 0.000 | 0.490 | 1.000 |
| GDP /ten thousand yuan | 0.000 | 0.597 | 1.000 |
| Large and medium sized cars / vehicle | 0.000 | 0.745 | 1.000 |
| Small car / vehicle | 0.000 | 0.520 | 1.000 |
| Other vehicles / vehicle | 0.000 | 0.088 | 1.000 |
| Motorcycles / vehicle | 0.000 | 1.000 | 0.072 |
| Motorized fishing boats / vessel | 1.000 | 0.137 | 0.000 |
| Road length /km | 0.000 | 0.867 | 1.000 |
| Road area /ten thousand m2 | 0.000 | 0.745 | 1.000 |
| Green coverage area / hectare | 0.978 | 1.000 | 0.000 |
Table 4.
Entropy value and entropy weight of index layer.
| 2016 | 2017 | 2018 | |||
|---|---|---|---|---|---|
| 0.6324 | 0.3676 | 0.0000 | 0.5987 | 0.0754 | |
| 0.0000 | 0.3290 | 0.6710 | 0.5766 | 0.0796 | |
| 0.0000 | 0.3738 | 0.6262 | 0.6016 | 0.0749 | |
| 0.0000 | 0.4269 | 0.5731 | 0.6212 | 0.0712 | |
| 0.0000 | 0.3420 | 0.6580 | 0.5847 | 0.0780 | |
| 0.0000 | 0.0811 | 0.9189 | 0.2561 | 0.1398 | |
| 0.0000 | 0.9331 | 0.0669 | 0.2235 | 0.1459 | |
| 0.8795 | 0.1205 | 0.0000 | 0.3349 | 0.1250 | |
| 0.0000 | 0.4643 | 0.5357 | 0.6286 | 0.0698 | |
| 0.0000 | 0.4269 | 0.5731 | 0.6212 | 0.0712 | |
| 0.4945 | 0.5055 | 0.0000 | 0.6309 | 0.0694 |
Table 5.
Criterion layers’ relative proximity.
| Year | Basic Indicators | |||||
|---|---|---|---|---|---|---|
| Relative Proximity | Ranking | Relative Proximity | Ranking | Relative Proximity | Ranking | |
| 2016 | 0.0003 | 3 | 0.0011 | 3 | 0.0002 | 3 |
| 2017 | 0.0005 | 2 | 0.0040 | 2 | 0.0062 | 1 |
| 2018 | 0.0019 | 1 | 0.0051 | 1 | 0.0014 | 2 |
Publisher’s Note: MDPI stays neutral with regard to jurisdictional claims in published maps and institutional affiliations. |
© 2021 by the authors. Licensee MDPI, Basel, Switzerland. This article is an open access article distributed under the terms and conditions of the Creative Commons Attribution (CC BY) license (https://creativecommons.org/licenses/by/4.0/).
Share and Cite
MDPI and ACS Style
Shen, Z.; Zhao, Q.; Fang, Q. Analysis of Green Traffic Development in Zhoushan Based on Entropy Weight TOPSIS. Sustainability 2021, 13, 8109. https://0-doi-org.brum.beds.ac.uk/10.3390/su13148109
AMA Style
Shen Z, Zhao Q, Fang Q. Analysis of Green Traffic Development in Zhoushan Based on Entropy Weight TOPSIS. Sustainability. 2021; 13(14):8109. https://0-doi-org.brum.beds.ac.uk/10.3390/su13148109
Chicago/Turabian StyleShen, Zuiyi, Qianqian Zhao, and Qimin Fang. 2021. "Analysis of Green Traffic Development in Zhoushan Based on Entropy Weight TOPSIS" Sustainability 13, no. 14: 8109. https://0-doi-org.brum.beds.ac.uk/10.3390/su13148109
Note that from the first issue of 2016, this journal uses article numbers instead of page numbers. See further details here.