Article

Innovative Approaches to Model Visualization for Integrated Management Systems

by
Alena Pauliková
1,*,
Katarína Lestyánszka Škůrková
1,
Lucia Kopilčáková
2,
Antoaneta Zhelyazkova-Stoyanova
3 and
Damyan Kirechev
3
1
Institute of Industrial Engineering and Management, Faculty of Materials Science and Technology in Trnava, Slovak University of Technology in Bratislava, 917 24 Trnava, Slovakia
2
Independent Researcher, Oakville, ON L6K3A7, Canada
3
Faculty of Economics, University of Economics, 77, Kniaz Boris I Blvd., 9002 Varna, Bulgaria
*
Author to whom correspondence should be addressed.
Sustainability 2021, 13(16), 8812; https://0-doi-org.brum.beds.ac.uk/10.3390/su13168812
Submission received: 27 June 2021 / Revised: 29 July 2021 / Accepted: 31 July 2021 / Published: 6 August 2021
(This article belongs to the Special Issue Sustainable Development of Building Process Cycle on the Environment)

Abstract

:
With a growing number of standards and their related requirements for manufacturers and/or service providers, there is a need to simplify their application process. The aim of this article is to propose a simplified implementation of multiple management system standards (MSSs) through visualization management. Results of visualization provide a perspective of interrelatedness of requirements of MSSs, and how they fit in the overall context. The three standards used in this project, defined as a complex triplet of integrated management systems (IMSs), are: Quality (QMS), Environment (EMS) and Event Sustainability (ESMS) Management Standards. Visualization is developed by creating clusters using a program intended for creating small world networks. This step is preceded by the creation of a database in a spreadsheet format for data mining, where the requirements are divided into specific and common ones. The main emphasis will be on facilitating the assessment of synergies. The resulting visualized composed cluster model of selected areas includes the clauses. It is possible to further extend the model by adding other standards, depending on needs of interested parties. In essence, the model is a part of visual process, and it simplifies, speeds up and clarifies managerial decision-making processes related to the implementation of the MSSs.

1. Introduction

The International Organization for Standardization (ISO) offers manufacturers and service providers guidance and support in various stages of a company’s existence, whether it is new, already existing, small or large, and regardless of its area of activity. Standards are a set of powerful business tools for organizations. They inspire trust, reduce costs, increase productivity and increase profits [1]. Standards support managers during the process of starting a company and its development, improving its competitiveness, or increasing the quality of products.
ISO certifications are not mandatory, but in the world of business they help create the added value and facilitate the communication flow informing the stakeholders, including the customers, that the company is interested in the production of quality products or environmental protection. Finally, ISO certification provides the organizations with confidence that the steps they undertake in their production and service delivery are measurable, evaluated and constantly improved. However, if the top management, based on a strategic decision, strives for certification and implements a quality management system in the organization, its compliance becomes binding [2].
For an organization to be successful, it needs to be managed systematically and transparently, while meeting stakeholders’ requirements and maintaining the required quality of products or services. For example, to achieve quality goals and increase the organization’s credibility, ISO has developed standards for quality management systems, ISO 9000 series standards.
The objective of this project is to elaborate a comprehensive overview used on a global scale and subsequent coordination of individual areas of management systems as part of a comprehensive integration for industrial operations including quality management, environment, quality, health and safety, energy, information security, transport, corporate social responsibility, business continuity and more. The set of selected areas will include the organization’s connections with industrial operations, key customer requirements, leadership, planning, operational support, operations, performance evaluation and improvement. Coordination will be performed using hierarchical organizational diagrams and finally visualized by Small World Networks and Scale-Free Networks.
The benefits of the application can be summarized in three areas: {1} personal and professional awareness of the need to implement management systems and their integrations in organizations; {2} business perspective as the MSS integration is a powerful decision-making tool and, finally, {3} administration, since the MSS implementation carries a significant amount of supporting documentation.

1.1. Integration of Standards: Their Importance and Benefits

The process of standards integration is time-consuming and requires a high degree of flexibility and a lot of effort on the part of implementing organizations. The challenge becomes apparent when it is necessary to implement or integrate several standards at once. From the point of view of processing a large amount of relevant information, it is often the case that the provision of supporting documents is forgotten or, on the contrary, the fulfillment of integration requirements is inadvertently repeated.
The idea of an integrated management system (IMS) is to create correspondence and combine two or more externally independent management systems, for example in accordance with ISO 9001, ISO 14001 and ISO 20121.
According to Santos the future lies in the integration of these management systems, managed by only one multidisciplinary team with training and skills in several areas, thereby economizing both financial and human resources [3].
The three standards used in this project, defined as a triplet of integrated management systems, are {1} a quality management standard (QMS), {2} an environmental management standard (EMS) and {3} an event sustainability management standard (ESMS). The main reason for emphasizing these three standards in studies carried out at IMS is that human health, the environmental dimension and quality have become an integral part of today’s life. All three standards can be implemented in all sectors, regardless of the type of activity, size and number of employees of the organization. In addition, these standards cover different geographical, cultural and social conditions [4].
As organizations continuously adapt to the market and customer requirements, the pressure for flexibility and responsiveness grows. Therefore, a new necessity has emerged in organizations, namely, to integrate these systems into a single IMS—Integrated Management System and we cannot forget the fact that the environmental improvement of the product must be considered in relation to the impacts on quality, health, and safety, as mentioned by Jørgensen (2008) [5]. Despite having their origins in different aspects of company performance, the quality, environment, and safety management systems have a lot in common, as mentioned by Fresner and Block [6,7] among other authors.
This project proposes a simplified form of implementation of several management system standards (MSS) through the process of visualization. It also evaluates the level of its contribution to the process of implementation, sustainable procurement and motivation of stakeholders.

1.2. Visualization

The visualization process follows the integration. It is a process of interpreting data and presenting them in pictographic or graphical format [8]. Many humans are highly visual creatures and since a picture is worth a thousand words, many prefer to see a picture. We live in the age of data, which means that the amount of information that needs to be processed to achieve the desired outcome is massive. The more data or information we can process, the better and faster we know, as the organization, how to respond. Organizations are facing a challenge with the growing number of processing requests, where they are simply unable to react, either due to the lack of time or resources. The inability to adapt costs time, reputation and possibly a future of the organization.
Data visualization, or rather visualization management, helps organizations understand the meaning and interconnection of requirements by summarizing and presenting them in a simple and easy-to-understand format. It supports the culture transformation by turning data into pictures that tell the story about the business.
Visualization is developed by creating clusters of models using a visualization program designed to create small network models of the world (e.g., TouchGraph, Python, Matlab). According to Milgram (1967) sometimes it is useful to visualize the abstract properties of a scientific problem before studying it in detail; that is, we construct a model of the main features of the phenomenon as we understand them [9].
This step is preceded by the creation of a database in a format of a data mining table, where the requirements are divided into specific and general. Data mining involves examining and analyzing large blocks of information to gather meaningful patterns and trends.
Applying visualization to tackle the implementation complexities of different management system standards is unique in its nature. To our knowledge, and research of available sources, this type of networking has not, so far, been analyzed or synthesized.
The visualization goes beyond the list of requirements of the standard and reveals on a larger scale patterns typical of a given integration. It provides a better and faster way to identify patterns, trends and correlations in sets of requests that would otherwise remain undetected when working with the text alone. The results are shown in context, and it is possible to see how they fit into the overall picture, their correlation and connection with metadata, such as e.g., requirements and documented information.
The result of the process is a visualized, complex, cluster model of selected areas, which simplifies, speeds up and clarifies managerial decision-making processes related to the implementation of system management standards. Standards, resp. data that appeared to be disconnected or independent before integration, are now merged into the integrated system. Visualization reveals the requirements of standards that are common to all integrated standards and those that need to be met separately.
Data visualization is a real asset for any business as it helps make real-time business decisions. It visualizes extracted information into logical and meaningful parts and helps users avoid information overload by keeping things simple, relevant, and clear. It helps companies to analyze its different processes so that management can focus on the areas for improvement to generate more revenue and improve productivity. Additionally, it helps managers to understand customers’ behaviors and interests and hence retains customers and market shares [8].

1.3. Small World Networks

The importance of examining society as a network is not new, but according to some authors, this type of analysis is particularly important and beneficial in today’s world. According to Manuel Castells (2000) [10], networks are a very old form of social organization. Their advantages lie in their flexibility and adaptability. In the past, the problem of network structures was the inability to maintain complexity beyond a certain critical limit in terms of size. Today, these disadvantages are overcome mainly by new information and communication technologies [11].
A social network is called a small-world network if, roughly speaking, any two people in the network can reach each other through a short sequence of acquaintances [12].
Milgram’s basic small-world experiment is the most famous experiment that analyzed the small-world problem. The purpose of the experiment was to determine whether most pairs of people in society were linked by short chains of acquaintances. So, individuals were asked to forward a letter to a “target” through people whom they knew on a first-name basis [13].
Milgram’s experiment really demonstrated two striking facts about large social networks: first, that short paths are there in abundance; and second, that people, acting without any sort of global “map” of the network, are effective at collectively finding these short paths [14].
The ability to construct a searchable network in this way, with long-range links whose probabilities decay with distance, has proved useful in the design of peer-to-peer file sharing systems on the Internet, where content must be found by nodes consulting one another in a decentralized fashion. In other words, nodes executing these look-up protocols are behaving very much like participants in the Milgram experiments—a striking illustration of the way in which the computational and social sciences can inform one another, and the way in which mathematical models in the computational world turn into design principles with remarkable ease [15].
The small-world phenomenon—the principle that we are all linked by short chains of acquaintances, or “six degrees of separation”—is a fundamental issue in social networks; it is a basic statement about the abundance of short paths in a graph whose nodes are people, with links joining pairs who know one another [15]. Since then, the Small World effect has been observed in many natural networks and appears to characterize several networks [16].
The Milgram’s experiment was used as an inspiration, not as a main pillar for the project. Milgram explains the final number of links as six. Furthermore, while he finalizes his small world network idea with six nodes (or people, for that matter), the links in the MS standards are not limited in this way. The number of links in the management systems standards can be chosen based on stakeholder needs, for example. It reflexes the complexity of clauses in standard or efficiency of using the entire triplet cluster.
We discover that as the small networks connect people, they can also connect terms and requirements, or clauses, if we replace people, represented by nodes in the network, with specific information. In this perspective the person carries less of an impact; it is rather the structure that simplifies their lives. A person, or a user, is the receiver, whereas the structure is the executor of the action. This represents an innovative approach to the visualization and use of the small world networks.

2. Materials and Methods

One of the basic tasks of management systems standards (MSS) is their use in supporting management and leading functions within the entire organizational structure. These standards are designed to be applicable in different industries, in companies of varying complexity and in different geographical, social or cultural settings. Management standards can be seen as an excellent tool for creating a solid organizational management. Their use is appropriate in the decision-making process in the organization where the individual standards are implemented.

2.1. Reasoning behind the Selection of MSS for the Triplet Formation

The selection of the three management systems for the standard triplet assembly used in the visualization was assessed from several different standpoints. Listed below are the aspects that influenced the selection of the three management systems. The selected management systems:
(A)
Have their own internationally recognized standards;
(B)
Are type A standards, i.e., a type of standard that contains requirements against which an organization can claim conformance. To claim the conformance with the standard, the organization must provide evidence to support that it meets the specified requirements. Evidence is usually obtained through an audit process. There are first party, second party and third-party audits used in the process. The first party audit is done by the organization, internally. The second- and third-party audits are external. The third-party audit is the one that could result in certification;
(C)
Are conceptually drawn up with High Level Structure (HLS) which have the same structure of articles and contain many of the same terms and definitions. This is particularly useful for the organizations that choose to operate a single (sometimes called “integrated”) management system that is able simultaneously meet the requirements of two or more management system standards [17];
(D)
Operate based on the PDCA cycle and take into account a process approach and risk-based reasoning;
(E)
They can also be certified individually, i.e., they are applied in autonomous mode, which means that management systems operate in one organization independently of each other. However, if a requirement arises based on some change, then it is possible for these management systems (supported by ISO standards) to create integration pairs, e.g., the first with the second or the second with the third or the third with the first MSS. This request is usually initiated by the customers or clients of the organization, i.e., the interested party;
(F)
Have a close connection on the historical timeline of their origin. This points to the fact that their creation was necessary for the organizations affected by the subject of these standards;
(G)
Have an extended application, so they are generally known and accepted worldwide. Two of these management systems are also available in the national language of all its authors;
(H)
Two of these management systems are most often integrated in organizations;
(I)
Correspond with goals cited in The 2030 Agenda for sustainable development. Predominantly with goals number 8 and 12. The goal 8 “Promote sustained, inclusive and sustainable economic growth, full and productive employment and decent work”. The goal 12. “Ensures sustainable consumption and production patterns” [18];
(J)
The author of the article previously prepared a publication in the national language that contains two of the management systems. This article is a continuation of her research work [19].
Table 1 represents a summary evaluation of all above-mentioned aspects leading to a targeted selection of the management standards chosen for the development of the triplet.
When selecting standards for the triplet, we considered predominately the first two as the world’s most widely used and the most sought after by organizations (ISO 9001:2015 + ISO 14001:2015). The third standard, ISO 20121:2012, was selected purposefully as management systems standard directly related to sustainability. Based on the above-mentioned explanations the following management systems standards were selected for the triplet.
  • QMS—ISO 9001: 2015 Quality Management Systems—Requirements; 5th edition; 29 pages; publication date Sept. 2015.
Quality management is nowadays an integral part of the overall management system within the organization. It represents the coordination of a set of activities that are focused on the management and leadership of the organization with an emphasis on quality, i.e., satisfy customer requirements. The results of Silva et al. [20] indicate that leadership is a critical element of QMS performance, enhancing transformational leadership, which appears to be the dominant self-perceived style of the quality managers who participated [in the study]. Nevertheless, these practitioners recognize the difficulties in committing all employees to the sustainability journey.
Standard 9001 is part of the ISO 9000 family and contains standards for improving the quality of products and services and continuously meeting customer expectations. Created and gradually introduced since 1987, the ISO 9001 standard sets out criteria for a quality management system and is the only standard in the ISO 9000 family that can be certified. This standard is based on several quality management principles, including a strong customer focus, motivation and implications of top management, a process approach and continuous improvement. Using ISO 9001 helps ensure that customers receive consistent, high-quality products and services, which in turn brings many business benefits [21].
In the ISO 9001 standard, we find a specification of the minimum requirements for the quality management system in areas of the organization, where proof of the ability to manufacture products or provide services is required that meet customer requirements in compliance with legislative laws and regulations. If the organization demonstrates compliance with the requirements of the ISO 9001 standard, the organization may be issued, by an independent accredited organization, a Quality Management System Certificate in accordance with ISO 9001 with a validity of three years [22].
The standard ISO 9001 contributes to the following Sustainable Development Goals: 1 No Poverty; 9 Industry, Innovation and Infrastructure; 12 Responsible Consumption and Production; 14 Life Below Water.
  • EMS—ISO 14001:2015 Environmental management systems—Requirements with guidance for use, 3rd edition, 35 pages; publication date Sept. 2015.
In 1996, ISO introduced its ISO 14001 environmental management system standard. The fundamental purpose of this standard is to provide companies and organizations with tools to help them identify and manage the environmental impact of their activities. These instruments will thus provide a framework for environmental protection and a way of responding to changing environmental situations in line with socio-economic needs [23]. The standard is a tool that supports continuous progress and improvement, and which also helps to achieve the criteria set by the law.
Since its inception in 1996, ISO 14001 has been adopted by more than 300,000 organizations, from small businesses to some of the world’s largest companies [23].
EMS systems are designed to monitor and report the results of the company’s environmental sustainability activities for internal and external stakeholders. Firms use the standard for compliance purposes—which allows them to avoid fines or public scandals (PR)—and increase business efficiency, for example by reducing waste through the production or distribution cycle.
Standard 14001 is part of a set of standards for organizations that want to reduce the size of their environmental footprint through specific activities, such as reducing pollution or waste. Like all other ISO standards, ISO 14001 is not a specific set of activities that a participating company should precisely follow. Rather, it is a set of guidelines and standards that must be adapted to the specific needs and activities of the given organization.
The basic concept of ISO 14001 is that organizations need to develop a clear set of environmental policies, use a set of best practices to proactively monitor compliance, and to continuously improve the system based on continuous feedback and results.
ISO 14001 provides requirements with instructions for use that relate to environmental systems. Other standards in the Family 14000 focus on specific approaches such as audits, communication, labeling and life cycle analysis, as well as environmental challenges such as climate change [23].
The standard ISO 14001 contributes to the following Sustainable Development Goals: 1 No Poverty; 2 Zero Hunger; 3 Good Health and Well-being; 4 Quality Education; 6 Clean Water and Sanitation; 7 Affordable and Clean Energy; 8 Decent Work and Economic Growth; 9 Industry, Innovation and Infrastructure; 12 Responsible Consumption and Production; 13 Climate Action; 14 Life Below Water; 15 Life on Land.
  • ESMS—ISO 20121: 2012 Event Sustainability Management Systems—Requirements with guidance for use, 1st edition, 42 pages, date of issue June 2012.
ISO 20121: 2012 specifies requirements for a sustainability event management system for the required type of event or activity related to the event and provides guidance on compliance with these requirements. As such, it represents one of the first holistic approaches to sustainability performance management. Large events, e.g., Olympic Games, marathons, diverse festivals, etc., attract valuable visitor revenue and economic investment. At the same time, however, they bring many security risks [24].
ISO 20121 provides the framework for identifying the potentially negative social, economic, and environmental impacts of events by removing or reducing them and capitalizing on more positive impacts [25]. The standard is applicable to all types and sizes of organizations involved in the design and delivery of events, and accommodate diverse geographical, cultural, and social conditions. At the same time, it requires organizations to recognize their relationship with and impact on society and society’s expectations of events.
ISO 20121 is intended to be applied flexibly and will allow organizations that have not formally addressed sustainable development to start to implement an event sustainability management system. Organizations with existing management systems will be able to integrate the requirements of this International Standard into their existing systems. Every organization will benefit from the process of continual improvement over time [26].
The implementation of this standard is based on the Plan-Do-Check-Act (PDCA) cycle. The Planning deals with the beginning stage of an organization wishing to comply with the standard. The Do part of the cycle is the implementation and operation of the ISO 20121 standard within an organization. The Check cycle deals with checking and correcting errors. The Act part deals with reviewing of the entire process by the organization’s top management.
The benefits of having ISO 20121 touches on all functional levels of an organization. Having a clear picture of the management activities that benefit not only the company’s revenue but also a customer and the environment brings improved organizational understanding, respect and support of stakeholders and other interested parties, boosts the client’s confidence, and improves the organizational overall reputation. By applying the sustainable strategies, the organization complies with many national or regional laws and regulations, and on the grand scale works towards the achievement of the United Nations sustainable development goals.
The standard ISO 20121 contributes to the following Sustainable Development Goals: 3 Good Health and Well-being; 5 Gender Equality; 6 Clean Water and Sanitation; 7 Affordable and Clean Energy; 8 Decent Work and Economic Growth; 9 Industry, Innovation and Infrastructure; 10 Reduced Inequalities; 11 Sustainable Cities and Communities; 12 Responsible Consumption and Production; 13 Climate Action; 16 Peace, Justice and Strong Institutions.

2.2. Selection of Software for MSS Visualization

Graph visualization is increasingly used to present various models—communities, relationships, flows, hierarchies, or spatial networks. The overall process of such visualization consists of the following steps:
  • data extraction, data cleaning and transformation, and data import;
  • creation of nodes and edges and their layout to emphasize the properties of the graph;
  • adding various attributes to improve visualization (width of edges, size of nodes and color resolution);
  • research and interaction—the possibility of interactive work with the graph.
As there are a lot of different data storage formats available, there is, as well, a large amount of network analysis software—both specialized and generic ones. Many software packages are available in paid form, as a volume license for academic processes or as open source programs.
The following software was available to create the MSS triplet:
  • Cytoscape—is an open-source program, that is developed for the use and visualization of network graphs in molecular biology. However, its use is also possible in the field of general graphs. It can load and process CSV, GML and XML files. Automatic placement of network graph nodes is possible, similarly to the Gephi program. It is possible to customize each part of the graph visualization, as well as change the edges, color of vertices or text and many other parameters. Exporting the graph is possible in several formats (jpg, png, ps, pdf or svg). It is possible to determine various statistical characteristics of the graph in the application. There is the possibility of creating subgraphs with specific parameters, unifying graphs as well as applying various extensions using additional applications [27,28].
  • Gephi—Alternative option is to use the free Gephi program, which is suitable for interactive visualization of graphs. Using the Data laboratory plug-in, it is possible to import pre-processed data in the form of .csv files. Another advantage is the adjustment of the size or color of the nodes and edges, either manually or automatically. According to the set parameters of the selection of a suitable algorithm, it is possible to automatically place nodes and edges on the surface. Gephi also allows for the aggregation of statistical indicators [29].
  • Matlab—Is a popular tool in many branches of scientific computing. Its origin is in solving problems in computational linear algebra, and therefore it is suitable for performing many operations that use the representation of networks in matrix form [30]. Matlab, although not free, is used at many universities and is accessible to many students. However, it was not designed as a network analysis tool, nor is it suitable for illustrating complex networks. This software is used at the Faculty of Materials Science and Technology in Trnava, the Slovak University of Technology in Bratislava.
  • Python—Users of this software form a very active community of software developers, and there are many packages that can be used to perform network analysis. Python is free software and the open-source software system Sage can be used for mathematical calculations. This can be used anywhere with an internet connection via a web browser without installing anything directly on the computer [31,32].
  • TouchGraph Navigator—This software application allows to create easily interactive network visualizations of the available data, which can be loaded from databases, from Excel (.xls), CVS, TSV, multi CSV (.mcsv), Navigator DB API, My Sql Database, NetDraw (.vna), Guess (.gdf), Nxml or Pajek (.net). It can perform analysis and illustrate relationships by configuring the graph appearance and filter settings as well as export images and data and save the resulting project so that the results can be shared and start back exactly where you left off [33]. This software is also used at the Institute of Industrial Engineering and Management, Faculty of Materials Science and Technology in Trnava, the Slovak University of Technology in Bratislava where several projects were built based on this application. Favored by the researchers, the software was applied in this project as well.
Three MS standards were selected for model visualization triplet by means of the software application TouchGraph Navigator: ISO 9001:2015 [34], ISO 14001:2015 [35] and ISO 20121:2012 [36]. Documented information in the form of data was inscribed and specially arranged in sheets of Excel files. These files serve as a database for our network visualization of MS triplet.

2.3. Building Dataset for MSS Visualization

Proper building of the dataset is necessary for an accurate visualization in the TouchGraph Navigator program application. A file is built in the Excel MS application with three sheets. Every sheet is designated for one management system standard only.
The first row in every sheet describes the entity set of all nodes in the management system standard. Cell A1 is defined as “MSS (Management System Standards)”, cell B1 identifies the individual MSS, e.g., “Standard ISO 9001:2015 QMS” in the first sheet, “Standard ISO 14001:2015 EMS” in the second sheet and “Standard ISO 20121:2012 ESMS” in the third sheet, respectively. Cell C1 is the “ICS” (International Classification for Standards) and it is intended to serve as a structure for catalogues of international, regional and national standards and other normative documents. At the same time, it serves as a basis for standing-order systems for international, regional and national standards [37].
Cell D1 is “PDCA Cycle”. Cell E1 is defined as a “Clause”, representing one of ten main clauses in the standard structure. Subsequently “Normative references” are in cell F1 and “Terms and definition” in cell G1. The description of the entity set from cell H1 is in Table 2. The understanding of the graduating of individual degrees of separation in model triplet visualization is crucial.
The first column in every sheet describes the individual node in the MSS for a given sheet. Cell A1 is defined as “MSS (Management System Standards)” but the cells A2 ÷ A115 are defined as “TRIPLET MSS”, that is the node which is visualized in the model. Cells B2 ÷ B115 are identified for individual MSS, “Standard ISO 9001:2015 QMS” (in the first sheet), “Standard ISO 14001:2015 EMS” (in the second sheet) and “Standard ISO 20121:2012 ESMS” (in the third sheet). Cell C2 is a code “03.120.10” in the first sheet, “13.020.10” in the second sheet, “03.100.01; 13.020.01” in the third sheet, respectively. Cells D21 ÷ D25 are edited as “PLAN”, D26 ÷ D63 are “DO”, D64 ÷ D71 are “CHECK” and D72 ÷ D75 are edited as “ACT” for the first sheet. Cells D48 ÷ D53 are edited as “PLAN”, D54 ÷ D63 are “DO”, D65 ÷ D69 are “CHECK” and D70 ÷ D72 are edited as “ACT” for the second sheet. Cells D58 ÷ D61 are edited as “PLAN”, D62 ÷ D71 are “DO”, D72 ÷ D75 are “CHECK” and D76 ÷ D77 are edited as “ACT” for the third sheet. Cells E2 ÷ E85 are individual clauses according to the contents of ISO 9001 standard; cells E2 ÷ E104 are according to ISO 14001, and cells E2 ÷ E115 are according to ISO 20121 standard. “Normative references’’ are only for F9 in the first sheet edited as “Standard ISO 9001:2015 QMS—Fundamentals and vocabulary”. The other sheets do not contain “Normative references”. “Terms and definition” are the same as “Normative references” for ISO 9001 but for ISO 14001 there are 33 terms in corresponding cells, and for ISO 20121 there are 44 terms. The description of the entity set from cell G2 to V115 is in the file TRIPLET model.xls (Supplementary Materials).
Editing of individual cells in the Excel file requires rigorous attention, so the individual cells are correctly filled in. For this reason, a double control is required to ensure that the visualization base is completely accurate.

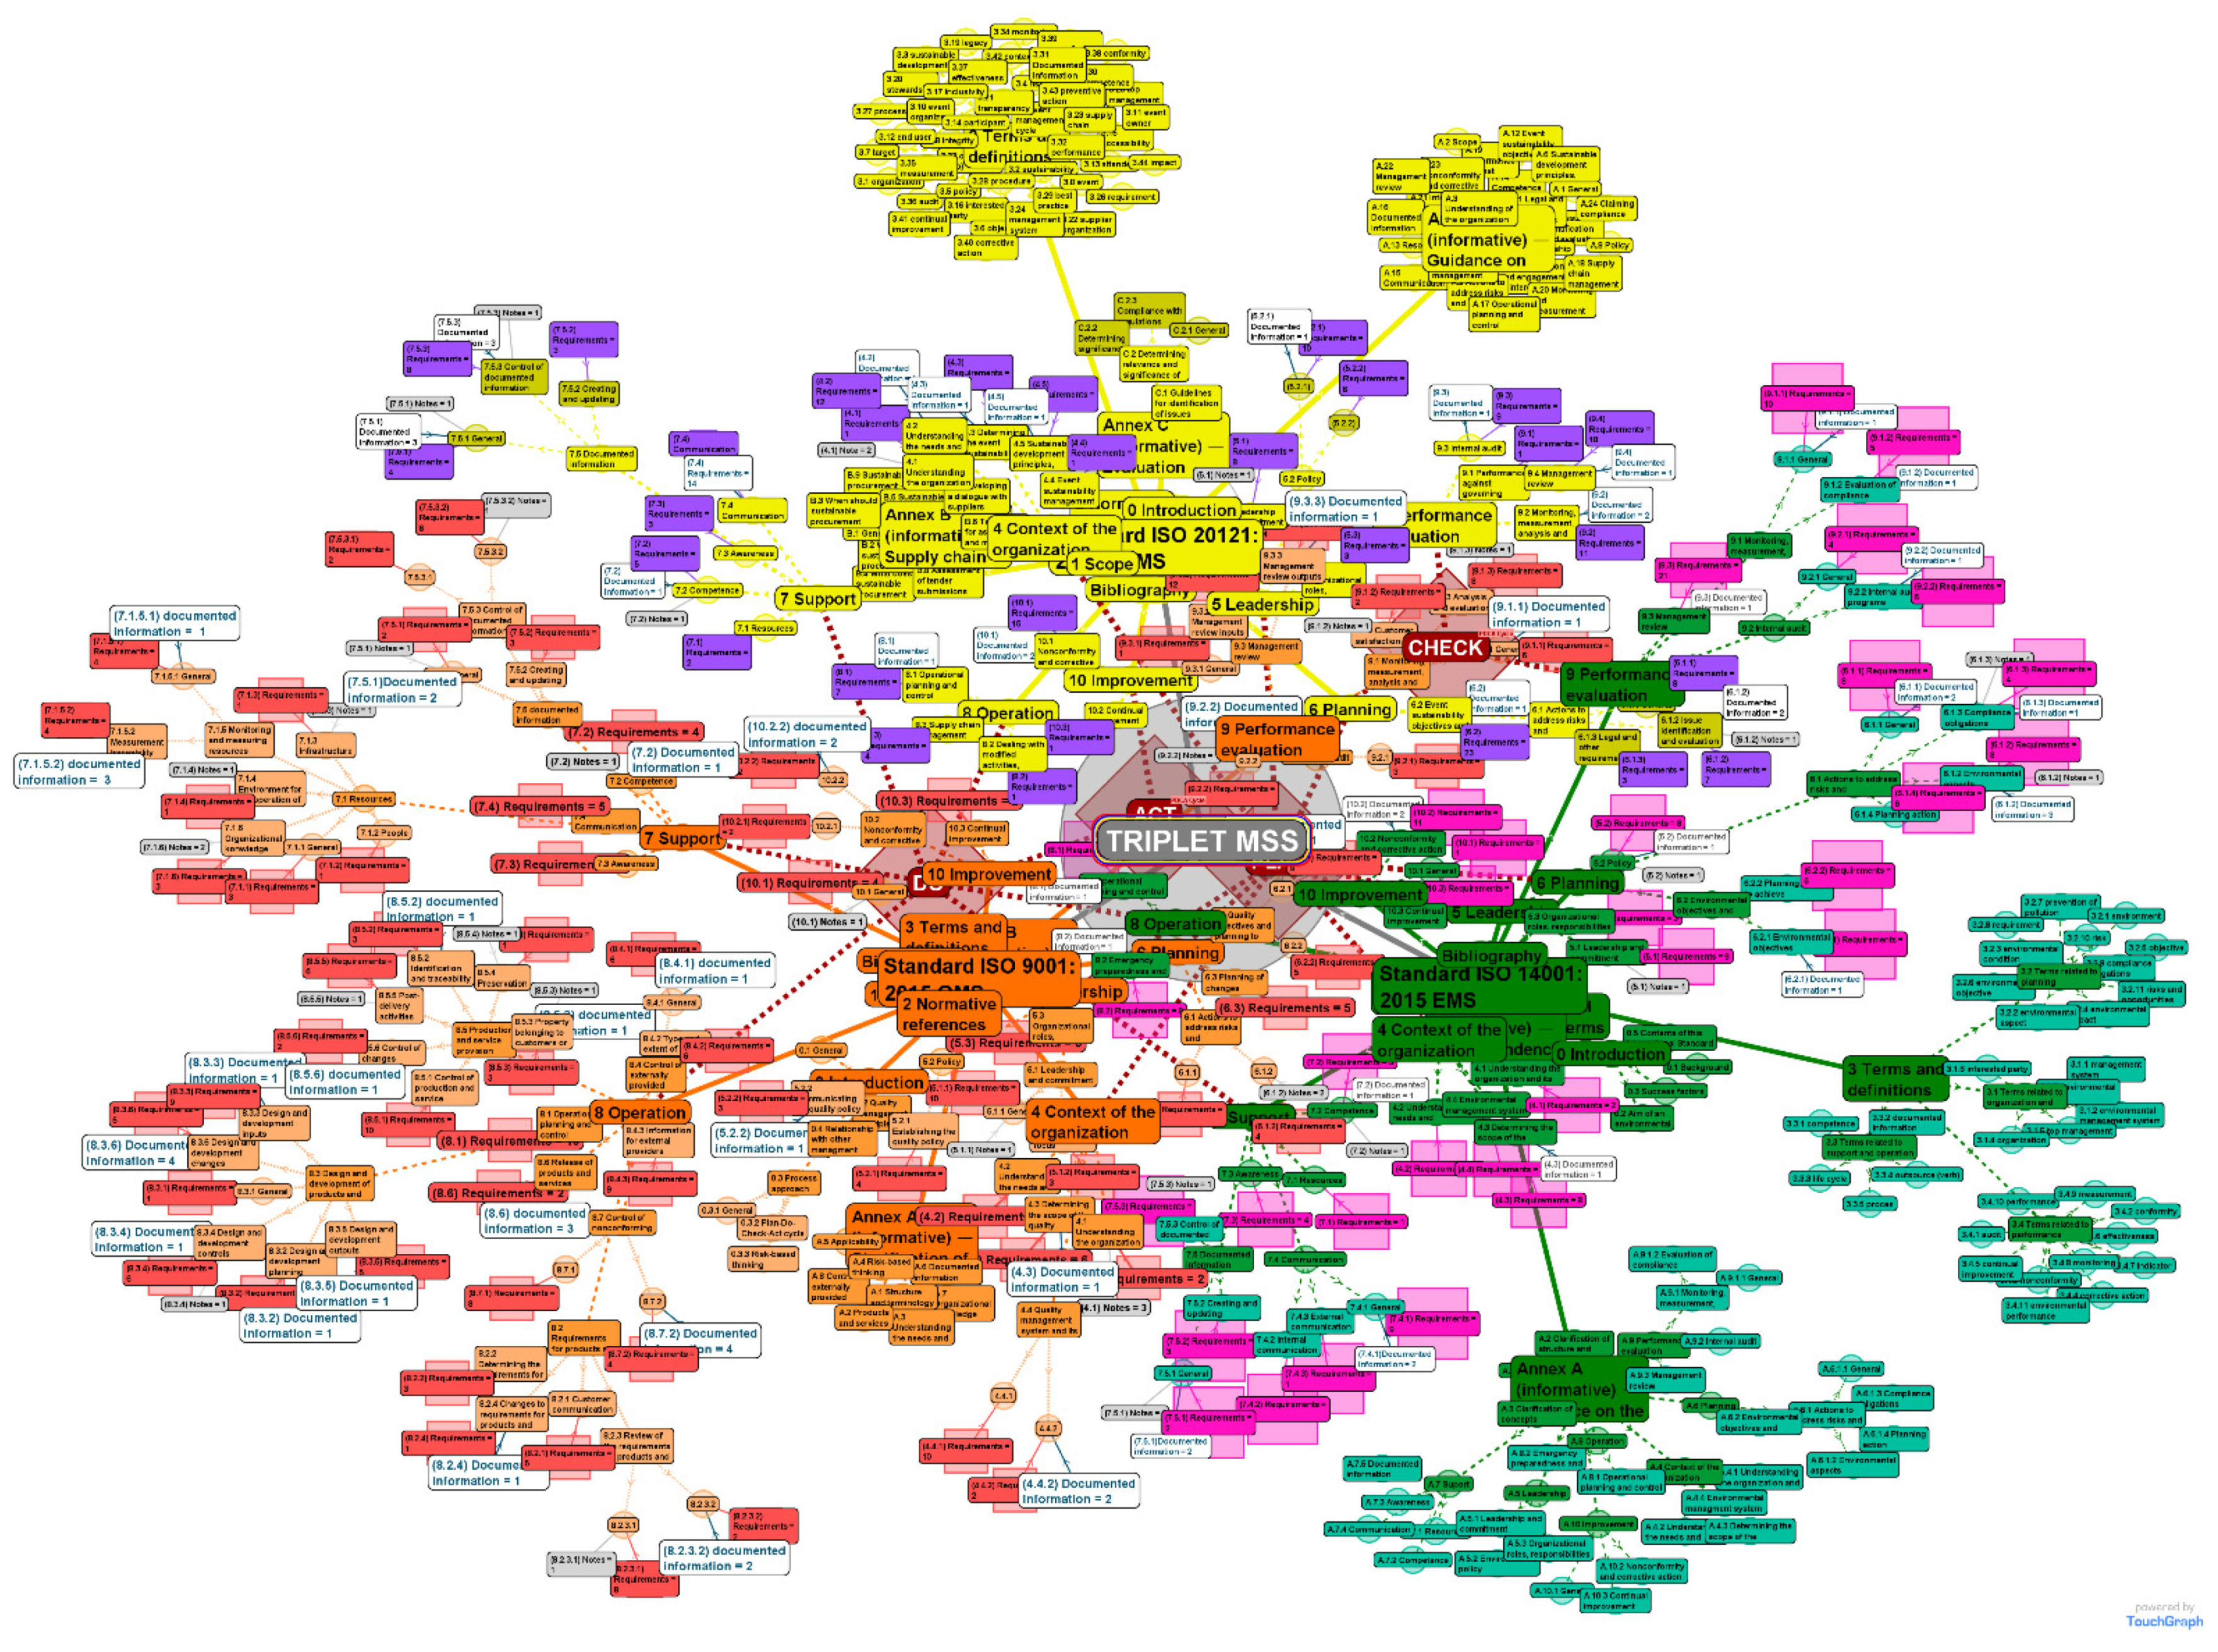
2.4. Building Visualized Model in TouchGraph Navigator

After preparing the Entity set in the Excel file, the data is loaded in the software application TouchGraph Navigator by means of Menu > Loading Wizard > Select Input. The program application supports input formats including Excel (.xls), Csv, Tsv, Multi Csv, MySql, Na DB API, Vna, Gdf and Pajek. Excel is used as it is widely distributed and applied. The Menu > Loading Wizard > Data Types and Delimiters is then defined, where it is possible to set the data types and delimiters of table fields. In our case there are all data types as text for all used sheets in our file.
Adding entities and relations is the most complicated and time-consuming activity of model building. Menu > Loading Wizard > Entities and Relations was used, where it was step-by-step specified how entities and relations are to be created from the data. Individual entities/elements and their properties have been inserted into the model, i.e., the nodes are designed according to the edited cells of the first line of the Excel file. This is necessary to perform it for all sheets of data set file. Subsequently, the defined source entities were linked with destination entities, including their direction, if any, and their attributes according to the logical sequence contained in MSSs. By gradually adding entities and relations in logical sequence the Degrees of Separation from 0 up to 6 were activated.
Finally, the appearance for the node (entity) and edge (relation) were set. Color affiliation for the individual MSS were defined, including related colors, shapes, and halo sizes for nodes by means of Menu > Settings > Node Appearance and related colors, widths, and patterns for edges by means of Menu > Settings > Edge Appearance.

3. Results

Based on detailed examination of common and specific elements of selected management systems, Table 3 was derived. This table, also characterized as a summary table of management system standards, allows for feedback control during the process of compiling the visualization model of MS standards. Differences or specific elements are highlighted in bold (if they are strongly specific) and underlined (if they are specific).

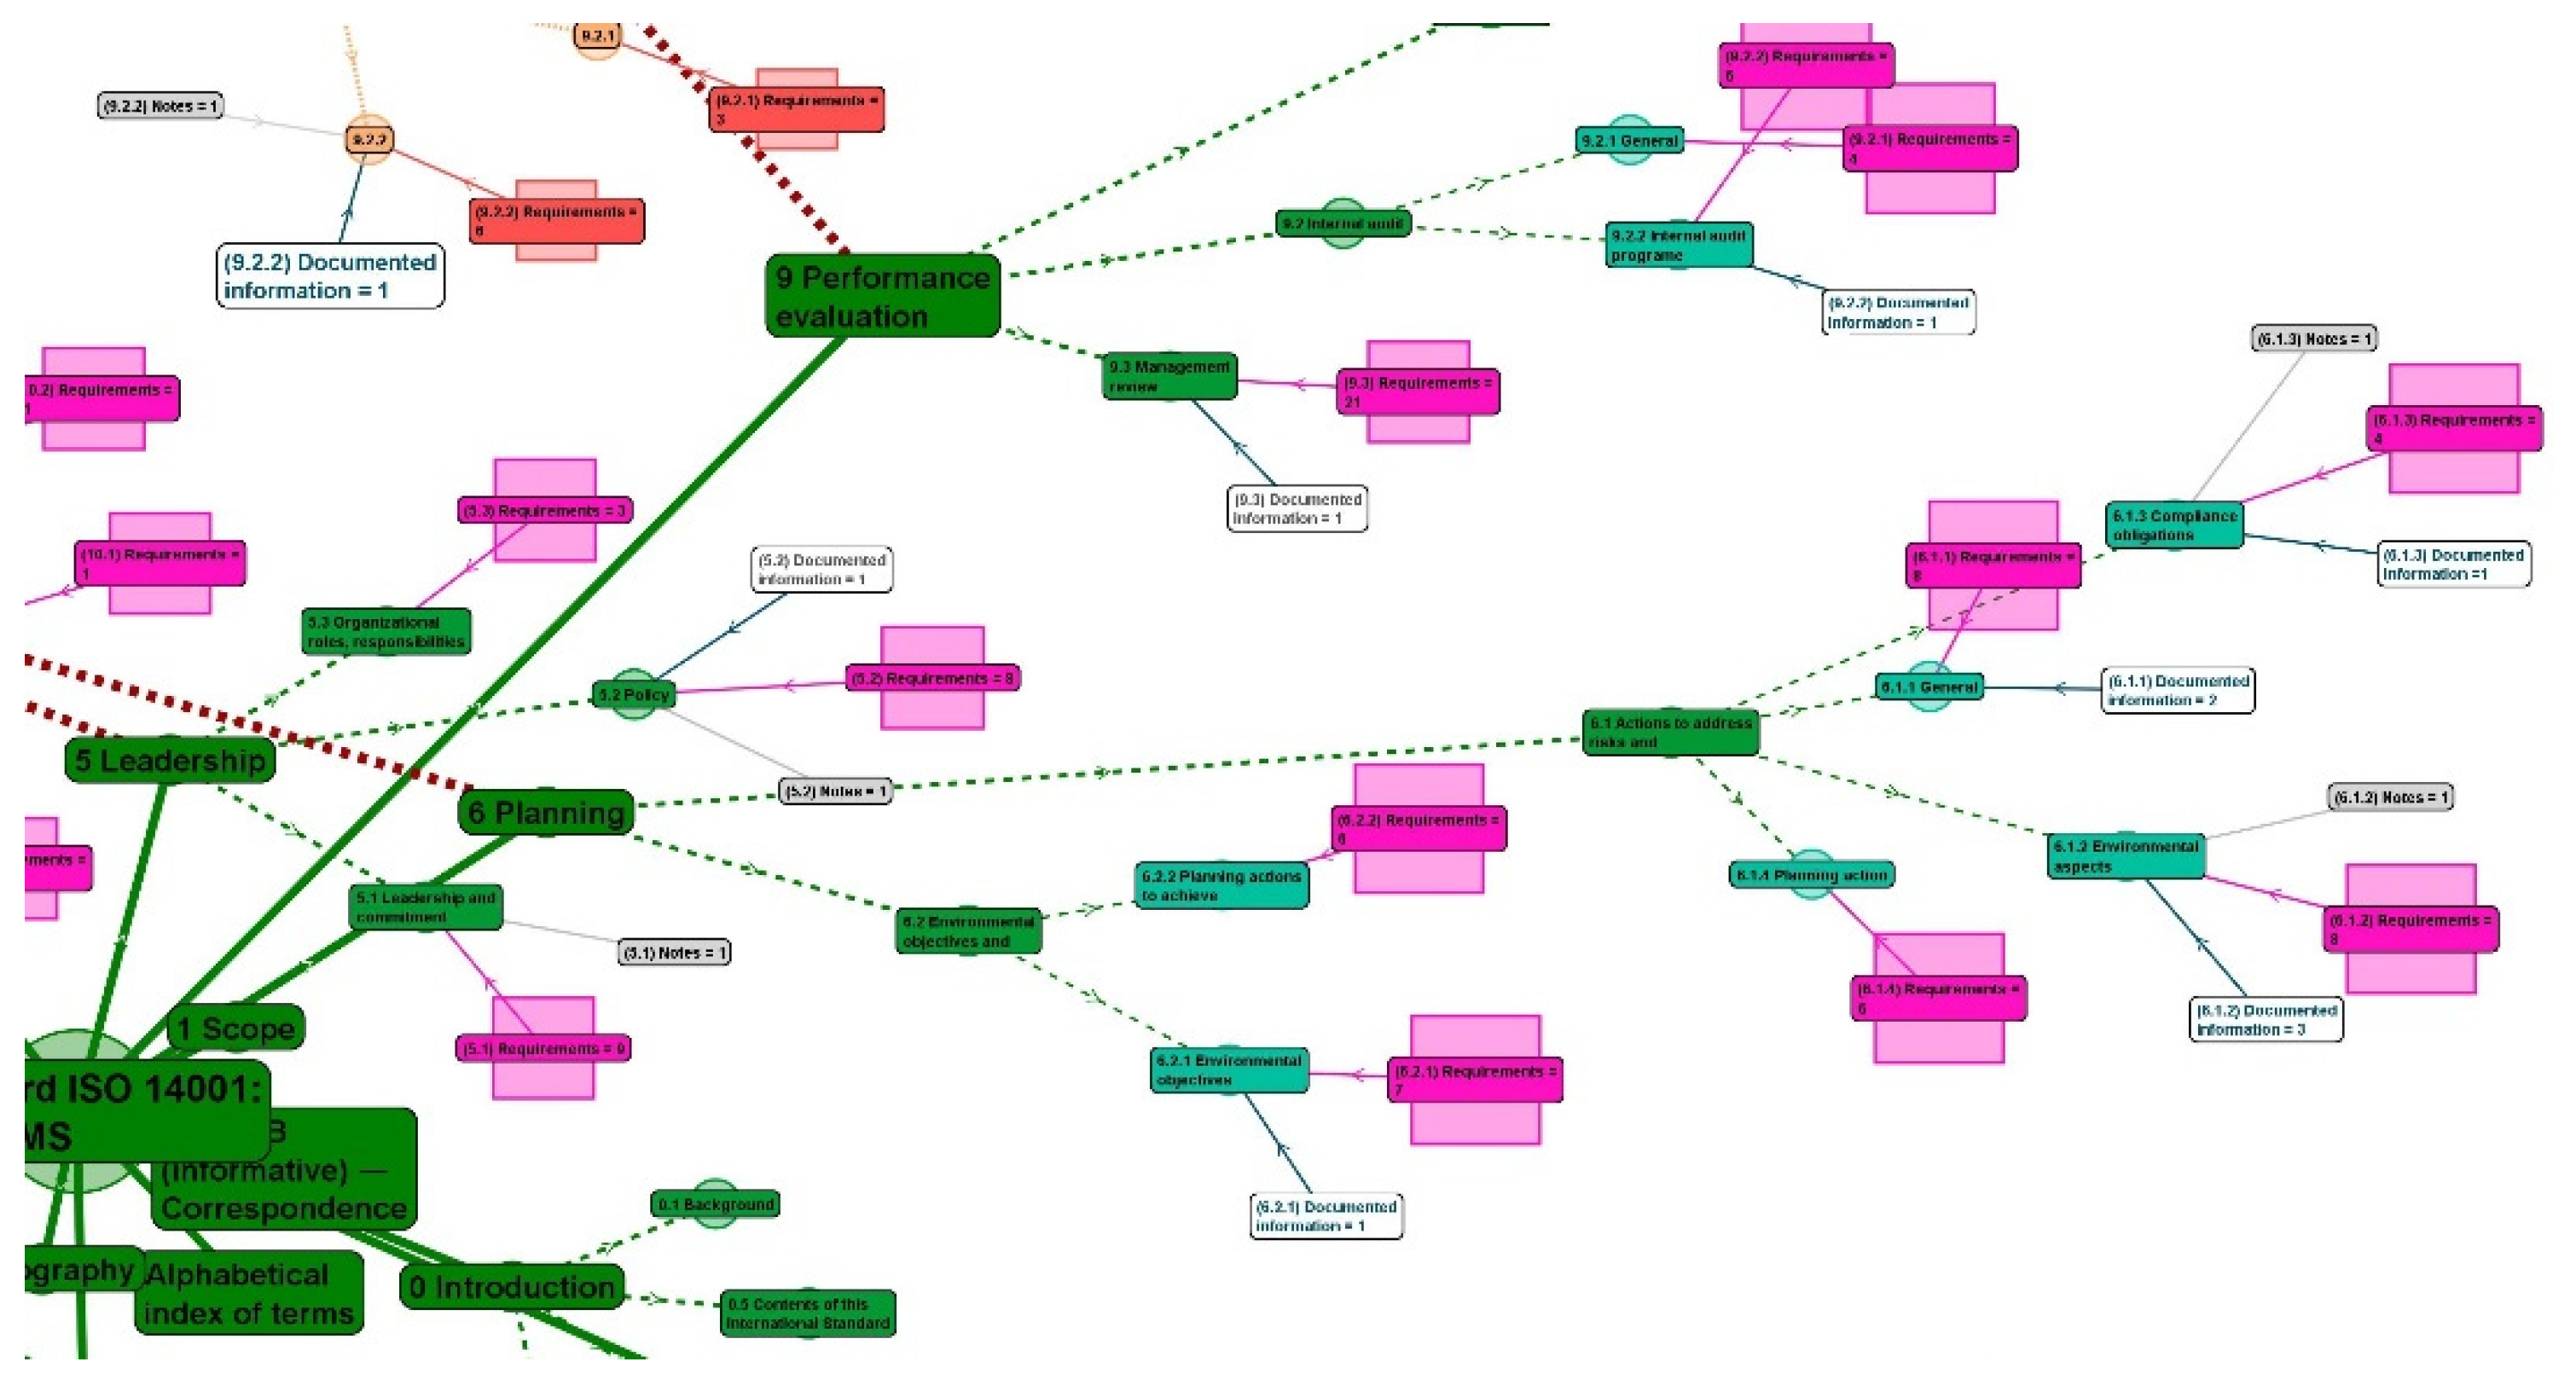
3.1. Building the MSS Visualization Model

The first step in the process is to create an initial central node or entity called “TRIPLET MSS” (grey color circle, Figure 1), with Degrees of Separation = 0. The second step includes the following triplet of nodes: the “Standard ISO 9001:2015 QMS” node (orange color rounded rectangle), the “Standard ISO 14001:2015 EMS” node (dark green color rounded rectangle), and the “Standard ISO 20121:2012 ESMS” node (yellow color rounded rectangle), pictured on Figure 2, with 1st degree of separation. The three standards of management system represent a core of the triplet.
Each of the triplet standards contains its own set of ten basic clauses. The Annex A and B for ISO 9001 and ISO 14001, respectively, and Annex C for ISO 20121 are activated. The clauses and Annexes are activated with an increasing 2nd degree of separation. Individual clauses are activated, and the triplet clustering is initiated. The color for individual standards is kept facilitating the distinguishing of their affiliations, see Figure 3.
All standards and their parts, including clauses and sub-clauses up to the fourth structuring, (0; … 1; 1.1; 1.1.1; 1.1.1.1 … 10.2.2 … C2.3), are connected by means of relations that differ in their color, thickness of lines and patterns.
With the 3rd degree of separation, the PDCA cycles are visualized through the nodes: “PLAN”, “DO”, “CHECK” and “ACT” of diamond shape and dark red color. These entities or nodes are interconnected according to their representation within the structure of MSSs (ISO 9001:2015 QMS, ISO 14001:2015 as well as ISO 20121:2012) with an emphasis placed on the PDCA cycle. The node “PLAN” is linked with “Clauses 4, 5, 6” for all MSSs, the node “DO” is linked with “Clauses 7 and 8” for all MSSs, the node “CHECK” is linked with “Clauses 9” and, finally, the node “ACT” is linked with “Clauses 10” for all MSSs.
In the same degree (the third degree of separation), the sub-clauses of MSS are activated and subsequently the sub-sub-clauses are shown in the 4th degree, followed by the sub-sub-sub-clauses in the 5th degree. The cluster is thus becoming more complex. Color resolution is assigned according to the given MSS (orange, dark green, yellow), see Figure 4.
If the organization plans to implement the MSS, it is necessary to elaborate a list of all requirements which will be needed for demonstration of correct application. These requirements are not marked in the document of ISO standards with bold or italic or underline letters. Implementers have to search for them in the text. They must read with understanding so as not to omit any requirement. In the management system standard text, the requirements are indicated by using the verbal forms “shall”. By moving to the 6th degree of separation, the requirements in our triplet are indicated by the halo size effect in the shape of a square and marked for ISO 9001 in red color, for ISO 14001 in magenta color and for ISO 20121 in violet. Furthermore, the relationships leading from the requirements to a given clause have the same color as the requirement of a given MSS, see Figure 5. A more detailed illustration for the ISO 9001 standard is shown in Figure 6.

3.2. Applicability for 1.-2.-3.-Party Audits

One of the benefits for visualized MSS model application is the possibility of a quick view of its structure. MSS implementers can in a short time and easily find out how many requirements they need to comply with during the audit process. It leads to less time spent on the implementation process as well as financial savings [38].
A first-party audit is performed within an organization to measure its strengths and weaknesses against its own procedures or methods and/or against external standards adopted by (voluntary) or imposed on (mandatory) the organization. A first-party audit is an internal audit conducted by auditors who are employed by the organization that is being audited but who have no vested interest in the audit results of the audited area.
A second-party audit is an external audit performed on a supplier by a customer or by a contracted organization on behalf of a customer. A contract is in place, and the goods or services are being, or will be, delivered. Second-party audits are subject to the rules of contract law, as they are providing contractual direction from the customer to the supplier. Second-party audits tend to be more formal than first-party audits because audit results could influence the customer’s purchasing decisions. For auditing the management system by a first-party and by a second-party there is also recommended very often used standard ISO 19011:2018. The triplet model can assist the audit process. The standard ISO 19011:2018 is applicable to more than 70 system management standards published by ISO. The standard assists in building on the best practice, supports organizational performance, minimizes losses and reinforces their competitive position. This standard provides guidance on auditing MSs, including the principles of auditing, managing an audit program and conducting MS audits, as well as guidance on the evaluation of competence of individuals involved in the audit process. These activities include the individual managing of the audit program, auditors and audit teams [39].
A third-party audit is performed by an audit organization independent of the customer-supplier relationship and is free of any conflict of interest. Independence of the audit organization is a key component of a third-party audit. Third-party audits may result in certification, registration, recognition, an award, license approval, a citation, a fine or a penalty issued by the third-party organization or an interested party. Designed for third-party audits, the Standard ISO/IEC 17021-1:2015, which covers requirements and principles for the consistency, competence and impartiality of institutions providing audit and certification management systems according to MSSs, is a useful tool [40,41].

3.3. Management Review Support

The requirements displayed in this way are the basis for managerial decision-making. During visualization, it is possible to identify very effectively the “health condition” of the organization and its potential unconformities when performing Clause 9 Performance evaluation and the sub-clause 9.X Management review. The organization determines which MSS requirement is binding, and which is irrelevant. In our comprehensive visualization, all the requirements of the given MSS are considered. These requirements will be selectively chosen for a particular company regardless of its operational type (national or international) [42].
An alternative use of the visualization is the ability to examine data in the left panel of the TouchGraph Navigator software. There it is possible to get an overview of all the requirements of a given standard with their inclusion in the clause or sub -…- clause, see Figure 7. As in the triplet model, here are the numbers of requirements with their affiliation.

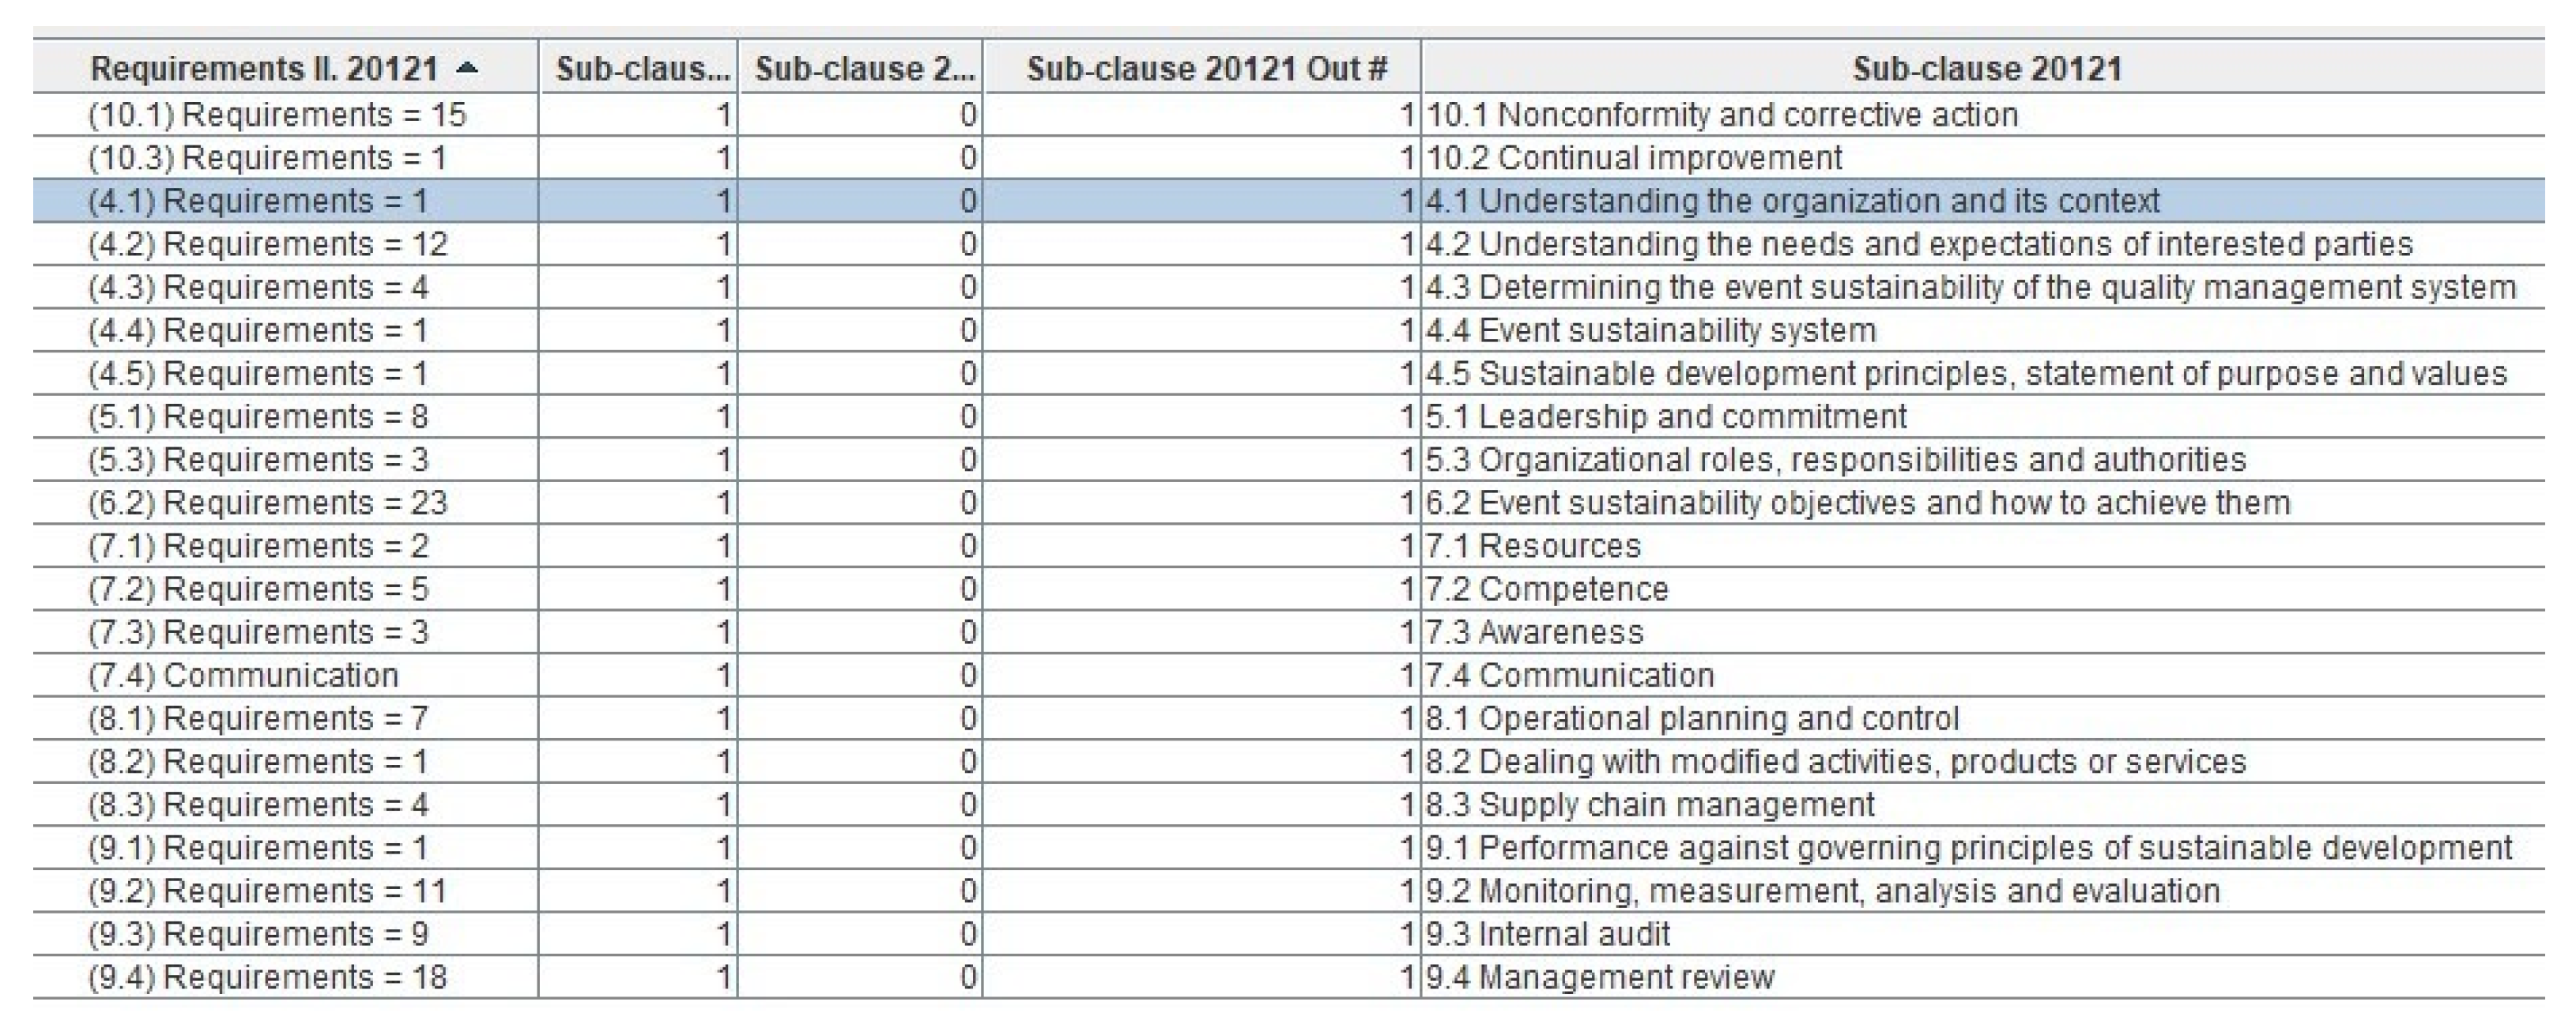
3.4. Documented Information and Notes

Additional requirement for an effective implementation of the MSS is the submission of evidence in a form of “Documented information”. For this reason, we considered it appropriate to include “Documented information” in the overall requirements and to visualize it using special nodes marked as rounded rectangles with white color backgrounds (see Figure 8). Similar to requirements, there is a set number of documented information which is binding. If no evidence is submitted, according to the MSS rules, the given fact is not meaningful, i.e., as if it did not exist.
The final information that may be useful when implementing MSS is the visualization of “Notes”. These are included to explain the requirement. The triplet models are labeled as rounded rectangles with light gray color backgrounds.

3.5. Integrated Management Systems

The advantage of this visualization triplet model lies in the fact that it is possible to examine each MSS individually, i.e., each standard separately. It can be further investigated in conjunction with another standard, i.e., examined as a pair, which is very effective in implementing an integrated management system [43]. Depending on the extent to which the integration of individual MSSs is possible, we speak of a partial or full integration. This can be considered according to the number of requirements and documented information that the MSS has in common and specific. Figure 9 represents an intersection of full and partial integration of the MSS triplet.
The process of combinations and recombination are applicable here [44]. For our specific case, it is possible to create the most popular integration pair of standards ISO 9001 and ISO 14001 [45]. Otherwise, there are the lesser-known pairs of ISO 9001 with ISO 20121 or ISO 14001 and ISO 20121. It is precisely in view of changes in terms of hygiene protocols, following the societal changes since the end of February 2020 that these two newly proposed standards’ combinations will be applicable while providing services during organizing diverse sustainable events. Looking to the future, it is important to realize that the changed circumstances regarding sustainability in its overall context, given the detailed explanation in Annex B “Supply chain management” in MSS according to ISO 20121, will be in the field of view of service providers and product manufacturers. Martínez-Perales et al. [46] propose sustainability as a factor of a project’s success. This is based on the idea that considered management systems are a tool for sustainability, and the certification of the corresponding standards has been taken as an indicator of sustainability. Moreover, new potential pandemic scenarios may create reasonable pressure to implement MSSs with a sustainable focus [47].

4. Discussion

From the perspective of previous studies, it is clear that once HLS is in place, it will be much easier and faster to work with MSSs, and to combine and recombine the mandatory requirements contained therein. The results of the processing can be displayed in a table (see Table 3).
In the academic literature, the integration of MS standards is so far visualized only by means of tables or static diagrams (flow charts). An approach in this project supports the visual management in dynamic perception (3DD + dynamic dimensions). This is the most noticeable when the cluster levels (levels of separation) are increased. Eventually, it is more suitable to use visualization models to get a quick view of the structure of the MSS. These models can be further developed by connecting other MSSs required by the organization [48].
From this standpoint, it is further possible to create a new visualization model, the so-called “singlet” or create new MSS groupings in the form of duplet (twin), triplet, quadruplet, quintuplet, sextuplet, septuplet, octuplet, nonuplet, decuplet, etc. or just extend the existing visualization model by new MSSs.
Among the management systems that have great potential to be visualized with respect to the principle of sustainability and overall development are:
  • ISO 37101:2016 Sustainable development in communities—Management system for sustainable development—Requirements with guidance for use;
  • ISO 21401:2018 Tourism and related services—Sustainability management system for accommodation establishments—Requirements;
  • ISO 34101-1:2019 Sustainable and traceable cocoa—Part 1: Requirements for cocoa sustainability management systems, recommendations for global and domestic producers of cocoa and chocolate articles [49].
Among the popular management systems, which have great potential to be visualized regarding safety and sustainability in the product manufacturing and services procurement, environmental protection, energy management and others are:
  • Energy management systems. Requirements with guidance for use according to ISO 50001:2018;
  • Water efficiency management systems—Requirements with guidance for use according to ISO 46001:2019;
  • Security and resilience—Business continuity management systems—Requirements according to ISO 22301:2019;
  • ISO 19443:2018 Quality management systems—Specific requirements for the application of ISO 9001:2015 by organizations in the supply chain of the nuclear energy sector supplying products and services important to nuclear safety (ITNS);
  • ISO 18091:2019 Quality management systems—Guidelines for the application of ISO 9001 in local government;
  • ISO 44001:2017 Collaborative business relationship management systems—Requirements and framework;
  • Occupational health and safety management systems. Requirements with guidance for use according to ISO 45001: 2018;
  • Food safety management systems. Requirements for any organization in the food chain according to 22000:2018, recommended for the food producers as well as for food machinery producers [50];
  • ISO 16106:2020 Transport packages for dangerous goods—Dangerous goods packagings, intermediate bulk containers (IBCs) and large packagings—Guidelines for the application of ISO 9001;
  • Medical devices. Quality management systems. Requirements for regulatory purposes according to 13485:2016;
  • ISO/TS 22163:2017 Railway applications—Quality management system—Business management system requirements for rail organizations: ISO 9001:2015 and particular requirements for application in the rail sector;
  • Information technology. Security techniques. Information security management systems. Requirements according to 27001:2013;
  • ISO 21101:2014 Adventure tourism—Safety management systems—Requirements.
  • After confirmed review according to HLS:
  • ISO 28001:2007 Security management systems for the supply chain—Best practices for implementing supply chain security, assessments and plans—Requirements and guidance;
  • ISO 22006:2009 Quality management systems—Guidelines for the application of ISO 9001:2008 to crop production;
  • ISO/AWI 56001 Innovation management—Innovation management system—Requirements.
Only Type A management systems standards were considered in this triplet cluster development project. Type B of MSSs, such as standards with Guidelines for using/application were not taken into account. Specifically, ISO/TS 9002:2016 Quality management systems—Guidelines for the application of ISO 9001:2015 and ISO 14002-1: 2019 Environmental management systems—Guidelines for using ISO 14001 to address environmental aspects and conditions within an environmental topic area—Part 1: General.
Furthermore, it would be possible to map and enhance the project with ISO 9000: 2015 Quality management systems—Fundamentals and Vocabulary or ISO 9004: 2018 Quality management—Quality of an organization—Guidance to achieve sustainable success. However, the later has already been addressed in [2] where the author mapped the QMS standards, i.e., ISO 9000 + ISO 9001 + ISO 9002 + ISO 9004. Thus, it would be possible to add these standards to our cluster, but for the sake of balance to continue in EMS and ESMS as well. In addition, the correct development of a cluster would also require a high amount of time.

5. Conclusions

Driven by increasing stakeholder and societal pressures, organizations and supply chains face the multi-dimensional challenges of not only integrating economic, environmental, and social agendas into their management systems but also driving continual sustainability performance improvement [51]. The objective of the article was to introduce a structure that would support the decision—makers when there is a need to implement multiple ISO standards within an organization. The implementation of standard triplet (ISO 9001, ISO14001 and ISO 20121) leads to the certification that is taken as an indicator of success. This may encourage organizations and companies to improve their operational processes by incorporating sustainability and quality considerations into their operative frameworks. As indicated by Silva et al. [20], QM must help organizations to develop more open and agile models in responding to changes, promoting continuous dialogue with stakeholders, better answering current challenges, and creating a systemic perspective in the long term.
The integration of the selected standards was performed by using TouchGraph application and the final model offers simplified and more effective navigation through all three standards. Specific and common requirements were selected, which ultimately shortens the implementation time since the common requirements need to be addressed only once within the entire process. By clicking on different areas of the model, the cluster becomes more compendious. The model unfolds in detail any related granularities (e.g., requirements, documented information or notes) and shows important interactions in individual characteristics of the management system.
The benefits of the application can be summarized in three areas: {1} personal and professional awareness of the need to implement management systems and their integrations in organizations; {2} business perspective as the MSS integration is a powerful decision-making tool and, finally, {3} administration, since the MSS implementation carries a significant amount of supporting documentation.
The ultimate objective of any producer or service provider is to offer high quality products and services, to be successful and competitive while meeting all necessary requirements for sustainable manufacturing/service delivery practice. Benefits of effective management systems integration lie in raising personal and professional awareness of the need to implement management systems and their integrations in organizations. A survey conducted by Silva et al. [20] points to the fact that the most significant difficulties felt in the management of the quality system, as the professionals highlighted, are the resistance to change, and the availability and involvement of all employees, including the process owners.
From the business perspective, MSS integration is a powerful decision-making tool. Its efficacy is evident in the increased production adaptability and reduced reaction time to implement changes, which is ultimately reflected in the increased competitiveness of the organization. Navigation within the system is more effective. There are no unintentional repetitions of meeting the integration requirements that are common to all standards, and time is saved when searching for interactions in individual articles of the management system.
The process of implementing standards requires a considerable amount of documented information. From an administrative point of view, effective integration guarantees simplified creation and updating of documented information (e.g., identification, description or formatting) and its control (e.g., availability, suitability or protection). At the same time the duplicity of information is avoided, and obsolete documents are archived.
Based on our decision, we proceeded to coordinate and visualize only three MS standards, namely quality, environment, and sustainable event. This is a pilot project and further work will continue by adding additional MS standards.
Bureaucracy is unpopular, and much of the time it is the origin of a reluctance of employees and managers to implement any new management tools. Visual management removes the monotony from the implementation process replacing it with a picture of a successfully executed project. It supports culture transformation by turning data into information or pictures that can help tell the story about the business.

Supplementary Materials

The following are available online at https://0-www-mdpi-com.brum.beds.ac.uk/article/10.3390/su13168812/s1, Data set S1: Data set for Triplet Model Visualization of MSSs (QMS, EMS, ESMS) in Excel file (.xls), Visualization S1: Triplet Model Visualization of MSSs (QMS, EMS, ESMS) in TouchGraph Navigator file (.tgnp).

Author Contributions

Conceptualization, A.P. and L.K.; methodology, A.P., A.Z.-S. and D.K.; software, A.P.; validation, A.Z.-S. and D.K.; formal analysis, L.K. and A.Z.-S.; writing—original draft preparation, A.P., K.L.Š. and A.Z.-S.; writing—review and editing, A.P., K.L.Š. and D.K.; visualization, A.P.; supervision, A.P., K.L.Š. A.Z.-S.; funding acquisition, K.L.Š. All authors have read and agreed to the published version of the manuscript.

Funding

This research was funded by the Cultural and Educational Grant Agency of the Ministry of Education, Youth and Sports of the Slovak Republic as a part of the project No. KEGA 031STU-4/2020 “Network visualization of common and specific elements and documented information of integrated management systems with respect to relevant ISO standards”.

Data Availability Statement

A part of data supporting reported results in this research can be found on the web pages of the International Standard Organization. These links are publicly archived:

Acknowledgments

This paper was written with the support of the Cultural and Educational Grant Agency of the Ministry of Education, Youth and Sports of the Slovak Republic as a part of the project No. KEGA 031STU-4/2020 “Network visualization of common and specific elements and documented information of integrated management systems with respect to relevant ISO standards”.

Conflicts of Interest

The authors declare no conflict of interest.

References

  1. The Art of Business Your Gateway to International Standards, ISOfocus #139, March–April 2020 Switzerland; pp. 20–21; ISSN 2226-1095. Available online: https://www.iso.org/isofocus_139.html (accessed on 1 June 2021).
  2. Solik, M. Vizualizácia Štandardov Systémov Manažérstva Kvality Pomocou Modelu Siete Malého Sveta. Master’s Thesis, MTF STU, Trnava, Slovakia, 2021; p. 53. Available online: http://is.stuba.sk/zp/portal_zp.pl?podrobnosti=151946 (accessed on 21 June 2021).
  3. Santos, G.; Rebelo, M.; Barros, S.; Pereira, M. Certification and Integration of Environment with Quality and Safety—A Path to Sustained Success. In Sustainable Development—Authoritative and Leading Edge Content for Environmental Management; Curkovic, S., Ed.; IntechOpen: London, UK, 2012; Chapter 9; pp. 193–218. Available online: https://www.intechopen.com/books/sustainable-development-authoritative-and-leading-edge-content-for-environmental-management/certification-and-integration-of-environment-with-quality-and-safety-a-path-to-sustained-success (accessed on 1 February 2021). [CrossRef] [Green Version]
  4. Başaran, B. Integrated Management Systems and Sustainable Development. In Quality Management Systems—A Selective Presentation of Case-Studies Showcasing Its Evolution; Kounis, L.D., Ed.; IntechOpen: London UK, 2017; Chapter 1; pp. 1–19. Available online: https://www.intechopen.com/books/quality-management-systems-a-selective-presentation-of-case-studies-showcasing-its-evolution/integrated-management-systems-and-sustainable-development (accessed on 1 February 2021). [CrossRef] [Green Version]
  5. Jørgensen, T.H. Towards more sustainable management systems: Through life cycle management and integration. J. Clean. Prod. 2008, 16, 1071–1080. Available online: https://0-www-sciencedirect-com.brum.beds.ac.uk/science/article/abs/pii/S0959652607001540 (accessed on 1 February 2021). [CrossRef]
  6. Fresner, J.; Engelhardt, G. Experiences with integrated management systems for two small companies in Austria. J. Clean. Prod. 2004, 12, 623–631. Available online: https://0-www-sciencedirect-com.brum.beds.ac.uk/science/article/abs/pii/S0959652603001586 (accessed on 2 February 2021). [CrossRef]
  7. Block, M.R.; Marash, I.R. Integrating ISO 14001 into a Quality Management System; ASQ Quality Press: Milwaukee, WI, USA, 1999; p. 127. [Google Scholar]
  8. Embarak, O. The Importance of Data Visualization in Business Intelligence. In Data Analysis and Visualization Using Python; Apress: Berkeley, CA, USA, 2018; pp. 85–124. [Google Scholar] [CrossRef]
  9. Milgram, S. The Small World Problem. Psychol. Today 1967, 2, 60–67. [Google Scholar]
  10. Castells, M. Toward a Sociology of the Network Society. Contemp. Sociol. 2000, 29, 693–699. Available online: https://0-www-jstor-org.brum.beds.ac.uk/stable/2655234 (accessed on 4 March 2021). [CrossRef]
  11. Gömöryová, V. Fenomén malého sveta. In Sociálne a Politické Analýzy; Katedra Sociálnych Vied, FVS, UPJŠ v Košiciach: Košice, Slovakia, 2007; pp. 1, 2, 97–127. ISSN 1337 5555. [Google Scholar]
  12. Kleinberg, J. Small-World Phenomena and the Dynamics of Information. In Advances in Neural Information Processing Systems (NIPS); Cornell University: Ithaca, NY, USA, 2001; p. 14. Available online: https://www.cs.cornell.edu/home/kleinber/nips14.pdf. (accessed on 21 June 2021).
  13. Hexmoor, H. Ubiquity of Networks. In Computational Network Science. An Algorithmic Approach, 1st ed.; Morgan Kaufmann Publishers: San Francisco, CA, USA, 2014; Chapter 1; p. 128. ISBN 9780128008911. [Google Scholar]
  14. Kleinberg, J.; Easley, D. Networks, Crowds, and Markets: Reasoning about a Highly Connected World; Cambridge University Press: Cambridge, UK, 2010; p. 612. Available online: http://www.cs.cornell.edu/home/kleinber/networks-book/ (accessed on 21 June 2021).
  15. Kleinberg, J. The small-world phenomenon: An algorithmic perspective. In Proceedings of the 32nd Annual ACM Symposium on Theory of Computing; Association of Computing Machinery: New York, NY, USA, 2000; pp. 163–170. [Google Scholar]
  16. Caldarelli, G.; Vespignani, A. Large Scale Structure and Dynamics of Complex Networks. From Information Technology to Finance and Natural Science. Complex Syst. Interdiscip. Sci. 2007, 2, 264. [Google Scholar]
  17. Management System Standards List. Available online: https://www.iso.org/management-system-standards-list.html (accessed on 21 June 2021).
  18. The United Nations. Transforming Our World: The 2030 Agenda for Sustainable Development; A/RES/70/1; The United Nations, Division for Sustainable Development Goals: New York, NY, USA, 2015; p. 41. Available online: https://sustainabledevelopment.un.org (accessed on 21 June 2021).
  19. Chovancová, J.; Pauliková, A. Integrované Manažérske Systémy, 1st ed.; Prešovská Univerzita: Prešov, Slovakia, 2021; p. 251. ISBN 978-80-555-2698-0. [Google Scholar]
  20. Silva, C.S.; Magano, J.; Matos, A.; Nogueira, T. Sustainable Quality Management Systems in the Current Paradigm: The Role of Leadership. Sustainability 2021, 13, 2056. [Google Scholar] [CrossRef]
  21. ISO 9000 Family. Quality Management. Available online: https://www.iso.org/iso-9001-quality-management.html (accessed on 21 June 2021).
  22. Paulová, I. Komplexné Manažérstvo Kvality, 3rd ed.; Wolters Kluwer: Bratislava, Slovakia, 2018; p. 160. ISBN 978-80-8168-834-8. [Google Scholar]
  23. ISO 14000 Family. Environmental Management. Available online: https://www.iso.org/iso-14001-environmental-management.html (accessed on 14 June 2021).
  24. Naden, C. First International Standard for Citywide Events now in Development; International Organization for Standardization: Geneva, Switzerland, 2019; Available online: https://www.iso.org/news/ref2458.html (accessed on 16 June 2021).
  25. New ISO 20121 Standard for Sustainable Events Management. Available online: https://www.iso.org/news/2012/06/Ref1598.html (accessed on 14 June 2021).
  26. ISO 20121:2012 Event Sustainability Management Systems. In Whitepapers; Health, Safety and Environment; International Organization for Standardization: Geneva, Switzerland, 2015; Available online: https://pecb.com/whitepaper/iso-201212012-event-sustainability-management-systems (accessed on 14 June 2021).
  27. Genči, J.; Kaščák, J. Vizualizácia grafov. In WIKT; TUKE: Košice, Slovakia, 2015; pp. 26–31. ISBN 978-80553-2271-1. [Google Scholar]
  28. Cytoscape. Available online: https://cytoscape.org/ (accessed on 21 June 2021).
  29. Gephi—The Open Graph Viz Platform. Available online: https://gephi.org/ (accessed on 21 June 2021).
  30. Matlab—MathWorks—MATLAB & Simulink. Available online: https://www.mathworks.com/products/matlab.html (accessed on 21 June 2021).
  31. Estrada, E.; Knight, P.A. A First Course in Network Theory; Oxford University Press: Oxford, UK, 2015; p. 288. ISBN 978-0-19-872645-6. [Google Scholar]
  32. Python. Available online: https://www.python.org/ (accessed on 21 June 2021).
  33. TouchGraph Navigator. Available online: https://www.touchgraph.com/navigator (accessed on 21 June 2021).
  34. Standard ISO 9001:2015 Quality Management Systems—Requirements. ISO/TC 176/SC 2 Quality Systems; ICS: 03.100.70 Management Systems and ICS: 03.120.10 Quality Management and Quality Assurance, 5th ed.; International Organization for Standardization with Technical Committee: Geneva, Switzerland, 2015; p. 29.
  35. Standard ISO 14001:2015 Environmental Management Systems—Requirements with Guidance for Use. ISO/TC 207/SC 1 Environmental Management Systems; ICS: 03.100.70 Management Systems and ICS 13.020.10 Environmental Management, 3rd ed.; International Organization for Standardization with Technical Committee: Geneva, Switzerland, 2015; p. 35.
  36. Standard ISO 20121:2012 Event Sustainability Management Systems—Requirements with Guidance for Use. ISO/TMBG Technical Management Board-Groups; ICS: 03.100.70 Management Systems and ICS: 13.020.20 Environmental Economics. Sustainability, 1st ed.; International Organization for Standardization with Technical Committee: Geneva, Switzerland, 2012; p. 42.
  37. ICS. International Classification for Standards, 7th ed.; International Organization for Standardization: Geneva, Switzerland, 2015; p. 170. ISBN 978-92-67-10652-6. [Google Scholar]
  38. Nováková, R. Methodology of monitoring and evaluation of the specific category of costs relating to quality-costs relating to the certification process. Intercathedra Poznań Pol. 2006, 22, 120–123. [Google Scholar]
  39. Standard ISO 19011:2018 Guidelines for Auditing Management Systems, ICS: 03.120.20 Product and Company Certification. Conformity Assessment, 3rd ed.; International Organization for Standardization with Technical Committee, ISO/TMBG Technical Management Board-Groups: Geneva, Switzerland, 2018; p. 46.
  40. Auditing. Available online: https://asq.org/quality-resources/auditing (accessed on 21 June 2021).
  41. Standard ISO/IEC 17021-1:2015 Conformity Assessment—Requirements for Bodies Providing Audit and Certification of Management Systems—Part 1: Requirements, Systems—Requirements with Guidance for Use, ISO/CASCO Committee on Conformity Assessment; ICS: 03.120.20 Product and Company Certification. Conformity Assessment, 1st ed.; International Organization for Standardization with Technical Committee: Geneva, Switzerland, 2015; p. 48.
  42. Zgodavová, K.; Hudec, O.; Palfy, P. Culture of quality: Insight into foreign organizations in Slovakia. Total Qual. Manag. Bus. Excell. 2017, 1–22. [Google Scholar] [CrossRef]
  43. Hrubec, J.; Virčíková, E.; Bajla, J.; Dufinec, I.; Girmanová, L.; Grmanová, E.; Hekelová, E.; Janošcová, R.; Jašková, D.; Julény, A.; et al. Integrovaný Manažérsky System, 1st ed.; Slovenská Poľnohospodárska Univerzita: Nitra, Slovakia, 2009; p. 535. ISBN 978-80-552-0231-0. [Google Scholar]
  44. Nováková, R.; Čekanová, K.; Pauliková, A. Integration management system—New requirements of ISO 9001:2015 and ISO 14001: 2015 standards. Prod. Eng. Arch. 2016, 13, 35–40. [Google Scholar] [CrossRef]
  45. Chovancová, J.; Rovnak, M.; Bogľarský, J.; Bogl’arská, L. Implementation of standardized management systems with focus on their integration. In Proceedings of the Production Management and Engineering Sciences: Scientific Publication of the International Conference on Engineering Science and Production Management (ESPM 2015), Tatranská Štrba, High Tatras Mountains, the Slovak Republic, 16th–17th April 2015; CRC Press: Leiden, The Netherlands, 2016; pp. 247–252. [Google Scholar]
  46. Martínez-Perales, S.; Ortiz-Marcos, I.; Ruiz, J.J.; Lázaro, F.J. Using Certification as a Tool to Develop Sustainability in Project Management. Sustainability 2018, 10, 1408. Available online: https://0-www-mdpi-com.brum.beds.ac.uk/2071-1050/10/5/1408/htm (accessed on 28 April 2021). [CrossRef] [Green Version]
  47. Brunson, E.K.; Chandler, H.; Gronvall, G.K.; Ravi, S.; Sell, T.K.; Shearer, M.P.; Schoch-Spana, M.L. The SPARS Pandemic 2025–2028: A Futuristic Scenario to Facilitate Medical Countermeasure Communication. J. Int. Crisis Risk Commun. Res. 2020, 3, 71–102. [Google Scholar] [CrossRef] [Green Version]
  48. Majernik, M.; Daneshjo, N.; Chovancová, J.; Sanciova, G. Design of integrated management systems according to the revised ISO standards. Pol. J. Manag. Stud. 2017, 15, 135–143. [Google Scholar] [CrossRef]
  49. Slavova, G. Global and Domestic Bulgarian Production of Cocoa and Chocolate Articles for the Period 2013–2016. Trakia J. Sci. 2017, 15 (Suppl. 1), 10–17. Available online: http://www.uni-sz.bg (accessed on 28 April 2021). [CrossRef]
  50. Stefanova, G.M. Risk Analysis and Impact of Raw Materials for Achievement of Sustainable Quality of Biscuit Products. J. Food Sci. Eng. 2017, 7, 227–238. [Google Scholar] [CrossRef] [Green Version]
  51. Bastas, A.; Liyanage, K. ISO 9001 and Supply Chain Integration Principles Based Sustainable Development: A Delphi Study. Sustainability 2018, 10, 4569. Available online: https://0-www-mdpi-com.brum.beds.ac.uk/2071-1050/10/12/4569 (accessed on 25 June 2021). [CrossRef] [Green Version]
Figure 1. Initial central node: “TRIPLET MSS”, grey color circle with a label in rounded rectangular shape (Source: authors).
Sustainability 13 08812 g001
Figure 2. Three core nodes for individual MSSs according to ISO standards—standard tripod (Source: authors).
Sustainability 13 08812 g002
Figure 3. Triplet cluster—three core nodes for individual MSSs with their main clauses (Source: authors).
Sustainability 13 08812 g003
Figure 4. PDCA cycle cluster—three core nodes for individual MSSs with their relations—PLAN, DO, CHECK, ACT, the cut-out (Source: authors).
Sustainability 13 08812 g004
Figure 5. Complex cluster—three core nodes for individual MSSs with their affiliated requirements, documented information, and notes (complex triplet model); (Source: authors).
Sustainability 13 08812 g005
Figure 6. The example of node 4: Context of the organization, with its sub-clauses, sub-sub-clause, requirements, documented information and notes for ISO 9001:2015 QMS (Source: authors).
Sustainability 13 08812 g006
Figure 7. Overview of all Requirements II. for MSS according to ISO 20121:2012, a scan from program application TouchGraph Navigator, the cut-out (Source: authors).
Sustainability 13 08812 g007
Figure 8. Detailed nodes for documented information and notes, the cut-out (Source: authors).
Sustainability 13 08812 g008
Figure 9. Intersection representation of full and partial integration of management systems (Source: authors).
Sustainability 13 08812 g009
Table 1. Summary evaluation of all aspects leading to selection of the management standards for the triplet (Source: authors).
Aspects Influencing Selection ProcessManagement Systems
Quality Management SystemsEnvironmental Management SystemsEvent Sustainability Management Systems
AHas the management system its own international standard?YES
ISO 9001:2015
YES
ISO 14001:2015
YES
ISO 20121:2012
BIs the standard a Type A?YESYESYES
CIs the standard drawn with the High-Level Structure (HLS)?YESYESPARTIALLY (>80%)
DDoes the standard operate on the PDCA cycle?YESYESYES
ECould be the standard individually certified?YESYESYES
FIs the standard new?NO
Edition: 5
NO
Edition: 3
YES
Edition: 1
GIs the standard available in the national languages of the authors?YESYESPARTIALLY
(not available in the Slovak language yet)
HFrequency of the standard integration within an organizationmost often integrated into all spheres of production and service providingmost often integrated into all spheres of production and service providingintegrated for support of sustainable development
IDoes the standard align with The 2030 Agenda for sustainable development?YES
Goals: 1, 9, 12, 14
YES
Goals: 1, 2, 3, 4, 6, 7, 8, 9, 12, 13, 14, 15
YES
Goals: 3, 5, 6, 7, 89, 10, 11, 12, 13, 16
JFrequency of the use of the standard in authors’ workDAILY
Frequently used in other projects, education, and training
WEEKLY
Frequently used in other projects, education, and training
MONTHLY
Regularly used for research, and education
Table 2. Entity set description of nodes for the MSS model triplet visualization (Source: authors).
Cell in ExcelGroup of Nodes in
TouchGraph Navigator
Level of Structure
ISO Standard
H1Number of requirements I.Clause 1
I1Number of documented information I.Clause
J1Number of notes I.Clause
K1Sub-clauseSub-clause
L1Number of requirements II.Sub-clause
M1Number of documented information II.Sub-clause
N1Number of notes II.Sub-clause
O1Sub-sub-clauseSub-sub-clause
P1Number of requirements III.Sub-sub-clause
Q1Number of documented information III.Sub-sub-clause
R1Number of notes III.Sub-sub-clause
S1Sub-sub-sub-clauseSub-sub-sub-clause
T1Number of requirements IV.Sub-sub-sub-clause
U1Number of documented information IV.Sub-sub-sub-clause
V1Number of notes IV.Sub-sub-sub-clause
1 Requirements defined in Clause are marked I.
Table 3. Comparison of three management systems according to relevant standards (Source: authors).
Phase of PDCA CycleStandard ISO 9001:2015 QMSStandard ISO 14001:2015 EMSStandard ISO 20121:2012 ESMS
IntroductionIntroductionIntroduction
0.1 General0.1 Background
0.2 Quality management principles0.2 Aim of an environmental management system
0.3 Process approach0.3 Success factors
0.3.1 General
0.3.2 Plan-Do-Check-Act cycle
0.3.3 Risk-based thinking
0.4 Relationship with other management standards0.4 Plan-Do-Check-
Act model >> 0.3.2 QMS
0.5 Contents of this international standard
1 Scope1 Scope1 Scope
2 Normative references2 Normative references2 Normative references
3 Terms and definitions3 Terms and definitions3 Terms and definitions
4 Context of the organization4 Context of the organization4 Context of the organization
4.1 Understanding the organization and its context4.1 Understanding the organization and its context4.1 Understanding the organization and its context
I. phase of cycle PDCA: PLAN4.2 Understanding the needs and expectations of interested parties4.2 Understanding the needs and expectations of interested parties4.2 Understanding the needs and expectations of interested parties
I. phase of cycle PDCA: PLAN4.3 Determining the scope of the quality management system4.3 Determining the scope of the environmental management system4.3 Determining the event sustainability management system
4.4 Quality management system and its processes4.4 Environmental management system4.4 Event sustainability management system
4.4.1 Establish, implement, maintain and continually improve…
4.4.2 Maintain documented information…
I. phase of cycle PDCA: PLAN 4.5 Sustainable development principles, statement of purpose and values
5 Leadership5 Leadership5 Leadership
5.1 Leadership and commitment5.1 Leadership and commitment5.1 Leadership and commitment
5.1.1 General
I. phase of cycle PDCA: PLAN5.1.2 Customer focus
I. phase of cycle PDCA: PLAN5.2 Policy5.2 Environmental policy5.2 Policy
I. phase of cycle PDCA: PLAN5.2.1 Establishing the quality policy 5.2.1 Top management shall establish a sustainable development policy
I. phase of cycle PDCA: PLAN5.2.2 Communicating the quality policy 5.2.2 The organization shall retain documented information on the policy
I. phase of cycle PDCA: PLAN5.3 Organizational roles, responsibilities and authorities5.3 Organizational roles, responsibilities and authorities5.3 Organizational roles, responsibilities and authorities
I. phase of cycle PDCA: PLAN6 Planning6 Planning6 Planning
I. phase of cycle PDCA: PLAN6.1 Actions to address risks and opportunities6.1 Actions to address risks and opportunities6.1 Actions to address risks and opportunities
I. phase of cycle PDCA: PLAN6.1.1 Consider issues of 4.1 and requirements of 4.2.6.1.1 General6.1.1 General
I. phase of cycle PDCA: PLAN6.1.2 Actions to address risks and opportunities6.1.2 Environmental aspects6.1.2 Issue identification and evaluation
I. phase of cycle PDCA: PLAN 6.1.3 Compliance obligations6.1.3 Legal and other requirements
I. phase of cycle PDCA: PLAN 6.1.4 Planning action
I. phase of cycle PDCA: PLAN6.2 Quality objectives and planning to achieve them6.2 Environmental objectives and planning to achieve them6.2 Event sustainability objectives and how to achieve them
I. phase of cycle PDCA: PLAN6.2.1 Quality objectives at relevant functions…6.2.1 Environmental objectives
I. phase of cycle PDCA: PLAN6.2.2 Determine what, who, when, how…6.2.2 Planning actions to achieve environmental objectives
I. phase of cycle PDCA: PLAN6.3 Planning of changes
II. phase of cycle PDCA: DO7 Support7 Support7 Support
7.1 Resources7.1 Resources
II. phase of cycle PDCA: DO7.1.1 General
7.1.2 People
II. phase of cycle PDCA: DO7.1.3 Infrastructure
7.1.4 Environment for the operation of processes
II. phase of cycle PDCA: DO7.1.5 Monitoring and measuring resources>>9.1.1 Operational control—Monitoring, measuring equipment
7.1.5.1 General
II. phase of cycle PDCA: DO7.1.5.2 Measurement traceability
7.1.6 Organizational knowledge
II. phase of cycle PDCA: DO7.2 Competence7.2 Competence7.2 Competence
7.3 Awareness7.3 Awareness7.3 Awareness
II. phase of cycle PDCA: DO7.4 Communication7.4 Communication7.4 Communication
7.4.1 General
II. phase of cycle PDCA: DO 7.4.2 Internal communication
7.4.3 External communication
II. phase of cycle PDCA: DO7.5 Documented information7.5 Documented information7.5 Documented information
II. phase of cycle PDCA: DO7.5.1 General7.5.1 General7.5.1 General
7.5.2 Creating and updating7.5.2 Creating and updating7.5.2 Creating and updating
II. phase of cycle PDCA: DO7.5.3 Control of documented information7.5.3 Control of documented information7.5.3 Control of documented information
II. phase of cycle PDCA: DO7.5.3.1 Documented information controlled…
II. phase of cycle PDCA: DO7.5.3.2 Activities for control of information…
8 Operation8 Operation8 Operation
II. phase of cycle PDCA: DO8.1 Operational planning and control8.1 Operational planning and control8.1 Operational planning and control
II. phase of cycle PDCA: DO8.2 Requirements for products and services8.2 Emergency preparedness and response8.2 Dealing with modified activities, products or services
II. phase of cycle PDCA: DO8.2.1 Customer communication
II. phase of cycle PDCA: DO8.2.2 Determining the requirements for products and services
II. phase of cycle PDCA: DO8.2.3 Review of the requirements for products and services
II. phase of cycle PDCA: DO8.2.3.1 Ensure ability to meet requirements…
II. phase of cycle PDCA: DO8.2.3.2 Retain documented information…
II. phase of cycle PDCA: DO8.2.4 Changes to requirements for products and services
II. phase of cycle PDCA: DO8.3 Design and development of products and services>>>8.1 Operational control—Design and development8.3 Supply chain management >>> 8.4 QMS
II. phase of cycle PDCA: DO8.3.1 General
II. phase of cycle PDCA: DO8.3.2 Design and development planning
II. phase of cycle PDCA: DO8.3.3 Design and development inputs
II. phase of cycle PDCA: DO8.3.4 Design and development controls
II. phase of cycle PDCA: DO8.3.5 Design and development outputs
II. phase of cycle PDCA: DO8.3.6 Design and development changes
II. phase of cycle PDCA: DO8.4 Control of externally provided processes, products and services>>>8.1 Operational control>>> External providers
II. phase of cycle PDCA: DO8.4.1 General
II. phase of cycle PDCA: DO8.4.2 Type and extent of control
II. phase of cycle PDCA: DO8.4.3 Information for external providers
II. phase of cycle PDCA: DO8.5 Production and service provision
II. phase of cycle PDCA: DO8.5.1 Control of production and service provision>>>8.1 Operational control>>>Provision of production and service
II. phase of cycle PDCA: DO8.5.2 Identification and traceability
II. phase of cycle PDCA: DO8.5.3 Property belonging to customers or external providers
II. phase of cycle PDCA: DO8.5.4 Preservation
II. phase of cycle PDCA: DO8.5.5 Post-delivery activities>>>8.1 Operational control >>> Delivery and post delivery
II. phase of cycle PDCA: DO8.5.6 Control of changes
II. phase of cycle PDCA: DO8.6 Release of products and services
II. phase of cycle PDCA: DO8.7 Control of nonconforming outputs
III. phase of cycle PDCA: CHECK9 Performance evaluation9 Performance evaluation9 Performance evaluation
III. phase of cycle PDCA: CHECK9.1 Monitoring measurement, analysis and evaluation >>> 9.2 ESMS9.1 Monitoring measurement, analysis and evaluation >>> 9.2 ESMS9.1 Performance against governing principles of sustainable development
III. phase of cycle PDCA: CHECK9.1.1 General9.1.1 General9.2 Monitoring, measurement, analysis and evaluation>>> 9.1 QMS, EMS
III. phase of cycle PDCA: CHECK9.1.2 Customer satisfaction9.1.2 Evaluation of compliance
III. phase of cycle PDCA: CHECK9.1.3 Analysis and evaluation
III. phase of cycle PDCA: CHECK9.2 Internal audit >>> 9.3 ESMS9.2 Internal audit >>> 9.3 ESMS
III. phase of cycle PDCA: CHECK9.2.1 Conduct internal audits at planned intervals.9.2.1 General
III. phase of cycle PDCA: CHECK9.2.2 Plan, establish, implement and maintain audit program…9.2.2 Internal audit program
III. phase of cycle PDCA: CHECK9.3 Management review >>> 9.4 ESMS 9.3 Management review >>> 9.4 ESMS9.3 Internal audit >>> 9.2 QMS, EMS
III. phase of cycle PDCA: CHECK9.3.1 General
III. phase of cycle PDCA: CHECK9.3.2 Management review inputs
III. phase of cycle PDCA: CHECK9.3.3 Management review outputs
III. phase of cycle PDCA: CHECK 9.4 Management review >>> 9.3 QMS, EMS
IV. phase of cycle PDCA: ACT10 Improvement10 Improvement10 Improvement
IV. phase of cycle PDCA: ACT10.1 General10.1 General10.1 Nonconformity and corrective action >>> 10.2 QMS, EMS
IV. phase of cycle PDCA: ACT10.2 Nonconformity and corrective action >>> 10.1 ESMS10.2 Nonconformity and corrective action >>> 10.1 ESMS
IV. phase of cycle PDCA: ACT10.2.1 When a nonconformity occurs…
IV. phase of cycle PDCA: ACT10.2.2 Retain documented information…
IV. phase of cycle PDCA: ACT10.3 Continual improvement10.3 Continual improvement10.2 Continual improvement
Publisher’s Note: MDPI stays neutral with regard to jurisdictional claims in published maps and institutional affiliations.

