
Experimental Study on the Sustainability Assessment of AWJ Machining of Ti-6Al-4V Using Glass Beads Abrasive Particles


 , and
, and 
Abstract
:1. Introduction
2. Sustainability Assessment in Manufacturing
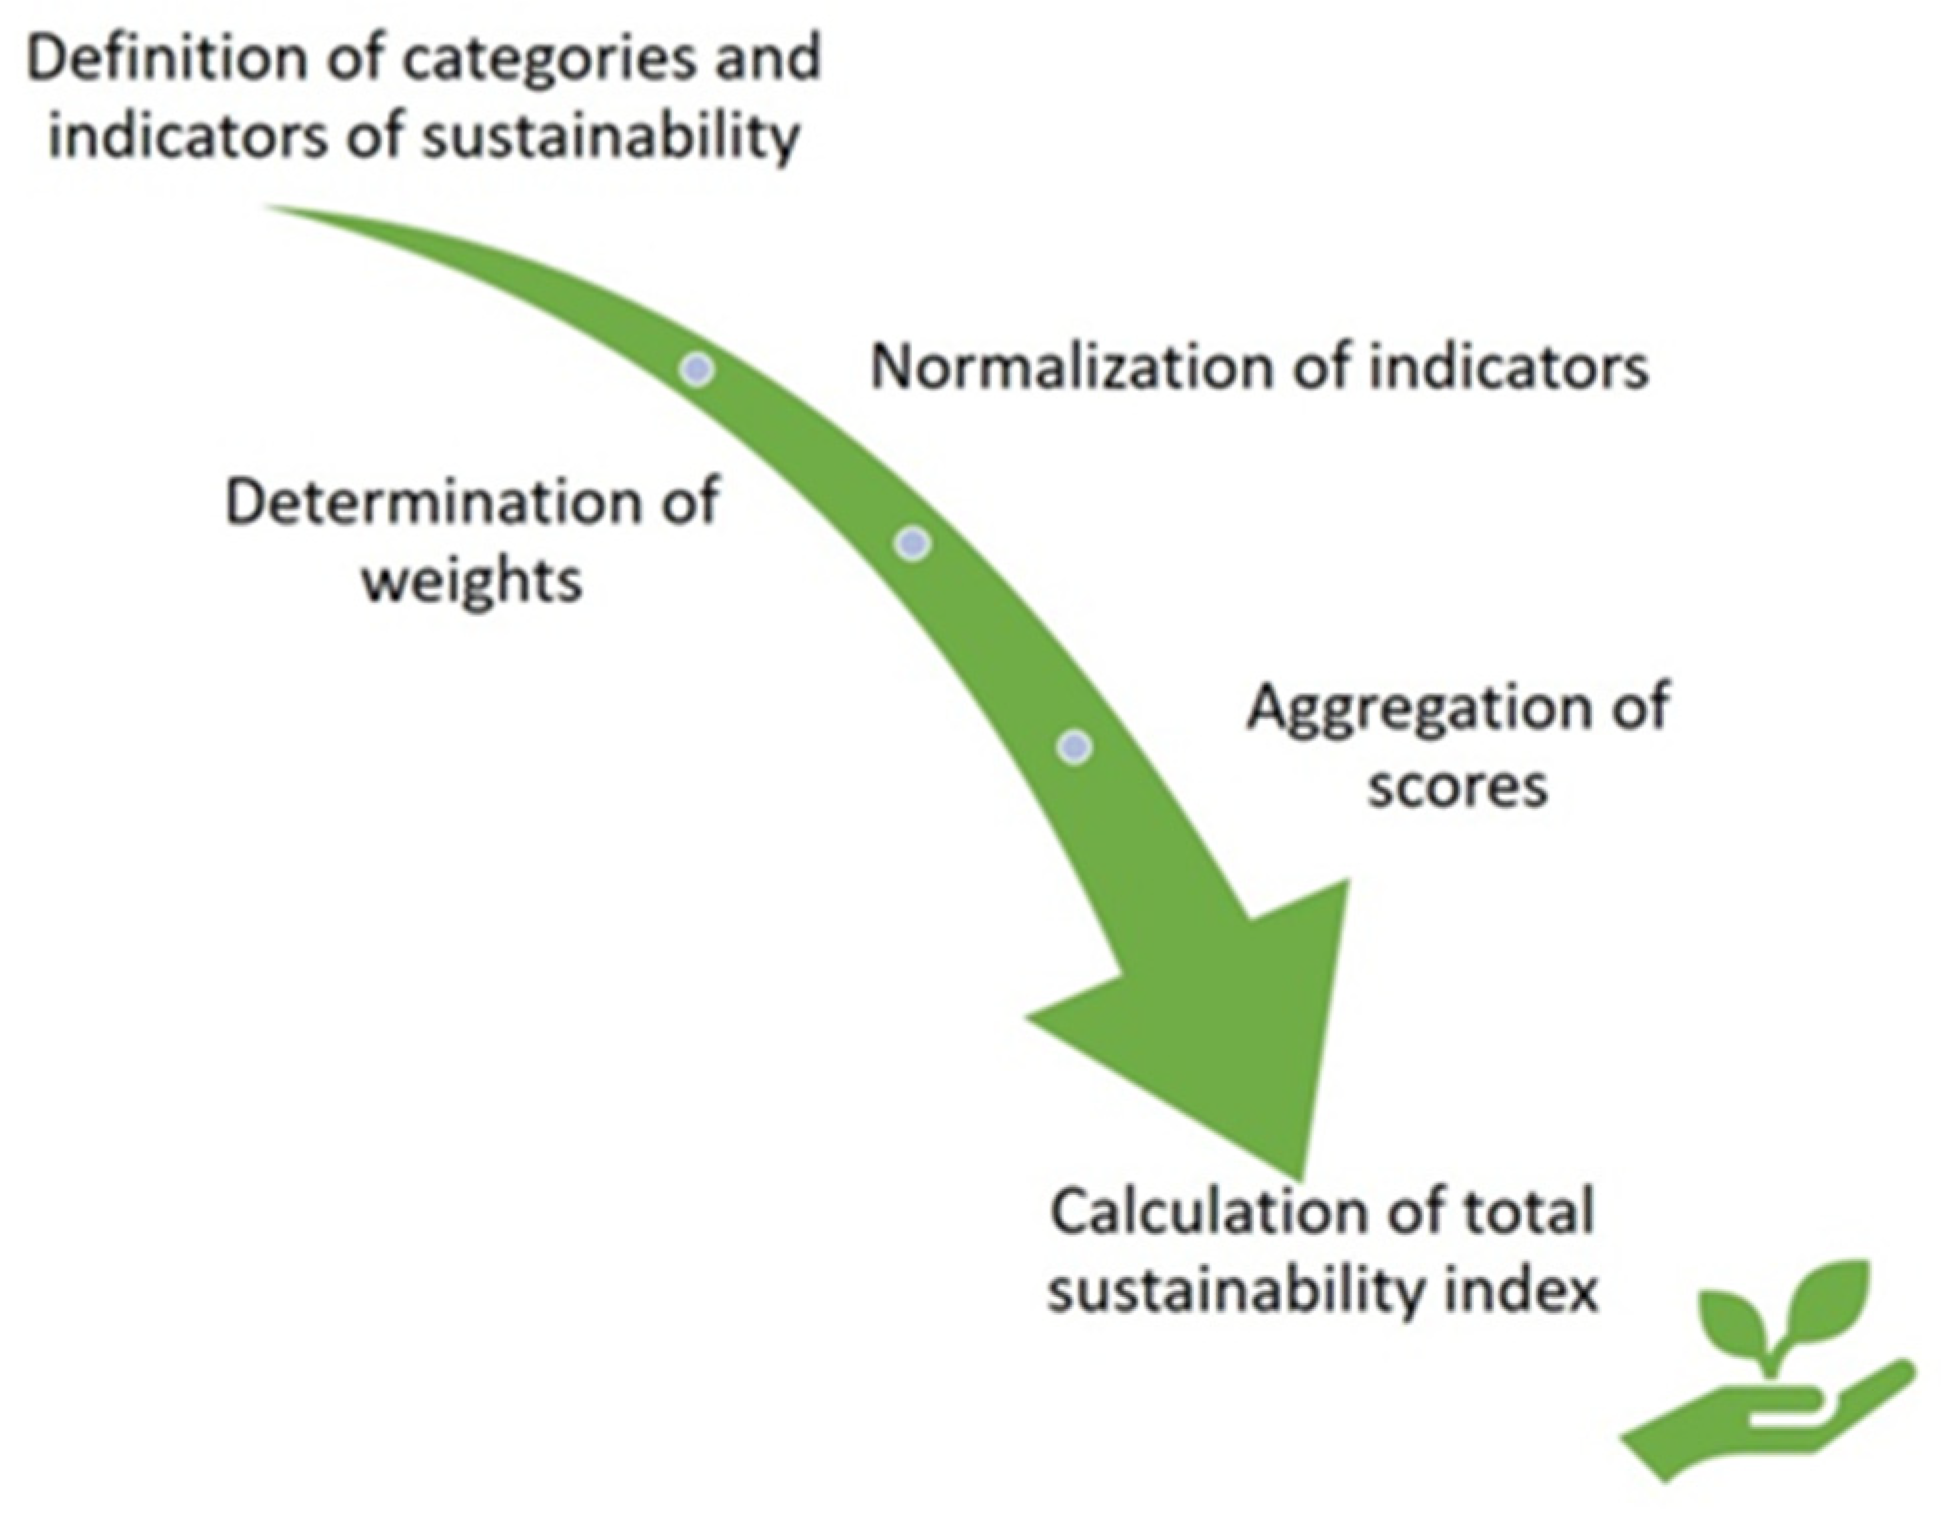
- (1)
- Categories and indicators of sustainability are defined. Indicators which are not useful or do not have a noticeable effect for the specific system are not included.
- (2)
- The values of all indicators are properly normalized in order to eliminate any artificially created relatively higher influence of some indicators due to their absolute values.
- (3)
- The indicators of each category are assigned weights according to their importance towards the final goal.
- (4)
- An aggregation procedure is carried out, using scores and weights of each category to calculate an overall sustainability score.
- (5)
- Finally, the sustainability scores of all assessed processes are compared.
3. Materials and Methods
4. Results and Discussion
4.1. Analysis of Experimental Results
4.2. Sustainability Assessment Process
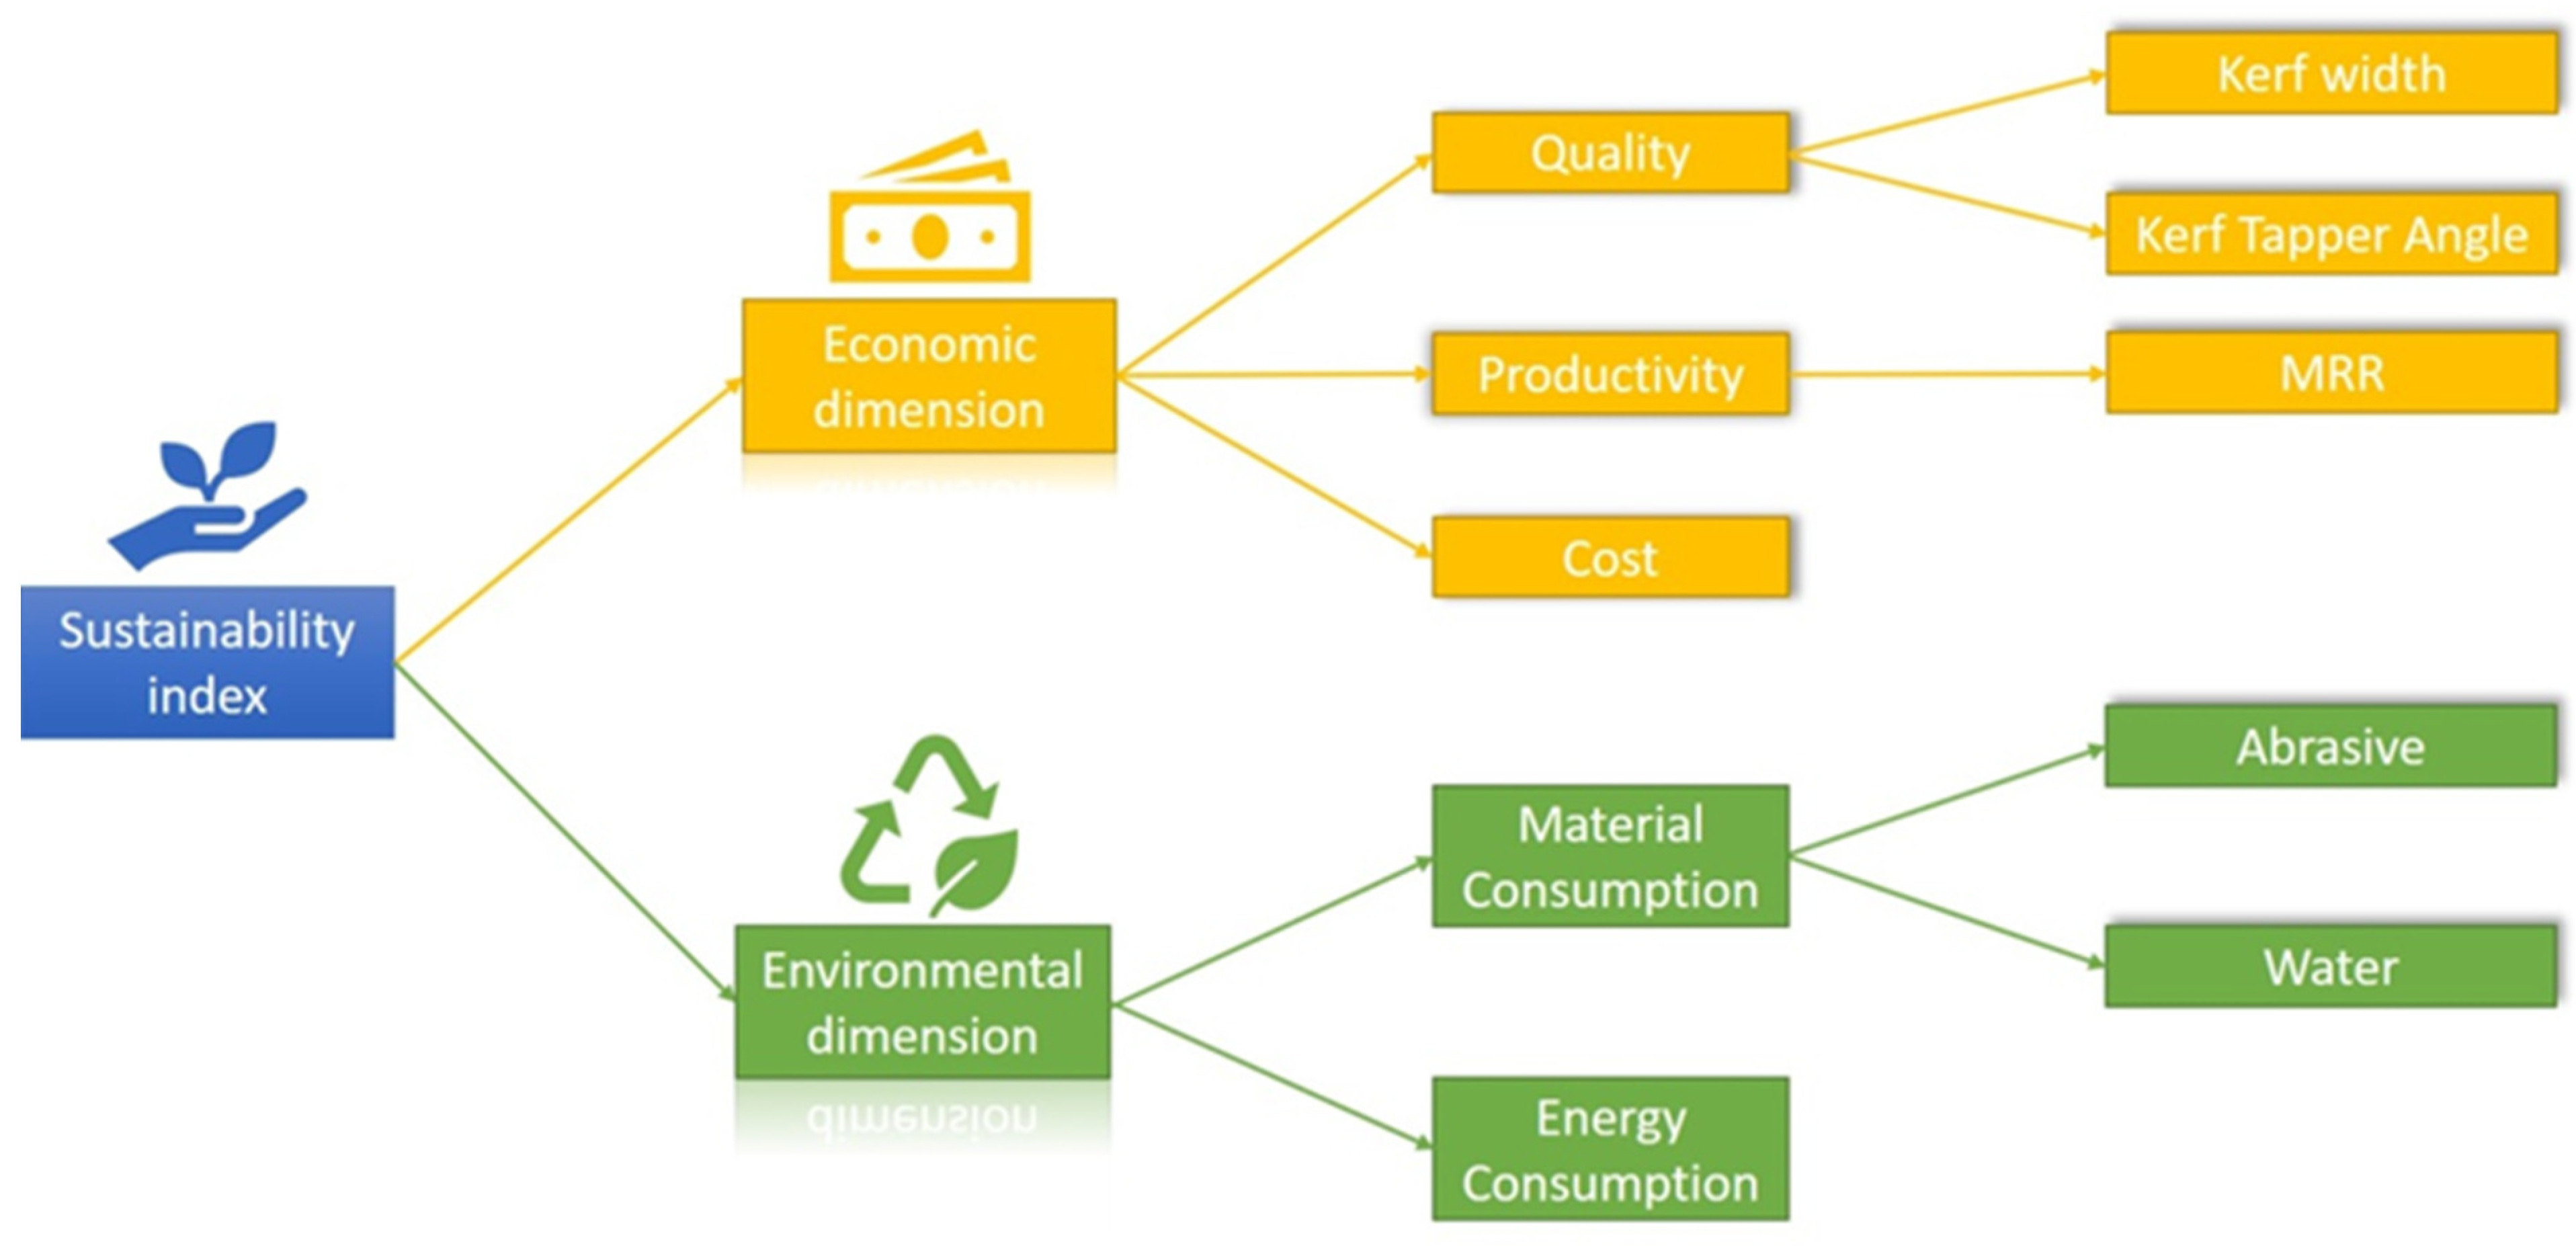
4.2.1. Sustainability Indicators
4.2.2. Sustainability Assessment Method
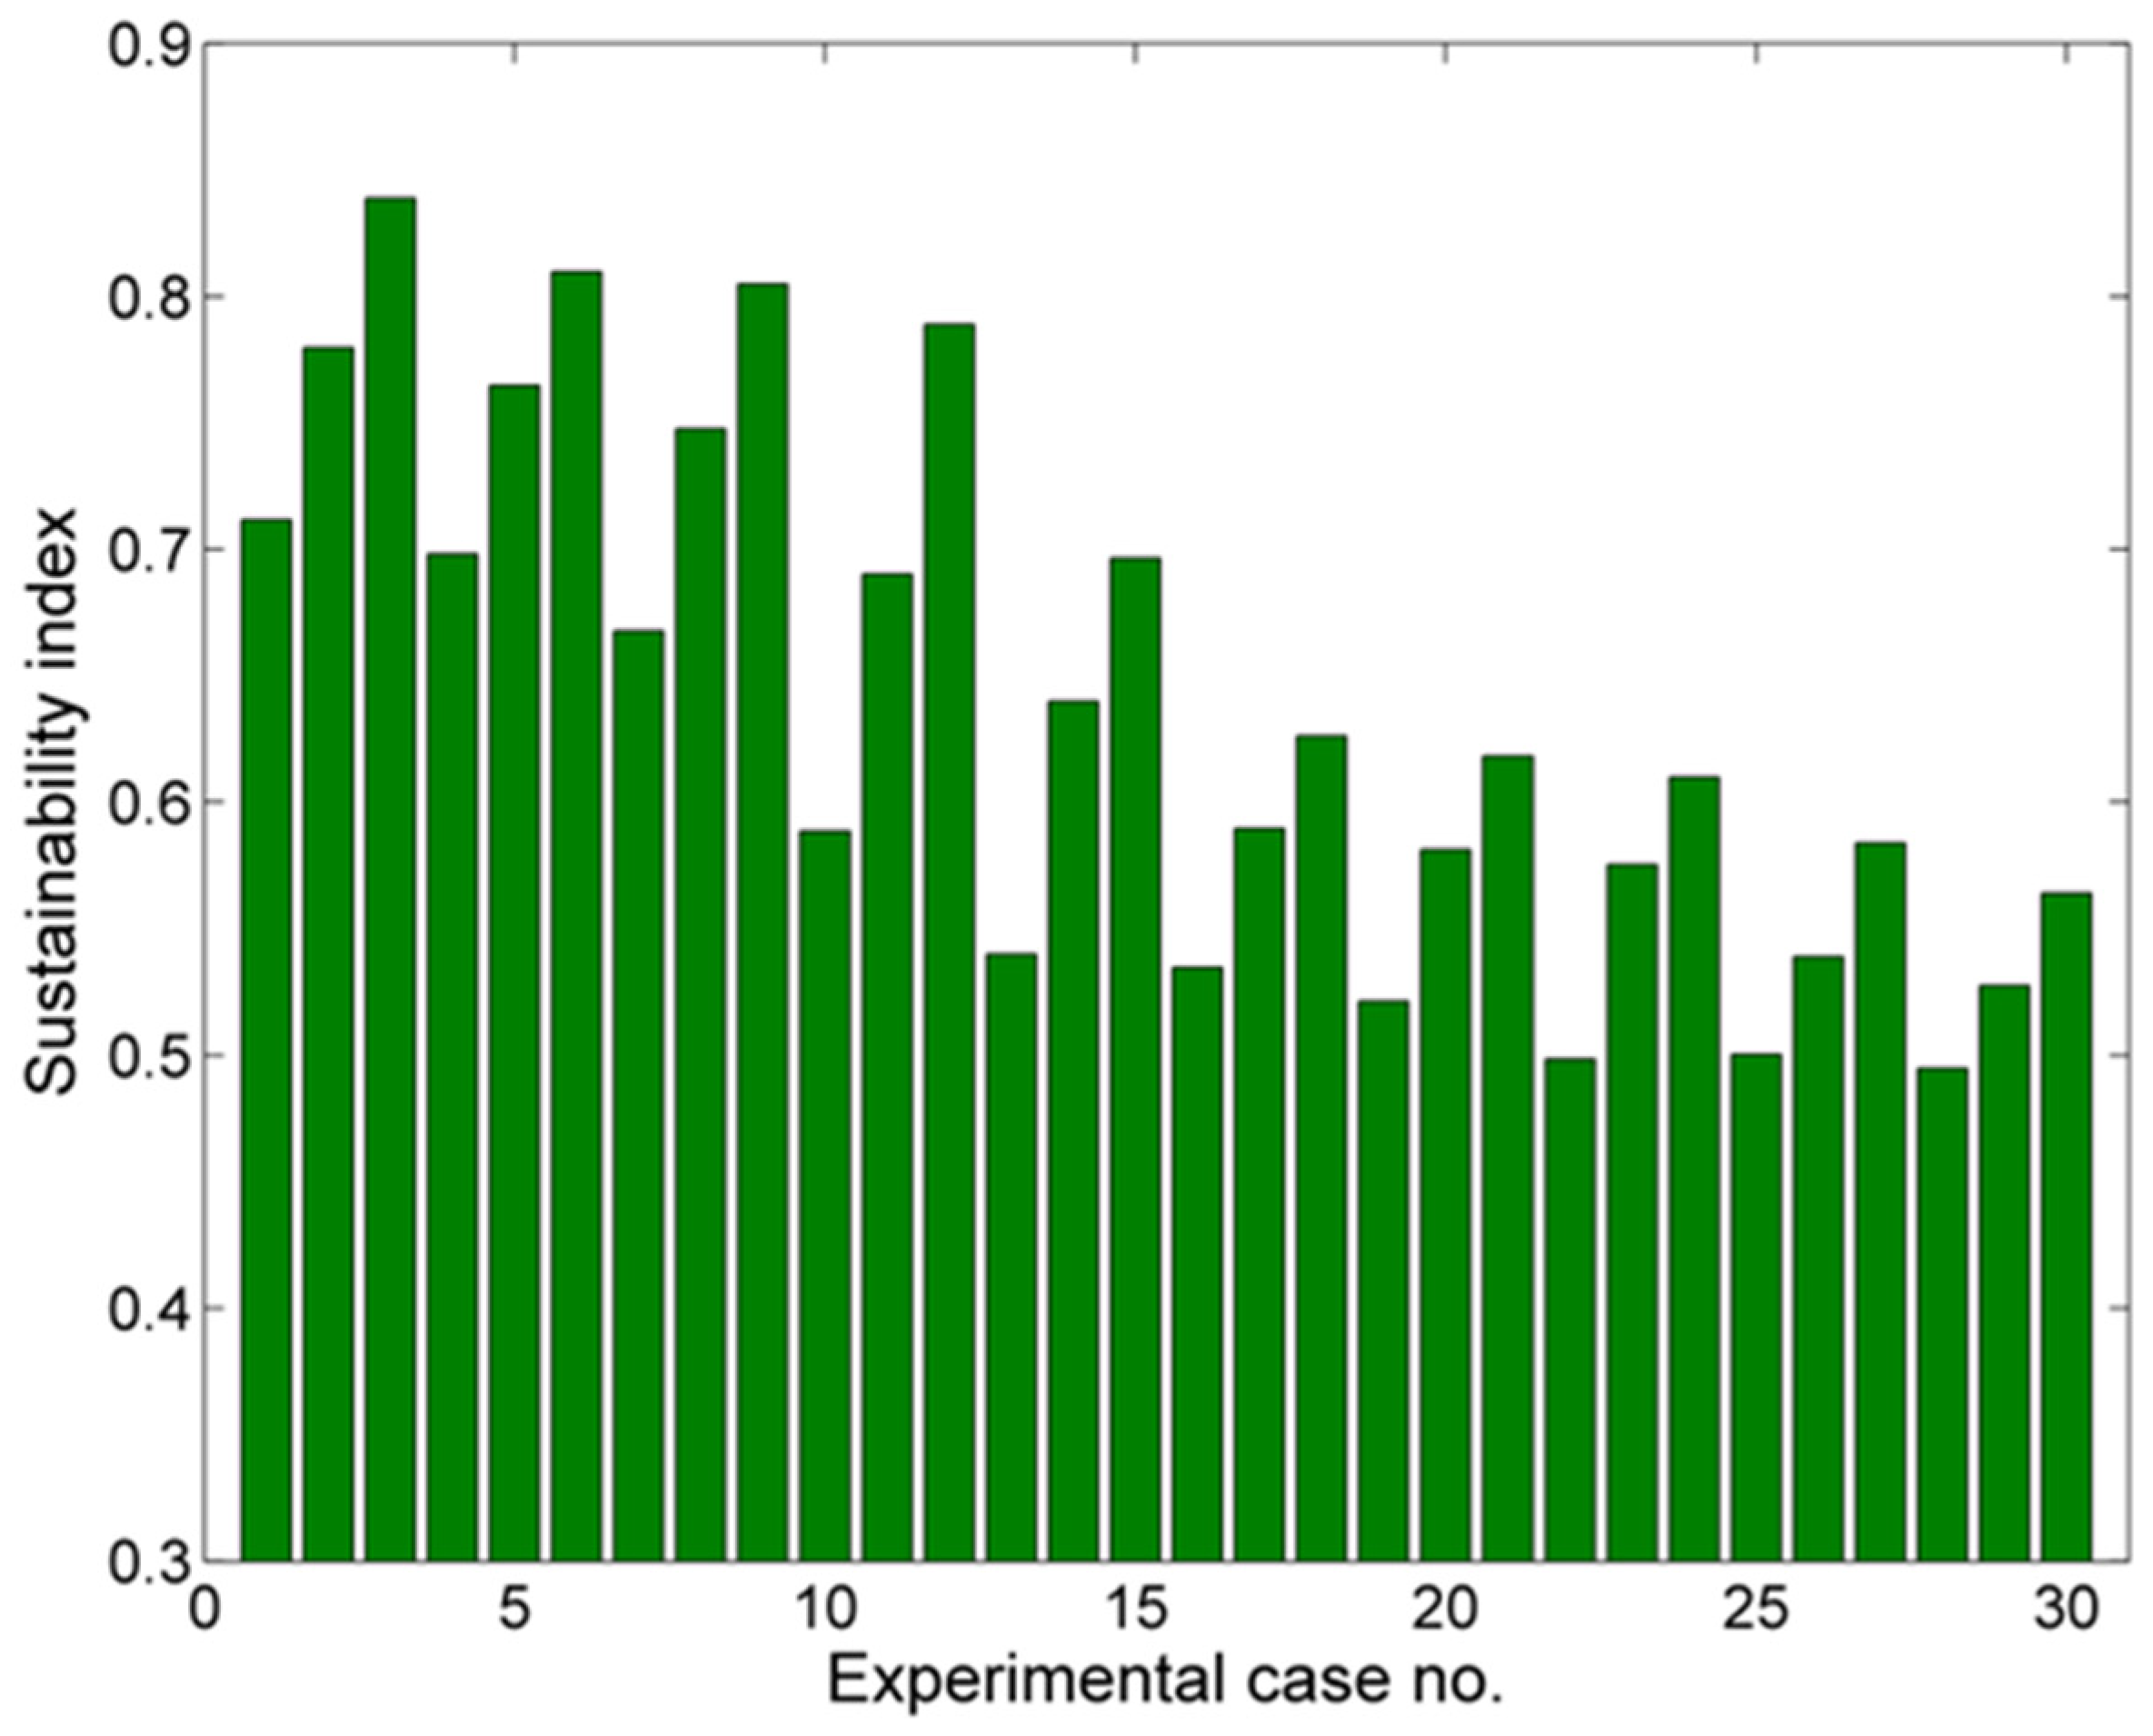
4.3. Sustainability Assessment Results
5. Conclusions
Author Contributions
Funding
Institutional Review Board Statement
Informed Consent Statement
Data Availability Statement
Conflicts of Interest
References
- Saad, M.H.; Nazzal, M.A.; Darras, B.M. A general framework for sustainability assessment of manufacturing processes. Ecol. Indic. 2019, 97, 211–224. [Google Scholar] [CrossRef]
- Manufacturing Value Added Data. Available online: https://data.worldbank.org/indicator/NV.IND.MANF.CD (accessed on 25 June 2021).
- Zackrisson, M.; Enroth, M.; Widing, A. Environmental Management Systems—Paper Tiger or Powerful Tool. In 2000 Eco-Management and Auditing Conference; IVF Research Publication: Molndal, Sweden, 2000. [Google Scholar]
- Krolczyk, G.M.; Maruda, R.W.; Krolczyk, J.B.; Wojciechowski, S.; Mia, M.; Nieslony, P.; Budzik, G. Ecological trends in machining as a key factor in sustainable production—A review. J. Clean. Prod. 2019, 218, 601–615. [Google Scholar] [CrossRef]
- Tamilarasan, A.; Arumugam, S.; Rajamani, D.; Changareddy, P.; Balasubramanian, E.; Pranay, P. Multi-response Optimization of AWJ Process Parameters in Cut Quality Characteristics of Hastelloy C-276. In Advances in Materials and Manufacturing Engineering; Rajmohan, T., Palanikumar, K., Davim, J.P., Eds.; Springer: Singapore, 2021; Volume 7, pp. 381–388. [Google Scholar] [CrossRef]
- Chen, M.; Zhang, S.; Zeng, J.; Chen, B. Correcting shape error located in cut-in/cut-out region in abrasive water jet cutting process. Int. J. Adv. Manuf. Technol. 2019, 102, 1165–1178. [Google Scholar] [CrossRef]
- Karmiris-Obratański, P.; Karkalos, N.E.; Kudelski, R.; Papazoglou, E.L.; Markopoulos, A.P. On the Effect of Multiple Passes on Kerf Characteristics and Efficiency of Abrasive Waterjet Cutting. Metals 2021, 11, 74. [Google Scholar] [CrossRef]
- Yuvaraj, N.; Murugesan, P.K.; Mohan, M.; Khan, S.A.L.A. Abrasive Water Jet Machining process: A state of art of review. J. Manuf. Process. 2020, 49, 271–322. [Google Scholar]
- Kale, A.; Singh, S.K.; Sateesh, N.; Subbiah, R. A review on abrasive water jet machining process and its process parameters. Mater. Today Proc. 2020, 26, 1032–1036. [Google Scholar] [CrossRef]
- Rabani, A.; Madariaga, J.; Bouvier, C.; Axinte, D. An approach for using iterative learning for controlling the jet penetration depth in abrasive waterjet milling. J. Manuf. Process. 2016, 22, 99–107. [Google Scholar] [CrossRef]
- Perec, A. Experimental research into alternative abrasive material for the abrasive water-jet cutting of titanium. Int. J. Adv. Manuf. Technol. 2018, 97, 1529–1540. [Google Scholar] [CrossRef]
- Yuan, Y.; Chen, J.; Gao, H.; Wang, X. An investigation into the abrasive waterjet milling circular pocket on titanium alloy. Int. J. Adv. Manuf. Technol. 2020, 107, 4503–4515. [Google Scholar] [CrossRef]
- Alberdi, A.; Rivero, A.; López de Lacalle, L.N.; Etxeberria, I.; Suárez, A. Effect of process parameter on the kerf geometry in abrasive water jet milling. Int. J. Adv. Manuf. Technol. 2010, 51, 467–480. [Google Scholar] [CrossRef]
- Uhlmann, E.; Männel, C.; Braun, T. Efficient abrasive water jet milling for near-net-shape fabrication of difficult-to-cut materials. Int. J. Adv. Manuf. Technol. 2020, 111, 685–693. [Google Scholar] [CrossRef]
- Chithirai Pon Selvan, M.; Midhunchakkaravarthy, D.; Senanayake, R.; Ramaswamy Pillai, S.; Reddy Madara, S. A mathematical modelling of Abrasive Waterjet Machining on Ti-6Al-4V using Artificial Neural Network. Mater. Today Proc. 2020, 28, 538–544. [Google Scholar] [CrossRef]
- Chen, F.L.; Siores, E.; Patel, K.; Momber, A.W. Minimising particle contamination at abrasive waterjet machined surfaces by a nozzle oscillation technique. Int. J. Mach. Tools Manuf. 2002, 42, 1385–1390. [Google Scholar] [CrossRef]
- Rivero, A.; Alberdi, A.; Artaza, T.; Mendia, L.; Lamikiz, A. Surface properties and fatigue failure analysis of alloy 718 surfaces milled by abrasive and plain waterjet. Int. J. Adv. Manuf. Technol. 2018, 94, 2929–2938. [Google Scholar] [CrossRef]
- Fowler, G.; Shipway, P.H.; Pashby, I.R. A technical note on grit embedment following abrasive water-jet milling of a titanium alloy. J. Mater. Process. Technol. 2005, 159, 356–368. [Google Scholar] [CrossRef]
- Boud, F.; Carpenter, C.; Folkes, J.; Shipway, P.H. Abrasive waterjet cutting of a titanium alloy: The influence of abrasive morphology and mechanical properties on workpiece grit embedment and cut quality. J. Mater. Process. Technol. 2010, 210, 2197–2205. [Google Scholar] [CrossRef]
- Hashish, M. Characteristics of surfaces machined with abrasive water jets. J. Eng. Mater. Tech. 1991, 113, 354–362. [Google Scholar] [CrossRef]
- Bergs, T.; Schüler, M.; Dadgar, M.; Herrig, T.; Klink, A. Investigation of Waterjet Phases on Material Removal Characteristics. Procedia CIRP 2020, 95, 12–17. [Google Scholar] [CrossRef]
- Stachowiak, G.B.; Stachowiak, G.W. The effects of particle characteristics on three body abrasive wear. Wear 2001, 249, 201–207. [Google Scholar] [CrossRef]
- Fowler, G.; Pashby, I.R.; Shipway, P.H. The effect of particle hardness and shape when abrasive water jet milling titanium alloy Ti6Al4V. Wear 2009, 266, 613–620. [Google Scholar] [CrossRef]
- Fowler, G.; Shipway, P.H.; Pashby, I.R. Abrasive water-jet controlled depth milling of Ti6Al4V alloy—An investigation of the role of jet—Workpiece traverse speed and abrasive grit size on the characteristics of the milled material. J. Mater. Process. Technol. 2005, 161, 407–414. [Google Scholar] [CrossRef]
- Yu, Y.; Sun, T.; Yuan, Y.; Gao, H.; Wang, X. Experimental investigation into the effect of abrasive process parameters on the cutting performance for abrasive waterjet technology: A case study. Int. J. Adv. Manuf. Technol. 2020, 107, 2757–2765. [Google Scholar] [CrossRef]
- Boud, F.; Murray, J.W.; Loo, L.F.; Clare, A.T.; Kinnell, P.K. Soluble abrasives for Waterjet Machining. Mater. Manuf. Process. 2014, 29, 1346–1352. [Google Scholar] [CrossRef] [Green Version]
- Kantha Babu, M.; Krishnaiah Chetty, O.V. Studies on recharging of abrasives in abrasive water jet machining. Int. J. Adv. Manuf. Technol. 2002, 19, 697–703. [Google Scholar] [CrossRef]
- Sabarinatha, P.; Annamalai, V.E.; Rajkumar, K. Sustainable application of grinding wheel waste as abrasive for abrasive water jet machining process. J. Clean. Prod. 2020, 261, 121225. [Google Scholar] [CrossRef]
- Kandasamy, J.; Vimal, K.E.K.; Sethuram, L. Quantification of environmental impacts of abrasive water jet cutting process through sustainability analysis. Int. J. Environ. Sustain. Dev. 2019, 18, 101–119. [Google Scholar] [CrossRef]
- Natarajan, Y.; Murugasen, P.K.; Sundarajan, L.R.; Arunachalam, R. Experimental investigation on cryogenic assisted abrasive water jet machining of aluminum alloy. Int. J. Precis. Eng. Manuf. Green Technol. 2019, 6, 415–432. [Google Scholar] [CrossRef]
- Pradhan, S.; Das, S.R.; Dhupal, D. Performance evaluation of recently developed new process HAJM during machining hardstone quartz using hot silicon carbide abrasives: An experimental investigation and sustainability assessment. Silicon 2020, 1–25. [Google Scholar] [CrossRef]
- Gupta, K.; Avvari, M.; Mashamba, A.; Mallaiah, M. Ice Jet Machining: A Sustainable Variant of Abrasive Water Jet Machining. In Sustainable Machining, 1st ed.; Davim, J.P., Ed.; Springer International Publishing: Cham, Switzerland, 2017; pp. 67–78. [Google Scholar]
- Jayal, A.D.; Badurdeen, F.; Dillon, O.W., Jr.; Jawahir, I.S. Sustainable manufacturing: Modeling and optimization challenges at the product, process and system levels. CIRP J. Manuf. Sci. Technol. 2010, 2, 144–152. [Google Scholar] [CrossRef]
- Khan, A.M.; Anwar, S.; Gupta, M.K.; Alfaify, A.; Hasnain, S.; Jamil, M.; Mia, M.; Pimenov, D.Y. Energy-based novel quantifiable sustainability value assessment method for machining processes. Energies 2020, 13, 6144. [Google Scholar] [CrossRef]
- Hegab, H.A.; Darras, B.; Kishawy, H.A. Towards sustainability assessment of machining processes. J. Clean. Prod. 2018, 170, 694–703. [Google Scholar] [CrossRef]
- Badurdeen, F.; Shuaib, M.A.; Lu, T.; Jawahir, I.S. Sustainable Value Creation in Manufacturing at Product and Process Levels: A Metrics-based Evaluation. In Handbook of Manufacturing Engineering and Technology, 1st ed.; Nee, A., Ed.; Springer: London, UK, 2014; pp. 1–28. [Google Scholar]
- Peralta, M.E.; Bárcena, M.M.; González, F.A. On the sustainability of machining processes. Proposal for a unified framework through the triple bottom-line from an understanding review. J. Clean. Prod. 2017, 142, 3890–3904. [Google Scholar] [CrossRef]
- Jamil, M.; Zhao, W.; He, N.; Gupta, M.K.; Sarikaya, M.; Khan, A.M.; Sanjay, M.R.; Siengchin, S.; Pimenov, D.Y. Sustainable milling of Ti-6Al-4V: A trade-off between energy efficiency, carbon emissions and machining characteristics under MQL and cryogenic environment. J. Clean. Prod. 2021, 281, 125374. [Google Scholar] [CrossRef]
- Bork, C.A.S.; de Sousa, J.F.; de Oliveira Gomes, J.; Canhete, V.V.P.; de Barba, D.J., Jr. Methodological tools for assessing the sustainability index (SI) of industrial production processes. Int. J. Adv. Manuf. Technol. 2016, 87, 1313–1325. [Google Scholar] [CrossRef]
- Jawahir, I.S.; Wanigarthne, P.C.; Wang, X. Product Design and Manufacturing Processes for Sustainability. In Mechanical Engineers’ Handbook; John Wiley and Sons, Inc.: Hoboken, NJ, USA, 2015; Volume 2, p. 177. [Google Scholar]
- Gholami, H.; Mat Saman, M.Z.; Sharif, S.; Md Khudzari, J.; Zakuan, N.; Streimikiene, D.; Streimikis, J. A general framework for sustainability assessment of sheet metalworking processes. Sustainability 2020, 12, 4957. [Google Scholar] [CrossRef]
- Singh, R.K.; Murty, H.R.; Gupta, S.K.; Dikshit, A.K. An overview of sustainability assessment methodologies. Ecol. Indic. 2009, 9, 189–212. [Google Scholar] [CrossRef]
- Najiha, M.S.; Rahman, M.M.; Kadirgama, K. Performance of water-based TiO2 nanofluid during the minimum quantity lubrication machining of aluminium alloy, AA6061-T6. J. Clean. Prod. 2016, 135, 1623–1636. [Google Scholar] [CrossRef] [Green Version]
- Kim, D.B.; Leong, S.; Chen, C.S. An Overview of Sustainability Indicators and Metrics for Discrete Part Manufacturing. In Proceedings of the ASME 2012 International Design Engineering Technical Conference & Computers and Information in Engineering Conference IDETC/CIE 2012, Chicago, IL, USA, 12–15 August 2012. [Google Scholar]
- Feng, S.C.; Joung, C.; Li, G. Development Overview of Sustainable Manufacturing Metrics. In Proceedings of the 17th CIRP International Conference of Life Cycle Engineering, Hefei, China, 19–21 May 2010. [Google Scholar]
- Wang, Q.; Liu, F.; Li, C. An integrated method for assessing the energy efficiency of machining workshop. J. Clean. Prod. 2013, 52, 122–133. [Google Scholar] [CrossRef]
- Bhat, P.; Agrawal, C.; Khanna, N. Development of a sustainability assessment algorithm and its validation using case studies on cryogenic machining. J. Manuf. Mater. Process. 2020, 4, 42. [Google Scholar] [CrossRef]
- Sihag, N.; Sangwan, K.S. Development of a sustainability assessment index for machine tools. Procedia CIRP 2019, 80, 156–161. [Google Scholar] [CrossRef]
- Kaldas, O.; Shihata, L.A.; Kiefer, J. An index-based sustainability assessment framework for manufacturing organizations. Procedia CIRP 2020, 97, 235–240. [Google Scholar] [CrossRef]
- Younas, M.; Jaffery, S.H.I.; Khan, M.; Khan, M.A.; Ahmad, R.; Mubashar, A.; Ali, L. Multi-objective optimization for sustainable turning Ti6Al4V alloy using grey relational analysis (GRA) based on analytic hierarchy process (AHP). Int. J. Adv. Manuf. Technol. 2019, 105, 1175–1188. [Google Scholar] [CrossRef]
- Radovanović, M.R. Performances of abrasive water jet cutting with hyper pressure. Int. J. Modeling Optim. 2017, 7, 275–279. [Google Scholar] [CrossRef] [Green Version]
- Schwartzentruber, J.; Spelt, J.K.; Papini, M. Modeling of delamination due to hydraulic shock when piercing anisotropic carbon-fiber laminates using an abrasive waterjet. Int. J. Mach. Tools Manuf. 2018, 132, 81–95. [Google Scholar] [CrossRef]
- Pi, V.N.; Hoogstrate, A.M. Cost calculation for recycled abrasives and for abrasive selecting in abrasive waterjet machining. Int. J. Precis. Mach. 2007, 1, 40–54. [Google Scholar] [CrossRef]
- Radovanović, M. Cost optimization of abrasive water jet cutting using GA. Tribol. J. BULTRIB 2013, 3, 70–75. [Google Scholar]
- Yan, J.; Li, L. Multi-objective optimization of milling parameters—the trade-offs between energy, production rate and cutting quality. J. Clean. Prod. 2013, 52, 462–471. [Google Scholar] [CrossRef]


| Machining Parameters | Levels |
|---|---|
| Pressure (MPa) | 150, 300 |
| Traverse speed (mm/min) | 200, 400, 600 |
| Abrasive mass flow rate (g/s) | 0.5, 1, 2, 5, 8 |
| Stand-off distance (mm) | 3 |
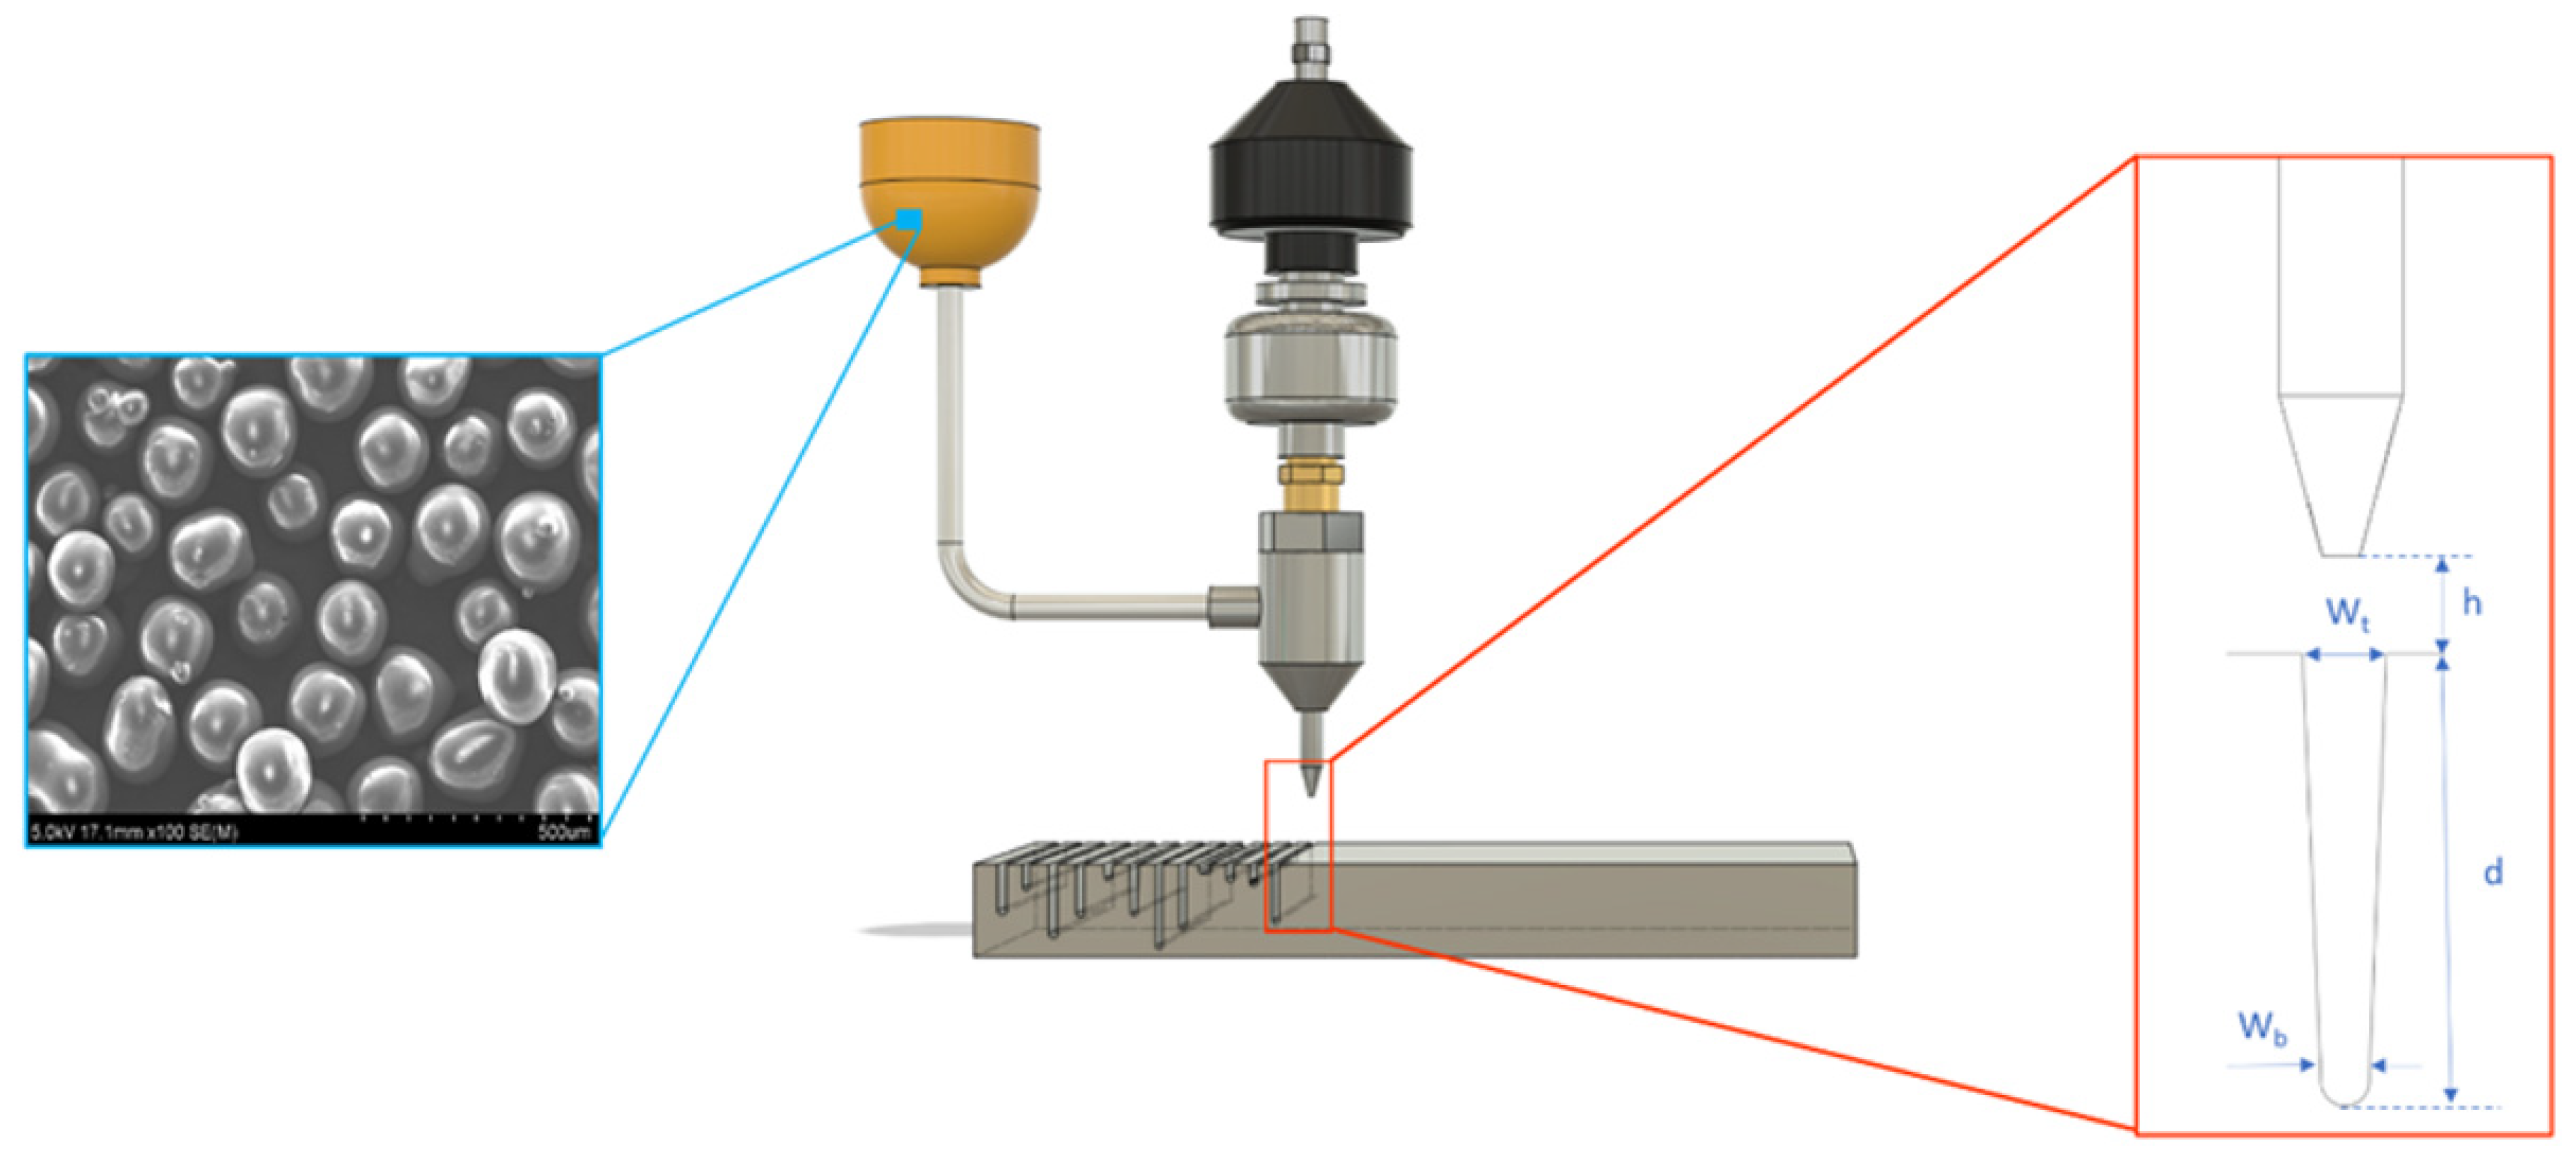
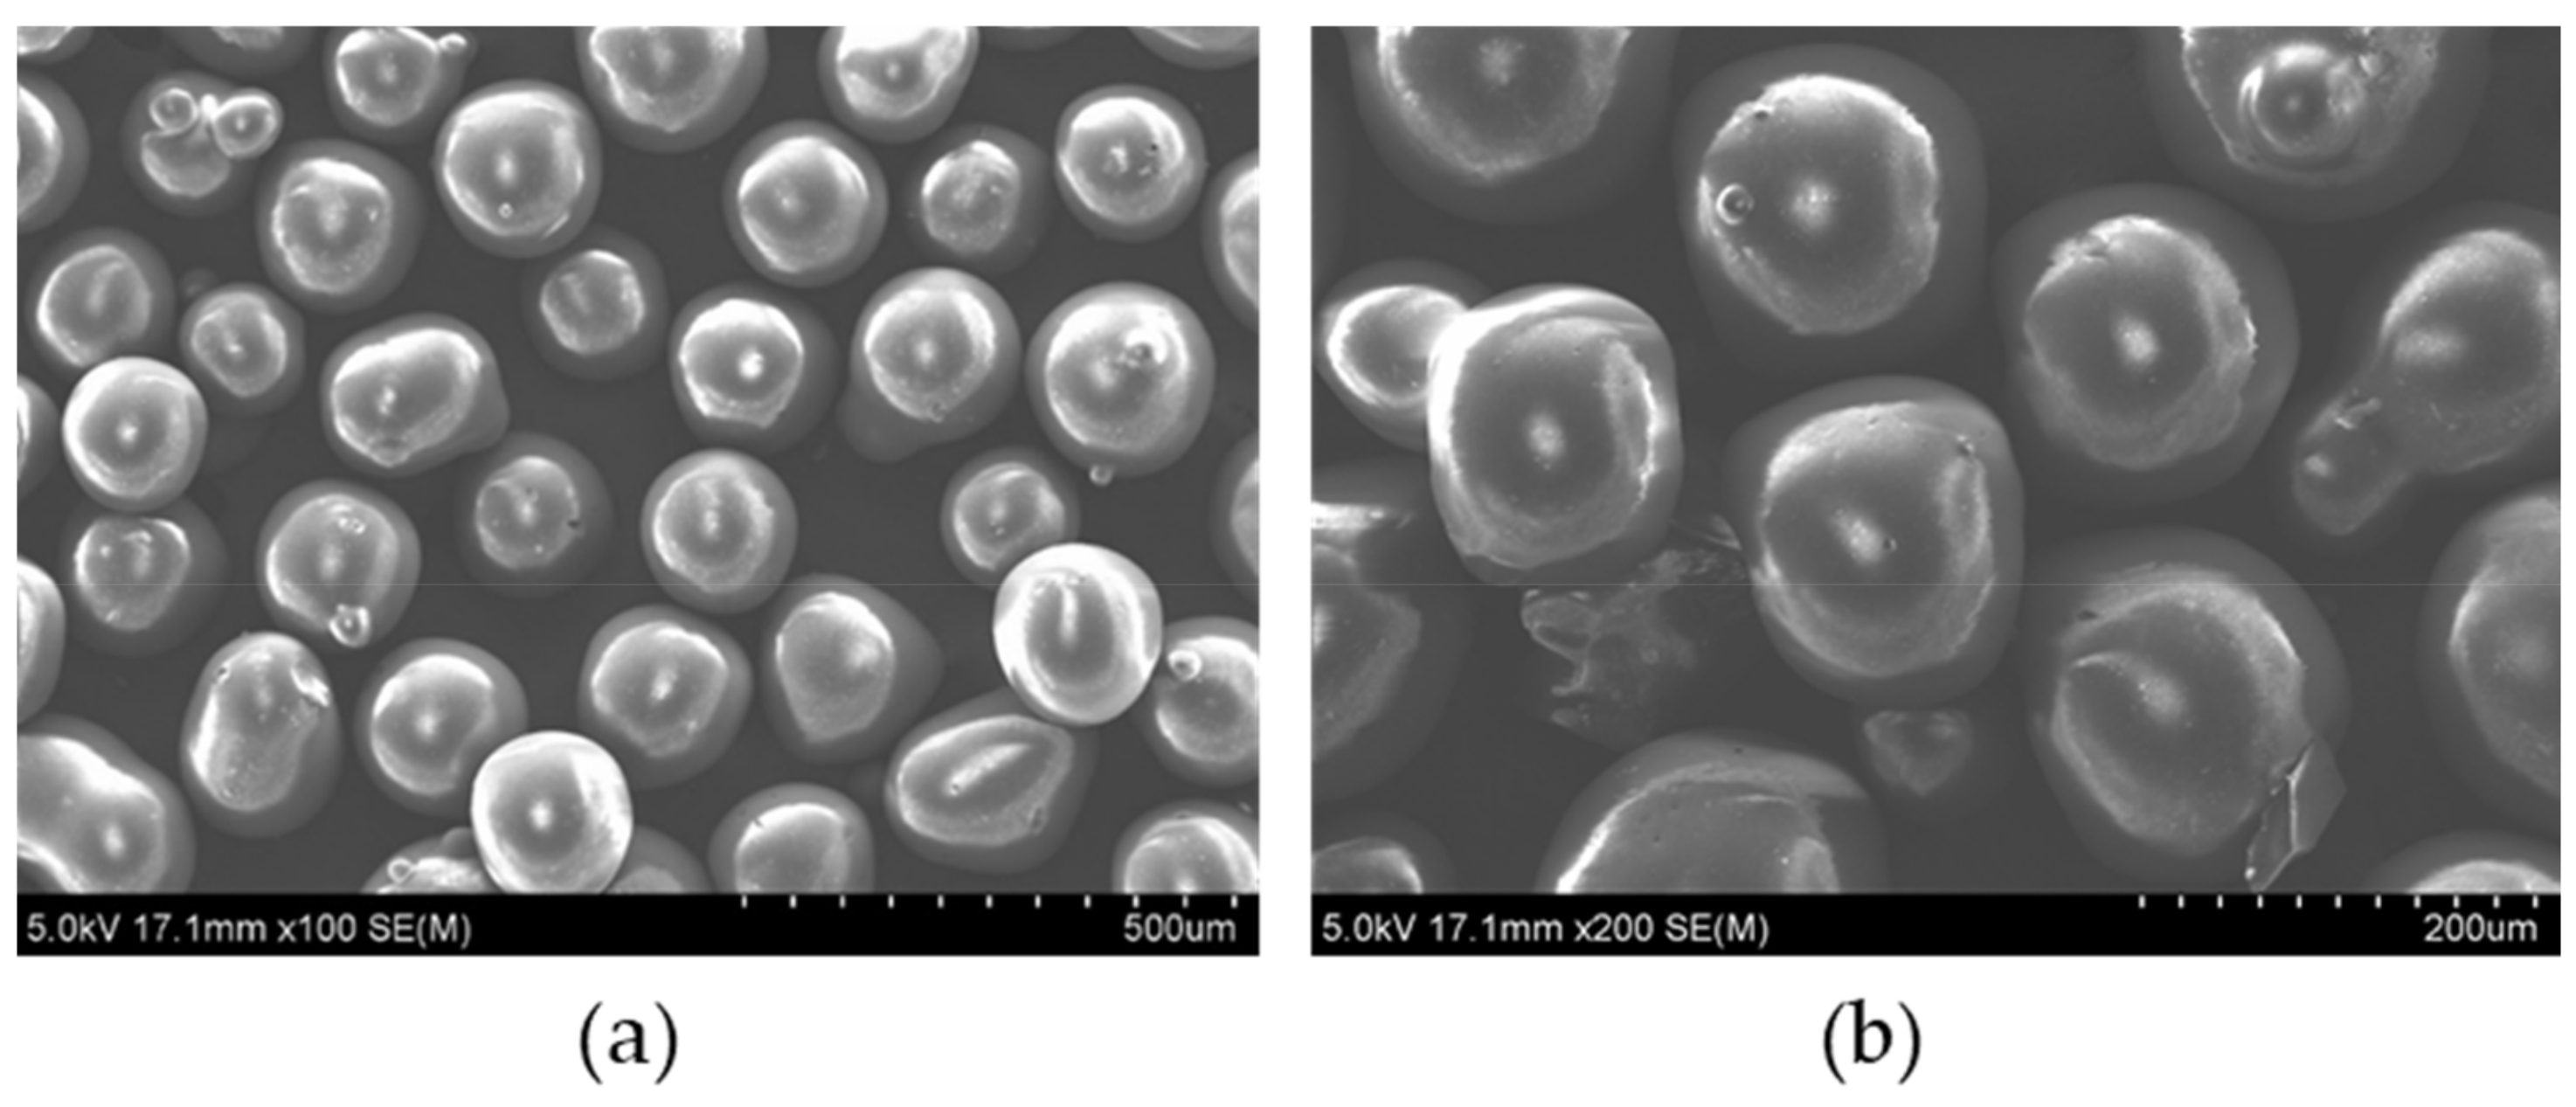
| Type of abrasive | glass beads |
| Ti | Al | V | C | O | N | H | Fe |
|---|---|---|---|---|---|---|---|
| 90 | 6 | 4 | 0.1 | 0.2 | 0.05 | 0.0125 | 0.3 |
| SiO2 | Na2O | CaO | MgO | Al2O3 | Fe2O3 | TiO2 |
|---|---|---|---|---|---|---|
| 70–73 | 13–15 | 7–11 | 3–5 | 0.5–2 | 0.1 | 0.1 |
| No. | vt (mm/min) | ma (g/s) | p (MPa) | d (mm) | σd (mm) | W (mm) | σw (mm) | a (deg) | σa (deg) |
|---|---|---|---|---|---|---|---|---|---|
| 1 | 200 | 0.5 | 150 | 0.693 | 0.012 | 1.192 | 0.025 | 10.518 | 1.049 |
| 2 | 400 | 0.5 | 150 | 0.509 | 0.005 | 1.146 | 0.007 | 15.027 | 0.422 |
| 3 | 600 | 0.5 | 150 | 0.377 | 0.003 | 1.102 | 0.023 | 14.089 | 1.751 |
| 4 | 200 | 1.0 | 150 | 0.801 | 0.002 | 1.170 | 0.011 | 8.358 | 0.394 |
| 5 | 400 | 1.0 | 150 | 0.573 | 0.003 | 1.181 | 0.031 | 10.282 | 1.549 |
| 6 | 600 | 1.0 | 150 | 0.436 | 0.001 | 1.125 | 0.039 | 20.685 | 2.560 |
| 7 | 200 | 2.0 | 150 | 0.831 | 0.003 | 1.158 | 0.034 | 7.458 | 1.172 |
| 8 | 400 | 2.0 | 150 | 0.604 | 0.001 | 1.152 | 0.028 | 10.098 | 1.329 |
| 9 | 600 | 2.0 | 150 | 0.539 | 0.001 | 1.135 | 0.025 | 9.738 | 1.329 |
| 10 | 200 | 4.0 | 150 | 0.999 | 0.005 | 1.236 | 0.034 | 7.997 | 0.976 |
| 11 | 400 | 4.0 | 150 | 0.657 | 0.003 | 1.175 | 0.010 | 9.598 | 0.438 |
| 12 | 600 | 4.0 | 150 | 0.588 | 0.002 | 1.295 | 0.025 | 15.951 | 1.219 |
| 13 | 200 | 8.0 | 150 | 1.112 | 0.003 | 1.345 | 0.027 | 10.142 | 0.696 |
| 14 | 400 | 8.0 | 150 | 0.683 | 0.004 | 1.259 | 0.015 | 10.663 | 0.632 |
| 15 | 600 | 8.0 | 150 | 0.572 | 0.001 | 1.254 | 0.023 | 14.208 | 1.151 |
| 16 | 200 | 0.5 | 300 | 2.605 | 0.005 | 1.286 | 0.025 | 4.8603 | 0.275 |
| 17 | 400 | 0.5 | 300 | 1.212 | 0.009 | 1.263 | 0.018 | 6.889 | 0.429 |
| 18 | 600 | 0.5 | 300 | 0.925 | 0.006 | 1.253 | 0.010 | 7.816 | 0.314 |
| 19 | 200 | 1.0 | 300 | 3.519 | 0.005 | 1.334 | 0.053 | 3.083 | 0.431 |
| 20 | 400 | 1.0 | 300 | 1.785 | 0.003 | 1.270 | 0.028 | 6.320 | 0.450 |
| 21 | 600 | 1.0 | 300 | 1.103 | 0.002 | 1.256 | 0.011 | 7.800 | 0.286 |
| 22 | 200 | 2.0 | 300 | 4.112 | 0.020 | 1.327 | 0.039 | 2.214 | 0.272 |
| 23 | 400 | 2.0 | 300 | 2.027 | 0.003 | 1.200 | 0.022 | 4.907 | 0.311 |
| 24 | 600 | 2.0 | 300 | 1.294 | 0.001 | 1.222 | 0.018 | 7.033 | 0.399 |
| 25 | 200 | 4.0 | 300 | 7.014 | 0.044 | 1.272 | 0.031 | 0.887 | 0.127 |
| 26 | 400 | 4.0 | 300 | 3.212 | 0.004 | 1.275 | 0.013 | 4.319 | 0.116 |
| 27 | 600 | 4.0 | 300 | 1.773 | 0.004 | 1.266 | 0.029 | 4.947 | 0.469 |
| 28 | 200 | 8.0 | 300 | 8.185 | 0.009 | 1.375 | 0.059 | 1.526 | 0.207 |
| 29 | 400 | 8.0 | 300 | 3.901 | 0.008 | 1.335 | 0.021 | 4.247 | 0.154 |
| 30 | 600 | 8.0 | 300 | 1.982 | 0.004 | 1.261 | 0.025 | 4.525 | 0.362 |
| No. | W (mm) | a (deg) | MRR (mm3/s) | Pw (W) | cabr (g) | cwat (L) | Cost (€) |
|---|---|---|---|---|---|---|---|
| 1 | 1.192 | 10.518 | 2.458 | 3658.683 | 9 | 0.439 | 0.088 |
| 2 | 1.146 | 15.027 | 3.429 | 3658.683 | 4.5 | 0.220 | 0.046 |
| 3 | 1.102 | 14.089 | 3.799 | 3658.683 | 3 | 0.146 | 0.031 |
| 4 | 1.170 | 8.358 | 2.810 | 3658.683 | 18 | 0.439 | 0.125 |
| 5 | 1.181 | 10.282 | 4.116 | 3658.683 | 9 | 0.220 | 0.065 |
| 6 | 1.125 | 20.685 | 4.191 | 3658.683 | 6 | 0.146 | 0.043 |
| 7 | 1.158 | 7.458 | 2.907 | 3658.683 | 36 | 0.439 | 0.197 |
| 8 | 1.152 | 10.098 | 4.205 | 3658.683 | 18 | 0.220 | 0.101 |
| 9 | 1.135 | 9.738 | 5.616 | 3658.683 | 12 | 0.146 | 0.069 |
| 10 | 1.236 | 7.997 | 3.647 | 3658.683 | 90 | 0.439 | 0.416 |
| 11 | 1.175 | 9.598 | 4.661 | 3658.683 | 45 | 0.220 | 0.210 |
| 12 | 1.295 | 15.951 | 6.036 | 3658.683 | 30 | 0.146 | 0.142 |
| 13 | 1.345 | 10.142 | 4.249 | 3658.683 | 144 | 0.439 | 0.634 |
| 14 | 1.259 | 10.663 | 5.146 | 3658.683 | 72 | 0.220 | 0.319 |
| 15 | 1.254 | 14.208 | 6.345 | 3658.683 | 48 | 0.146 | 0.214 |
| 16 | 1.286 | 4.8603 | 9.246 | 10,348.320 | 9 | 0.621 | 0.116 |
| 17 | 1.263 | 6.889 | 9.019 | 10,348.320 | 4.5 | 0.310 | 0.058 |
| 18 | 1.253 | 7.816 | 10.422 | 10,348.320 | 3 | 0.207 | 0.040 |
| 19 | 1.334 | 3.083 | 13.427 | 10,348.320 | 18 | 0.621 | 0.167 |
| 20 | 1.270 | 6.320 | 12.759 | 10,348.320 | 9 | 0.310 | 0.082 |
| 21 | 1.256 | 7.800 | 12.194 | 10,348.320 | 6 | 0.207 | 0.054 |
| 22 | 1.327 | 2.214 | 16.010 | 10,348.320 | 36 | 0.621 | 0.248 |
| 23 | 1.200 | 4.907 | 13.859 | 10,348.320 | 18 | 0.310 | 0.120 |
| 24 | 1.222 | 7.033 | 13.744 | 10,348.320 | 12 | 0.207 | 0.080 |
| 25 | 1.272 | 0.887 | 27.202 | 10,348.320 | 90 | 0.621 | 0.504 |
| 26 | 1.275 | 4.319 | 22.114 | 10,348.320 | 45 | 0.310 | 0.243 |
| 27 | 1.266 | 4.947 | 19.735 | 10,348.320 | 30 | 0.207 | 0.159 |
| 28 | 1.375 | 1.526 | 31.564 | 10,348.320 | 144 | 0.621 | 0.736 |
| 29 | 1.335 | 4.247 | 27.185 | 10,348.320 | 72 | 0.310 | 0.360 |
| 30 | 1.261 | 4.525 | 21.873 | 10,348.320 | 48 | 0.207 | 0.234 |
Publisher’s Note: MDPI stays neutral with regard to jurisdictional claims in published maps and institutional affiliations. |
© 2021 by the authors. Licensee MDPI, Basel, Switzerland. This article is an open access article distributed under the terms and conditions of the Creative Commons Attribution (CC BY) license (https://creativecommons.org/licenses/by/4.0/).
Share and Cite
E. Karkalos, N.; Karmiris-Obratański, P.; Kudelski, R.; Markopoulos, A.P. Experimental Study on the Sustainability Assessment of AWJ Machining of Ti-6Al-4V Using Glass Beads Abrasive Particles. Sustainability 2021, 13, 8917. https://0-doi-org.brum.beds.ac.uk/10.3390/su13168917
E. Karkalos N, Karmiris-Obratański P, Kudelski R, Markopoulos AP. Experimental Study on the Sustainability Assessment of AWJ Machining of Ti-6Al-4V Using Glass Beads Abrasive Particles. Sustainability. 2021; 13(16):8917. https://0-doi-org.brum.beds.ac.uk/10.3390/su13168917
Chicago/Turabian StyleE. Karkalos, Nikolaos, Panagiotis Karmiris-Obratański, Rafał Kudelski, and Angelos P. Markopoulos. 2021. "Experimental Study on the Sustainability Assessment of AWJ Machining of Ti-6Al-4V Using Glass Beads Abrasive Particles" Sustainability 13, no. 16: 8917. https://0-doi-org.brum.beds.ac.uk/10.3390/su13168917