Article

Gorilla Troops Optimizer for Electrically Based Single and Double-Diode Models of Solar Photovoltaic Systems

1
Electrical Engineering Department, Faculty of Engineering, Suez University, Suez 43533, Egypt
2
Electrical Engineering Department, College of Engineering, Taif University, Taif 21944, Saudi Arabia
3
Electrical Engineering Department, Faculty of Engineering, Damietta University, Damietta 34517, Egypt
4
Electrical Engineering Department, Faculty of Engineering, Kafrelsheikh University, Kafrelsheikh 33516, Egypt
5
Electrical Power and Machines Department, Faculty of Engineering, Zagazig University, Zagazig 44519, Egypt
*
Author to whom correspondence should be addressed.
Sustainability 2021, 13(16), 9459; https://0-doi-org.brum.beds.ac.uk/10.3390/su13169459
Submission received: 2 August 2021 / Revised: 13 August 2021 / Accepted: 18 August 2021 / Published: 23 August 2021
(This article belongs to the Special Issue Advanced Renewable Energy for Sustainability)

Abstract

:
The extraction of parameters of solar photovoltaic generating systems is a difficult problem because of the complex nonlinear variables of current-voltage and power-voltage. In this article, a new implementation of the Gorilla Troops Optimization (GTO) technique for parameter extraction of several PV models is created. GTO is inspired by gorilla group activities in which numerous strategies are imitated, including migration to an unknown area, moving to other gorillas, migration in the direction of a defined site, following the silverback, and competition for adult females. With numerical analyses of the Kyocera KC200GT PV and STM6-40/36 PV modules for the Single Diode (SD) and Double-Diode (DD), the validity of GTO is illustrated. Furthermore, the developed GTO is compared with the outcomes of recent algorithms in 2020, which are Forensic-Based Investigation Optimizer, Equilibrium Optimizer, Jellyfish Search Optimizer, HEAP Optimizer, Marine Predator Algorithm, and an upgraded MPA. GTO’s efficacy and superiority are expressed by calculating the standard deviations of the fitness values, which indicates that the SD and DD models are smaller than 1E−16, and 1E−6, respectively. In addition, validation of GTO for the KC200GT module is demonstrated with diverse irradiations and temperatures where great closeness between the emulated and experimental P-V and I-V curves is achieved under various operating conditions (temperatures and irradiations).

1. Introduction

Nowadays, it is obligatory for world governments to integrate renewable energy resources into electrical power networks because of the energy crisis, climate change, environmental concerns, and political challenges. The greener approach for humanity and the ecosystem is by using renewable energy [1]. The 17 Sustainable Development Goals (SDGs) developed by the United Nations traverse the sustainable path to the ecosystem [2]. SDG 7 maps energy sustainability to utilize various renewable energy sources such as solar, wind [3], biomass, hydro, and waves. Numerous countries have shifted their technologies toward renewable energy by fixing prices to decrease consumption per capita, becoming environmentally friendly, and reducing carbon dioxide emissions because of the variations of oil prices [4]. Although the installation costs of renewable energy are high, their running costs are low [5]. Among renewable energy resources, solar photovoltaic sources have been the most widely used and the most promising in alleviating energy challenges during the previous decade. Therefore, many academics recognize the need to focus on novel energy sources derived from solar cells and are intensifying research into them to maximize their utilization.
However, PV manufacturers may not include sufficient information in their data sheets to effectively replicate the characteristics of PVs, particularly under different environmental and operational conditions [6]. To address these issues, researchers have focused on parameter extraction of PVs from practical data and available data in data sheets. One of the most critical difficulties in assuring accurate modeling for the greatest performance operation and efficiency of PV technologies is parameter extraction of PVs. The accurate parameter estimation can properly characterize the nonlinear current-voltage (I–V) properties of solar cells, which are important in PV simulation, assessment, and maximum power extraction from PV systems [7,8]. Among the several extant models in the literature the following stand out: Single-Diode (SD) model [9], Double-Diode (DD) model [10], and Three-Diode (TD) model [11]. The SD model (SDM) is regarded as a reference model, and it is the most widely used because of the balance between ease of implementation and precision and the benefits of a reduced set of elements (five parameters). The DD model (DDM) is regarded as a seven-parameter model. Concerning the TD model, Khanna et al. [12] indicated that it is an appropriate platform despite its complication and the greater number of included factors (nine parameters).
Numerous approaches have been used to estimate parameters for solar PV systems. The first are analytical methods, which are distinguished by their ease of implementation at the expense of accuracy. In some situations, the main causes of significant errors in the estimated PV parameters are the values of selected points. Analytical methods depend mainly on the manufacturers’ data sheets, where the short-circuit current, open circuit voltage, and maximum power (current and voltage) needed to form I-V curves are the data inputs to the analytical techniques. To overcome these drawbacks, researchers adopted the numerical techniques that required taking into consideration all measured data on the I-V characteristic curve, and consequently achieved higher accuracy of the results and matched the estimated results with the measured. Numerical methods depend mainly on iterative numerical approaches that are used to resolve the problem by optimization algorithms. Finally, the researchers turned to metaheuristic methods for accurate and rapid solution achievement. Such methods are based on artificial intelligence optimization algorithms and can effectively overcome the nonlinearity and complexity of such problems.
To start with, analytical methods are easily applied; however, they are not accurate because their solutions depend on the selected initial points and the external environment. The parameters of the SDM were determined by neglection of the series and shunt resistances in [13]. The remaining three model parameters were derived under the assumption of the I-V curve. A Tandem Structure [14] was utilized with a 3-terminal measuring approach to extract the important solar sub-cell characteristics for the SDM. The parameters of crystalline PV modules, which are represented as an SDM, were extracted in [15] under any operating conditions using a straightforward manner based only on data sheet information. The second methods are numerical and are divided into deterministic or metaheuristic. The deterministic methods fall into local optimum if they deal with issues that include multiple local optima because they depend upon the initial values [16], while the metaheuristic methods do not rely on the initial value or the problem characteristics [17]. Therefore, several algorithms, in the following paragraphs, are used to cope with these issues.
For the SDM, many metaheuristics have been developed to extract PV parameters, such as Ant Lion Optimizer (ALO) [18], shuffled frog leaping algorithm [19], and an enhanced simplified swarm optimization [17]. In [20], per unit single diode with an explicit nonlinear model was illustrated, whereas a two-step linear least-squares technique with model equation intrinsic properties [21] was manifested to extract the PV electrical parameters of the SDM. In [22], a bacterial factorial optimization model was validated through comparisons between both the simulation and experimental results. In [23], the uncertainties of measurements were considered when using Simulated Annealing to develop the parameters estimation. Moreover, in [24] the new version of a wind-driven technique was presented to extract the PV parameters of the SDM considering various conditions of weather.
For the DDM of a PV cell, several techniques such as cat swarm optimization [25], improved shuffled complex evaluation model [26], a biography-based optimization [27], combined differential evolution/whale optimizer [28], particle swarm optimizer (PSO) [29], salp swarm algorithm [30], a self-adaptive ensemble-based differential evolution [31] algorithm, and an opposition-based Learning Modified Salp Swarm Algorithm [32] are presented for both SDMs and DDMs. An improved whale optimization algorithm was introduced in [33] to precisely capture the parameters of various forms of PV modules and two actual PV stations. A performance-guided JAYA (PGJAYA) algorithm was developed in [34] for extracting the variables of various PV models, where individual effectiveness in the entire population is measured through utilizing the probability. A hybrid algorithm of flower pollination and bee pollinator [35] was developed for the parameter extraction problem of PV SDMs and DDMs with different environmental conditions.
In [36], the photo-generated and current parallel resistance were computed mathematically, and the remainder parameters were optimized for the TD model using the sunflower optimization algorithm. Combining the computation and the Harris Hawk Optimization (HHO) algorithm was manifested in [7]. The technique computed four parameters using equations and the manufacture’s data sheet of PV modules, whereas the remaining five parameters were identified using the HHO algorithm. However, the triple phase teaching learning-based optimizer [37], coyote optimizer [38], and evolutionary shuffled frog leaping as used in [39] were characterized to assess the PV parameters of the SD, DD, and TD model modules. The interval branch and bound global optimization algorithms were developed to find the optimal extracted parameter of different electrical photovoltaic models in [40]. The ecosystem optimizer was developed for finding the extracted parameters for the triple diode model [41]. Extracting the PV parameter at low radiation was implemented with the Marine Predators Optimizer [42]. The elephant herd optimization algorithm was developed in [43] for finding the optimal models of the third generation of perovskite photovoltaic solar cells and its applications in energy pumping systems [44].
The abovementioned survey illustrated that excessive efforts have been made to estimate accurately and precisely the parameters for the PV module. Although the outcomes obtained from these optimizers are satisfactory, they still lack accuracy and reliability. Accordingly, an approach named Gorilla Troops Optimization (GTO) [45] is described in this paper for estimating these electrical parameters. This optimizer has few parameters to be adjusted and is simple to employ in engineering applications. Five strategies of GTO have been illustrated to explain the exploration and exploitation of the optimization process. The three strategies used in the exploration phase are: migration to an unidentified place, movement to other gorillas, and migration in the direction of an identified location. The two strategies used in the exploitation phase are: follow the silverback and competition for adult females.
Assessment of GTO quality was performed by measuring the experimental data sets with handling the parameters of three models. These models were operated with two sets of I-V data from the Kyocera KC200GT PV Module and the STM6-40/36 PV Module. These data sets were selected to assess the performances of diverse methods of parameter extraction. GTO was applied on these modules and compared with recent optimizers and other existing optimizers to illustrate its superiority and efficacy among these optimizers. As a result, the following points define the observed features of the paper:
  • Diverse recent optimizers were employed on the PV parameter extraction issue: the Forensic-Based Investigation Optimizer (FBI) [46], Equilibrium Optimizer (EO) [47], Jellyfish Search (JFS) Optimizer [48], HEAP Optimizer [49], Marine Predator (MPA) Algorithm [50], and an Enhanced MPA (EMPA) [50];
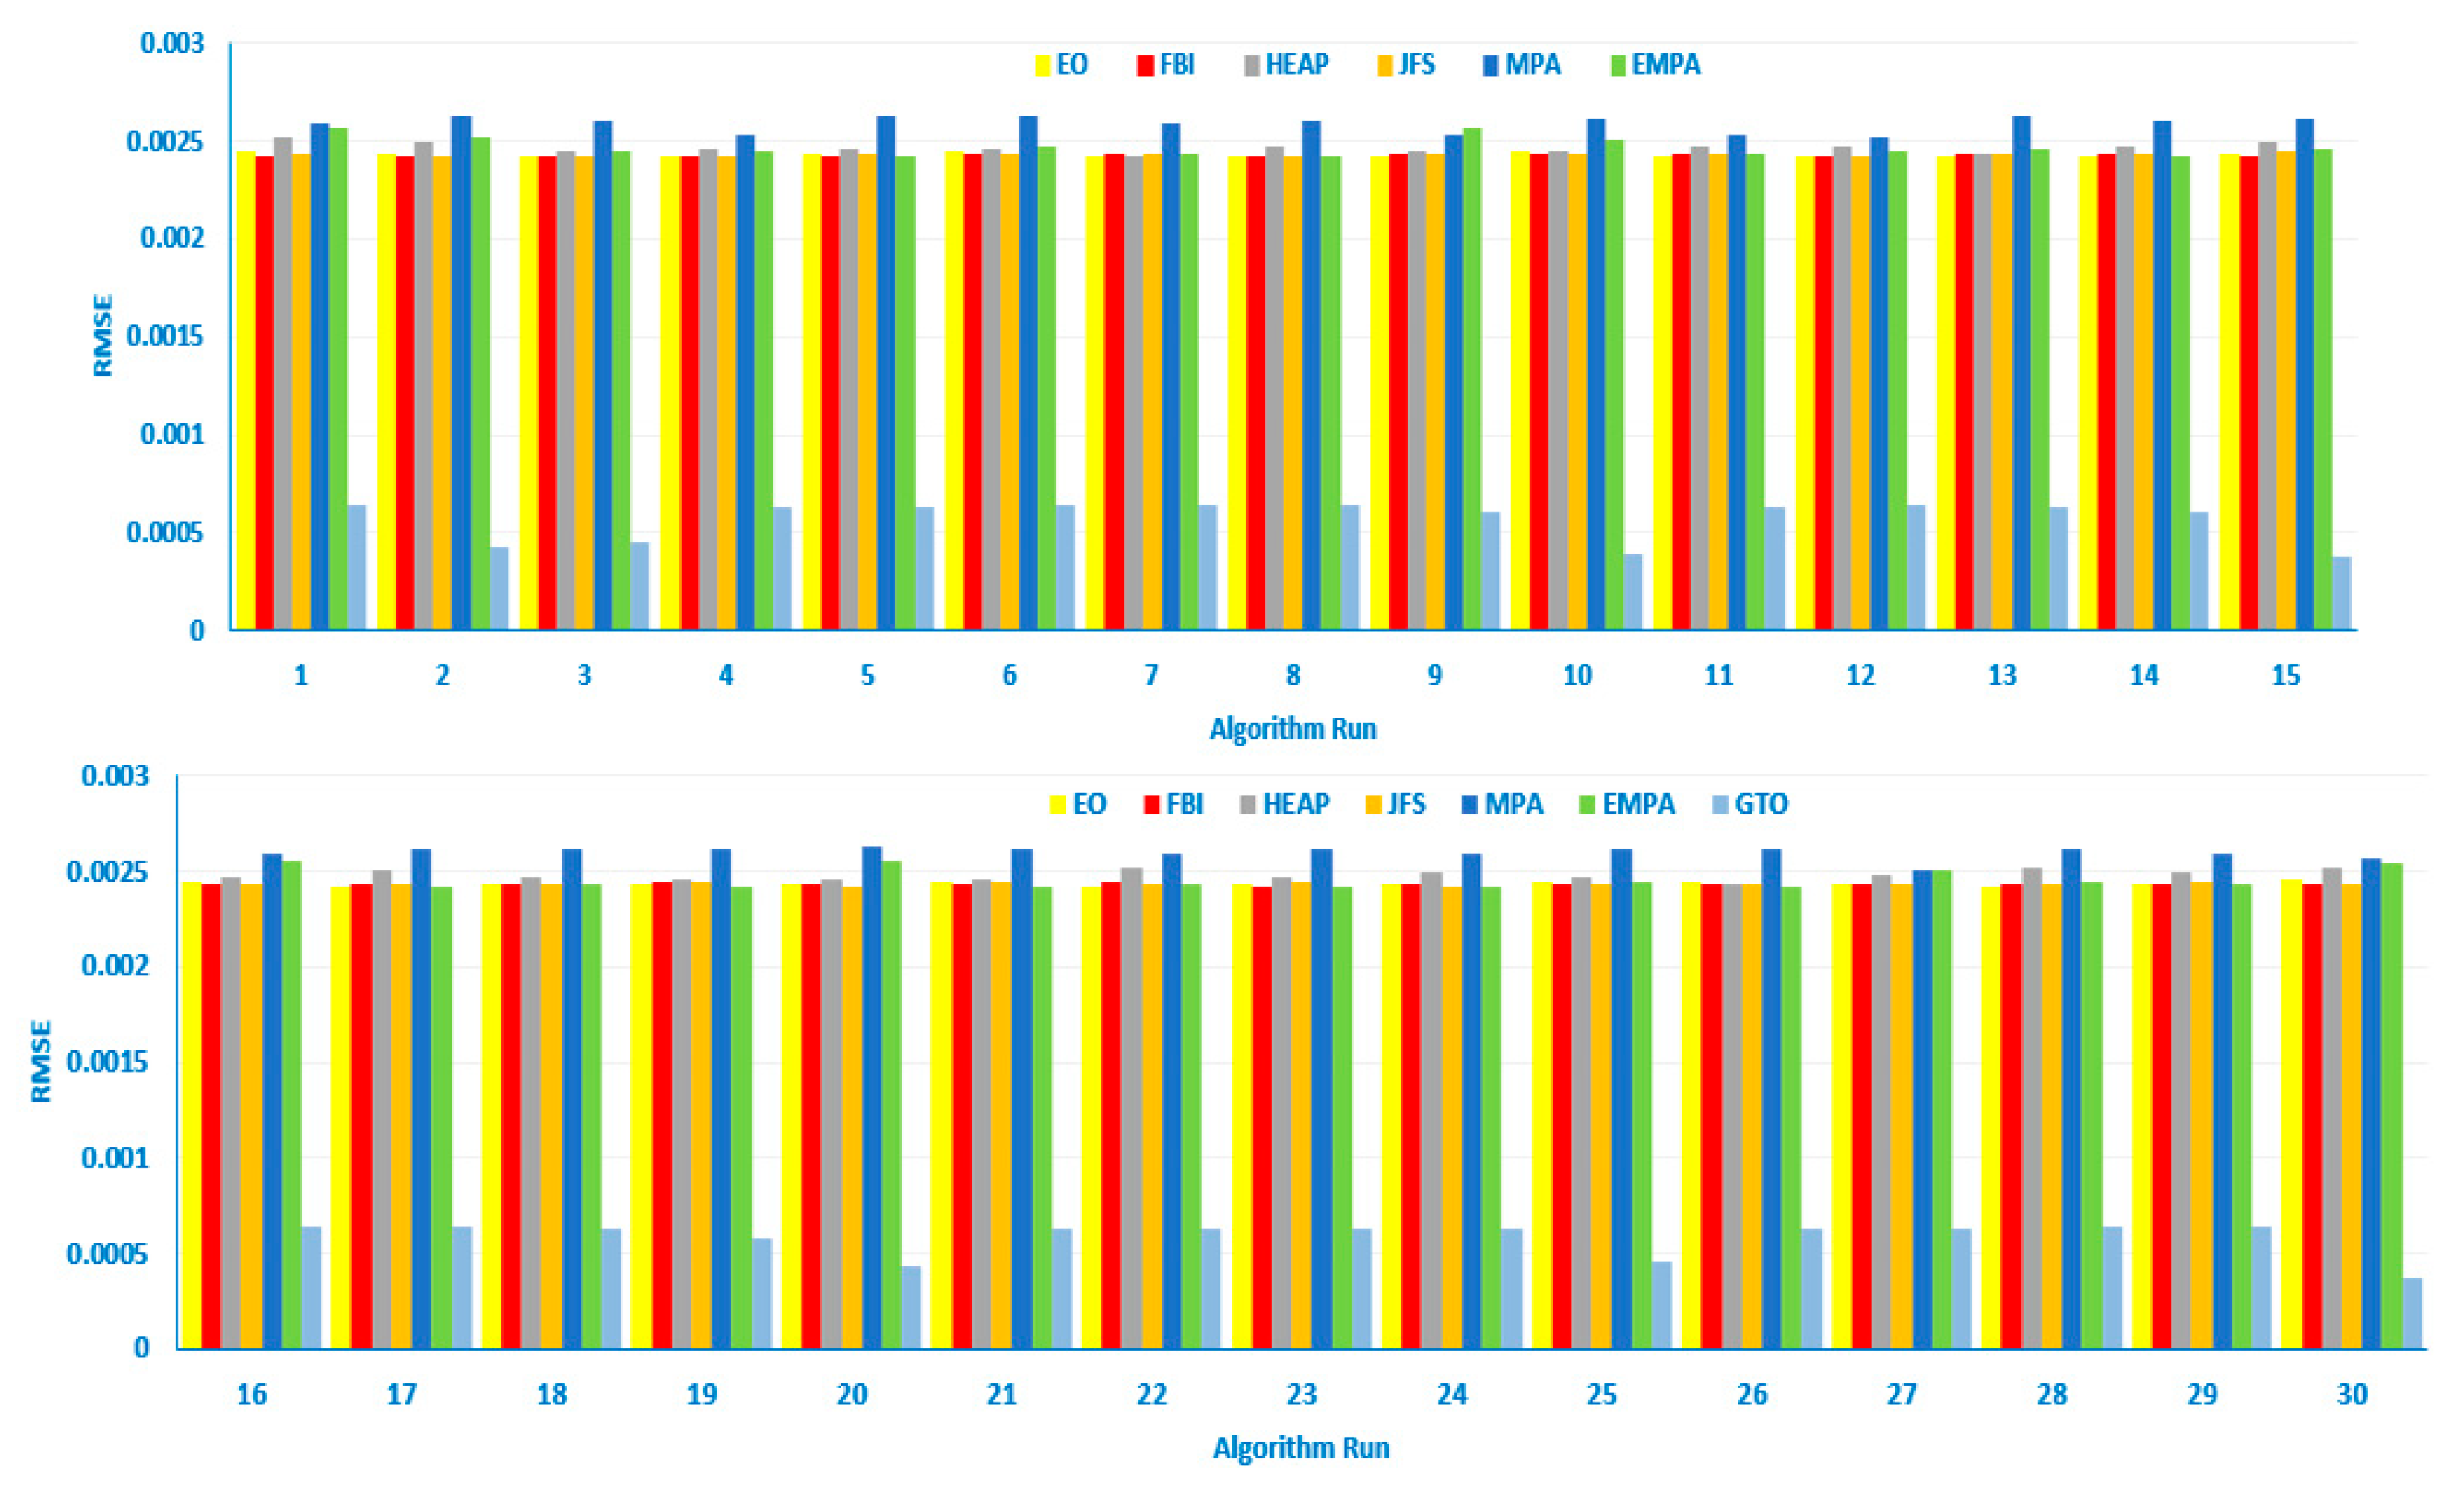
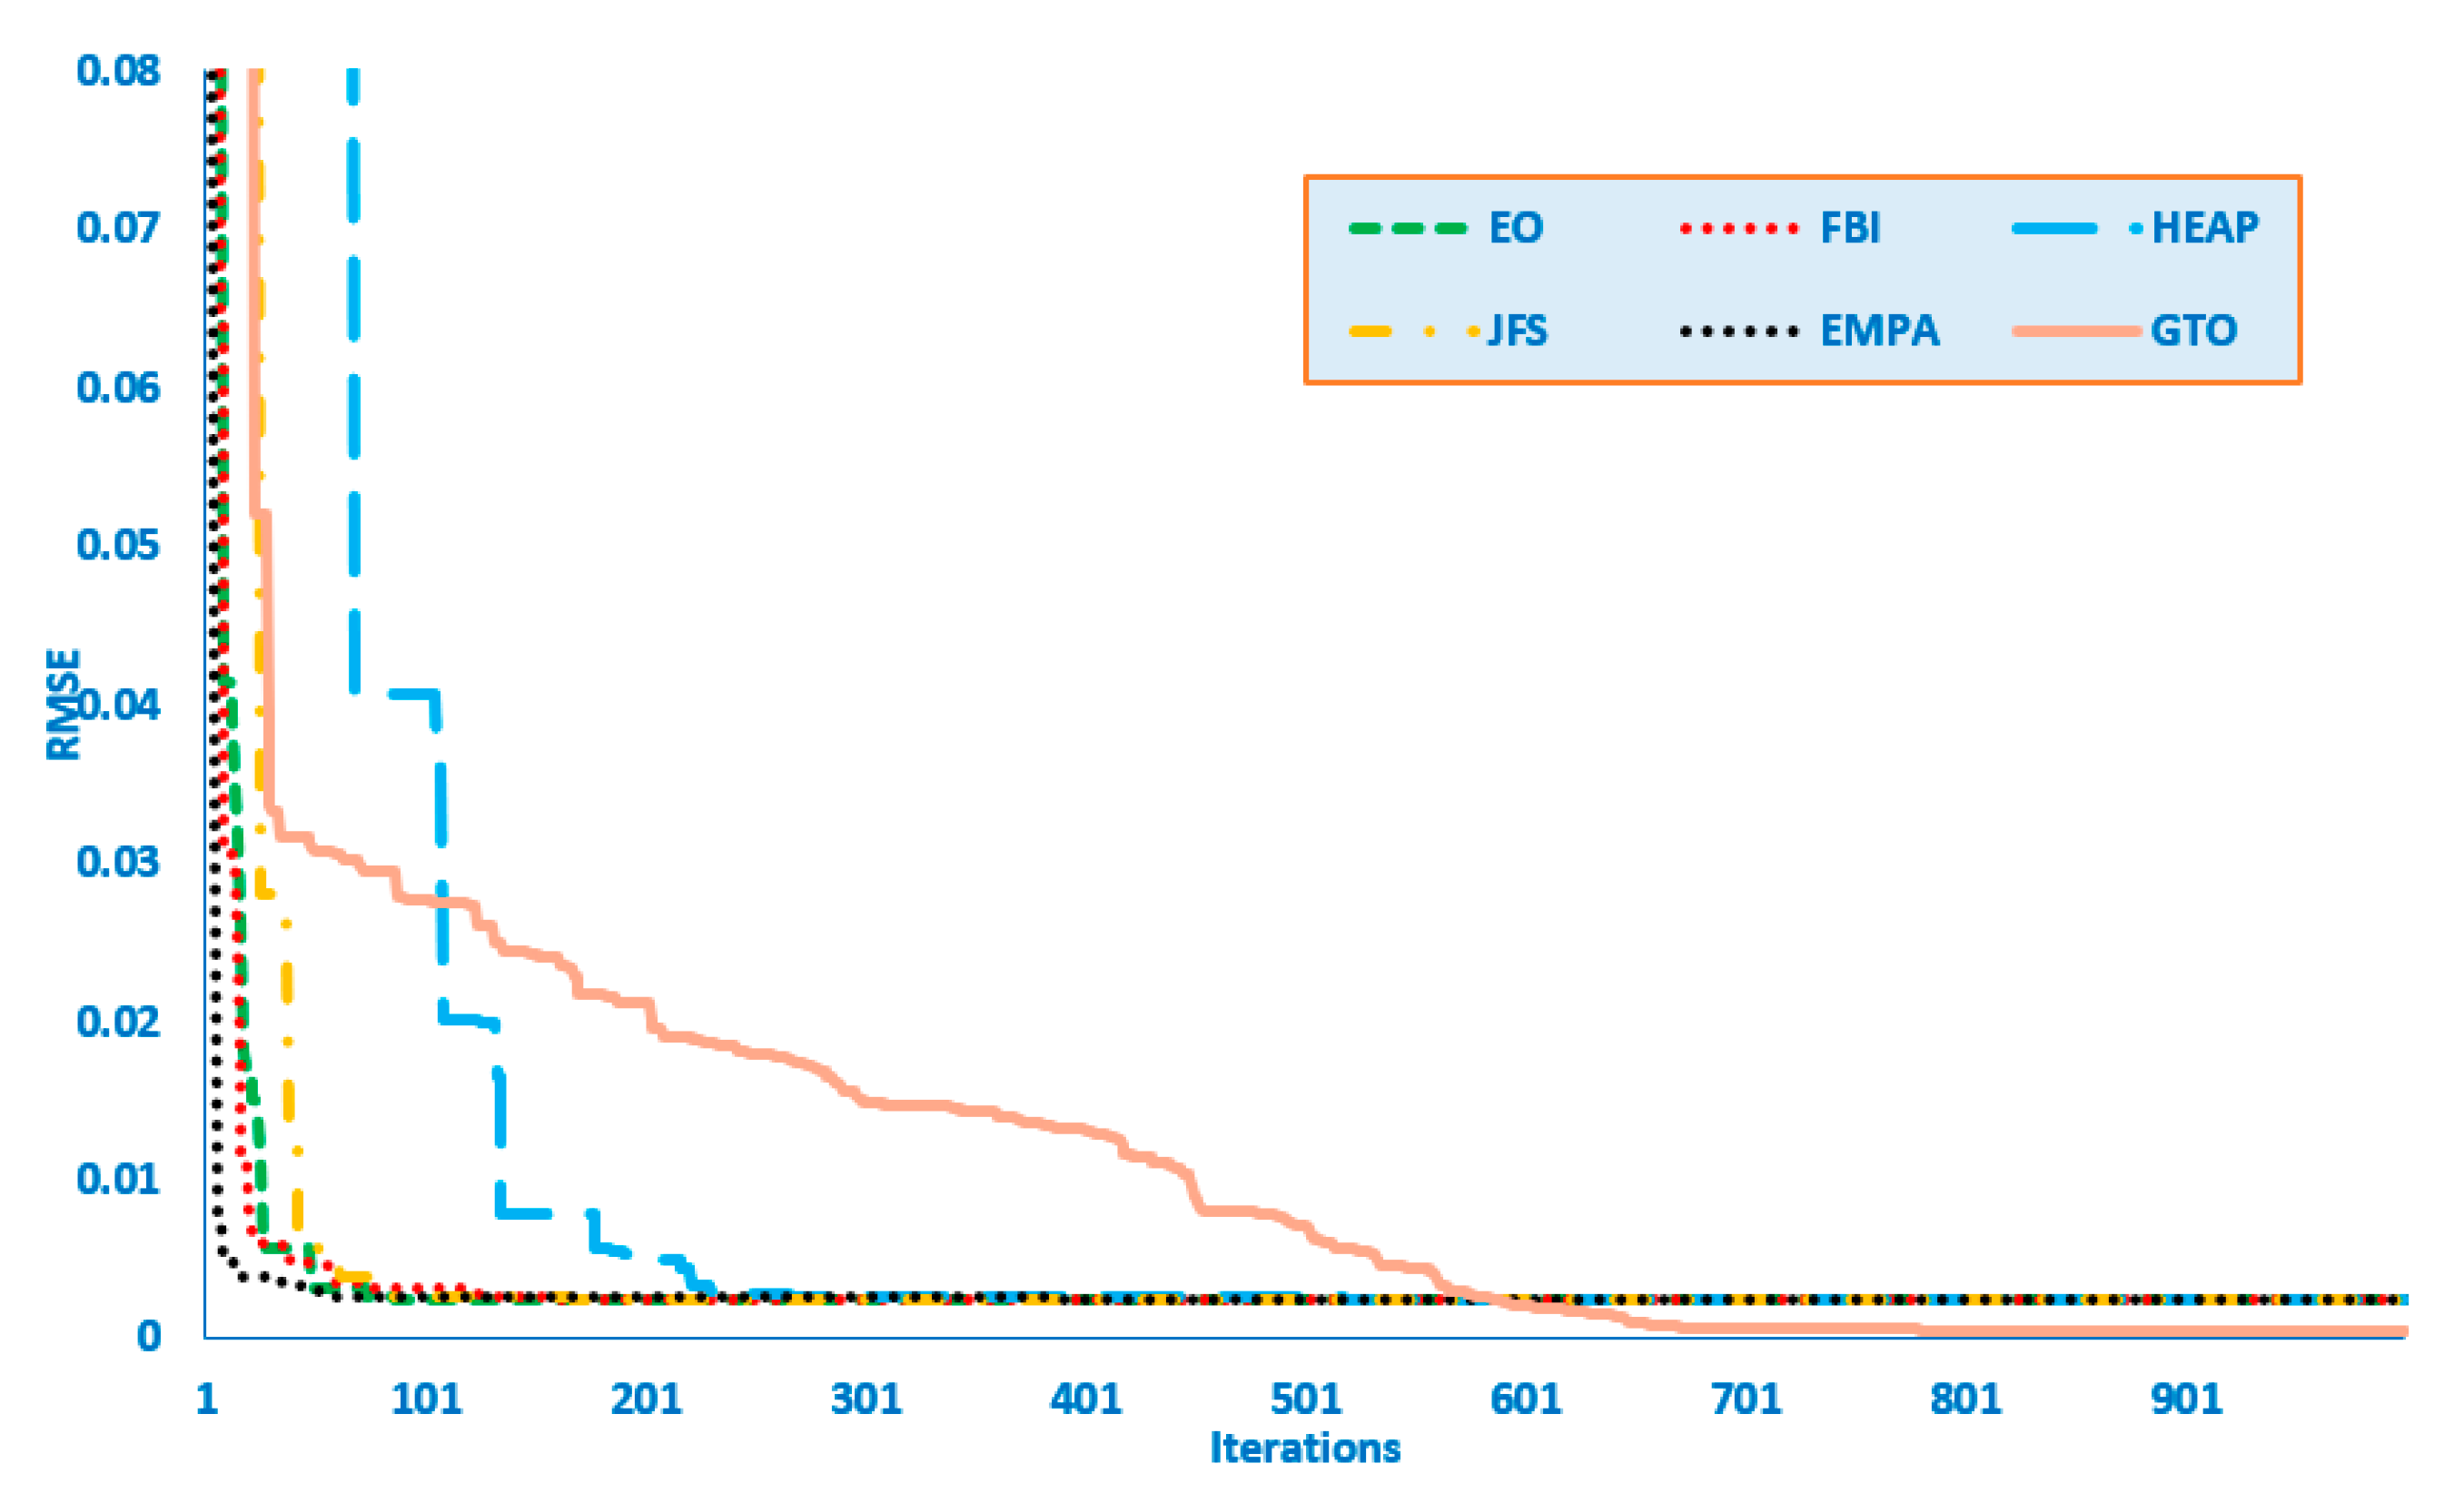
  • For SDMs and DDMs, the fitness value and convergence characteristics were examined to measure the GTO performance in comparison to other optimizers.
  • The efficacy of GTO was assessed with respect to diverse recent optimizers and other existing optimizers when employed on the SDMs and DDMs of various PV modules from the manufacturer’s datasheet;
  • The quality of GTO was evaluated through various experiments and statistical analyses, where the experimental results showed that the GTO technique had better or competitive performance in comparison to recently developed optimizers.
This paper is prepared in five sections: the mathematical formulation of the PV models is illustrated in Section 2, while the steps of GTO are characterized in Section 3. Section 4 explains and discusses the results obtained by GTO in comparison to the recently developed optimizers, whereas Section 5 presents concluding remarks to this article.

2. Problem Formulation

From basic construction of the PV solar cell, it can be thought of as a large diode that is subjected to sunshine [26]. Theoretically, the PV solar cell can be represented as an ideal photocurrent source in parallel with an ideal diode to describe the electrical behavior of ideal PV solar cells [51]. In these models, the produced current (I) of the PV module is evaluated from the module output voltage (V) and consequently the entire I−V characteristic curve can be obtained. This I−V characteristics curve is obtained at a certain temperature and irradiation, which are influenced on the I−V curve of the solar PV module.

2.1. Single-Diode Model

The SDM equivalent circuit is depicted in Figure 1 which represents the solar PV cell as the current source in parallel with an ideal single diode. The photocurrent (Iph) is the produced current from the PV depending on solar radiation at a certain ambient temperature. The series resistance (RS) is a lumped equivalent resistance in the path of the output current from the PV cell, which represents the electrode resistance, contact resistance, and material bulk resistance. The shunt resistance (RSh) simulates the leakage current across the PN junction that includes semiconductor non-ideality caused by a partial short-circuit channel toward the cell’s edges. The two lumped resistors manifest the losses. For a given solar irradiance and surrounding temperature, the I–V relationship of the equivalent SDM can be described as follows [28,52];
I = I p h I S 1 [ exp ( V + I R S η 1 V t h ) 1 ] V + I R S R s h
where (I) is the output current of the cell, while IPh, and IS1 are photocurrent and the diode reverse saturation current, respectively. Moreover, the thermal voltage and the diode ideality factor can be represented by Vth and η1, respectively. V, RS and RSh are the terminal voltage of the PV cell, the series resistance, and the shunt resistance, respectively. The constant Vth is calculated as follows:
V t h = K B T q
where KB indicates the Boltzmann’s constant. q and T are the electron’s charge and the absolute temperature, respectively.
From Equation (1), we see that five parameters need to be identified for the SDM, which are IPh, IS1, η1, Rsh and RS.

2.2. Double-Diode Model

Figure 2 shows the equivalent circuit of the DDM of the PV solar module, where diode D1 reflects the diffusion of minor carriers into the depletion layer, while D2 indicates the carrier recombination in the junction’s space charge area. Similar to the SDM, the I–V relationship can be represented as follows:
I = I P h I S 1 [ exp ( V + I R S η 1 V t h ) 1 ] I S 2 [ exp ( V + I R S η 2 V t h ) 1 ] V + I R S R s h
where IS2 is the reverse saturation current of D2, while η2 represents its ideality factor.
The DDM has an additional two variables in terms of the SDM that are IS2 and η2. Therefore, it involves seven unknown parameters: IPh, IS1, IS2, η1, η2, RP and RS.

2.3. Objective Function Formulation

To effectively use GTO in the PV parameter extraction problem, it is critical to first construct a suitable objective function. The major goal for parameter extraction of the two models (SD and DD) is to determine model parameters that minimize the differences between observed and calculated current. Essentially, the most correct set of parameter values should be somewhat greater or lower than the experimental values. In this respect, the widely accepted strategy for calculating the difference between the two I–V curves is established using the root mean square error (RMSE) [53]. Hence, the objective function can be determined as follows:
R M S E = 1 M j = 1 M ( I e x p j I c a l j ( V e x p j ,   x ) ) 2
where Iexpj and Vexpj illustrate the current and voltage values of jth experimental point, respectively, while M describes the number of empirical data points. The variable x indicates the decision parameters of the optimization problem. In contrast, the term (Icalj (Vexpj, x)) represents the computed current output.

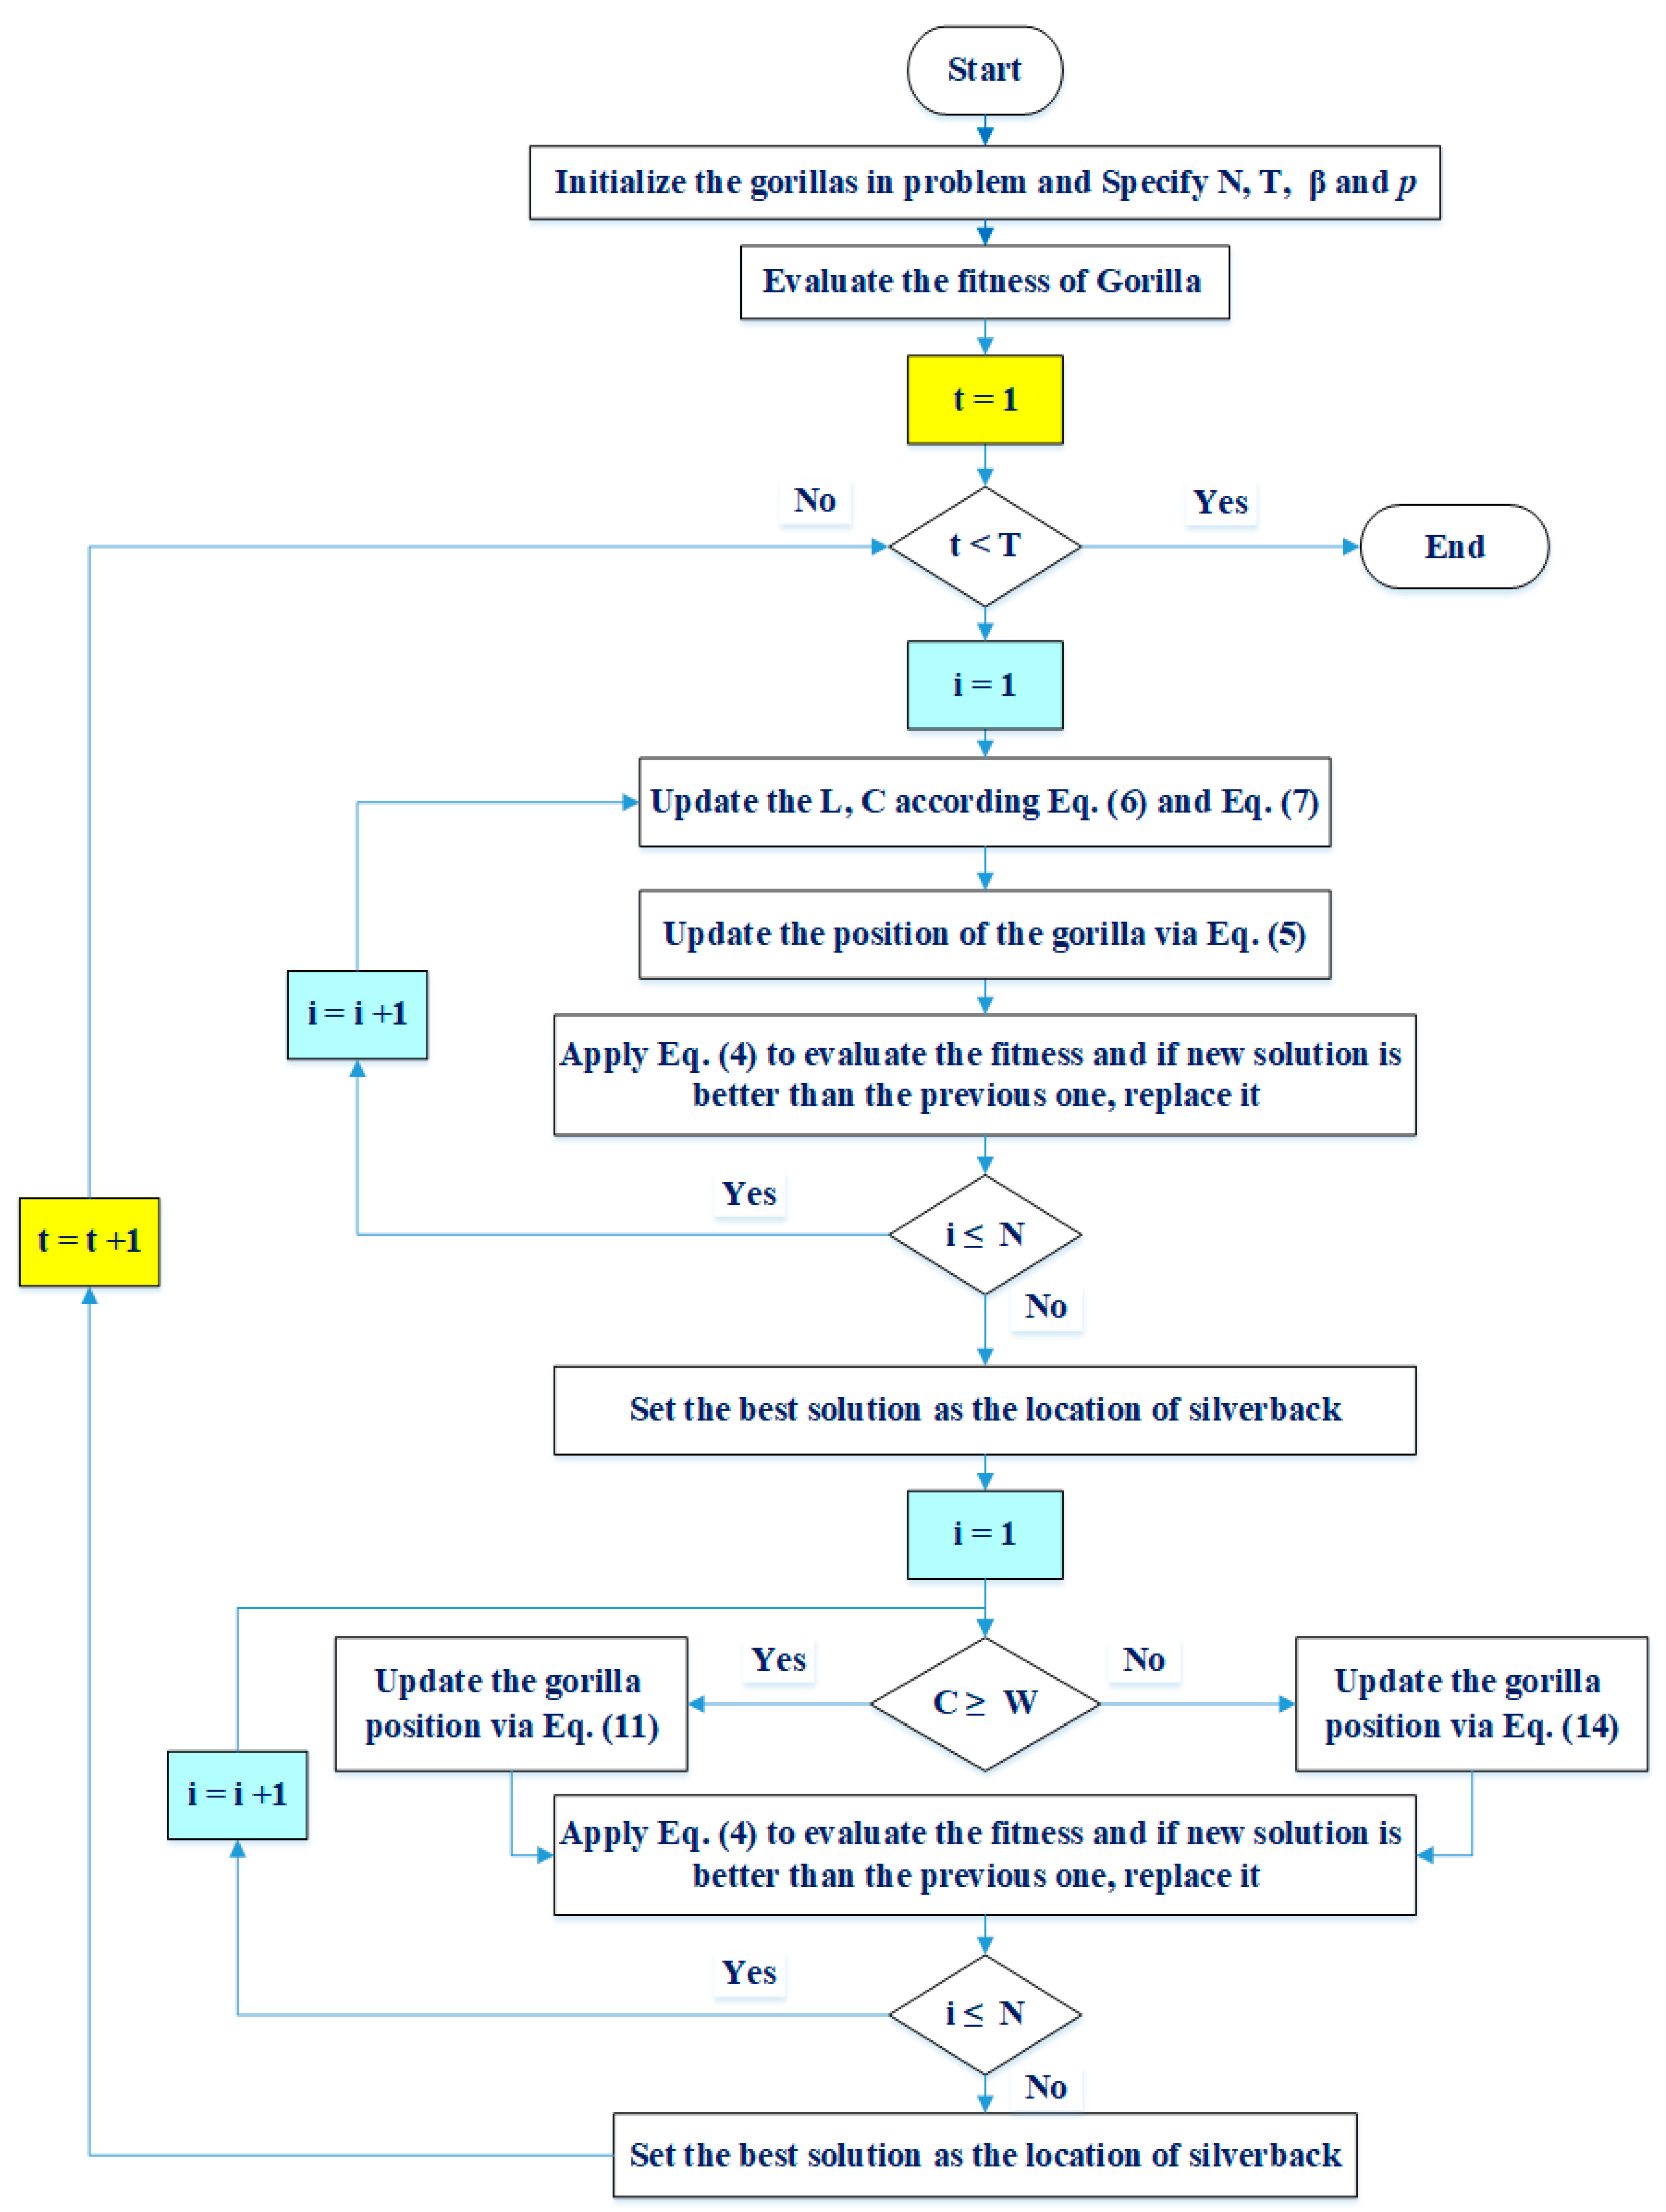
3. Gorilla Troops Optimization for Parameters Extraction of Solar Cell Models

Gorilla troops optimization (GTO) is based on the group behaviors of gorillas, where five strategies are simulated. These strategies are migration to an undiscovered area, moving to other gorillas, migration in the direction of an identified location, following the silverback, and competition for adult females. They are mimicked and demonstrated to explain the exploration and exploitation of the optimization process. During the exploration phase, three techniques are used: migration to an undiscovered area, moving to other gorillas, and migration in the direction of an identified location. The two strategies used in the exploitation phase are follow the silverback and competition for adult females.

3.1. Exploration Phase

All gorillas are considered as candidate solutions in GTO, and at each optimization operation stage, the best candidate solution is considered as a silverback gorilla. Three different strategies are used for the exploration phase which are: migration to an unidentified place to raise the exploration of GTO, a movement to other gorillas to increase the balance among exploitation and exploration, and migration in the direction of an identified location to raise the GTO capability to search for diverse optimization spaces. When rand < a parameter (p), migration to an unidentified place strategy is chosen. Furthermore, a movement to other gorillas’ strategy is chosen if rand ≥ 0.5, while a migration in the direction of an identified location is chosen if rand < 0.5. These three strategies in the exploration phase can be mathematically formulated as follows:
G X ( t + 1 ) = { ( U L L L ) × r 1 + L L , r a n d < p , ( r 2 C ) × X r ( t ) + L × H , r a n d 0.5 , X ( i ) L × ( L × ( X ( t ) G X r ( t ) ) + r 3 × ( X ( t ) G X r ( t ) ) ) , r a n d < 0.5
where X(t) and G X ( t + 1 ) represent the current vector of gorilla position and the candidate position vector of the gorilla in the following t iteration, respectively, while rand, r1, r2, and r3 signify random values in the range from 0 to 1. The parameter (p) demonstrates the probability of choosing the migration strategy to an unidentified position and must be specified in a range of 0–1 before the optimization operation. The parameters Xr and GXr illustrate one member of the gorillas designated from the whole population and one of the vectors of gorilla candidate positions that can be randomly designated, respectively. LL and UL characterize the lower and upper limits of the variables, respectively. The variables C, L, and H can be mathematically represented according to Equations (7), (9) and (10), respectively.
C = F × ( 1 I t / M a x I t ) ,
F = cos ( 2 × r 4 ) + 1 ,
L = C × l ,
H = Z × X ( t ) ,
Z = [ C , C ]
where the symbols It and MaxIt denote the current iteration and the total iteration values of the optimization operation, respectively, while the symbols cos and r4 refer to the cosine function and random values in the range from 0 to 1, respectively. Furthermore, the symbols l and Z represent random values in the range of [−1, 1] and [−C, C], respectively.
The cost of all GX solutions is assessed at the end of the exploration phase, and if the cost of GX(t) < X(t), the GX(t) solution will replace the X(t) solution and become the best solution (silverback).

3.2. Exploitation Phase

Two strategies in the exploitation phase of GTO, which are follow the silverback and competition for adult females, are employed.
Using the C value in Equation (7) and comparing it with parameter W (which can be set), one of the two strategies can be chosen, as illustrated in the next section.
The silverback gorilla is the leader for a group that makes decisions and guides other gorillas in the direction of the food sources. This strategy is selected if CW. This behavior can be mathematically represented according to Equation (11).
G X ( t + 1 ) = L × M × ( X ( t ) X s i v e r b a c k ) + X ( t ) .
X(t) represents the gorilla position vector, while Xsilverback represents the silverback gorilla position vector which offers the best solution.
M = ( | ( 1 / N ) i = 1 N G X i ( t ) | g ) ( 1 / g )
GXi(t) illustrates the position of each candidate gorilla’s vector in iteration t, whereas N signifies the number of gorillas.
g = 2 L .
L can be determined by Equation (9).
Competition for adult females is the second strategy designated for the exploitation phase if C < W. When young gorillas become mature, they compete violently with other males over selecting adult females. This behavior can be mathematically represented according to Equation (14).
G X ( i ) = X s i v e r b a c k ( X s i v e r b a c k × Q X ( t ) × Q ) × A ,
Q = 2 × r 5 1 ,
A = β × E ,
E = { N 1 r a n d 0.5 N 2 r a n d < 0.5 .
Q simulates the impact force, which is formulated in Equation (15), while the symbol r5 manifests random values in the range [0, 1]. The coefficient A represents a vector that indicates the degree of violence in case of conflicts and can be assessed with Equation (16). In Equation (16), the parameter β is a specified value before the optimization maneuver, and E is used to simulate the violence effect on the solutions’ dimensions.
The cost of all GX solutions is assessed at the end of the exploitation phase, and if the cost of GX(t) < X(t), the GX(t) solution will replace the X(t) solution and become the best solution (silverback). Figure 3 describes the main steps of the developed GTO for parameter extraction of solar cell models.

4. Simulation Results

The first solar module, which was mono-crystalline STM6_40/36, contained 36 cells connected in series with a cell size of 38 mm × 128 mm at 51 °C and an irradiance of 1000 W/m2 [54]. The other solar module, which was a Kyocera KC200GT PV module, contained 54 multi-crystalline cells in series and had a short-circuit current and open circuit voltage of 8.21 A and 32.90 V, respectively. The maximum point voltage, current, and power of this module were, respectively, 26.30 V, 7.61 A, and 200 W.
The measured data of the two modules contained 15 and 20 pairs of I and V values for the Kyocera KC200GT and STM6_40/36. The upper bounds (UB) and the lower bounds (LB) of parameters for the two modules are depicted in Table 1.
In this section, GTO was applied and tested for parameter extraction of the SDM and DDM of various solar cell/modules. To compare relative techniques in recent literature, the Kyocera KC200GT PV module and STM6-40/36 PV module were selected for parameter extraction, as they are widely employed as benchmarks to assess the performances of several parameter extraction methods. Furthermore, diverse solar irradiance and temperatures were applied to the Kyocera KC200GT PV module to validate the efficiency of GTO. It may be useful mentioning that all reported results of the unknown parameters are shown later in a value per cell.

4.1. Kyocera KC_200GT PV Module

4.1.1. Case 1: SDM

In this case, the parameters of the SDM of the Kyocera KC200GT PV module were extracted using GTO, and the result of this algorithm, which was characterized with the minimum error, was compared with various reported algorithms in the literature. This is elaborated in Table 2, which tabulates the comparative results of GTO. It achieved the minimum RMSE value and standard deviation values of 6.367E−4 and 4.405E−8, respectively, with respect to other recent optimization techniques, which were EO [47,55], FBI [46], HEAP [49,56], jellyfish search (JFS) optimizer [48,57], and EMPA [58,59], and other reported optimization techniques, which were PSO [12], ALO [18], flexible PSO (FPSO) [29], PGJAYA [34], classified perturbation mutation PSO (CPMPSO) [60], Hybrid Firefly and Pattern Search (HFAPS) [61], Lightning Attachment Procedure Optimization (LAPO) [62], Barnacles Mating Optimizer (BMA) [63], neighborhood scheme-based Laplacian MBA (NLBMA) [64], hybrid PSO–GWO algorithm (PSOGWO) [65], Enriched Harris Hawks optimization (EHHO) [66], and multi-verse optimizer (MVO) [67]. As shown in Table 2, the GTO technique for the SDM of KC200GT had the minimum error value compared with the various reported algorithms in the literature. The minimum RMSE was 6.367E−4, which was obtained by means of GTO. On the other hand, the FBI [46] obtained a very close RMSE value of 9.88E−4. In addition, GTO showed a very small standard deviation of 4.405E−8, an error that was several orders of magnitude smaller than other methods, excepting the NLBMA [64] with a standard deviation value of 7.2452E−13. The main reason for this was because of the excellent searching balance between the exploration and exploitation characteristics of GTO. GTO is a new algorithm that is based on different searching strategies.
Furthermore, the extracted electrical parameters relevant to GTO were 8.216767 A, 2.62E−16, 0.004826 Ω, 6.280209 Ω, and 1.212905 for the photo current, reverse saturation currents, series resistance, shunt resistance, and ideality factor for D1, respectively, as denoted in Table 3. Additionally, the same table displays the extracted electrical parameters using other recent and reported optimization techniques.
The RMSE of GTO for the SDM of Kyocera KC200GT PV was compared to recently developed optimizers such as EO, FBI, HEAP, JFS, MPA, and EMPA, which are characterized in Figure 4, where 30 runs were performed to get the RMSE data for all algorithms. The developed GTO achieved an RMSE value of 6.367E−4 in the 30 run processes, which represented the lowest value among the recently developed optimizers. The convergence characteristics of GTO for the Kyocera KC200GT PV module are developed in Figure 5, where the best convergence characteristics were achieved by GTO and its arrival at the optimal solution was quicker than other recently developed optimizers. Figure 6 and Figure 7 illustrate the simulated behavior of the current-voltage (V-I) and the power-voltage (P-V) using the SDM result and compared to the data that were used for the parameter estimation. Table 4 illustrates the experimental, simulated power values, and the absolute errors of current and power (IAE and PAE) between them when employing GTO on the SDM of the Kyocera KC200GT module.

4.1.2. Case 2: DDM

In this case, the parameters of the DDM of the PV panel of the Kyocera KC200GT PV module were extracted using GTO, and the result of this algorithm, which was characterized with the minimum error, was compared with various reported algorithms in the literature. These are shown in Table 5, which tabulates the comparative results of GTO. It achieved the minimum RMSE value and standard deviation value of 3.736E−04 and 9.482E−05 with respect to other recent optimization techniques, which were EO, FBI, HEAP, JFS, MPA, and EMPA, and other reported optimization techniques, which were particle swarm optimization (PSO) [12], Lightning Attachment Procedure Optimization (LAPO) [62], BMA [63], NLBMA [64], and hybrid PSO–GWO algorithm (PSOGWO) [65].
As shown in Table 5, the GTO technique for the DDM of KC200GT had the minimum error, compared with various reported algorithms in the literature. The minimum RMSE was 3.736E−4. On the other hand, the FBI [46] obtained a very close RMSE value of 2.425E−3. In addition, GTO showed a small standard deviation of 9.482E−5. In contrast, the NLBMA [64] provided the smallest standard deviation of 2.6409E−16, but its obtained minimum RMSE value of 3.3043E−2 was much larger than the minimum GTO RMSE value of 3.736E−4. Furthermore, the extracted electrical parameters relevant to GTO were 8.216007 A, 2.07E−02 μA, 7.49E−01 μA, 0.00485 Ω, 6.517429 Ω, 1.199424, and 1.966626 for the photo current, reverse saturation currents, series resistance, shunt resistance, and ideality factor for D1, D2, respectively, as denoted in Table 6. Additionally, the same table displays the extracted electrical parameters using other recent and reported optimization techniques.
The RMSE of GTO for the DDM of the Kyocera KC200GT PV module was compared to recently developed optimizers such as EO, FBI, HEAP, JFS, MPA, and EMPA, as shown in Figure 8, where 30 runs were performed to obtain the RMSE data for all recent optimizers. The figure clearly shows that the developed GTO achieved an RMSE value of 3.736E−04 in the 30 run processes, which represents the lowest value among the recently developed optimizers. The convergence characteristics of GTO for the Kyocera KC200GT PV module are illustrated in Figure 9, where the best convergence characteristics were achieved by GTO, and its arrival at the optimal solution was quicker than other recently developed optimizers.
Figure 10 and Figure 11 illustrate the simulated behavior of the current-voltage (V-I) and the power-voltage (P-V) using the SDM result compared to the data that were used for the parameter estimation.

4.1.3. GTO Validation with Diverse Irradiations and Temperatures

In this subsection, validation of GTO for the KC200GT module was demonstrated with diverse irradiations and temperatures. As a result, GTO was used to simulate varied voltage and current combinations while varying the irradiations and temperatures. The irradiations varied among 200, 400, 600, 800, and 1000 W/m2, while the temperatures were recorded as 25, 47, 50, and 75 °C. The appropriate I-V curves of the KC200GT module tested and generated by GTO are shown in Figure 12, and Figure 13 depicts the matching P-V curves of the KC200GT module as tested and predicted by GTO. Variations in solar irradiation values and temperatures were observed to alter the model’s output power. As can be seen, there was a remarkable closeness between the emulated and experimental P-V curves, demonstrating GTO’s strong efficacy in adapting to this issue, even under various operating conditions (temperatures and irradiations). Therefore, GTO was validated under diverse irradiations and temperatures.

4.2. STM6_40/36 PV Module

4.2.1. Case 1: SD Model

In this case, the parameters of the SDM of the STM6_40/36 PV module were extracted using GTO, and the result of this algorithm, which was characterized by the minimum error, was compared with various reported algorithms in the literature. This is elaborated in Table 7, which tabulates comparative results of GTO. It achieved the minimum RMSE value and standard deviation value of 1.730E−03 and 1.333E−17, respectively, with respect to other recent optimization techniques comprising EO, FBI, HEAP, JFS, MPA, and EMPA, and the other reported optimization techniques of Simulated Annealing (SA) [23], three point based approach (TPBA) [68], hybridizing cuckoo search/biogeography-based optimization (BHCS) [69], improved teaching learning-based optimization (ITLBO) [70], improved cuckoo search (ImCSA) algorithm [71], and improved shuffled complex evolution (ISCE) [26]. Furthermore, the extracted electrical parameters relevant to GTO were 1.663905 A, 1.74 μA, 0.004274 Ω, 15.92829 Ω, and 1.520303 for the photo current, reverse saturation currents, series resistance, shunt resistance, and ideality factor for D1, respectively, as denoted in Table 8. Additionally, Table 8 displays the extracted electrical parameters using other recent and reported optimization techniques.
The RMSE of GTO for the SDM of the STM6_40/36 PV module was compared to recently developed optimizers, such as EO, FBI, HEAP, JFS, MPA, and EMPA, as shown in Figure 14, where 30 runs were performed to get the RMSE data for all recent optimizers. The figure clearly shows that the developed GTO achieves an RMSE value of 1.733E−03 in the 30 run processes, which represents the lowest value among the recently developed optimizers. The convergence characteristics of GTO for the STM6_40/36 PV module are shown in Figure 15, where the best convergence characteristics were achieved with GTO, and its arrival at the optimal solution was quicker than other recently developed optimizers. Figure 16 and Figure 17 illustrate the simulated behavior of the current-voltage (I-V) and the power-voltage (P-V) using the SDM result compared to the data that were used for the parameter estimation. Table 9 illustrates the experimental, simulated power values and the absolute errors between them when employing GTO on the SDM of the STM6_40/36 PV module.

4.2.2. Case 2: DD Module

In this case, the parameters of the DDM of the PV panel of the STM6_40/36 PV module were extracted using GTO, and the result of this algorithm, which was characterized with the minimum error, was compared with the various reported algorithms in the literature. This is shown in Table 10, which lists the comparative results of GTO. It achieved the minimum RMSE value and standard deviation value of 1.688E−03 and 1.369E−05, respectively, compared to other recent optimization techniques, such as EO, FBI, HEAP, JFS, MPA, and EMPA, and other reported optimization techniques, such as the novel bat algorithm (NBA) and the directional bat algorithm (DBA) [72], LCROA [73], EPSO [74], and FC-EPSO algorithm [75].
Furthermore, the extracted electrical parameters relevant to GTO were 1.663922 A, 3.24 μA, 4.63E−4 μA, 0.007956 Ω, 17.15709 Ω, 1.644348, and 1 for the photo current, reverse saturation currents, series resistance, shunt resistance, and ideality factor for D1, respectively, as denoted in Table 11. Also, the table displays the extracted electrical parameters of the different techniques. The RMSE of GTO for the DDM of the STM6_40/36 PV module as compared to recently developed optimizers, such as EO, FBI, HEAP, JFS, MPA, and EMPA, is shown in Figure 18, where 30 runs were performed to get the RMSE data for all recent optimizers. The figure clearly shows that the developed GTO achieved an RMSE value of 1.688E−03 in the 30 run processes, which represented the lowest value among the recently developed optimizers. The convergence characteristics of GTO for the STM6_40/36 PV module are shown in Figure 19, where the best convergence characteristics were achieved by GTO, and its arrival at the optimal solution was quicker than other recently developed optimizers. Figure 20 and Figure 21 illustrate the simulated behavior of the current-voltage (I-V) and the power-voltage (P-V) using the DDM result compared to the data that were used for the parameter estimation. Table 12 illustrates the experimental, simulated power values and the absolute errors between them when employing GTO on the SDM of the STM6_40/36 PV module.

5. Conclusions

Gorilla Troops Optimization (GTO) was designed in this paper to extract properly the parameters of PV models, where GTO can achieve a good balance between exploitation and exploration. The superiority of GTO was initially demonstrated on the Kyocera KC200GT PV module and the STM6-40/36 PV module, both of which include SDMs and DDMs, to extract five and seven parameters, respectively. Comparisons with previously developed approaches to this problem and other techniques reported in the literature were demonstrated. GTO’s exceptional performance was validated. The experimental findings in the benchmark test PV models in terms of final solution quality, convergence speed, robustness, and statistics demonstrated thoroughly that GTO can accelerate the global searching process and outperform competitors. Thus, GTO performed significantly better than the reported methods and was highly competitive with the recently developed parameter extraction methods. GTO’s efficacy and superiority were expressed by calculating the standard deviations of the fitness values, which showed that the SDMs and DDMs were smaller than 1E−16, and 1E−6, respectively. Also, validation of GTO for the KC200GT module was demonstrated with diverse irradiations and temperatures where great closeness between the emulated and experimental P-V and I-V curves was achieved under various operating conditions (temperatures and irradiations). Further testing and validation of other modules with different technologies are anticipated and varied conditions can be analyzed and simulated. The latter frames the way forward to extend this current effort using GTO.

Author Contributions

Conceptualization, A.G., S.M.G., A.E. and A.E.-F.; methodology, S.M.G., R.E.-S., A.S. and A.E.-F.; software, R.E.-S., A.S. and A.G.; validation, A.E.-F., R.E.-S. and S.M.G.; formal analysis, R.E.-S., A.S. and S.M.G.; investigation, A.E.-F. and R.E.-S.; resources, S.M.G., R.E.-S. and A.S.; data curation, S.M.G., A.G. and A.S.; writing—original draft preparation, A.G., A.E. and A.S.; writing—review and editing, A.E.-F. and R.E.-S.; visualization S.M.G., A.E.-F. and R.E.-S.; supervision, A.E.-F., and R.E.-S.; project administration, A.E., A.S. and A.G.; funding acquisition, S.M.G. All authors have read and agreed to the published version of the manuscript.

Funding

This project is funded by Taif University Researchers Supporting Project under Grant TURSP-2020/34, Taif, Saudi Arabia.

Institutional Review Board Statement

The study did not involve humans or animals.

Informed Consent Statement

The study did not involve humans.

Data Availability Statement

Not applicable.

Acknowledgments

The authors would like to acknowledge the financial support received from Taif University Researchers Supporting Project Number (TURSP-2020/34), Taif University, Taif, Saudi Arabia.

Conflicts of Interest

The authors declare no conflict of interest.

References

  1. Madurai Elavarasan, R.; Pugazhendhi, R.; Jamal, T.; Dyduch, J.; Arif, M.T.; Manoj Kumar, N.; Shafiullah, G.M.; Chopra, S.S.; Nadarajah, M. Envisioning the UN Sustainable Development Goals (SDGs) through the lens of energy sustainability (SDG 7) in the post-COVID-19 world. Appl. Energy 2021, 292, 116665. [Google Scholar] [CrossRef]
  2. Vathanam, G.S.O.; Kalyanasundaram, K.; Elavarasan, R.M.; Hussain, S.; Subramaniam, U.; Pugazhendhi, R.; Ramesh, M.; Gopalakrishnan, R.M. A review on effective use of daylight harvesting using intelligent lighting control systems for sustainable office buildings in India. Sustainability 2021, 13, 4973. [Google Scholar] [CrossRef]
  3. Shaheen, A.M.; Ginidi, A.R.; El-Sehiemy, R.A.; Elattar, E.E. Optimal economic power and heat dispatch in Cogeneration Systems including wind power. Energy 2021, 225, 120263. [Google Scholar] [CrossRef]
  4. Elavarasan, R.M.; Selvamanohar, L.; Raju, K.; Vijayaraghavan, R.R.; Subburaj, R.; Nurunnabi, M.; Khan, I.A.; Afridhis, S.; Hariharan, A.; Pugazhendhi, R.; et al. A Holistic Review of the Present and Future Drivers of the Renewable Energy Mix in Maharashtra, State of India. Sustainability 2020, 12, 6596. [Google Scholar] [CrossRef]
  5. Shaheen, A.M.; Elsayed, A.M.; Ginidi, A.R.; Elattar, E.E.; El-Sehiemy, R.A. Effective Automation of Distribution Systems With Joint Integration of DGs/ SVCs Considering Reconfiguration Capability by Jellyfish Search Algorithm. IEEE Access 2021, 9, 92053–92069. [Google Scholar] [CrossRef]
  6. Bana, S.; Saini, R.P. Identification of unknown parameters of a single diode photovoltaic model using particle swarm optimization with binary constraints. Renew. Energy 2016, 101, 1299–1310. [Google Scholar] [CrossRef]
  7. Qais, M.H.; Hasanien, H.M.; Alghuwainem, S. Parameters extraction of three-diode photovoltaic model using computation and Harris Hawks optimization. Energy 2020, 195, 117040. [Google Scholar] [CrossRef]
  8. Qais, M.H.; Hasanien, H.M.; Alghuwainem, S. Transient search optimization for electrical parameters estimation of photovoltaic module based on datasheet values. Energy Convers. Manag. 2020, 214, 112904. [Google Scholar] [CrossRef]
  9. Ayodele, T.R.; Ogunjuyigbe, A.S.O.; Ekoh, E.E. Evaluation of numerical algorithms used in extracting the parameters of a single-diode photovoltaic model. Sustain. Energy Technol. Assess. 2016, 13, 51–59. [Google Scholar] [CrossRef]
  10. Sudhakar Babu, T.; Prasanth Ram, J.; Sangeetha, K.; Laudani, A.; Rajasekar, N. Parameter extraction of two diode solar PV model using Fireworks algorithm. Sol. Energy 2016, 140, 265–276. [Google Scholar] [CrossRef]
  11. Said, M.; Shaheen, A.M.; Ginidi, A.R.; El-Sehiemy, R.A.; Mahmoud, K.; Lehtonen, M.; Darwish, M.M.F. Estimating Parameters of Photovoltaic Models Using Accurate Turbulent Flow of Water Optimizer. Processes 2021, 9, 627. [Google Scholar] [CrossRef]
  12. Khanna, V.; Das, B.K.; Bisht, D.; Singh, P.K. A three diode model for industrial solar cells and estimation of solar cell parameters using PSO algorithm. Renew. Energy 2015, 78, 105–113. [Google Scholar] [CrossRef]
  13. Saloux, E.; Teyssedou, A.; Sorin, M. Explicit model of photovoltaic panels to determine voltages and currents at the maximum power point. Sol. Energy 2011, 85, 713–722. [Google Scholar] [CrossRef]
  14. Soeriyadi, A.H.; Wang, L.; Conrad, B.; Li, D.; Lochtefeld, A.; Gerger, A.; Barnett, A.; Perez-Wurfl, I. Extraction of essential solar cell parameters of subcells in a tandem structure with a novel three-terminal measurement technique. IEEE J. Photovolt. 2018, 8, 327–332. [Google Scholar] [CrossRef]
  15. Batzelis, E.; Papathanassiou, S.A. A Method for the Analytical Extraction of the Single-Diode PV Model Parameters. IEEE Trans. Sustain. Energy 2016, 7, 504–512. [Google Scholar] [CrossRef]
  16. AlRashidi, M.R.; AlHajri, M.F.; El-Naggar, K.M.; Al-Othman, A.K. A new estimation approach for determining the I--V characteristics of solar cells. Sol. Energy 2011, 85, 1543–1550. [Google Scholar] [CrossRef]
  17. Lin, P.; Cheng, S.; Yeh, W.; Chen, Z.; Wu, L. Parameters extraction of solar cell models using a modified simplified swarm optimization algorithm. Sol. Energy 2017, 144, 594–603. [Google Scholar] [CrossRef]
  18. Kanimozhi, G.; Kumar, H. Modeling of solar cell under different conditions by Ant Lion Optimizer with LambertW function. Appl. Soft Comput. J. 2018, 71, 141–151. [Google Scholar]
  19. Hasanien, H.M. Shuffled Frog Leaping Algorithm for Photovoltaic Model Identification. IEEE Trans. Sustain. Energy 2015, 6, 509–515. [Google Scholar] [CrossRef]
  20. Panchal, A.K. I-V Data Operated High-Quality Photovoltaic Solution through Per-Unit Single-Diode Model. IEEE J. Photovolt. 2020, 10, 1175–1184. [Google Scholar] [CrossRef]
  21. Javier Toledo, F.; Blanes, J.M.; Galiano, V. Two-Step Linear Least-Squares Method for Photovoltaic Single-Diode Model Parameters Extraction. IEEE Trans. Ind. Electron. 2018, 65, 6301–6308. [Google Scholar] [CrossRef]
  22. Subudhi, B.; Pradhan, R. Bacterial Foraging Optimization approach to parameter extraction of a photovoltaic module. IEEE Trans. Sustain. Energy 2018, 9, 381–389. [Google Scholar] [CrossRef]
  23. Ben Messaoud, R. Extraction of uncertain parameters of a single-diode model for a photovoltaic panel using lightning attachment procedure optimization. J. Comput. Electron. 2020, 19, 1192–1202. [Google Scholar] [CrossRef]
  24. Ibrahim, I.A.; Hossain, M.J.; Duck, B.C.; Fell, C.J. An adaptive wind-driven optimization algorithm for extracting the parameters of a single-diode PV cell model. IEEE Trans. Sustain. Energy 2020, 11, 1054–1066. [Google Scholar] [CrossRef]
  25. Guo, L.; Meng, Z.; Sun, Y.; Wang, L. Parameter identification and sensitivity analysis of solar cell models with cat swarm optimization algorithm. Energy Convers. Manag. 2016, 108, 520–528. [Google Scholar] [CrossRef]
  26. Gao, X.; Cui, Y.; Hu, J.; Xu, G.; Wang, Z.; Qu, J.; Wang, H. Parameter extraction of solar cell models using improved shuffled complex evolution algorithm. Energy Convers. Manag. 2018, 157, 460–479. [Google Scholar] [CrossRef]
  27. Chen, X.; Tianfield, H.; Du, W.; Liu, G. Biogeography-based optimization with covariance matrix based migration. Appl. Soft Comput. 2016, 45, 71–85. [Google Scholar] [CrossRef]
  28. Xiong, G.; Zhang, J.; Yuan, X.; Shi, D.; He, Y.; Yao, G. Parameter extraction of solar photovoltaic models by means of a hybrid differential evolution with whale optimization algorithm. Sol. Energy 2018, 176, 742–761. [Google Scholar] [CrossRef]
  29. Ebrahimi, S.M.; Salahshour, E.; Malekzadeh, M.; Gordillo, F. Parameters identification of PV solar cells and modules using flexible particle swarm optimization algorithm. Energy 2019, 179, 358–372. [Google Scholar] [CrossRef]
  30. Abbassi, R.; Abbassi, A.; Asghar, A.; Mirjalili, S. An efficient salp swarm-inspired algorithm for parameters identification of photovoltaic cell models. Energy Convers. Manag. 2019, 179, 362–372. [Google Scholar] [CrossRef]
  31. Liang, J.; Qiao, K.; Yu, K.; Ge, S.; Qu, B.; Xu, R.; Li, K. Parameters estimation of solar photovoltaic models via a self-adaptive ensemble-based differential evolution. Sol. Energy 2020, 207, 336–346. [Google Scholar] [CrossRef]
  32. Abbassi, A.; Abbassi, R.; Heidari, A.A.; Oliva, D.; Chen, H.; Habib, A.; Jemli, M.; Wang, M. Parameters identification of photovoltaic cell models using enhanced exploratory salp chains-based approach. Energy 2020, 198, 117333. [Google Scholar] [CrossRef]
  33. Xiong, G.; Zhang, J.; Shi, D.; He, Y. Parameter extraction of solar photovoltaic models using an improved whale optimization algorithm. Energy Convers. Manag. 2018, 174, 388–405. [Google Scholar] [CrossRef]
  34. Yu, K.; Qu, B.; Yue, C.; Ge, S.; Chen, X.; Liang, J. A performance-guided JAYA algorithm for parameters identification of photovoltaic cell and module. Appl. Energy 2019, 237, 241–257. [Google Scholar] [CrossRef]
  35. Ram, J.P.; Babu, T.S.; Dragicevic, T.; Rajasekar, N. A new hybrid bee pollinator flower pollination algorithm for solar PV parameter estimation. Energy Convers. Manag. 2017, 135, 463–476. [Google Scholar] [CrossRef]
  36. Qais, M.H.; Hasanien, H.M.; Alghuwainem, S. Identification of electrical parameters for three-diode photovoltaic model using analytical and sunflower optimization algorithm. Appl. Energy 2019, 250, 109–117. [Google Scholar] [CrossRef]
  37. Liao, Z.; Chen, Z.; Li, S. Parameters Extraction of Photovoltaic Models Using Triple-Phase Teaching-Learning-Based Optimization. IEEE Access 2020, 8, 69937–69952. [Google Scholar] [CrossRef]
  38. Qais, M.H.; Hasanien, H.M.; Alghuwainem, S.; Nouh, A.S. Coyote optimization algorithm for parameters extraction of three-diode photovoltaic models of photovoltaic modules. Energy 2019, 187, 116001. [Google Scholar] [CrossRef]
  39. Liu, Y.; Heidari, A.A.; Ye, X.; Chi, C.; Zhao, X.; Ma, C.; Turabieh, H.; Chen, H.; Le, R. Evolutionary shuffled frog leaping with memory pool for parameter optimization. Energy Rep. 2021, 7, 584–606. [Google Scholar] [CrossRef]
  40. Chenouard, R.; El-Sehiemy, R.A. An interval branch and bound global optimization algorithm for parameter estimation of three photovoltaic models. Energy Convers. Manag. 2020, 205, 112400. [Google Scholar] [CrossRef]
  41. El-Dabah, M.A.; El-Sehiemy, R.A.; Becherif, M.; Ebrahim, M.A. Parameter estimation of triple diode photovoltaic model using an artificial ecosystem-based optimizer. Int. Trans. Electr. Energy Syst. 2021, e13043. [Google Scholar] [CrossRef]
  42. Bayoumi, A.S.A.; El-Sehiemy, R.A.; Abaza, A. Effective PV Parameter Estimation Algorithm Based on Marine Predators Optimizer Considering Normal and Low Radiation Operating Conditions. Arab. J. Sci. Eng. 2021, 17, 1–21. [Google Scholar]
  43. Zaky, A.A.; El Sehiemy, R.A.; Rashwan, Y.I.; Elhossieni, M.A.; Gkini, K.; Kladas, A.; Falaras, P. Optimal Performance Emulation of PSCs using the Elephant Herd Algorithm Associated with Experimental Validation. ECS J. Solid State Sci. Technol. 2019, 8, Q249–Q255. [Google Scholar] [CrossRef]
  44. Zaky, A.A.; Ibrahim, M.N.; Rezk, H.; Christopoulos, E.; El Sehiemy, R.A.; Hristoforou, E.; Kladas, A.; Sergeant, P.; Falaras, P. Energy efficiency improvement of water pumping system using synchronous reluctance motor fed by perovskite solar cells. Int. J. Energy Res. 2020, 44, 11629–11642. [Google Scholar] [CrossRef]
  45. Abdollahzadeh, B.; Gharehchopogh, F.S.; Mirjalili, S. Artificial gorilla troops optimizer: A new nature-inspired metaheuristic algorithm for global optimization problems. Int. J. Intell. Syst. 2021, 22535. [Google Scholar] [CrossRef]
  46. El-Sehiemy, R.A.; Abdullah, M.; Sherif, S.M. Ghoneim A Forensic-Based Investigation Algorithm for Parameter Extraction of Solar Cell models. IEEE Access 2020, 9, 1–20. [Google Scholar]
  47. Faramarzi, A.; Heidarinejad, M.; Stephens, B.; Mirjalili, S. Equilibrium optimizer: A novel optimization algorithm. Knowl. Based Syst. 2020, 191, 105190. [Google Scholar] [CrossRef]
  48. Chou, J.S.; Truong, D.N. A novel metaheuristic optimizer inspired by behavior of jellyfish in ocean. Appl. Math. Comput. 2021, 389, 125535. [Google Scholar] [CrossRef]
  49. Askari, Q.; Saeed, M.; Younas, I. Heap-based optimizer inspired by corporate rank hierarchy for global optimization. Expert Syst. Appl. 2020, 161, 113702. [Google Scholar] [CrossRef]
  50. Elsayed, A.M.; Shaheen, A.M.; Alharthi, M.M.; Ghoneim, S.S.M.; El-Sehiemy, R.A. Adequate operation of hybrid AC/MT-HVDC power systems using an improved multi- objective marine predators optimizer. IEEE Access 2021, 9, 51065–51087. [Google Scholar] [CrossRef]
  51. Ortiz-Conde, A.; Lugo-Muñoz, D.; García-Sánchez, F.J. An explicit multiexponential model as an alternative to traditional solar cell models with series and shunt resistances. IEEE J. Photovolt. 2012, 2, 261–268. [Google Scholar] [CrossRef]
  52. Chin, V.J.; Salam, Z.; Ishaque, K. Cell modelling and model parameters estimation techniques for photovoltaic simulator application: A review. Appl. Energy 2015, 154, 500–519. [Google Scholar] [CrossRef]
  53. Chin, V.J.; Salam, Z. Coyote optimization algorithm for the parameter extraction of photovoltaic cells. Sol. Energy 2019, 194, 656–670. [Google Scholar] [CrossRef]
  54. Tong, N.T.; Pora, W. A parameter extraction technique exploiting intrinsic properties of solar cells. Appl. Energy 2016, 176, 104–115. [Google Scholar] [CrossRef] [Green Version]
  55. Abo El-Ela, A.A.; Allam, S.M.; Shaheen, A.M.; Nagem, N.A. Optimal allocation of biomass distributed generation in distribution systems using equilibrium algorithm. Int. Trans. Electr. Energy Syst. 2020, 31, e12727. [Google Scholar] [CrossRef]
  56. Ginidi, A.R.; Elsayed, A.M.; Shaheen, A.M.; Elattar, E.E.; El-Sehiemy, R.A. A Novel Heap based Optimizer for Scheduling of Large-scale Combined Heat and Power Economic Dispatch. IEEE Access 2021, 9, 83695–83708. [Google Scholar] [CrossRef]
  57. Shaheen, A.M.; El-Sehiemy, R.A.; Ginidi, A.R.; Ghoneim, S.S.M.; Alharthi, M.M. Multi-objective jellyfish search optimizer for efficient power system operation based on multi-dimensional OPF framework. Energy 2021, 237, 121478. [Google Scholar] [CrossRef]
  58. Shaheen, A.M.; Elsayed, A.M.; Ginidi, A.R.; El-Sehiemy, R.A.; Alharthid, M.M.; Ghoneim, S.S.M. A novel improved marine predators algorithm for combined heat and power economic dispatch problem. Alex. Eng. J. 2021. [Google Scholar] [CrossRef]
  59. Al Harthi, M.; Ghoneim, S.; Elsayed, A.; El-Sehiemy, R.; Shaheen, A.; Ginidi, A. A Multi-Objective Marine Predator Optimizer for Optimal Techno-Economic Operation of AC/DC Grids. Stud. Inform. Control 2021, 30, 89–99. [Google Scholar] [CrossRef]
  60. Liang, J.; Ge, S.; Qu, B.; Yu, K.; Liu, F.; Yang, H.; Wei, P. Classified perturbation mutation based particle swarm optimization algorithm for parameters extraction of photovoltaic models. Energy Convers. Manag. 2020, 203, 112138. [Google Scholar] [CrossRef]
  61. Mohammad, A.; Maroosi, A. Parameter identification for solar cells and module using a Hybrid Firefly and Pattern Search Algorithms. Sol. Energy 2018, 171, 435–446. [Google Scholar]
  62. Nematollahi, A.F.; Rahiminejad, A.; Vahidi, B. A novel physical based meta-heuristic optimization method known as Lightning Attachment Procedure Optimization. Appl. Soft Comput. J. 2017, 59, 596–621. [Google Scholar] [CrossRef]
  63. Sulaiman, M.H.; Mustaffa, Z.; Saari, M.M.; Daniyal, H. Barnacles Mating Optimizer: A new bio-inspired algorithm for solving engineering optimization problems. Eng. Appl. Artif. Intell. 2020, 87, 103330. [Google Scholar] [CrossRef]
  64. Rizk-Allah, R.M.; El-Fergany, A.A. Conscious neighborhood scheme-based Laplacian barnacles mating algorithm for parameters optimization of photovoltaic single- and double-diode models. Energy Convers. Manag. 2020, 226, 113522. [Google Scholar] [CrossRef]
  65. Şenel, F.A.; Gökçe, F.; Yüksel, A.S.; Yiğit, T. A novel hybrid PSO–GWO algorithm for optimization problems. Eng. Comput. 2019, 35, 1359–1373. [Google Scholar] [CrossRef]
  66. Chen, H.; Jiao, S.; Wang, M.; Heidari, A.A.; Zhao, X. Parameters identification of photovoltaic cells and modules using diversification-enriched Harris hawks optimization with chaotic drifts. J. Clean. Prod. 2020, 244, 118778. [Google Scholar] [CrossRef]
  67. Ali, E.E.; El-Hameed, M.A.; El-Fergany, A.A.; El-Arini, M.M. Parameter extraction of photovoltaic generating units using multi-verse optimizer. Sustain. Energy Technol. Assess. 2016, 17, 68–76. [Google Scholar] [CrossRef]
  68. Chin, V.J.; Salam, Z. A New Three-point-based Approach for the Parameter Extraction of Photovoltaic Cells. Appl. Energy 2019, 237, 519–533. [Google Scholar] [CrossRef]
  69. Chen, X.; Yu, K. Hybridizing cuckoo search algorithm with biogeography-based optimization for estimating photovoltaic model parameters. Sol. Energy 2019, 180, 192–206. [Google Scholar] [CrossRef]
  70. Li, S.; Gong, W.; Yan, X.; Hu, C.; Bai, D.; Wang, L.; Gao, L. Parameter extraction of photovoltaic models using an improved teaching-learning-based optimization. Energy Convers. Manag. 2019, 186, 293–305. [Google Scholar] [CrossRef]
  71. Kang, T.; Yao, J.; Jin, M.; Yang, S.; Duong, T. A novel improved cuckoo search algorithm for parameter estimation of photovoltaic (PV) models. Energies 2018, 11, 1060. [Google Scholar] [CrossRef] [Green Version]
  72. Deotti, L.M.P.; Pereira, J.L.R.; Silva Júnior, I.C. da Parameter extraction of photovoltaic models using an enhanced Lévy flight bat algorithm. Energy Convers. Manag. 2020, 221, 113114. [Google Scholar] [CrossRef]
  73. Lekouaghet, B.; Boukabou, A.; Boubakir, C. Estimation of the photovoltaic cells/modules parameters using an improved Rao-based chaotic optimization technique. Energy Convers. Manag. 2021, 229, 113722. [Google Scholar] [CrossRef]
  74. Rezaee Jordehi, A. Enhanced leader particle swarm optimisation (ELPSO): An efficient algorithm for parameter estimation of photovoltaic (PV) cells and modules. Sol. Energy 2018, 159, 78–87. [Google Scholar] [CrossRef]
  75. Yousri, D.; Thanikanti, S.B.; Allam, D.; Ramachandaramurthy, V.K.; Eteiba, M.B. Fractional chaotic ensemble particle swarm optimizer for identifying the single, double, and three diode photovoltaic models’ parameters. Energy 2020, 195, 116979. [Google Scholar] [CrossRef]
Figure 1. Equivalent circuit for the SDM.
Sustainability 13 09459 g001
Figure 2. Equivalent circuit for the DDM.
Sustainability 13 09459 g002
Figure 3. Main steps of GTO.
Sustainability 13 09459 g003
Figure 4. RMSE of GTO compared to recent techniques for the SDM of the Kyocera KC200GT PV module.
Sustainability 13 09459 g004
Figure 5. Convergence curves of GTO versus recent techniques for the SDM of the Kyocera KC200GT PV module.
Sustainability 13 09459 g005
Figure 6. Measured and calculated data by GTO for the I-V characteristics for the SDM of the KC200GT PV module.
Sustainability 13 09459 g006
Figure 7. Measured and calculated data by GTO for the P-V characteristics for the SDM of the Kyocera KC200GT PV module.
Sustainability 13 09459 g007
Figure 8. RMSE of GTO compared to recent techniques for the DDM of the Kyocera KC200GT PV module.
Sustainability 13 09459 g008
Figure 9. Convergence characteristics of GTO versus recent techniques for the DDM of the Kyocera KC200GT PV module.
Sustainability 13 09459 g009
Figure 10. Comparison of the measured and calculated data obtained by GTO for the I-V characteristics of the DDM of the Kyocera KC200GT PV module.
Sustainability 13 09459 g010
Figure 11. Comparison of the measured and calculated data obtained by GTO for the P-V characteristics of the DDM of the Kyocera KC200GT PV module.
Sustainability 13 09459 g011
Figure 12. GTO validation for the I-V characteristics of the Kyocera KC200GT PV module.
Sustainability 13 09459 g012
Figure 13. GTO validation for the P-V characteristics of the Kyocera KC200GT PV module.
Sustainability 13 09459 g013
Figure 14. RMSE of GTO compared to recent techniques for the SDM of the STM6_40/36 PV module.
Sustainability 13 09459 g014
Figure 15. Convergence characteristics of GTO versus recent techniques for the SDM of the STM6_40/36 PV module.
Sustainability 13 09459 g015
Figure 16. Comparison of the measured and calculated data obtained by GTO for the I-V characteristics of the SDM of the STM6_40/36 PV module.
Sustainability 13 09459 g016
Figure 17. Comparison of the measured and calculated data obtained by GTO for the P-V characteristics of the SDM of STM6_40/36 PV module.
Sustainability 13 09459 g017
Figure 18. RMSE of GTO compared to recent techniques for the DDM of the STM6_40/36 PV module.
Sustainability 13 09459 g018
Figure 19. Convergence characteristics of GTO versus recent techniques for the DDM of the STM6_40/36 PV module.
Sustainability 13 09459 g019
Figure 20. Measured and calculated I-V data obtained by GTO for the DDM of the STM6_40/36 PV module.
Sustainability 13 09459 g020
Figure 21. Comparison of the measured and calculated data obtained by GTO for the P-V characteristics of the DDM of the STM6_40/36 PV module.
Sustainability 13 09459 g021
Table 1. The margin range for the electrical parameters of cell.
ParameterSTM6-40/36 PV ModuleKyocera KC200GT PV Module
LBUBLBUB
Iph (A)02010
I S 1   , I S 2     ( μ A ) 050010
Rs (Ω)00.3602
Rsh (Ω)01000100
η 1 , η 2 1212
No of series cells3654
Table 2. Statistical analysis of various techniques versus GTO for the SDM of KC200GT.
OptimizerMinMeanMaxStd
GTO6.367E−46.367E−46.369E−44.405E−8
EMPA3.847E−31.5832E−22.7145E−25.562E−3
MPA1.487E−23.9118E−24.8449E−21.0157E−2
JFS9.477E−31.2126E−21.4112E−21.401E−3
HEAP7.425E−31.88E−22.7047E−25.239E−3
EO2.888E−39.771E−31.3209E−22.376E−3
FBI [46]9.88E−42.381E−34.135 E−39.06E−4
CPMPSO [60]1.53903E−3
PSO [12]1.0195E−1 3.4467E−1 5.3291E−1 2.1325E−1
LAPO [62]1.3813E−1 2.2513E−1 3.7493E−1 8.9065E−2
PSOGWO [65]1.2700E−1 3.5490E−1 7.6074E−1 2.5853E−1
BMA [63]1.0244E−1 1.2442E−1 1.4986E−1 1.8412E−2
NLBMA [64]3.3610E−2 3.3610E−2 3.3610E−2 7.2452E−13
PGJAYA [34]1.5455E−4
FPSO [29]2.8214E−2
HFAPS [61]4.9863E−2
BMA [63]1.0244E−1
EHHO [66]5.9507E−2
MVO [67]8.3800E−2
Table 3. Parameter estimation using various techniques versus GTO for the SDM of the Kyocera KC200GT PV module.
AlgorithmIph (A) I S 1     ( μ A ) Rs (Ω)Rsh (Ω) η 1 RMSE
GTO8.2167672.62E−20.0048266.2802091.2129056.367E−4
EMPA8.211953.59E−20.0047427.5607131.2325513.847E−3
MPA8.1849277.94459E−20.00453761192.148235041.2851800591.487E−2
JFS8.1931824.72E−20.00467914.974621.2500529.477E−3
HEAP8.2009744.49E−20.00469611.874681.2469247.425E−3
EO8.2091532.85E−20.0048157.7147031.2180682.888E−3
Table 4. Simulated current and power of GTO for the SDM of the KC200GT PV module.
V e x p   ( V ) I e x p   ( A ) I c a l   ( A ) P e x p   ( W ) P c a l   ( W ) IAE (A)PAE (W)
08.218.210458000.0004580
4.28.1988.19808234.431634.431940.17E−050.00034
8.38.1868.18598967.943867.943711.1E−058.8E−05
12.58.1748.17347102.175102.16840.000530.006619
16.58.1618.16016134.6565134.64260.000840.013864
20.28.1368.135846164.3472164.34410.000150.003115
23.58.0358.035615188.8225188.8370.0006150.01446
26.37.617.610914200.143200.1670.0009140.02405
27.96.9156.915134192.9285192.93220.0001340.00373
29.35.7855.784098169.5005169.47410.00090.02643
30.44.4584.457639135.5232135.51220.000360.01097
31.23.2393.239311101.0568101.06650.0003110.00971
31.92.0062.00585563.991463.986780.000140.004619
32.41.0361.03732533.566433.609320.0013250.04292
32.90−0.00090−0.029510.00090.029507
Table 5. Statistical analysis of recent reported techniques versus GTO for the DDM of the Kyocera KC200GT PV module.
OptimizerMinMeanMaxStd
GTO3.736E−45.795E−46.367E−49.482E−5
EMPA2.425E−32.762E−32.57E−34.98E−5
MPA2.505E−32.762E−32.624E−33.51E−5
JFS2.426E−32.434E−32.443E−35.25E−6
HEAP2.428E−32.473E−32.52E−32.52E−5
FBI [46]2.425E−32.431E−32.443E−34.75E−6
EO2.425E−32.434E−32.453E−39.14E−6
PSO [12]1.2970E−14.5668E−17.9194E−13.1548E−1
LAPO [62]1.1696E−10.127980.132306.3050E−3
PSOGWO [65]0.121780.130130.1354015.5456E−3
BMA [63]0.124920.218580.309028.7014E−2
NLBMA [64]0.0330430.0330430.0330432.6409E−16
Table 6. Parameter estimation using reported techniques versus GTO for the DDM of the Kyocera KC200GT PV module.
AlgorithmIph (A) I S 1     ( μ A ) I S 2     ( μ A ) Rs (Ω)Rsh (Ω) η 1 η 2 RMSE
GTO8.2160072.07E−27.49E−10.004856.5174291.1994241.9666263.736E−4
EMPA8.0305144.25E−123.480.03336927.274851.3807751.3511662.425E−3
MPA8.0303542.624.250.03272830.535371.0676971.3727762.505E−3
JFS8.0302932.351.190.03333928.175021.3561411.3466282.426E−3
HEAP8.0304093.5600.03332628.335471.3535831.3544222.428E−3
FBI [46]8.0305330.07713.440.03333627.296411.3355521.3525672.425E−3
EO8.030541.042.440.03337527.178741.3510351.350972.425E−3
Table 7. Statistical analysis of recent and reported optimization techniques versus GTO for the SDM of the STM6_40/36 PV module.
OptimizerMinMeanMaxStd
GTO1.730E−31.730E−31.730E−31.333E−17
EMPA1.769E−30.0029730.005356.33E−4
MPA3.496E−30.0051760.0058824.47E−4
JFS1.807E−30.0019060.0019975.57E−5
HEAP3.33E−30.0051030.005366.71E−4
EO1.733E−30.0018350.0019895.82E−5
FBI [46]1.73E−30.0017340.0017961.28E−5
ISCE [26]1.73E−30.00172980.00172982.3E−17
ImCSA [71]1.79436E−30.001794360.001794362.11E−14
BHCS [69]1.7298E−30.00183650.003329854.05942E−4
TPBA [68]1.774E−3
SA [23]3.399E−3
Table 8. Parameter estimation using recent and reported optimization techniques versus GTO for SDM of STM6_40/36 PV cell.
AlgorithmIph (A) I S 1     ( μ A ) Rs (Ω)Rsh (Ω) η 1   RMSE
GTO1.6639051.740.00427415.928291.5203031.73E−3
EMPA1.6634182.030.00378816.8781.5377131.769E−3
MPA1.657022.460.00383131.506731.5590413.496E−3
JFS1.6625891.840.00410516.966071.5267951.807E−3
HEAP1.6615275.510.0000123.64261.6586943.33E−3
EO1.6636291.780.00420516.244081.5231461.733E−3
FBI [46]1.663911.740.00428115.917431.5200731.73E−3
ISCE [26]1.663904781.740.00427415.92831.52031.73E−3
ImCSA [71]1.66397120.00291415.840511.53351.794E−3
BHCS [69]1.66391.740.0042715.92831.52031.73E−3
TPBA [68]1.66322.770.00418616.73281.56561.774E−3
SA [23]1.66095.900.004949926.77421.666023.399E−3
Table 9. Simulated current and power of GTO for the SDM of the STM6_40/36 PV module.
V e x p   ( V ) I e x p   ( A ) I c a l   ( A ) P e x p   ( W ) P c a l   ( W ) IAE (A)PAE (W)
01.6631.663458256000.0004580
0.1181.6631.6632523070.1962340.1962640.0002523.000E−05
2.2371.6611.6595508063.7156573.7124150.001450.003242
5.4341.6531.6539146978.9824028.9873720.0009150.00497
7.261.651.65056591211.97911.983110.0005660.00411
9.681.6451.64543060315.923615.927770.0004310.00417
11.591.641.63923353519.007618.998720.000770.008883
12.61.6361.63371269420.613620.584780.002290.02882
13.371.6291.62728580621.7797321.756810.001710.022919
14.091.6191.61831357322.8117122.802040.000690.009672
14.881.5971.60309004223.7633623.853980.006090.09062
15.591.5811.58158837424.6477924.656960.0005880.00917
16.41.5421.54233058825.288825.294220.0003310.00542
16.711.5241.52119263125.4660425.419130.002810.046911
16.981.51.49919474225.4725.456330.000810.013673
17.131.4851.48527526725.4380525.442770.0002750.00472
17.321.4651.4656542425.373825.385130.0006540.01133
17.911.3881.38758936624.8590824.851730.000410.007354
19.081.1181.11839137521.3314421.338910.0003910.00747
21.020−2.4810E−050−0.000522.5E−050.000522
Table 10. Statistical analysis of various techniques versus GTO for the DDM of the STM6_40/36 PV module.
OptimizerMinMeanMaxStd
GTO1.688E−31.714E−31.730E−31.369E−5
EMPA1.735E−30.0033220.0053341.057E−3
MPA2.206E−30.0050920.0065138.21E−4
JFS1.851E−30.0023830.0027842.31E−4
HEAP3.33E−30.0048260.0059318.47E−4
FBI1.721E−30.0017320.0017565.82E−6
EO1.773E−30.0018740.0020617.67E−5
LCROA [73]1.712E−3
EPSO [74]1.8307E−3
FC-EPSO [75]1.772E−3
BA [72]2.1946E−20.0920230.014480592.407E−2
NBA [72]1.8268E−30.00414040.0075981.430E−3
DBA [72]1.7319E−30.0049340.013727962.893E−3
Table 11. Parameter estimation by different optimization techniques versus GTO for the DDM of the STM6_40/36 PV module.
AlgorithmIph (A) I S 1     ( μ A ) I S 2     ( μ A ) Rs (Ω)Rsh (Ω) η 1   η 2   RMSE
GTO1.6639223.244.63E−40.00795617.157091.6443481.0001.688E−3
EMPA1.6636631.601.56E−60.00417116.542721.9910671.5113791.735E−3
JFS1.6631192.272.11E−50.00335517.395511.5504111.8984141.851E−3
HEAP1.6614499.325.53E−60.0000123.84591.66671.6591153.33E−3
FBI1.6638313.201.52E−60.00449416.551241.5830491.5065371.721E−3
EO1.6630111.941.99E−50.00397417.187391.5325211.208841.773E−3
LCROA [73]1.663772.23.28E−60.1671716.74191.57392.0001.712E−3
EPSO [74]1.664816.706.21E−60.500016.8581.166491.870671.8307E−3
FC-EPSO [75]1.66341.859.72E−50.0110116.59141.58181.54451.772E−3
BA [72]1.6379411.59 3.94 E−50.00388724.69581.5045361.47832.194577E−2
NBA [72]1.6628656.60 1.61 E−60.00465316.6940491.6788061.5118671.82684E−3
DBA [72]1.6638601.80 3.66 E−60.00416716.0665031.5240981.439391.731960 E−3
Table 12. Experimental and simulated current and power of GTO for the DDM of the STM6_40/36 PV module.
V e x p   ( V ) I e x p   ( A ) I c a l   ( A ) P e x p   ( W ) P c a l   ( W ) IAE (A)PAE (W)
01.6631.65900933000.003990
0.1181.6631.6589241130.1962340.1957530.004080.000481
2.2371.6611.6573713513.7156573.707540.003630.008117
5.4341.6531.6548021598.9824028.9921950.0018020.00979
7.261.6501.65294087911.97912.000350.0029410.02135
9.681.6451.64899178515.923615.962240.0039920.03864
11.591.6401.64248098719.007619.036350.0024810.02875
12.61.6361.63614020120.613620.615370.000140.00177
13.371.6291.62878370221.7797321.776840.000220.002892
14.091.6191.61878026922.8117122.808610.000220.003096
14.881.5971.60245829123.7633623.844580.0054580.08122
15.591.5811.58017979524.6477924.6350.000820.012787
16.41.5421.54077965825.288825.268790.001220.020014
16.711.5241.51982325325.4660425.396250.004180.069793
16.981.5001.49818204225.4725.439130.001820.030869
17.131.4851.48451457625.4380525.429730.000490.008315
17.321.4651.4652409325.373825.377970.0002410.00417
17.911.3881.38833791124.8590824.865130.0003380.00605
19.081.1181.11890638421.3314421.348730.0009060.01729
21.020−0.000282740−0.005940.000280.005943
Publisher’s Note: MDPI stays neutral with regard to jurisdictional claims in published maps and institutional affiliations.

