
Analysis of Water and Mud Inrush in Tunnel Fault Fracture Zone—A Case Study of Yonglian Tunnel

1
Geotechnical and Structural Engineering Research Center, Shandong University, Ji’nan 250061, China
2
School of Transportation and Civil Engineering, Shandong Jiaotong University, Ji’nan 250357, China
3
Jiangxi Provincial Communications Investment Group Co., Ltd., Nanchang 330025, China
*
Author to whom correspondence should be addressed.
Sustainability 2021, 13(17), 9585; https://0-doi-org.brum.beds.ac.uk/10.3390/su13179585
Submission received: 28 March 2021
/
Revised: 12 August 2021
/
Accepted: 15 August 2021
/
Published: 25 August 2021
(This article belongs to the Special Issue Advances in Geotechnical Engineering during Deep Energy Exploitation)
Abstract
:Water and mud inrush disaster is easily induced during tunnel construction through water-rich fault fracture zones. In this paper, based on the field data, the process of water and mud inrush in tunnels is introduced in detail, and generation conditions and evolution mechanisms have been analyzed. Results show that the key factors of water and mud inrush include poor strata lithology, abundant groundwater and tunnel excavation disturbance. These key factors provide material conditions, source power and start-up conditions for water inrush, respectively. The evolution process of water and mud inrush can be divided into three stages: generation, development and occurrence. During generation stage, a seepage channel expands continuously, with water flow increasing gradually until a large range of loose zone is formed. During the development stage, a large amount of groundwater and a large range of softened muddy rock mass accumulates around the tunnel. During the occurrence stage, the “protective layer” and initial supports suddenly lose stability and are destroyed. These research results could provide some references for the effective prediction and forewarning of similar engineering disasters.
1. Introduction
With the continuous expansion of the scale of tunnel construction, more and more tunnels are built in mountainous areas with extremely complex geological conditions. Among them, a water-rich fault fracture zone is an unsuitable geological body through which tunnels often pass, featuring a rich water content, loose structure and weak cementation ability. These characteristics can easily lead to water and mud inrush during tunnel excavation and construction, which seriously threatens the safety of construction workers [1,2,3,4]. Therefore, revealing the mechanisms of water and mud inrush induced by tunnel excavation through water-rich fault fracture zones is greatly significant as it can provide a forewarning for this disaster, and therefore avoid injury and death to workers and financial losses as much as possible.
A lot of research has been carried out on the evolution mechanism of water and mud inrush during tunnel excavation through fault fracture zones. Li et al. [5] studied geological structure based on the water and mud inrush disaster of the Lingjiao tunnel, revealing that the geological identification of water-bearing and mud-filling structures is crucial for inrush disaster. Yang [6], Zhang [7], and Yang et al. [8] have conducted water and mud (or sand) inrush model tests of different scales, which revealed the evolution law of multi-physical fields prior to water and mud(or sand) inrush, and the quantitative change law of water and mud (or sand) inrush volume during the occurrence process. Shi [9], Li [10] and Wu et al. [11] have investigated the mechanism of fault water inrush by means of rock mechanics and fractal theory, and reaped rich fruits from their research, providing theoretical guidance for studies on the mechanism of fault water and mud inrush in tunnels, mines, hydropower stations and other underground projects. Zhang et al. [12] employed FLAC3D to simulate and analyze the change law of the permeability of the surrounding rock and the mechanical mechanism of water inrush under the influence of mining. Lin et al. [13] developed a new quantitative method for the risk assessment of water inrush in karst tunnels based on variable weight function and an improved cloud model. Furthermore, some methods or models were put forward to evaluate the risk of water inrush [14,15]. Based on some hazard cases, the characteristics and causes of water inrush were analyzed [16,17].
The aforementioned research is of great significance to promote a study on the mechanism of water and mud inrush in tunnels. In these numerical and experimental studies, it is always hypothesized that the surrounding rocks are homogeneous and isotropic. However, in reality, the surrounding rocks are heterogeneous and anisotropic. Thus, it is hard to fully and truly reflect the occurrence process of water and mud inrush in tunnels constructed in fault fracture zones. The conditions and evolution mechanism of water and mud inrush in tunnel faults are described in many papers. For example, Zhao et al. [4] classified the disaster types of water inrush and mud inrush, and mainly summarized the disaster management methods. Based on the analysis of the water and mud inrush accident in the karst section of Jiulong tunnel, Lin et al. [18] summarized the main factors of water inrush. According to the experience of the design and construction of the tunnel in the karst section, the prevention and control measures of water inrush in the karst tunnel section are put forward. However, most of the paper focuses on the classification of water and mud inrush and lacks an in-depth analysis of the process and mechanism of water and mud inrush.
In this paper, water and mud inrush in the F2 fault of Yonglian Tunnel in the Jiangxi Province of China is taken as a typical case project. The process of water and mud inrush in the left and right tunnels during the tunnel’s construction is introduced in detail, from aspects of time, scale and the consequences of inrush. Based on this, generation conditions and the evolution mechanism of water and mud inrush in tunnel faults are revealed.
2. General Description of Yonglian Tunnel Project
Yonglian Tunnel is located in west section of the Ji’an-Lianhua Expressway in the Jiangxi Province of China. The longitudinal slope of the tunnel is a two-way slope. Yonglian Tunnel is a separated long tunnel. The left tunnel spans from the mileage of ZK90 + 34 to ZK92 + 835, with total length of 2486 m and designed floor elevations of entrance and exit 172.93 m and 195.01 m, respectively. The right tunnel spans from the mileage of YK90 + 335 to YK92 + 829, with total length of 2494 m and designed floor elevations at the entrance and exit of 172.73 m and 194.82 m, respectively.
2.1. Topography
The tunnel passes through denuded hills with undulating topographical conditions. The ridge direction runs roughly from north to south, and most of the hills are covered by vegetation. The low mountain slope is 15~30°. Starting from the entrance along the axis of tunnel, ground elevation increases gradually, in which there is a slight undulation. The highest point of ground elevation is located at K91 + 830 m, with an elevation of 500.1 m. From K91 + 830 to the exit section, ground elevation decreases gradually. In the entrance section of tunnel, the mountain is clamped in two gullies from east to west, and the surface accumulation layer collapses locally. To the east of entrance is an alluvial plain, and the terrain is flat and open. The right side of the exit section of tunnel is close to gully.
2.2. Stratigraphic Structure and Lithologic Characteristics
According to the analysis of engineering geological data and borehole data, the stratigraphic structure of the tunnel, from top to bottom, is Quaternary residual alluvium stratum(Q2el+dl), Carboniferous Datang stage stratum(C1d) and Devonian Shetianqiao group stratum (D3S). The lithologic characteristics of each stratum are described as follows:
(1) Quaternary residual alluvium stratum (Q2el+dl)
This stratum mainly includes silty clay and gravel soil distributed on the hill surface. Silty clay contains 10~20% crushed stones which are mainly comprised of quartz sandstone and sandstone fragments, with a thickness of 2~5 m. Gravel soil contains 50~60% crushed stone filled or cemented with silty clay, with an exposed layer thickness of 3.4 m~9.0 m.
(2) Carboniferous Datang stage stratum (C1d)
This stratum contains the Ceshui group (C1d2) and Zimenqiao section (C1d3), which are mainly distributed near exit of tunnel. The C1d2 is mainly composed of moderately weathered sandstone and shale, and the Zimenqiao section (C1d3) composed of the full, strong and moderate weathering of limestone with silty shale and dolomitic limestone.
(3) Devonian Shetianqiao group stratum (D3S)
There are sandstone and shale with different degrees of weathering (full weathering, strong weathering and moderate weathering) distributed irregularly within this stratum. In an interbedded or interlayered way, they (particularly the sandstone) are developed with different thicknesses in the middle and upper parts of the slope and ridge. Among them, fully weathered sandstone and shale have weak structural strength and are easy to disintegrate in the form of gravel. Strongly weathered sandstone is mainly distributed in surface layer of hill, generally with thicknesses ranging from 22 m to 38.5 m, and this layer is the main rock that surrounds the entrance. Strongly weathered shale develops in sandstone with low regularity.
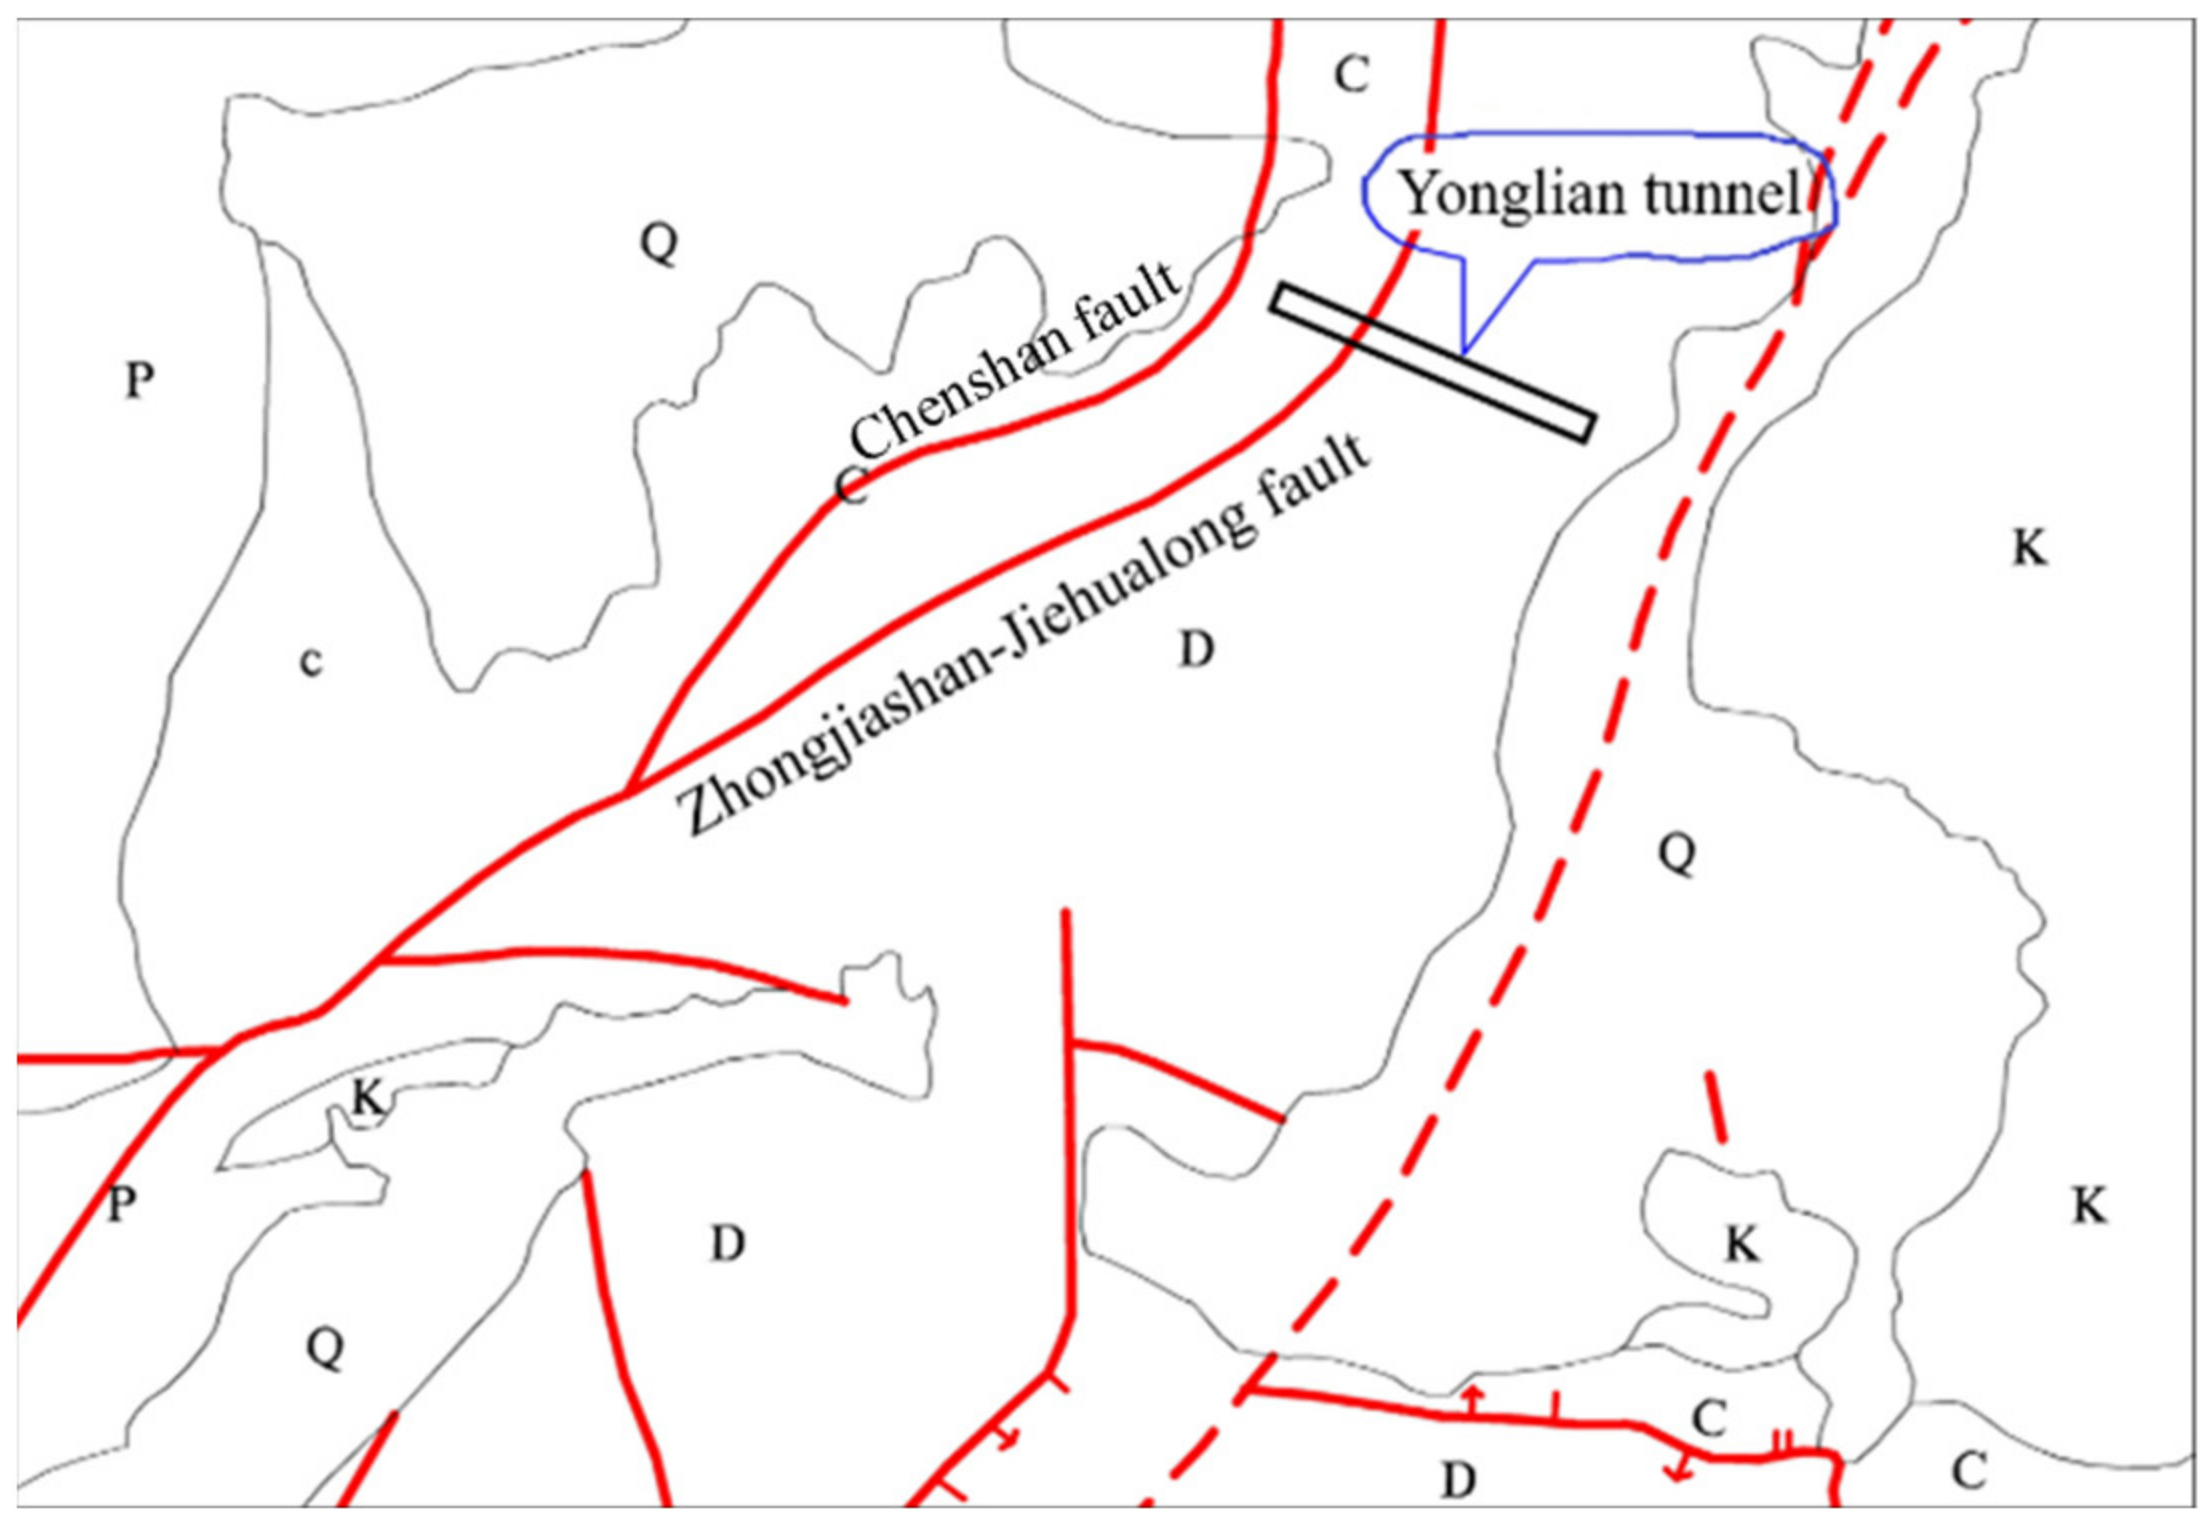
2.3. Geological Structure
An outline of the regional geological structure near the tunnel is shown in Figure 1. There are two regional large faults in the affected area of Yonglian tunnel: Mount Chenshan fault and Zhongjiashan-Jiehualong fault. Mount Chenshan fault is located near the Heshui River at the entrance of the tunnel, with a strike of NEE 70°~80°, dip of SE, and length of 70 km, which is normal for a fault. Zhongjiashan-Jiehualong fault passes through the tunnel at K92 + 250 with a strike of NE and development length of more than 10 km. There are also a series of NW-trending faults that have developed in the area, with a small scale and a length of hundreds to thousands of meters.
Under the influence of the regional geological structure, many smaller faults have developed in the tunnel area. According to the results of geophysical exploration and drilling, faults F1, F2, F3, F4 and F5 have developed near the tunnel (see Figure 2). During the excavation of Yonglian tunnel, water and mud inrush disasters all occurred in area of the F2 fault. The F2 fault passes through Yonglian tunnel at K91 + 350 which intersects with the 45° tunnel axis, with a strike of SSE, dip of E, dip angle of 84°, fault width of 15 m~35 m, and an extension length of 520 m. Rock mass fissures in the F2 fault zone are developed, or well-developed, with rock mass broken or extremely broken; the core recovery rate is 55~65%, RQD < 10. The uniaxial compressive strength of the rock is 400 kPa.
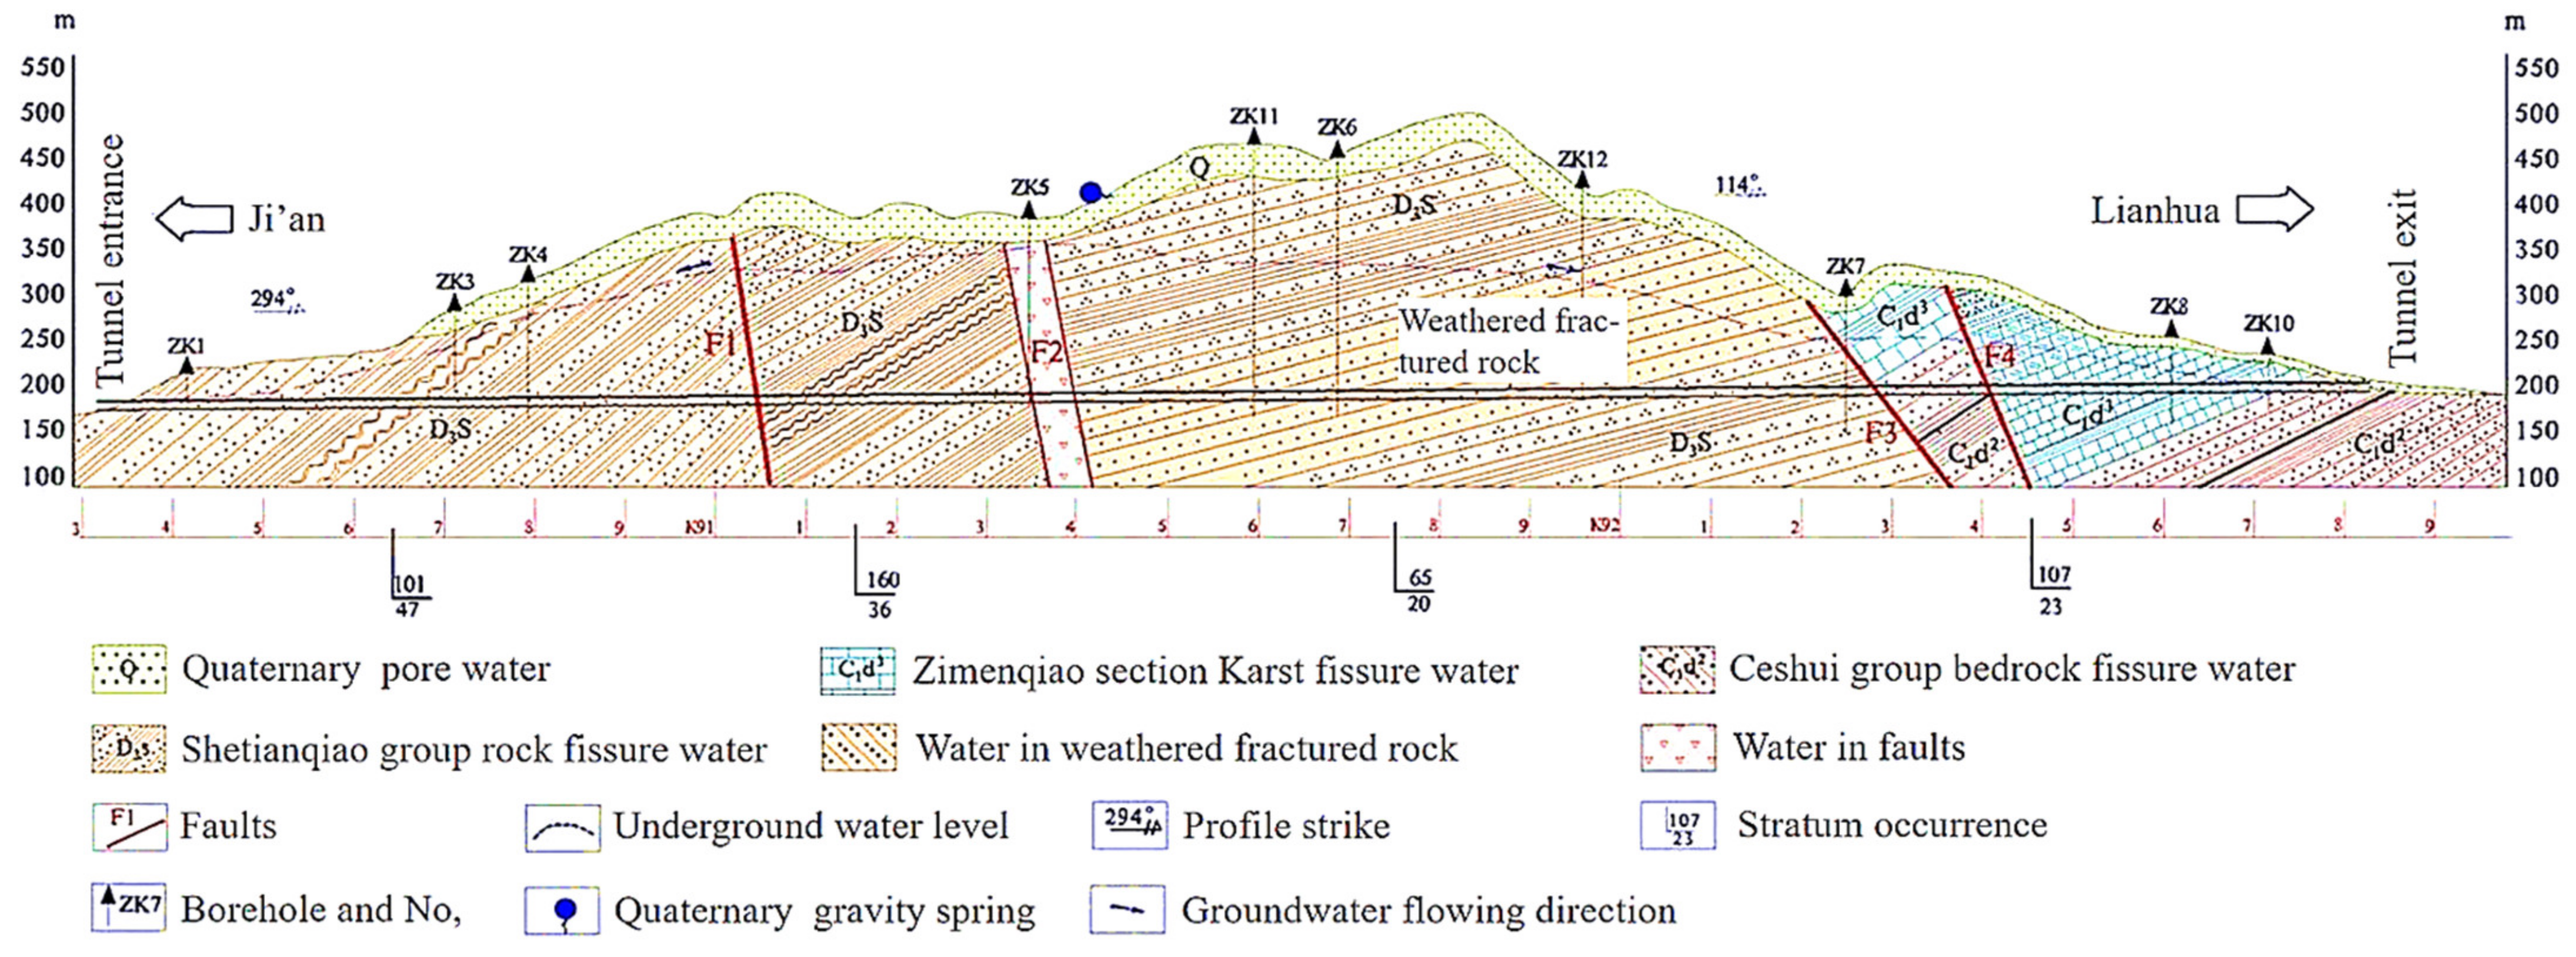
2.4. Hydrogeology
The main types of groundwater in the tunnel area are the Quaternary pore water, bedrock fissure water and Karst water. The hydrogeological profile of the tunnel is shown in Figure 2.
Quaternary pore water: mainly occurs in the Quaternary residual alluvium, and its water content is directly controlled by atmospheric precipitation. In rainy seasons, water is greatly supplied, while in dry seasons it is in poor supply, causing some areas to dry out.
Bedrock fissure water: occurs in rock fissures and can be divided into weathered fissure water and structural fissure water in the tunnel section. Weathered fissure water mainly occurs in the shallow part of the strong–moderate weathering zone, whose development depth is generally 20 m to 100 m. Consequently, weathered fissure water is generally pressure-free, but it is often semi-pressure-bearing in the deeper part. Structural fissure water, which mainly occurs in structural fault zones, especially extensional fault zones, is deeply developed, controlled by structure, and often pressure-bearing.
Karst water: it mainly exists in karst caves, and karst development in this area is only revealed in the K92 + 300~K92 + 750 section at the exit of the tunnel. It features small distribution areas and receives a water supply from rainfall.
3. Water and Mud Inrush in F2 Fault
After the construction of Yonglian Tunnel entered the F2 fault, more than ten large-scale, long-lasting and destructive water and mud inrush disasters occurred in left and right tunnels of the entrance. As a result, the ground surface collapse occurred at top of the tunnel after water and mud inrush, resulting in great economic losses and a delayed construction deadline.
3.1. Water and Mud Inrush in Left Tunnel of the Entrance
From 2 July to 18 August 2012, large-scale water and mud inrush occurred in the left entracne of the tunnel eight times in total, bursting out mud and water measuring around 50,000 m3. The outlet of mud and water inrush was located on the right side of the tunnel supports at ZK91 + 316, which was an irregular circular cavity with a diameter of about 1 m. In the first three occurrences of water and mud inrush, the amount of outburst water was larger than mud, while in the other occurrences, mud takes up a larger part with relatively less water. The occurence of water and mud inrush in the left tunnel is shown in Table 1.
First water and mud inrush: the tunnel construction team began to deal with the original small-scale collapse body and replaced the grid steel frame on 26 June. On 29 June, the replacement operation reached ZK91 + 311 mileage. A small amount of yellow mud water seeped out from the arch foot of the right wall at ZK91 + 308 mileage, expanding gradually with the increasing amount of water outlet point. With advance of excavation, the water outlet points gathered to the ZK91 + 308 arch shoulder, and water flow also increased gradually. At 8:00 a.m. on 2 July, when construction reached ZK91 + 316, the outlet point was transferred to the right arch shoulder of the tunnel face, and water flow increased gradually and then decreased. At 11:30 p.m. on 2 July, the first water and mud inrush appeared on right side of left tunnel of the entrance, with a rapid gush of about 1400 m3 water and some 600 m3 mud.
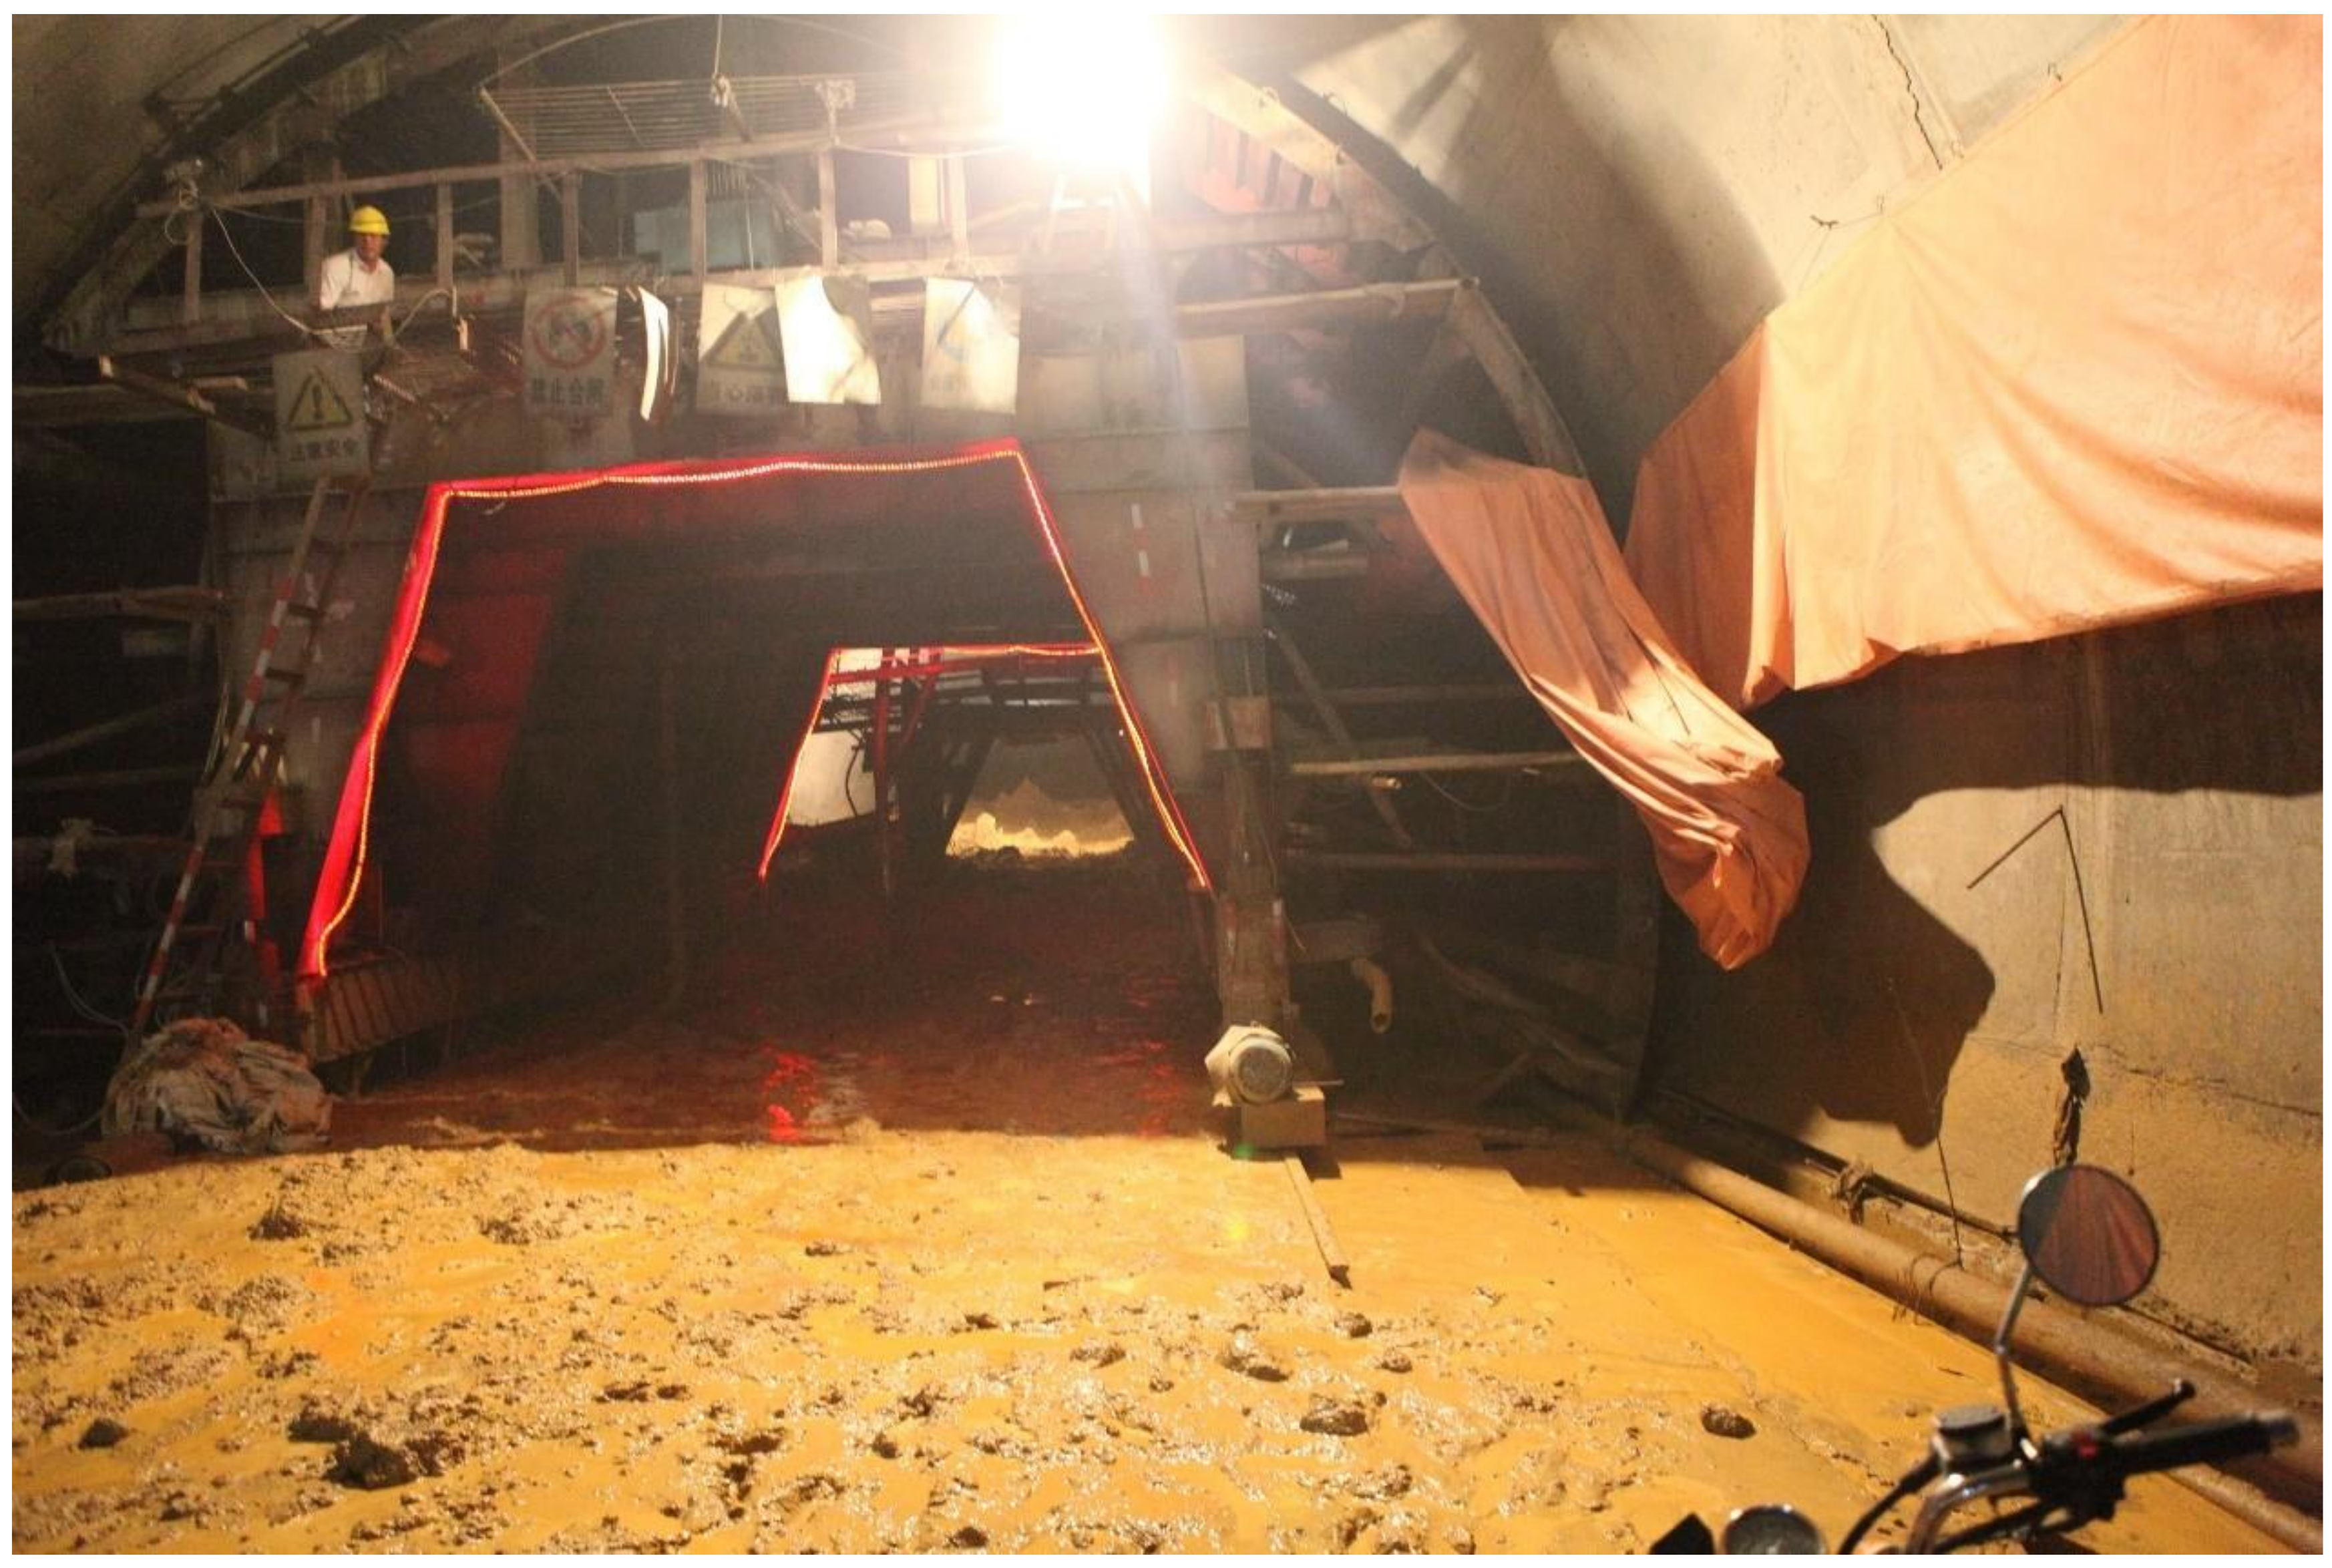
Second water and mud inrush: at 4:20 a.m. on 3 July, the second water and mud inrush occurred at the same location as the first inrush (Figure 3). The volume of outburst water reached around 3800 m3 and the cumulative mud volume reached around 1200 m3.
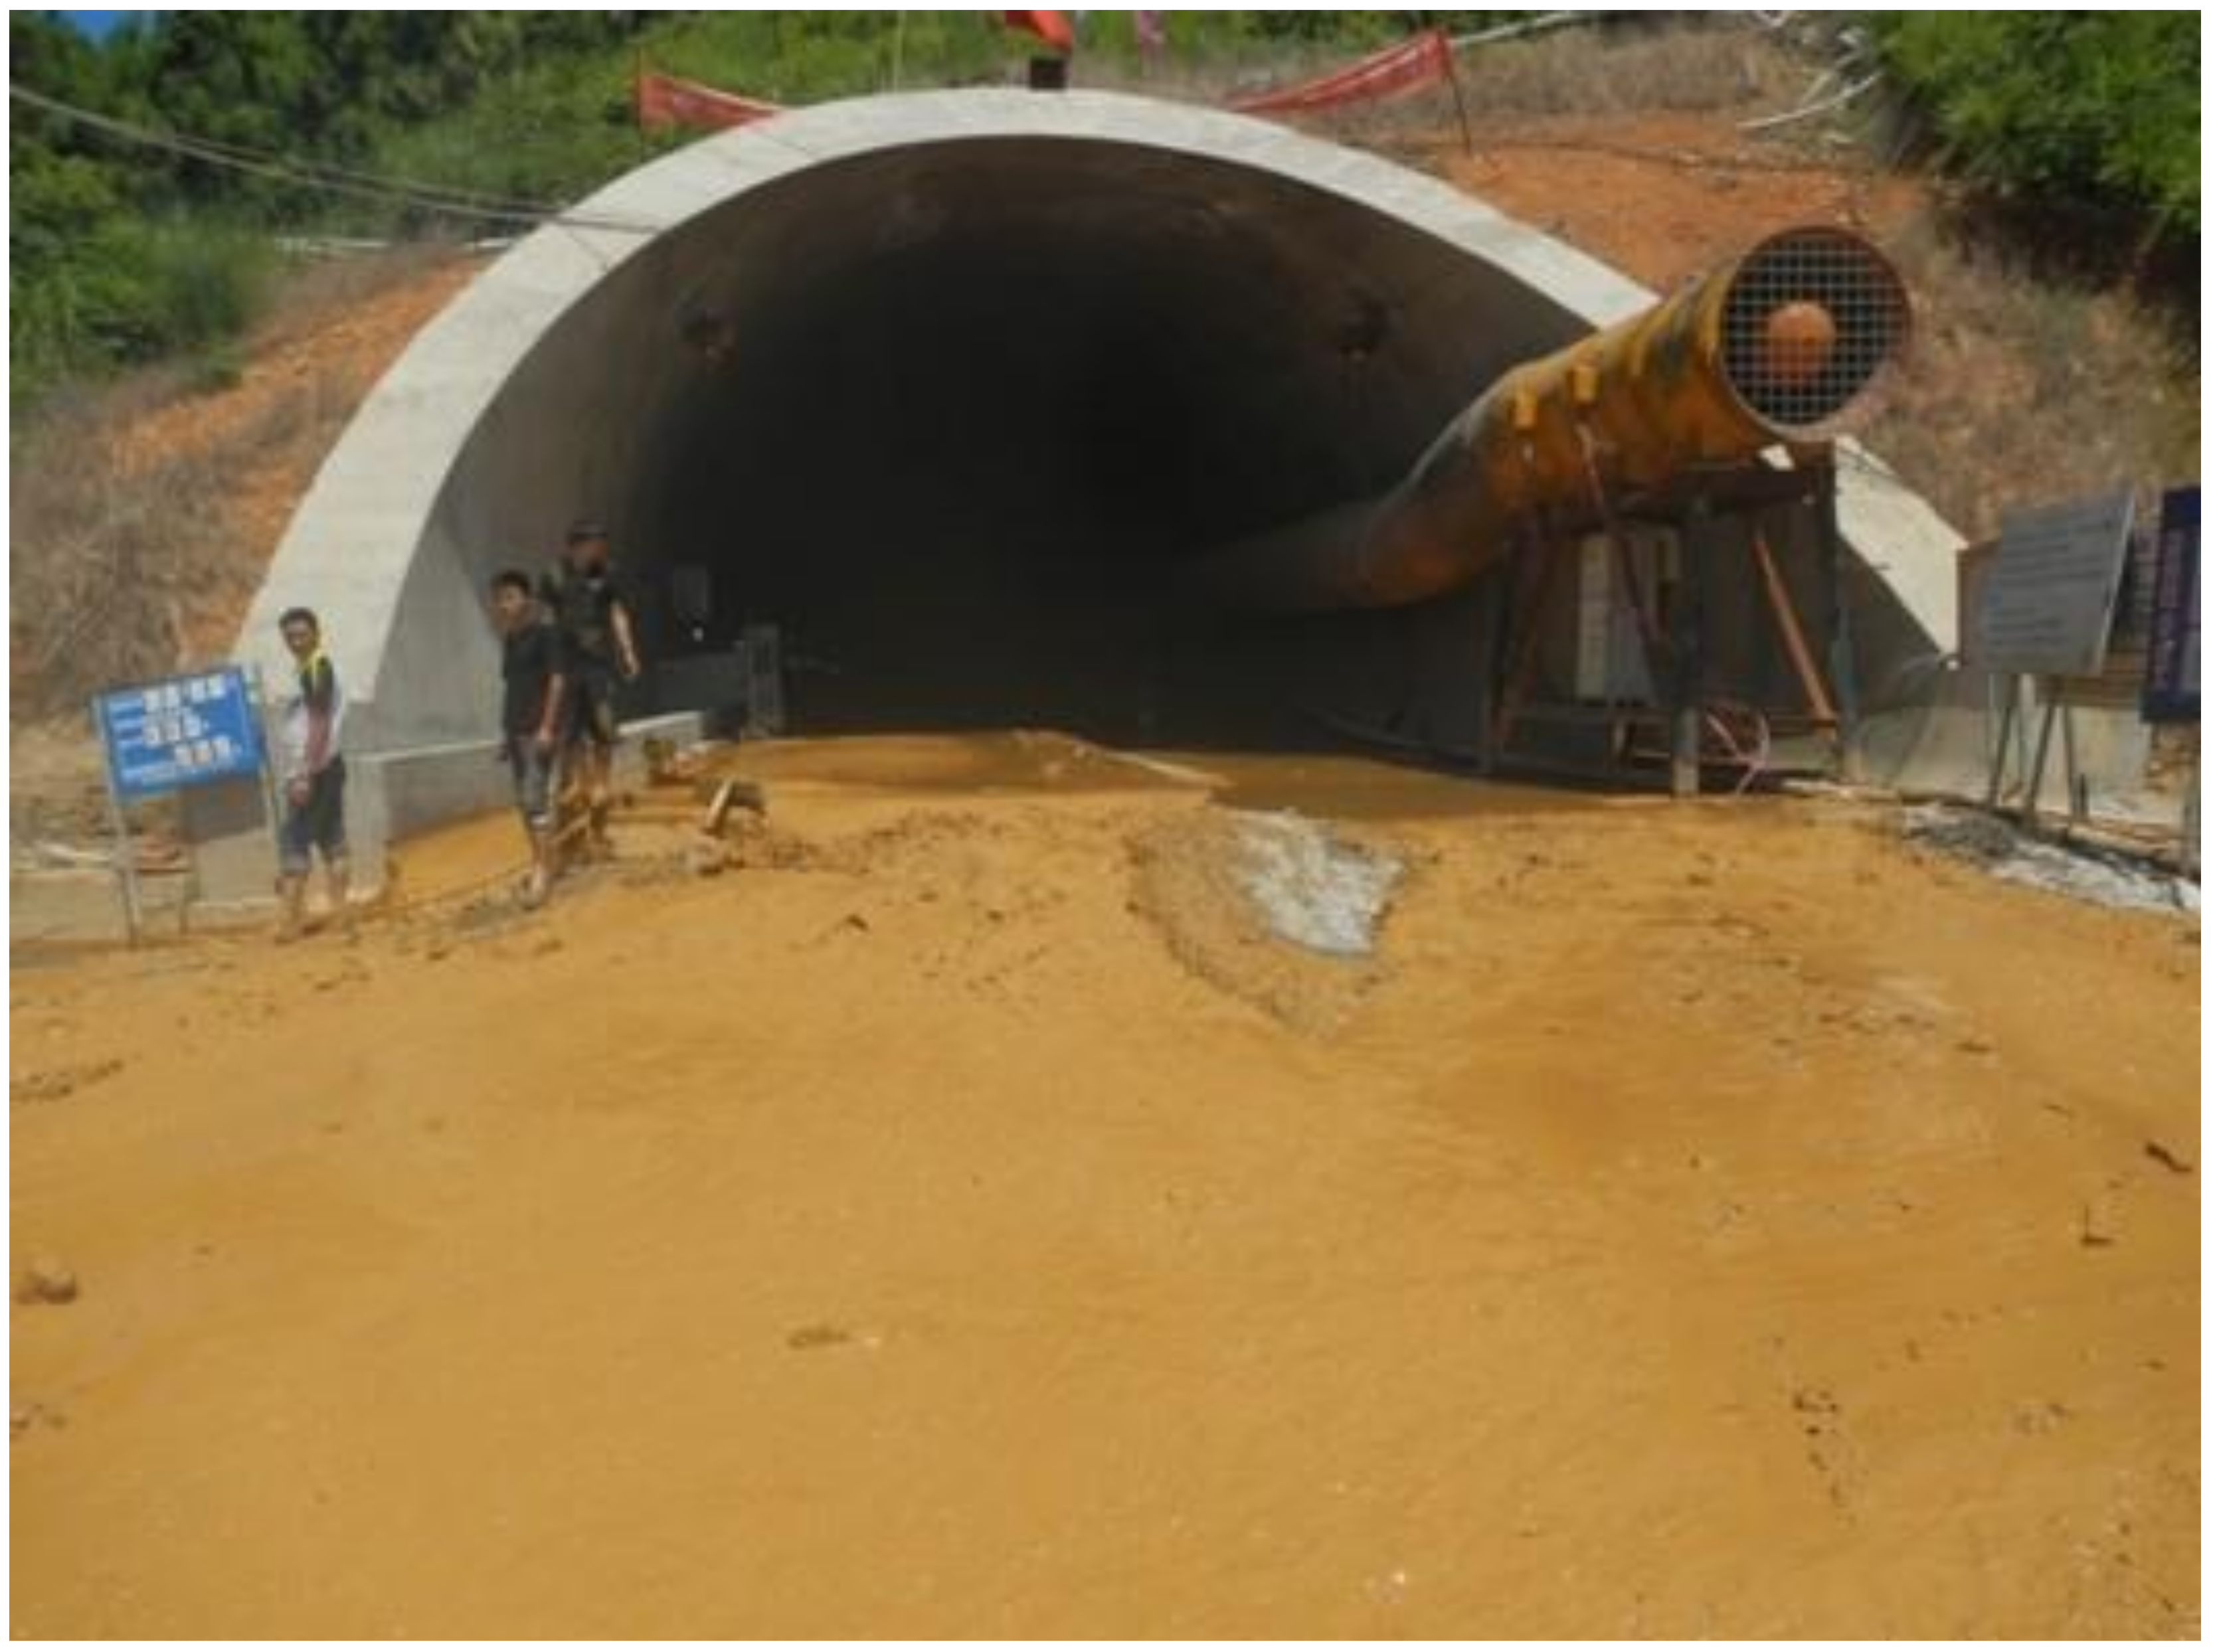
Third water and mud inrush: at 10:50 a.m. on 3 July, yellow mud water mixed with sand and gravel spewed out of the original water and mud inrush position (Figure 4), rushing straight toward people nearby. An off-road vehicle, which was about 30 m away from the tunnel face and yet to evacuate, was washed away by muddy water for about 20 m and fell into the ditch. During 10 mins of the third water and mud inrush, a total of around 27,000 m3 of mud water gushed out, and about 3000 m3 of mud was deposited near the tunnel face.
Fourth water and mud inrush: after the accumulated silt was cleaned on 12 July, the operation team drilled 19 holes on the right side of tunnel supports for drainage at ZK91 + 315, from 11–14 July. From 5:00 p.m. on 14 July to morning on 15 July, the sound of rumbling intermittently occurred near the tunnel face of the left tunnel, accompanied by the rumbling of collapse and inrush. Water and mud inrush as well as collapse appeared on the tunnel face, where about 1100 m3 accumulated silt gushed out; however, no large amount of water was observed in the inrush.
Fifth water and mud inrush: after the accumulated silt of the fourth water and mud inrush was cleaned on 23 July, at about 2:30 p.m. on 24 July, without obvious warning, the mud inrush occurred again, resulting in a lining trolley, which was about 50 m away from tunnel face, moving backward by about 10 m. The accumulated silt volume was about 4000 m3, but no large amount of water was observed.
Sixth to eighth times of water and mud inrush: on 13, 15 and 19 August, after the partial cleaning of accumulated silt of water and mud inrush, more inrushes occurred at the tunnel face for the sixth, seventh and eighth time, and the total amount of gushing accumulated silt was about 4200 m3.
During the aforementioned large-scale water and mud inrushes, huge quantities of mud gushed out imperceptibly from time to time, accumulating to about 3000 m3.
3.2. Water and Mud Inrush in Right Tunnel of the Entrance
From 12 August to 25 October, 2012, seven large-scale water and mud inrushes occurred in the right tunnel, with a mud inrush mouth of about 3 m × 4 m. Compared with the left tunnel, the right tunnel spouted a larger amount of mud totaling about 22,500 m3 and a small amount of water. The circumstances of water and mud inrushes in the right tunnel are shown in Table 2.
First water and mud inrush: at the end of June 2012, beyond-limit value appeared at the initial supports of the YK91 + 359~409 section of the tunnel, and developed continuously over time. The maximum beyond-limit value of the cross-section (YK91 + 380 position) reached 3 m. On 4 July, the operation team began to replace the initial supports. On 15 July, water first appeared in the vault at YK91 + 385 when the initial support was being switched; the beyond-limit value at this position further increased after 28 July. On 12 August, a 3 × 4 m hole was formed on left side of YK91 + 380 and, accompanied by the sound of falling blocks, the first water and mud inrush appeared, leading to the collapse of a workbench. Initial supports suffered from serious extrusion and deformation. The volume of water gushing from the hole was about 500 m3 and the accumulated silt was about 600 m3.
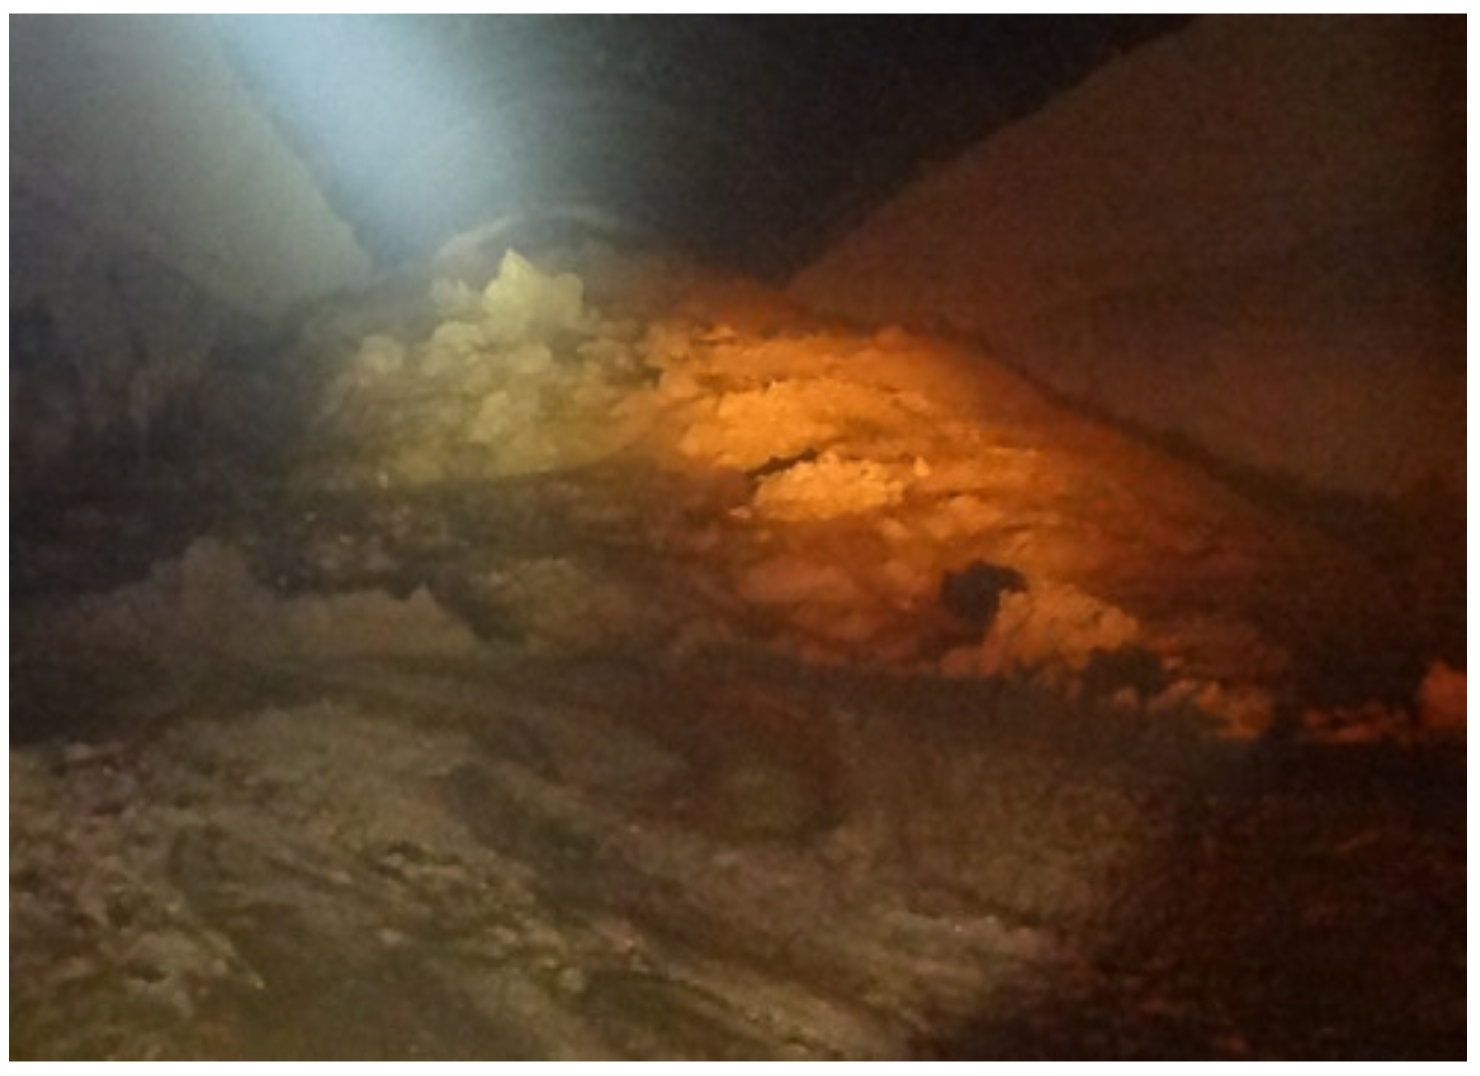
Second water and mud inrush: on 18 September, the flow of muddy water gushing from the vault at YK91 + 376 increased rapidly, showing a jet shape, and the beyond-limit value of initial supports at the replacement position was further developed. On 19 September, the left side of the new replacement position (YK91 + 370~376) collapsed and mud began to burst at 11:00 a.m. (shown in Figure 5). Around 900 m3 of water and 2100 m3 of silt burst from the hole.
Third water and mud inrush: recorded from 3:50 p.m. to 4:10 p.m. on 23 September near YK91 + 374 with sound of rumbling (shown in Figure 6). Accumulated mud gushing from the hole approached 4200 m3, with the farthest edge located about 140 m away from the tunnel face. This water and mud inrush pushed the lining trolley (located 25 m away from the tunnel face) back to about 70 m.
The fourth and fifth water and mud inrushes were recorded on 1 October. Accumulated silt was cleaned up near the outburst hole of YK91 + 365. Two large-scale water and mud inrushes occurred at about 9:40 p.m. and 11:00 p.m. in the evening, spouting approximately 2200 m3 of mud.
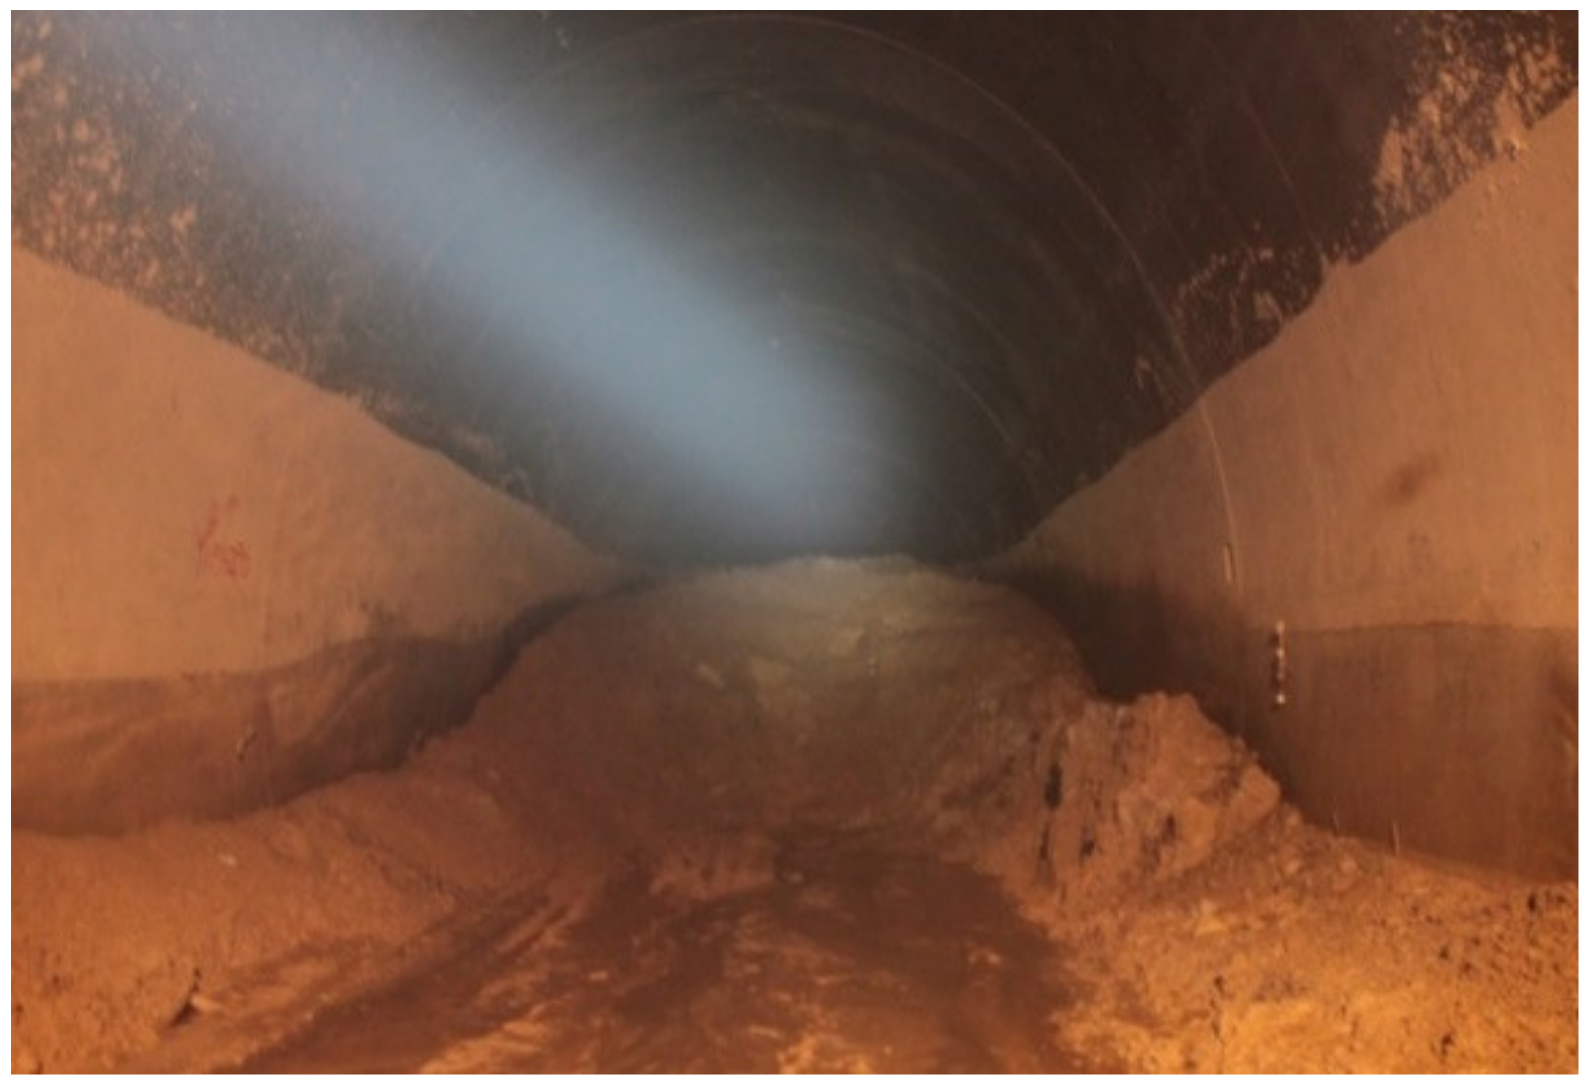
The sixth water and mud inrush was recorded at 7:30 a.m. on 7 October. When the mud was cleaned up near YK91+374, the sixth water and mud inrush occurred at the collapse hole (shown in Figure 7), causing mud to gush back to YK91 + 255. The accumulated silt was around 4900 m3.
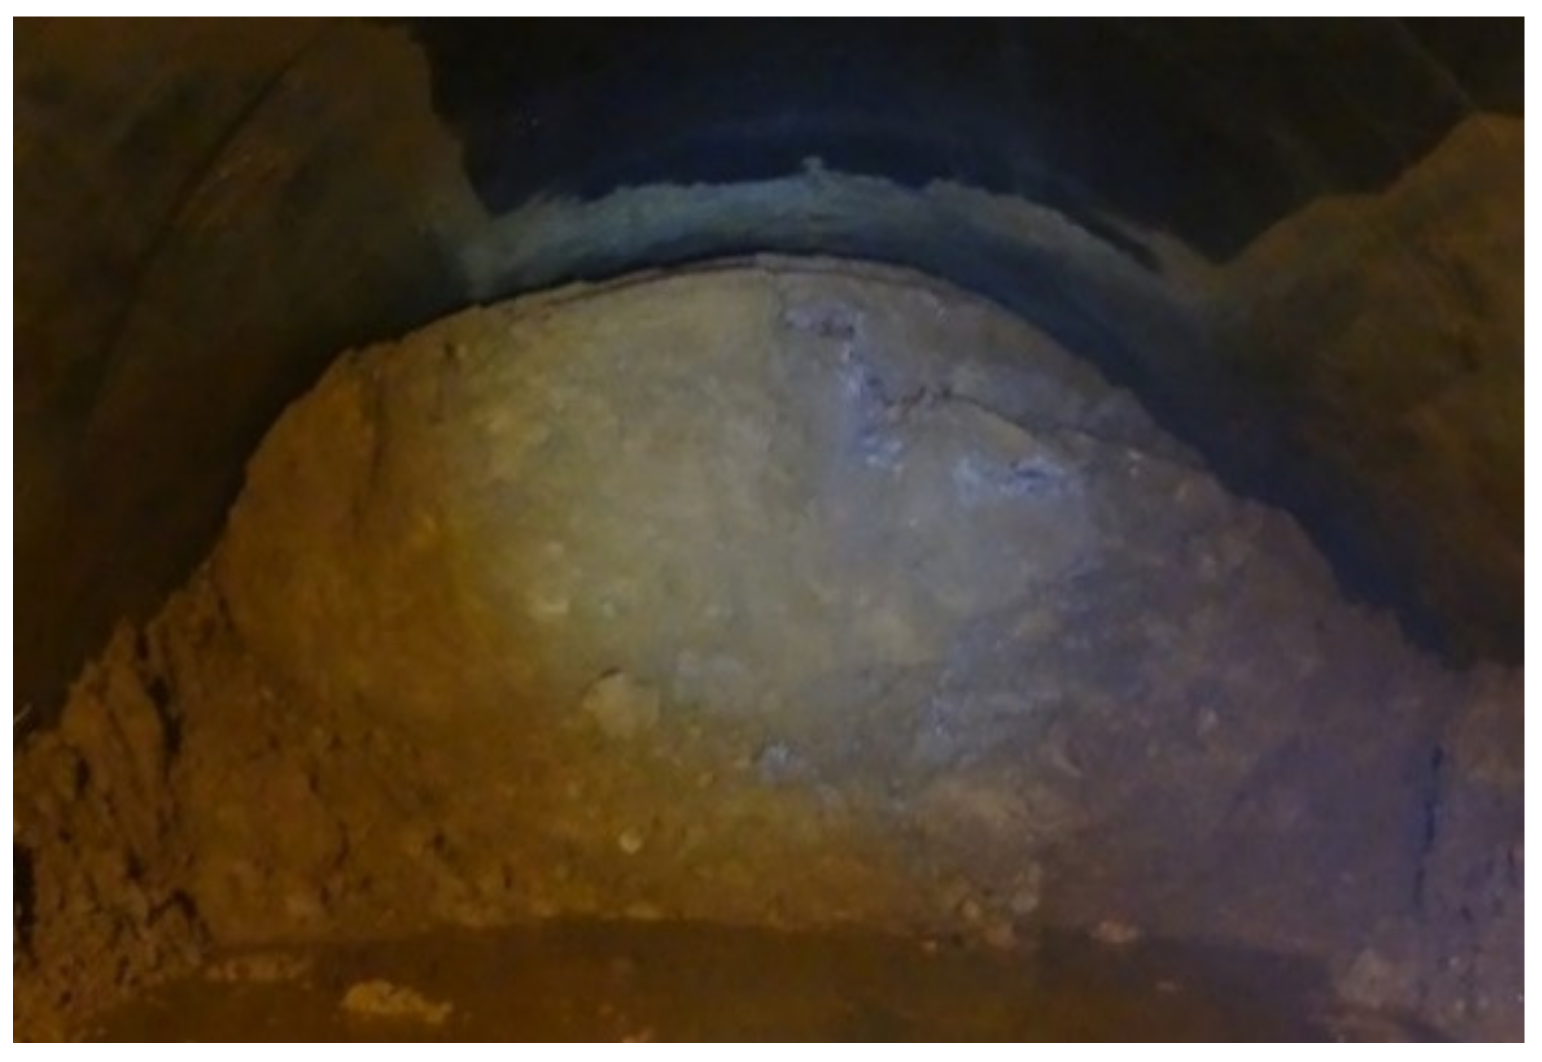
The seventh water and mud inrush was recorded at 1:30 a.m. on 25 October. When the mud in the entrance to the right tunnel was cleaned, a large-scale water and mud inrush occurred again in the right tunnel (shown in Figure 8). About 8500 m3 of mud gushed to YK91 + 255 and the cross-section 80 m behind the collapse hole was completely filled with silt.
3.3. Subsidence Collapse of the Surface Hilltop
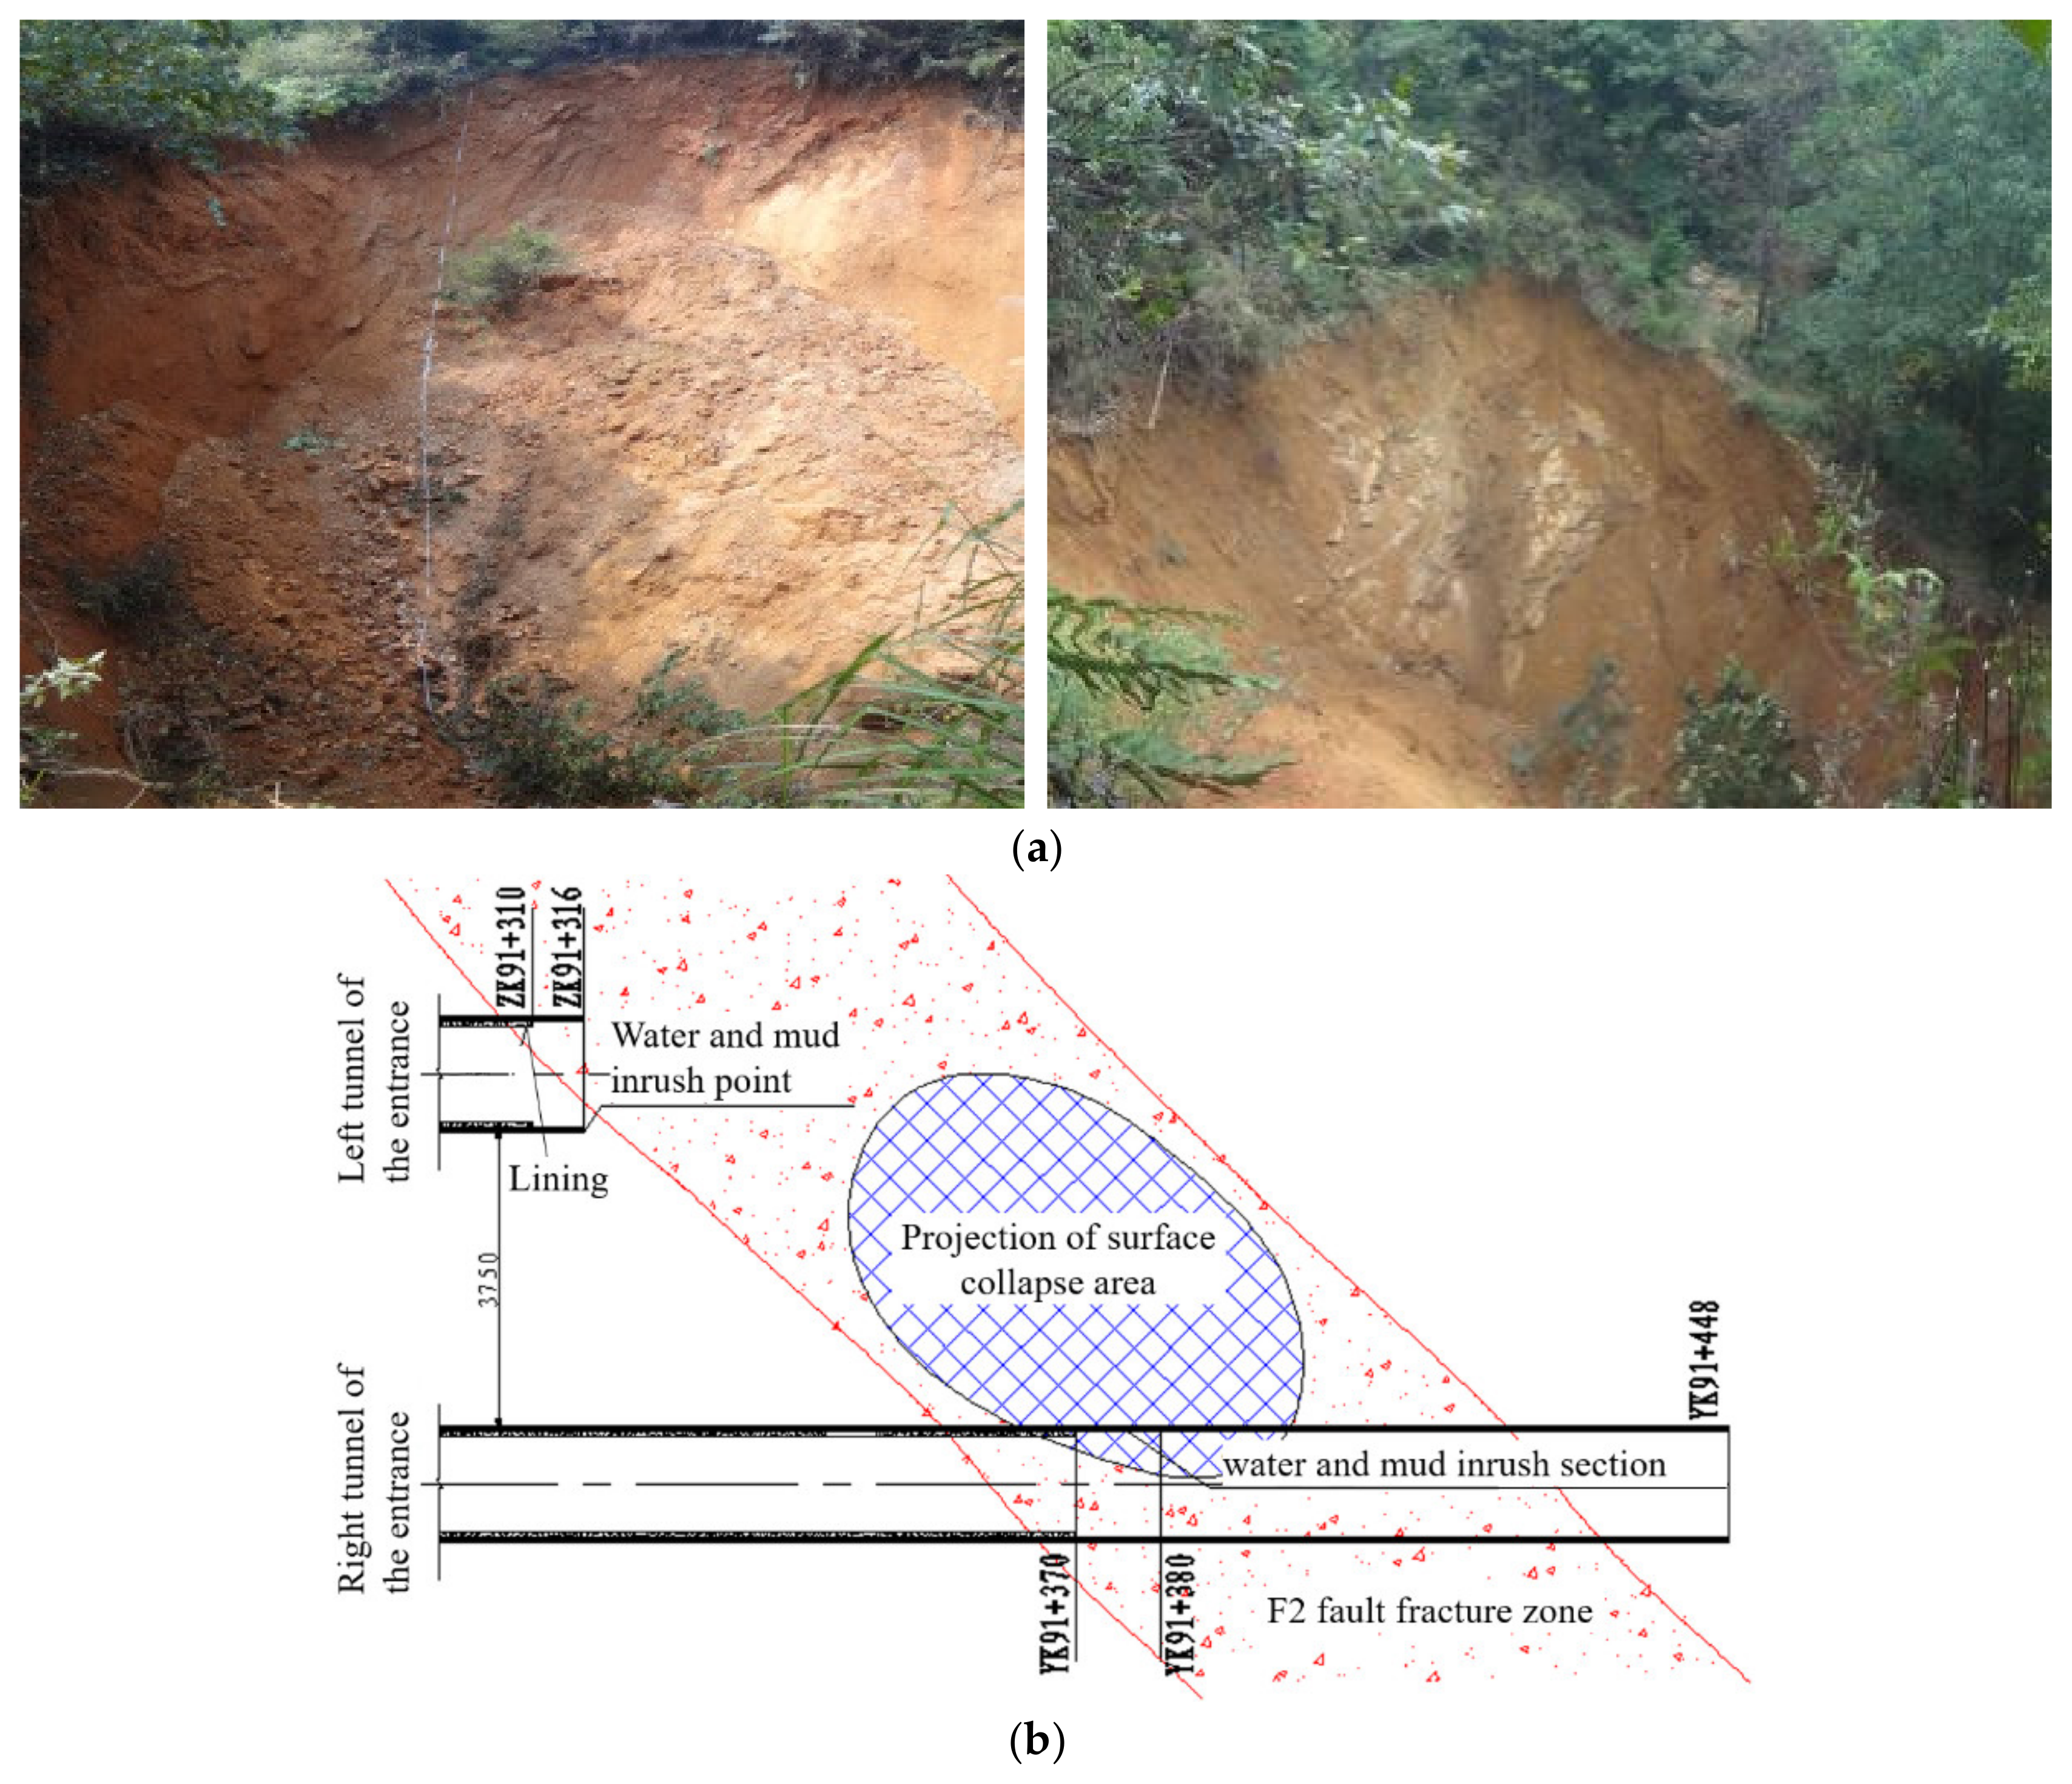
After first and second large-scale water and mud inrushes in the entrance to the right tunnel, there was no obvious anomaly at the top of the entrance hilltop. After the third water and mud inrush occurred on 23 September 2012, an obvious subsidence collapse of the surface could be found about 20 m away from YK91 + 371~389 on the inner side of the right tunnel (in the F2 fault, next to the ZK5 drill hole) (shown in Figure 9). The elevation difference between the hilltop and tunnel design line was about 190 m. The ground subsidence plan was irregular and round, with a diameter of about 25 m, an area of about 500 m2 and a depth of about 8 m to15 m. The area and depth of the collapsed ground further expanded due to the occurrence of water and mud inrushes. During a survey on November 11th, the subsidence plane at the hilltop represented an irregular oval, with a major and minor axis of about 62 m and 46 m, an area of about 1800 m2 and a depth of about 15 m to 32 m.
4. Occurrence Mechanism Analysis of Water and Mud Inrush in F2 Fault
Geological disasters can easily occur when tunnel construction passes through a fault zone. Due to the differences in rock mass structure, groundwater environment and the construction methods near a fault zone, the disaster can be shown in different forms such as water gushing, water and mud inrush or rock outburst. Based on the case of water and mud inrush in the F2 fault of Yonglian Tunnel, this section aims to analyze the catastrophe mechanism of water and mud inrush during tunnel excavation in the F2 fault from the perspective of generation conditions and the evolution process.
4.1. Generation Conditions of Water and Mud Inrush
When tunnel construction encounters a fault fracture zone or saturated soft surrounding rock, it is easy to find a mixture of water and mud (stone) spouting out on a large scale, acting like debris flow and causing strong destructive damage to the tunnel. Based on the analysis of cases of water and mud inrushes from tunnel faults, there are some similarities between the occurrence of water and mud inrush (especially mud inrush) and the formation of surface debris flow. Similarly, certain basic conditions are also needed for the process of water and mud inrush to occur, including rich loose broken materials, groundwater and engineering excavation disturbance [19]. Combined with the characteristics of water and mud inrush in the F2 fault of Yonglian tunnel, and giving a comprehensive consideration of geological and engineering factors, the conditions for the occurrence of water and mud inrush in the F2 fault mainly include poor stratum lithology, abundant groundwater and the disturbance of tunnel excavation.
(1) Poor stratum lithology
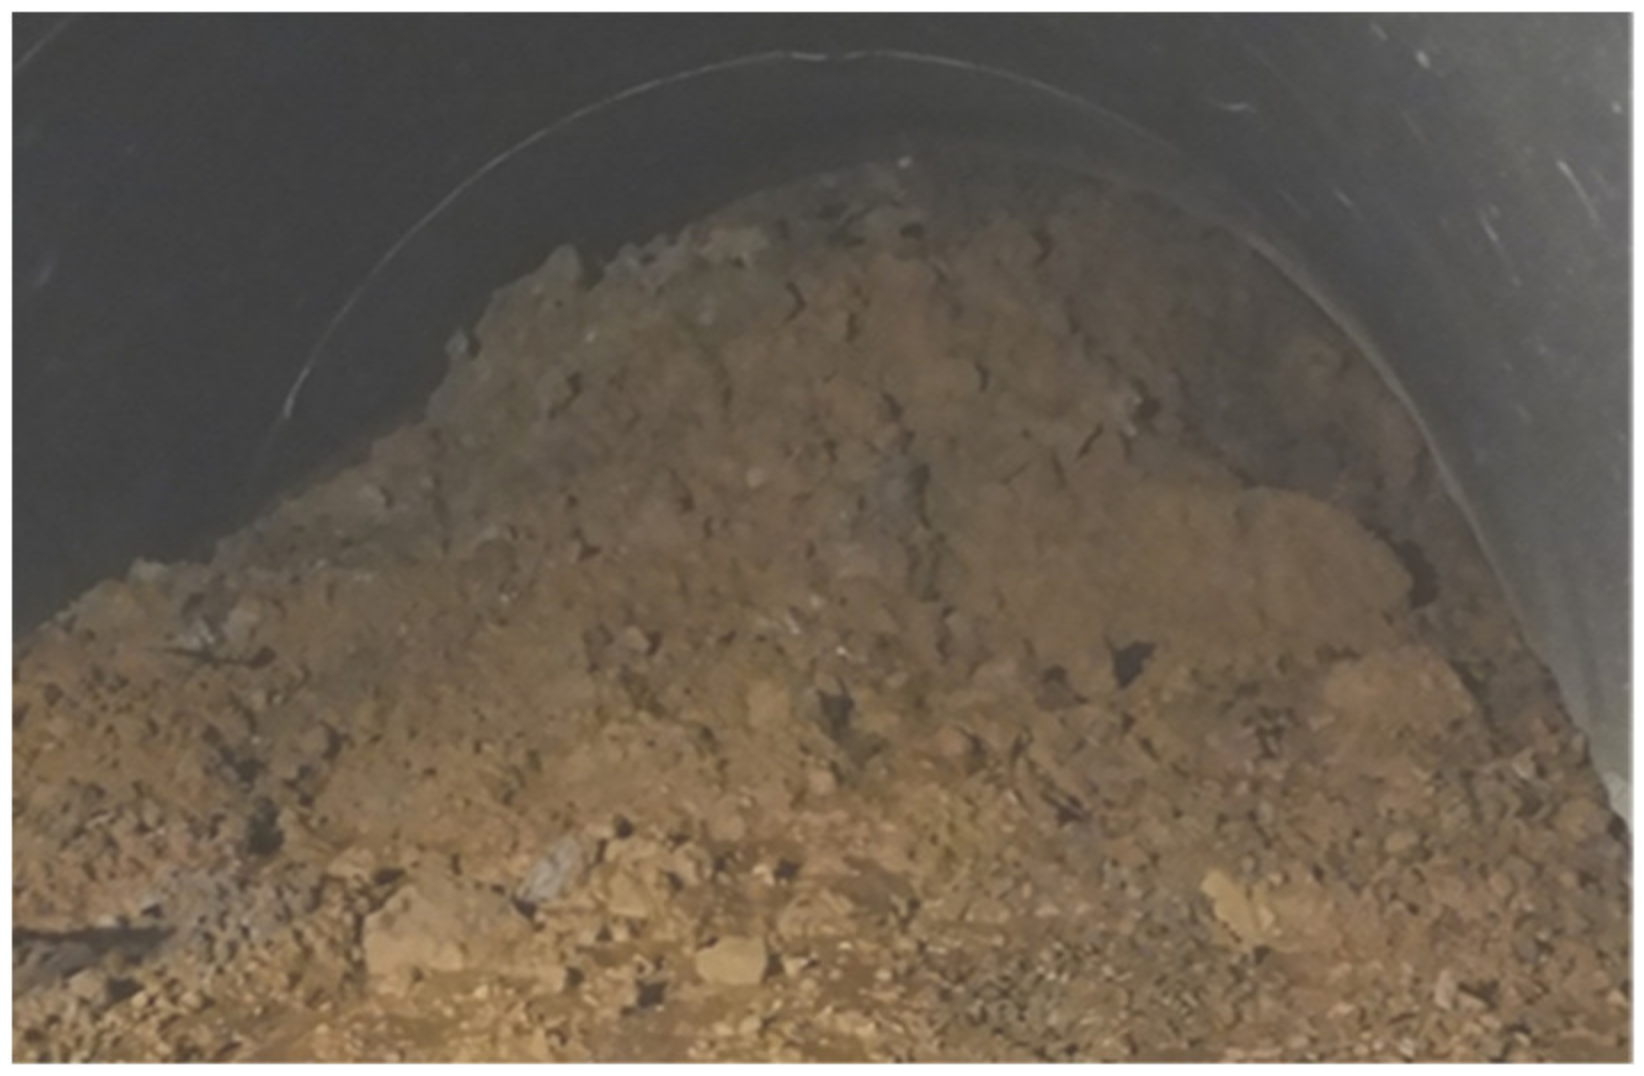
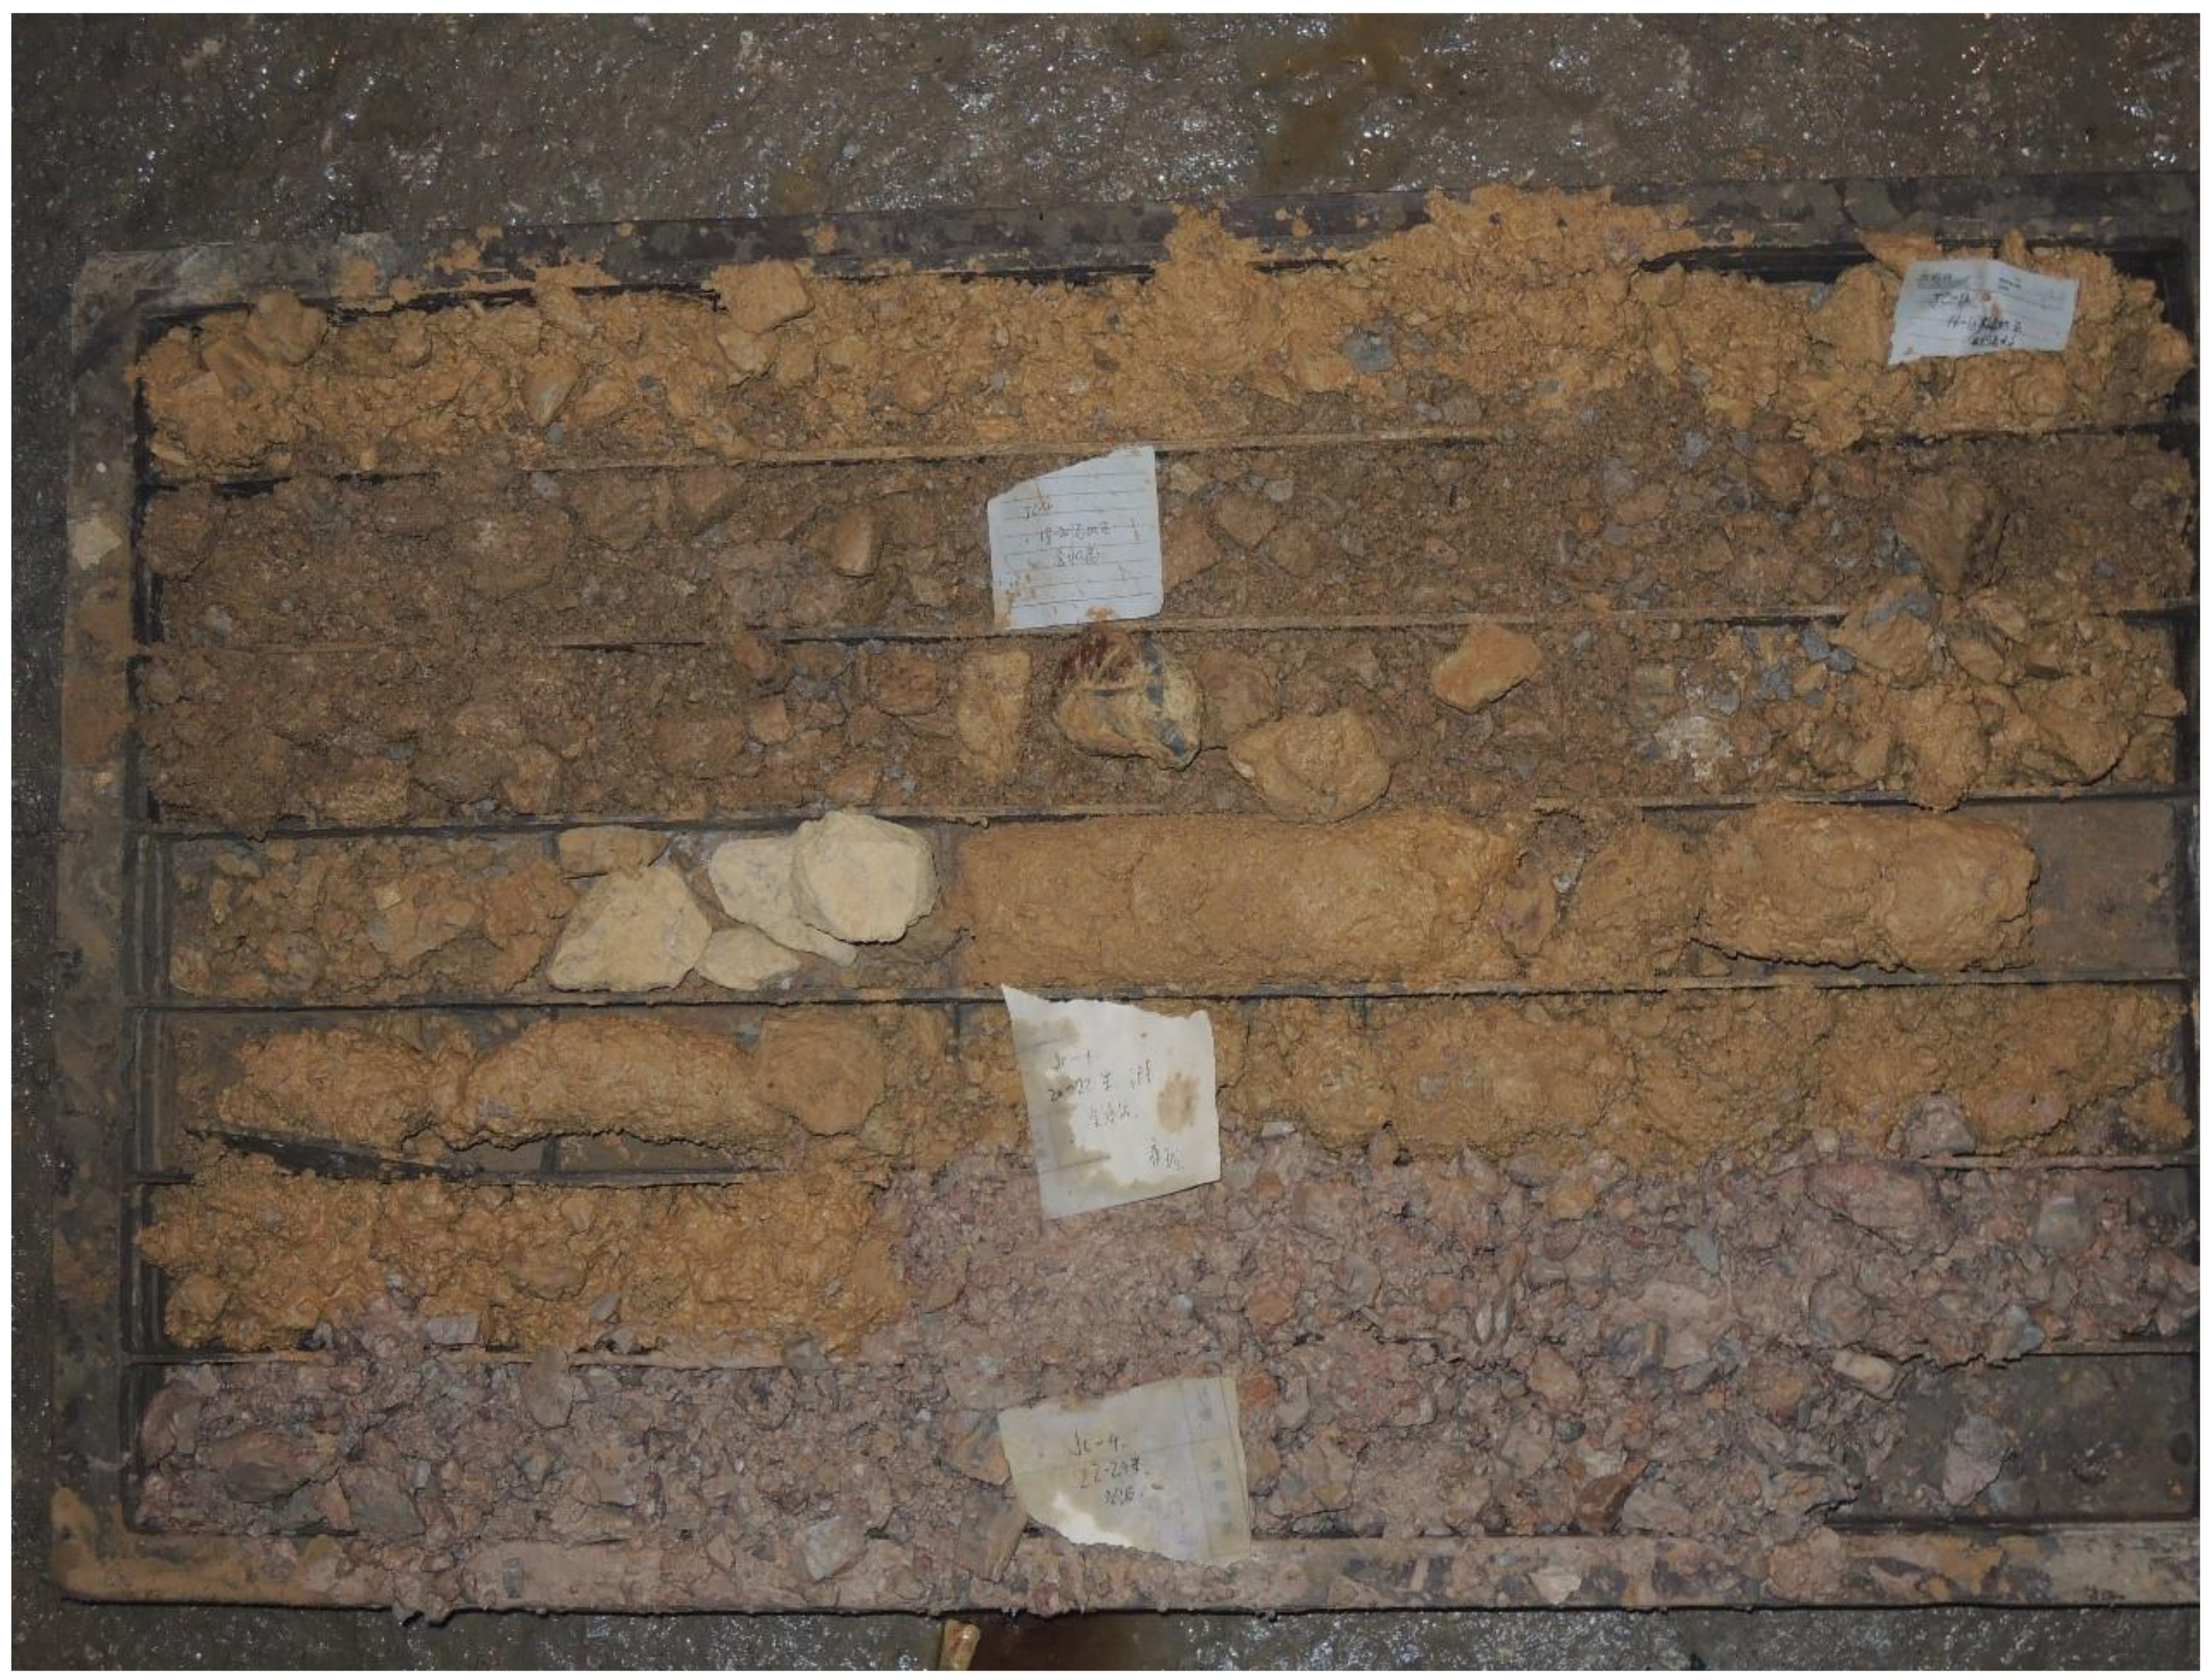
The F2 fault of the tunnel is located in an interbedded area of shale and sandstone, with extremely broken surrounding rock, high porosity, high mud content and extremely low mechanical strength. The rock mass exposed in the excavation process can even be crushed by hand. Containing minerals like montmorillonite, the shale in rock mass belongs to weakly expansive surrounding rock. The rock mass in the fault zone is loose and easy to disintegrate through contact with water, and becomes soft and muddy and is able to flow like water. It can be seen that the F2 fault rock mass is fragile in structure, rich in loose broken materials and very weathered, which provides good material conditions for the formation of a water and mud inrush in the tunnel. Lithology revealed rock cores in the F2 fault during tunnel investigation, and excavation is shown in Figure 10.
(2) Abundant groundwater
With abundant precipitation, groundwater near the tunnel is well supplied. According to the meteorological data of Yongxin County Hydrological Station, for many years the county has always received the most rainfall from April to June with intensity, wide coverage and long duration, accounting for more than 45% of the annual precipitation. Typhoons often hit the district from July to October, forming typhoon rain with intensity, short duration and concentrated rainfall, which can easily result in flood disasters. In addition, hydrological data in 2012 show that the precipitation in June was 263 mm, an increase of 19.49% over the previous average annual precipitation 220.1 mm. And this period coincided with the formation and development period of water and mud inrushes in the tunnel, indicating that groundwater near the tunnel area was adequately supplied with surface water.
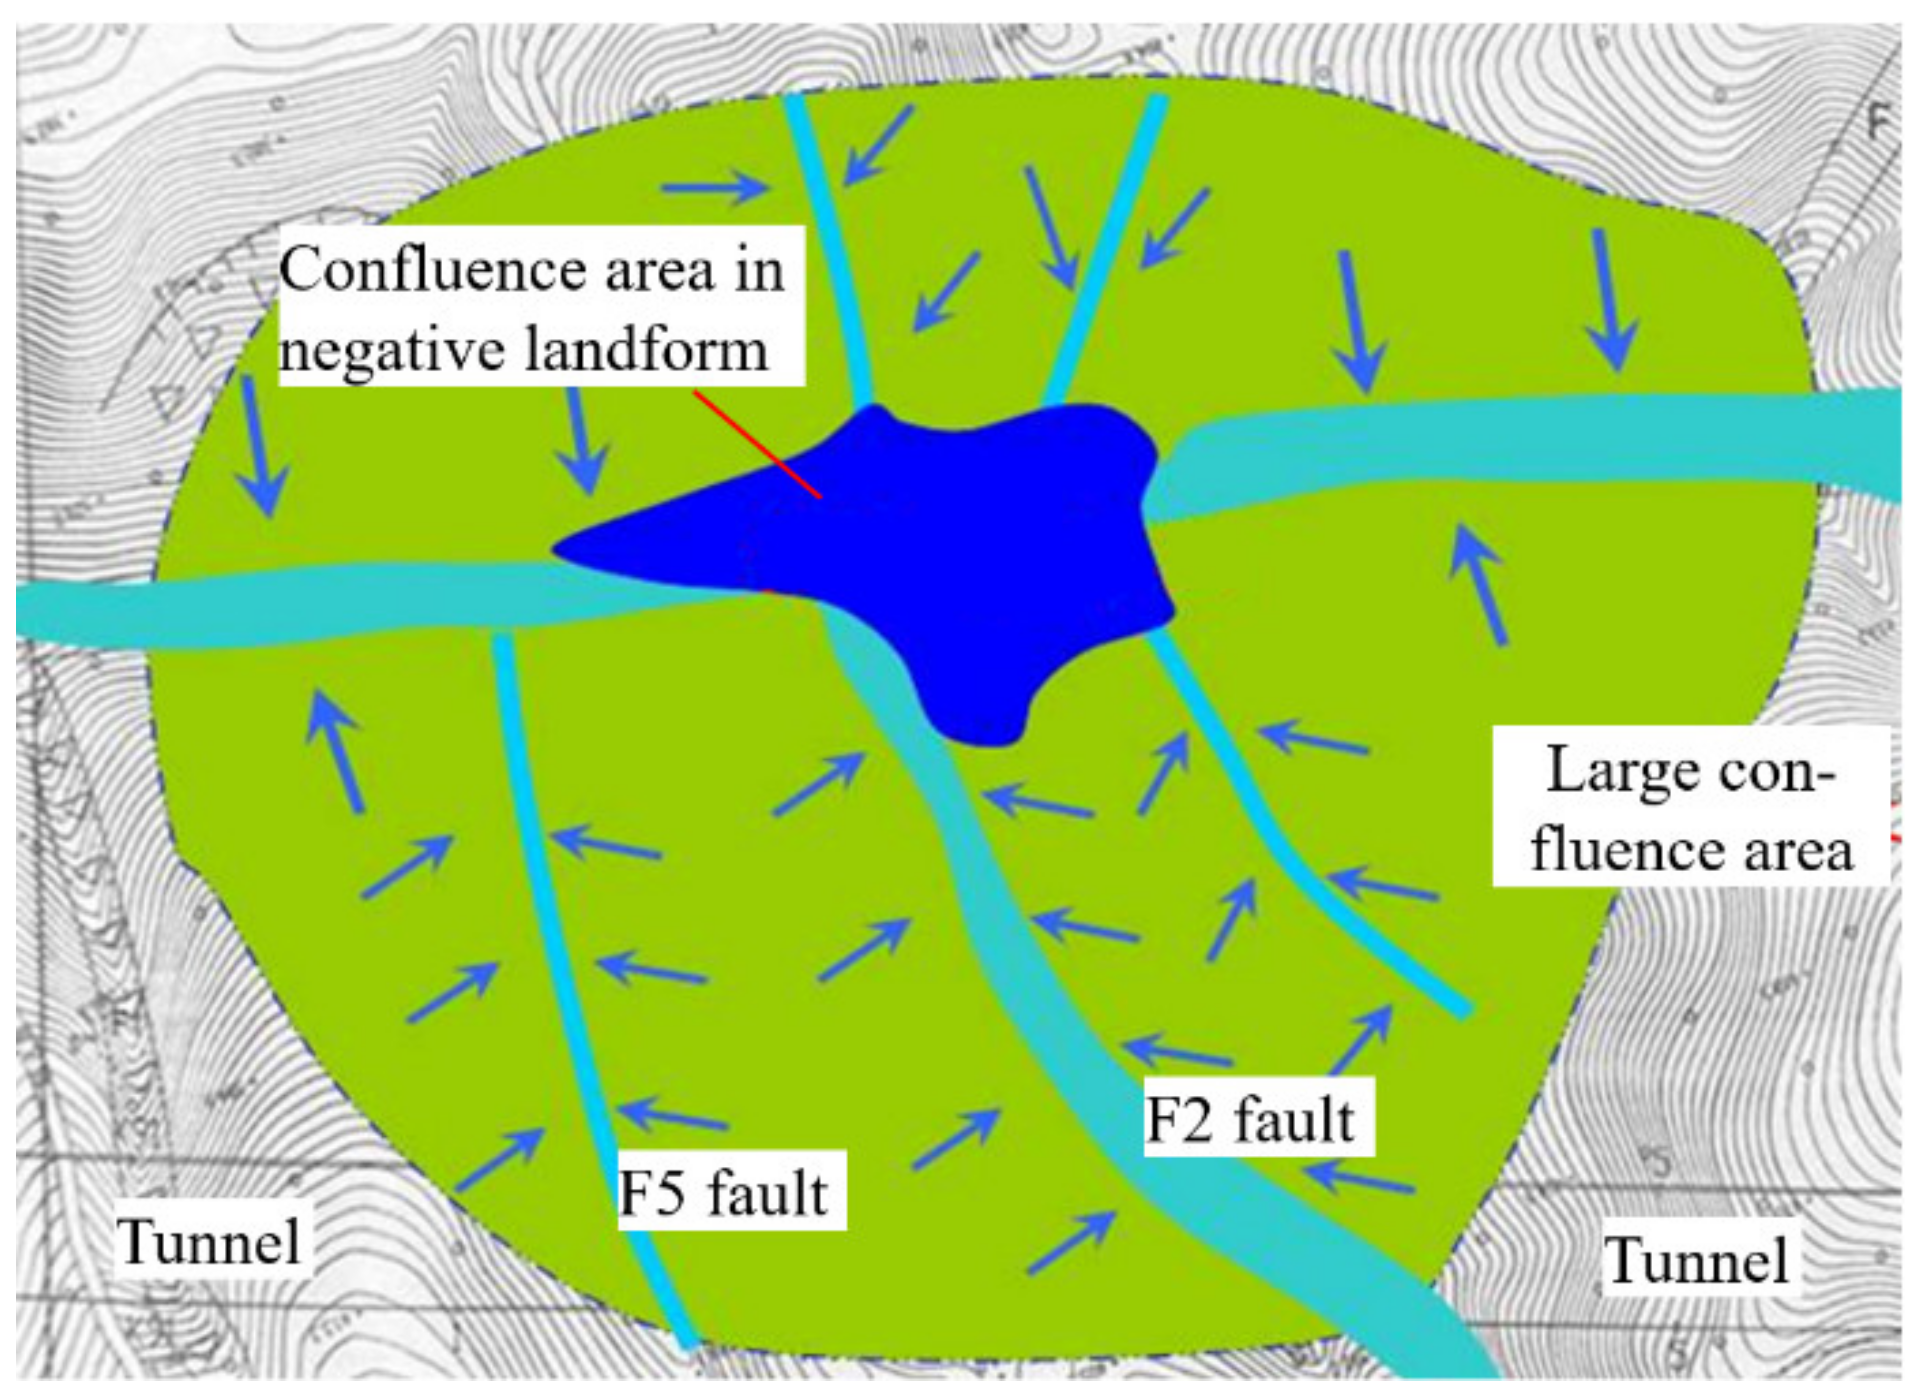
Several structural valleys converge into a certain range of a confluence area of negative landforms (as shown in Figure 11). Multiple confluence valleys, along which the water flows, are connected with a confluence area, forming another larger confluence area. The F2 fault and the F5 fault are connected with the confluence area and cut across the tunnel. Especially, rock mass in the F2 fault zone is extremely broken, rich in water and high in water conductivity. A water injection test was carried out on the SK2 borehole exposing the F2 fault, which found that the water level was only raised by about 1.2 m after injecting water into the borehole with a flow rate of 4 m3/h for 2 h. The water level recovered only 3 min after the water injection was stopped. The water injection test indicated that the F2 fault had good water conductivity. In addition, a rhodamine tracer test was carried out on the SK2 borehole, and the tracer was detected at entrance of the tunnel for 7 days, which directly indicated that the F2 fault was a water diversion fault and that groundwater migration was relatively smooth.
After tunnel excavation, the abundant groundwater in the fault fracture zone converged to the excavation surface rapidly. On the one hand, groundwater promoted the fault rock dominated by broken shale to soften, decreasing mechanical strength. On the other hand, groundwater washed away argillaceous and clayey sediments in the structural plane of rock mass, which increased looseness and further reduced the strength of rock mass in the fault fracture zone. It could be seen that the abundant groundwater was one of the important conditions for the occurrence of water and mud inrush in the tunnel fault, which provided the start-up power for the occurrence of the inrush.
(3) Tunnel excavation disturbance
Due to tunnel excavation, the surrounding rock lost its original supporting space. At the same time, the original three-dimensional stress equilibrium was broken with a decrease in radial stress. Subsequently, stress redistribution and stress release within a certain range of the surrounding rock took place, and a secondary stress field was then generated. With the decreasing stability of the loose broken rock mass in the fault zone, the surrounding rock deformed, and a large number of cracks were formed. In addition, tunnel excavation changed the original balanced groundwater seepage system, making the tunnel a new favorable seepage channel for groundwater. As a result, a large amount of groundwater gushed out. Without proper treatment, water and mud inrushes could easily take place.
4.2. Evolution Mechanism of Water and Mud Inrush
Under the influence of many factors, the destructive effect of groundwater on the surrounding rock of fault zone was intensified, and to a certain extent, wide areas of rock mass suddenly lost stability, resulting in the occurrence of a water and mud inrush disaster. This sudden failure often needed to experience a long period of development and evolution process before its occurrence, demonstrating obvious periodicity. According to observation and analysis of the occurrence process of the water and mud inrush in the F2 fault, the evolution process of water and mud inrush can be divided into three stages: generation, development and occurrence.
(1) Generation stage
As the initial seepage channel appears in the surrounding rock of the tunnel and seepage flow increases gradually, the generation stage begins. After the tunnel is excavated in the fault zone, due to loose and broken surrounding rock and an increase in seepage flow, groundwater begins to erode cracks (pores) in the fault fracture zone, and gradually brings out the sediment, muddy and other small fillings in cracks (pores). As the initial seepage channel is formed, water flow gradually increases and turns relatively turbid. With the increase in the groundwater seepage rate, the degree of softening and muddiness of broken surrounding rock in the fault increases, and rock mass strength decreases continuously. As a result, more and more filling particles are washed out, which is similar to the phenomenon of piping erosion. This phenomenon further leads to the continuous expansion of the seepage channel and increasing water inflow. In addition, filling material brought out by groundwater erosion aggravates the formation of disturbed rock mass, which leads to the expansion of the disturbed area. The water–rock interaction continues as a vicious circle for a long time until the end of this stage. Finally, a runoff channel with a large diameter and a large range of disturbed zones is formed, and so water inflow stops increasing and water turns clearer.
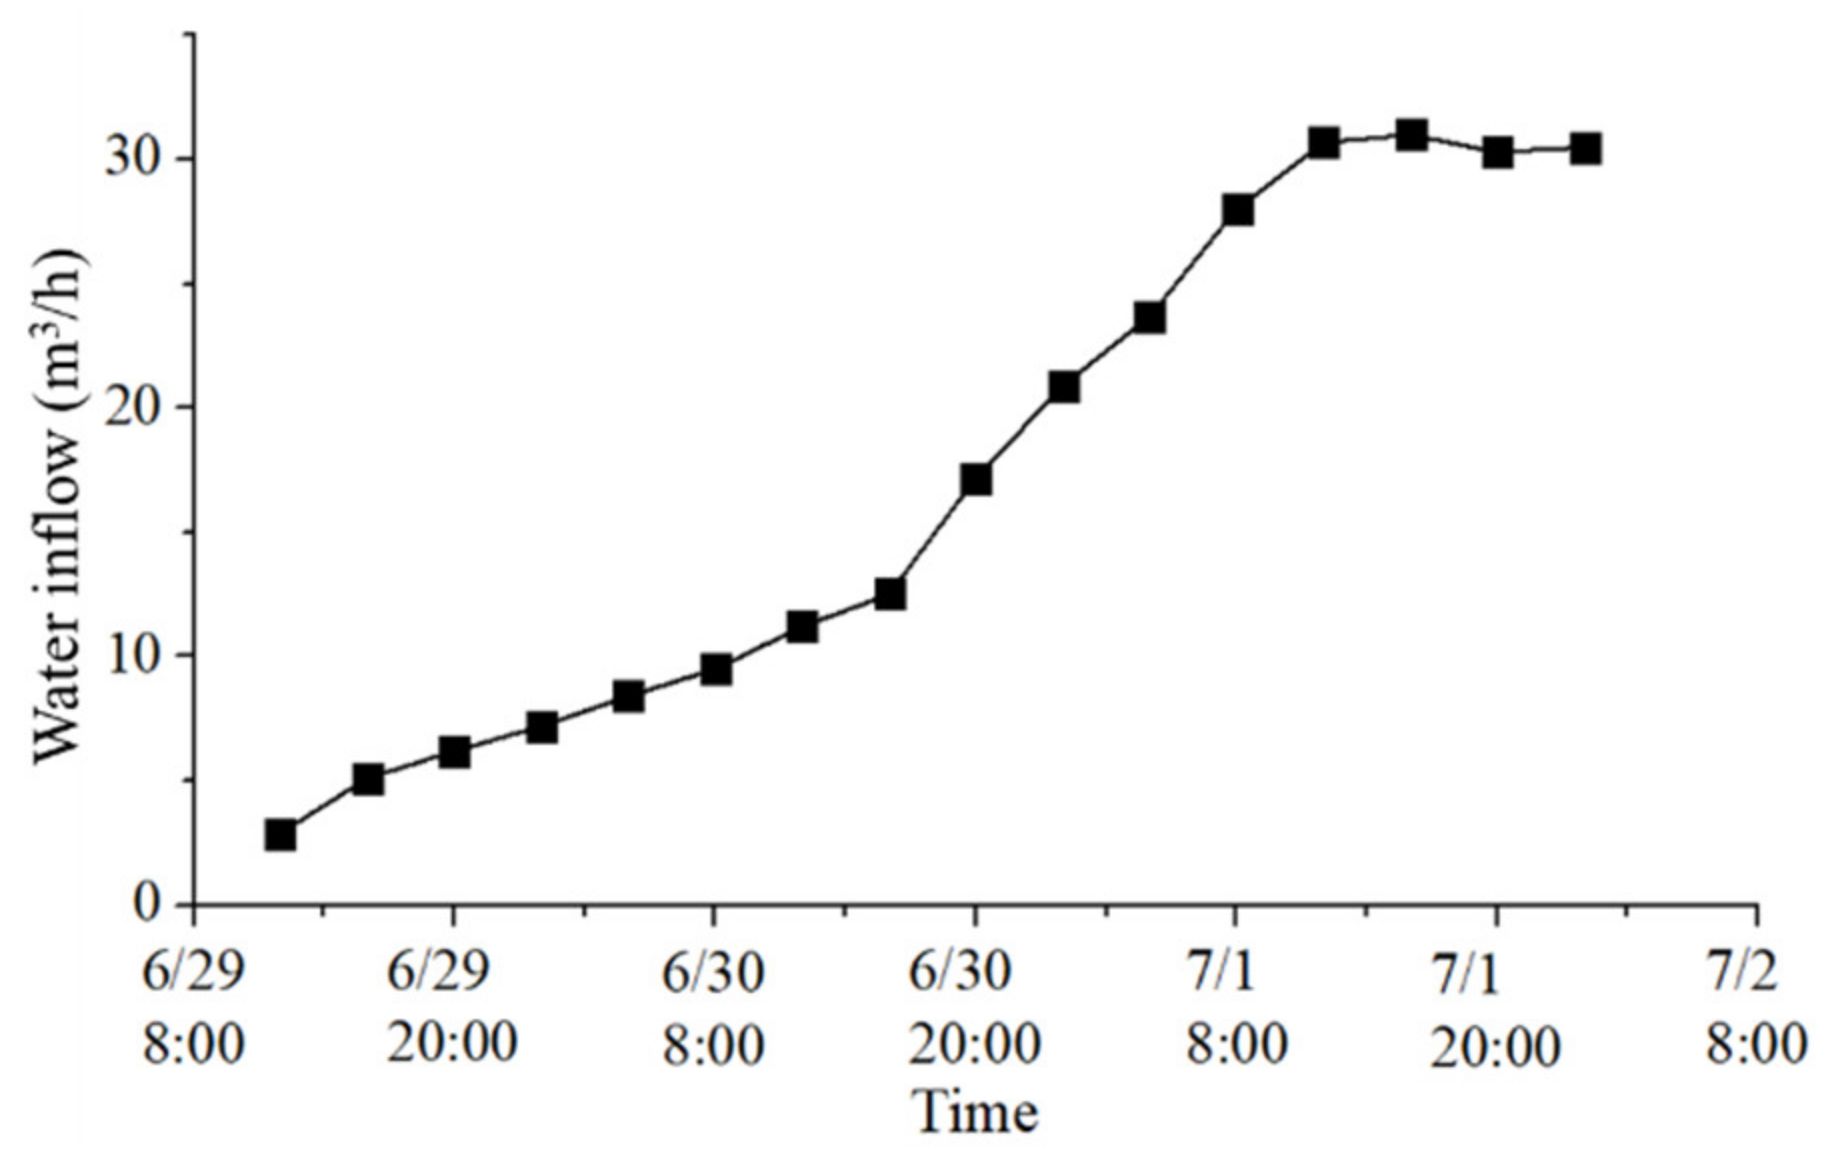
Based on the water and mud inrush in the left tunnel of the entrance to Yonglian Tunnel, the changes of water inflow in the left tunnel (as shown in Figure 12 and Figure 13) during tunnel excavation in this stage were as follows:
The construction team began to excavate the collapsed body and replace the grid steel frame from station ZK91 + 303 m on 25 June 2012. At 8:00 a.m., excavation reached the mileage of ZK91 + 312, and the grid steel frame was replaced to ZK91 + 311 (entering the F2 fault fracture zone). At about 9:00 a.m., a small amount of water seeped out from arch foot of the right wall at ZK91 + 308 mileage, and gradually water flow and the amount of water outlet points increased and extended to the vault. By 10:00 a.m., there were many water flows dripping along the system bolts and grouting holes of the arch shoulder and vault at a mileage of ZK91 + 308. According to statistics of field data, the total water flow rate was about 0.7m3/h. By 12:00 p.m., the total water flow rate at the shoulder and vault at a mileage of ZK91 + 308 increased to 2.9 m3/h.
At 10:00 a.m. on 30 June, an excavation operation reached the mileage of ZK91 + 314, and a grid steel frame was changed to ZK91 + 313 mileage. The seeping water gathered into the channel on the back of the initial supports and gushed out at ZK91 + 313 mileage; at this time the water flow rate was about 10 m3/h. Water flow continued to increase, and at 12:00 p.m., water flow rate at the outlet was about 11.2 m3/h.
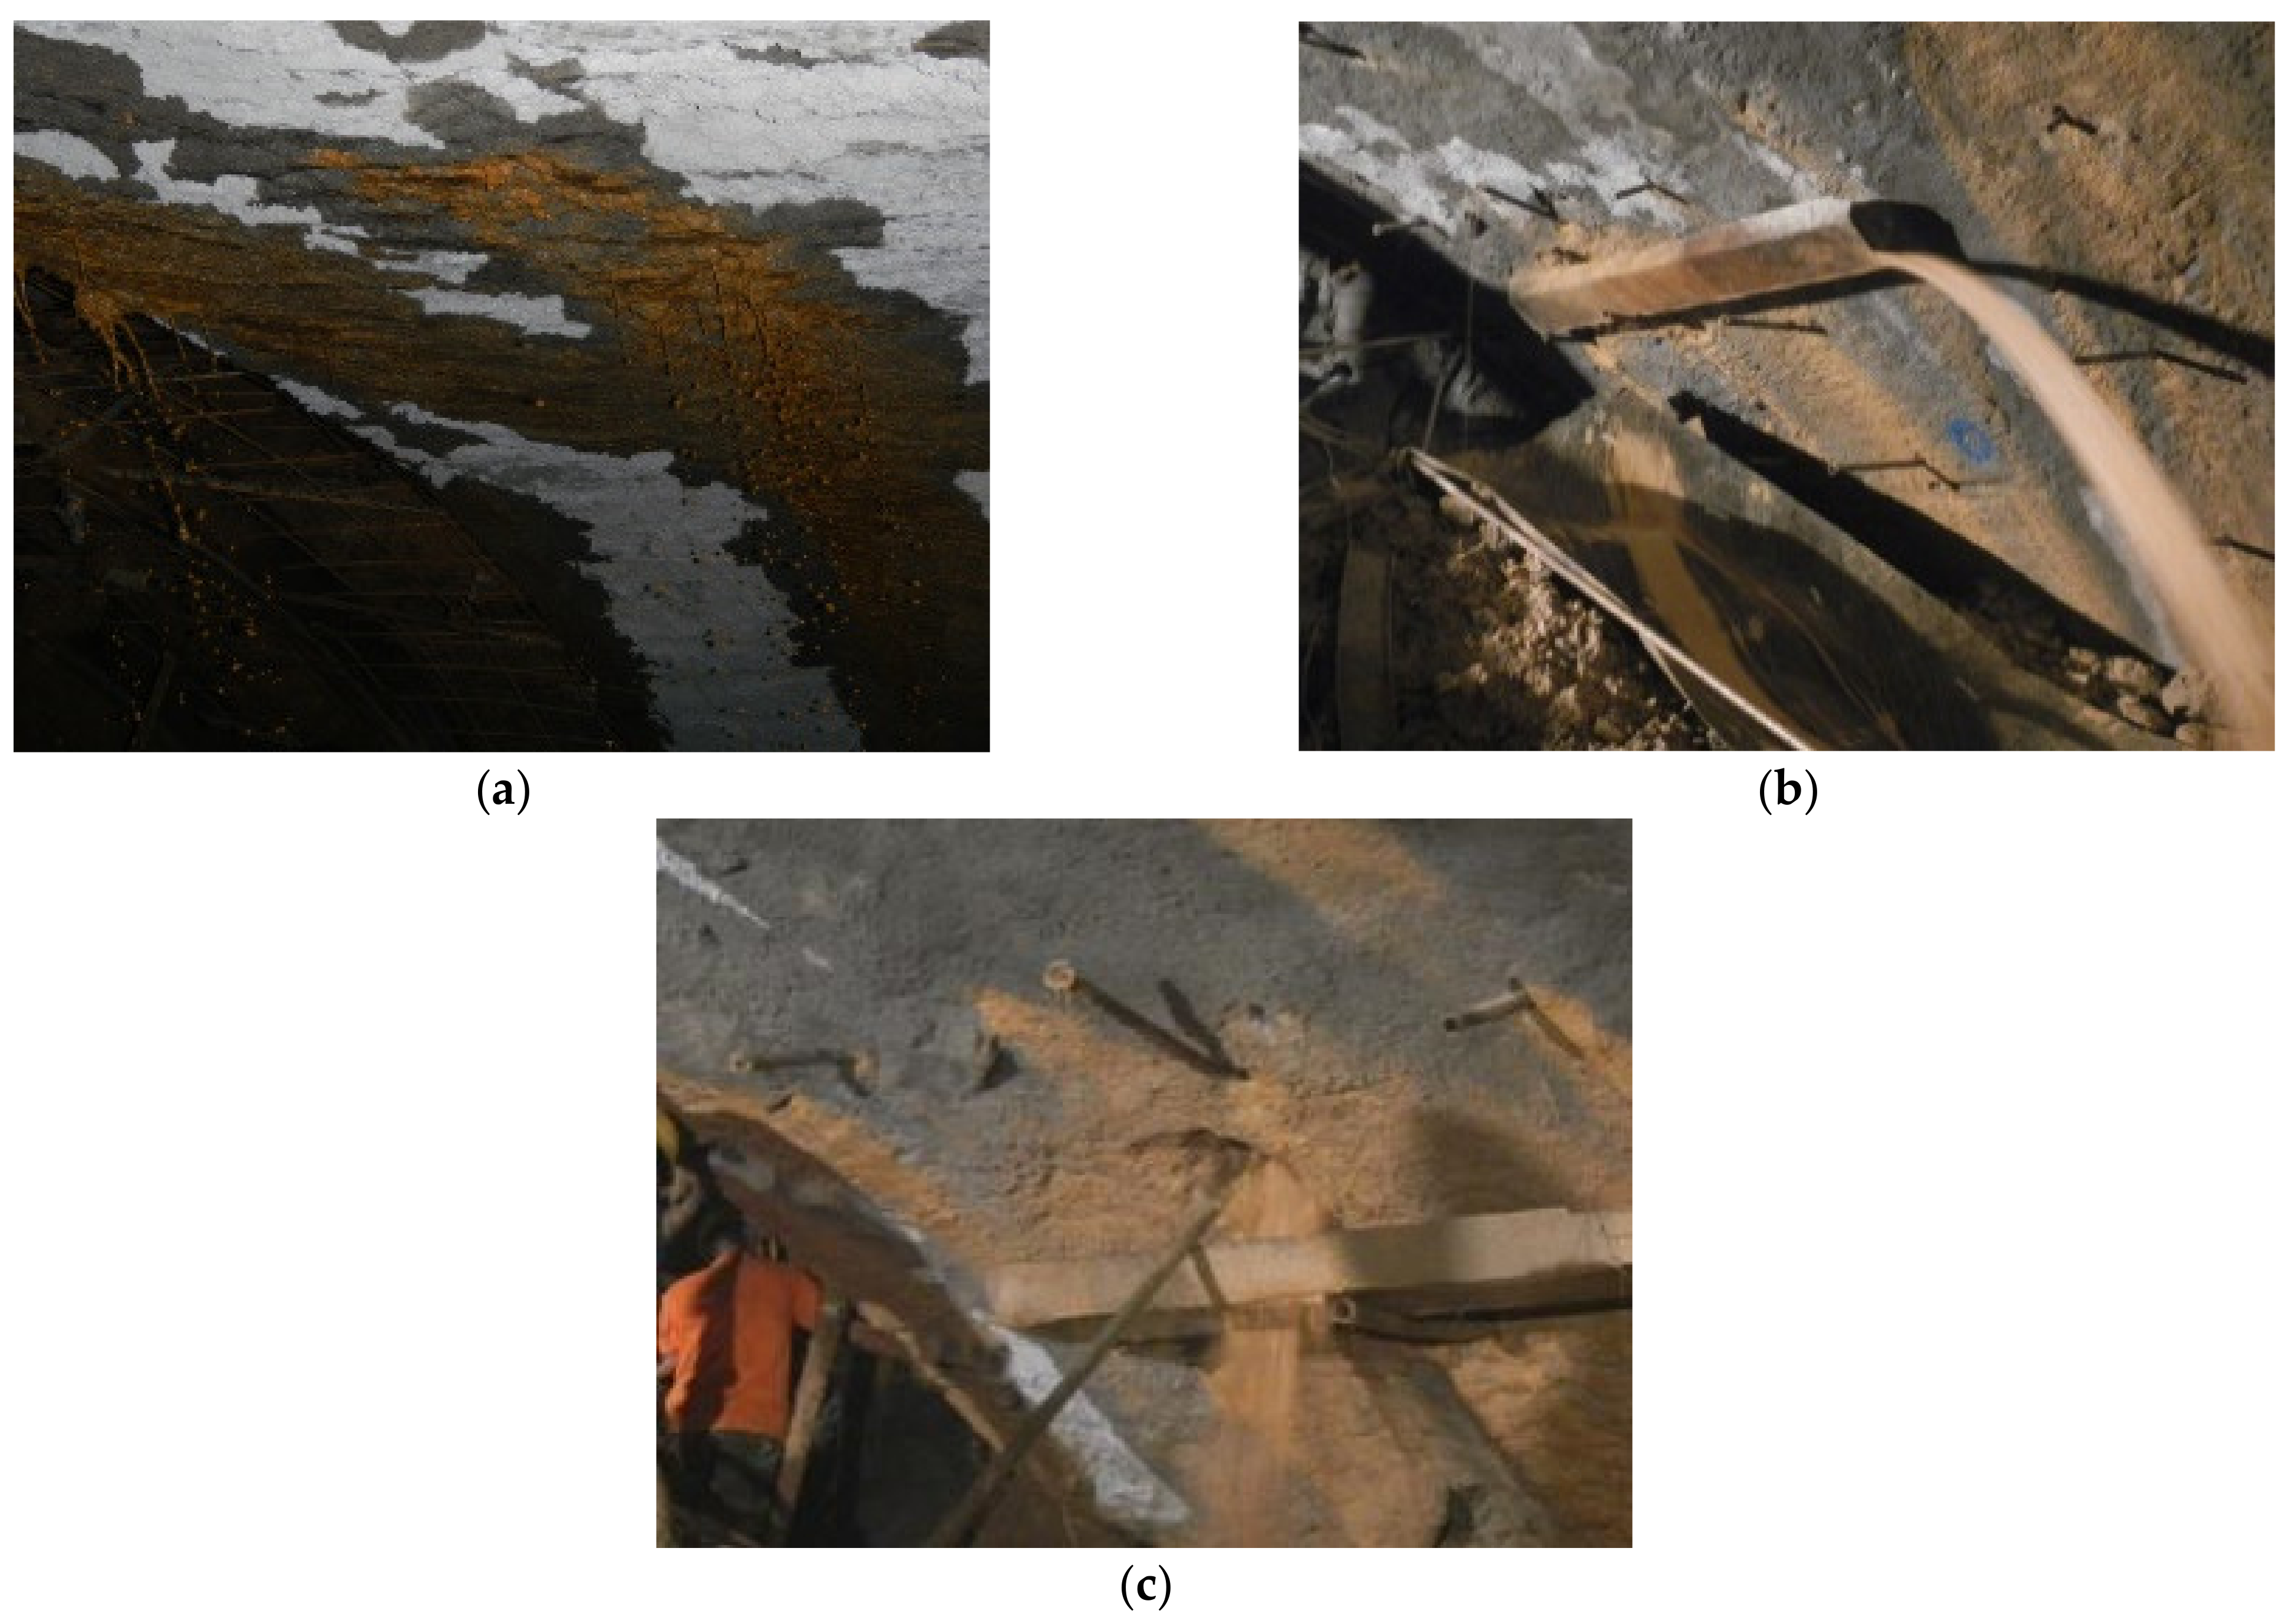
At 10:00 p.m. on 30 June, the excavation operation reached ZK91+315 mileage, and the grid steel frame was changed to ZK91+314 mileage. The construction team concentrated the gushing water at the ZK91 + 313 arch shoulder (as shown in Figure 12a); at this time water flow rate increased to 20.5 m3/h. During the process of water gushing, there was gravel constantly being flushed out with water, and the diameter of the water passage outlet hole continuously expanded.
At 9:00 a.m. on 1 July, the excavation operation reached a ZK91 + 316 mileage, and water inflow at the ZK91 + 313 arch shoulder continued to increase. At this time, the grid steel frame was replaced to a ZK91 + 315 mileage. By 10:00 a.m., water flow rate was about 30.3 m3/h. By 10:00 p.m., water stopped gushing, and the water flow was slightly changing, sometimes large and sometimes small. The diameter of the hole formed at the outlet point of the arch shoulder is about 30 cm, and the surrounding rock was hollowed out in a certain range behind the tunnel supports.
(2) Development stage
At the end of generation process, a large-scale disturbed area of surrounding rock around the tunnel is formed under the action of the continuous erosion of groundwater. Under the effect of gravity, rock mass in the disturbed zone moves downward, which causes the lower broken rock mass to be gradually compacted by the upper rock mass. As a result, a relatively dense sedimentary “protective layer” is formed in the upper part of the tunnel supports. The “protective layer” can help slow down and prevent groundwater from pouring into the tunnel to a certain extent. Therefore, water flow gushing from the outlet point at this stage fluctuates and begins to decrease gradually, becoming less turbid. Moreover, sometimes there is even the phenomenon that groundwater flow is diverted and the outlet point of the tunnel transfers to other weak linings. The gradual thickening of the “protective layer” leads to the retention and accumulation of groundwater in the upper part of the “protective layer”. Under the immersion of groundwater, the surrounding rock of the upper part is softened and mudded on a large scale, and then the strength decreases rapidly. The disturbed zone of rock mass in the fault zone is further expanded. Due to the effect of gravity and the surrounding rock pressure, rock mass in the disturbed zone continues to move downward, resulting in the continuous deterioration of the retention of groundwater in the protective layer. At the same time, the expansion of the disturbed zone and the accumulation of a large amount of groundwater at top of the tunnel supports is ongoing. The accumulated groundwater soaks broken surrounding rock in fault, which leads to the softening and muddying of a large range of rock mass around the tunnel. During this period, due to the support of the “protective layer” and the initial supports, the stress can be balanced in a certain period of time with no tunnel collapse. However, there is a large amount of mud and groundwater at the top of the tunnel. This accumulation of high energy can easily induce a water and mud inrush in the tunnel at any time.
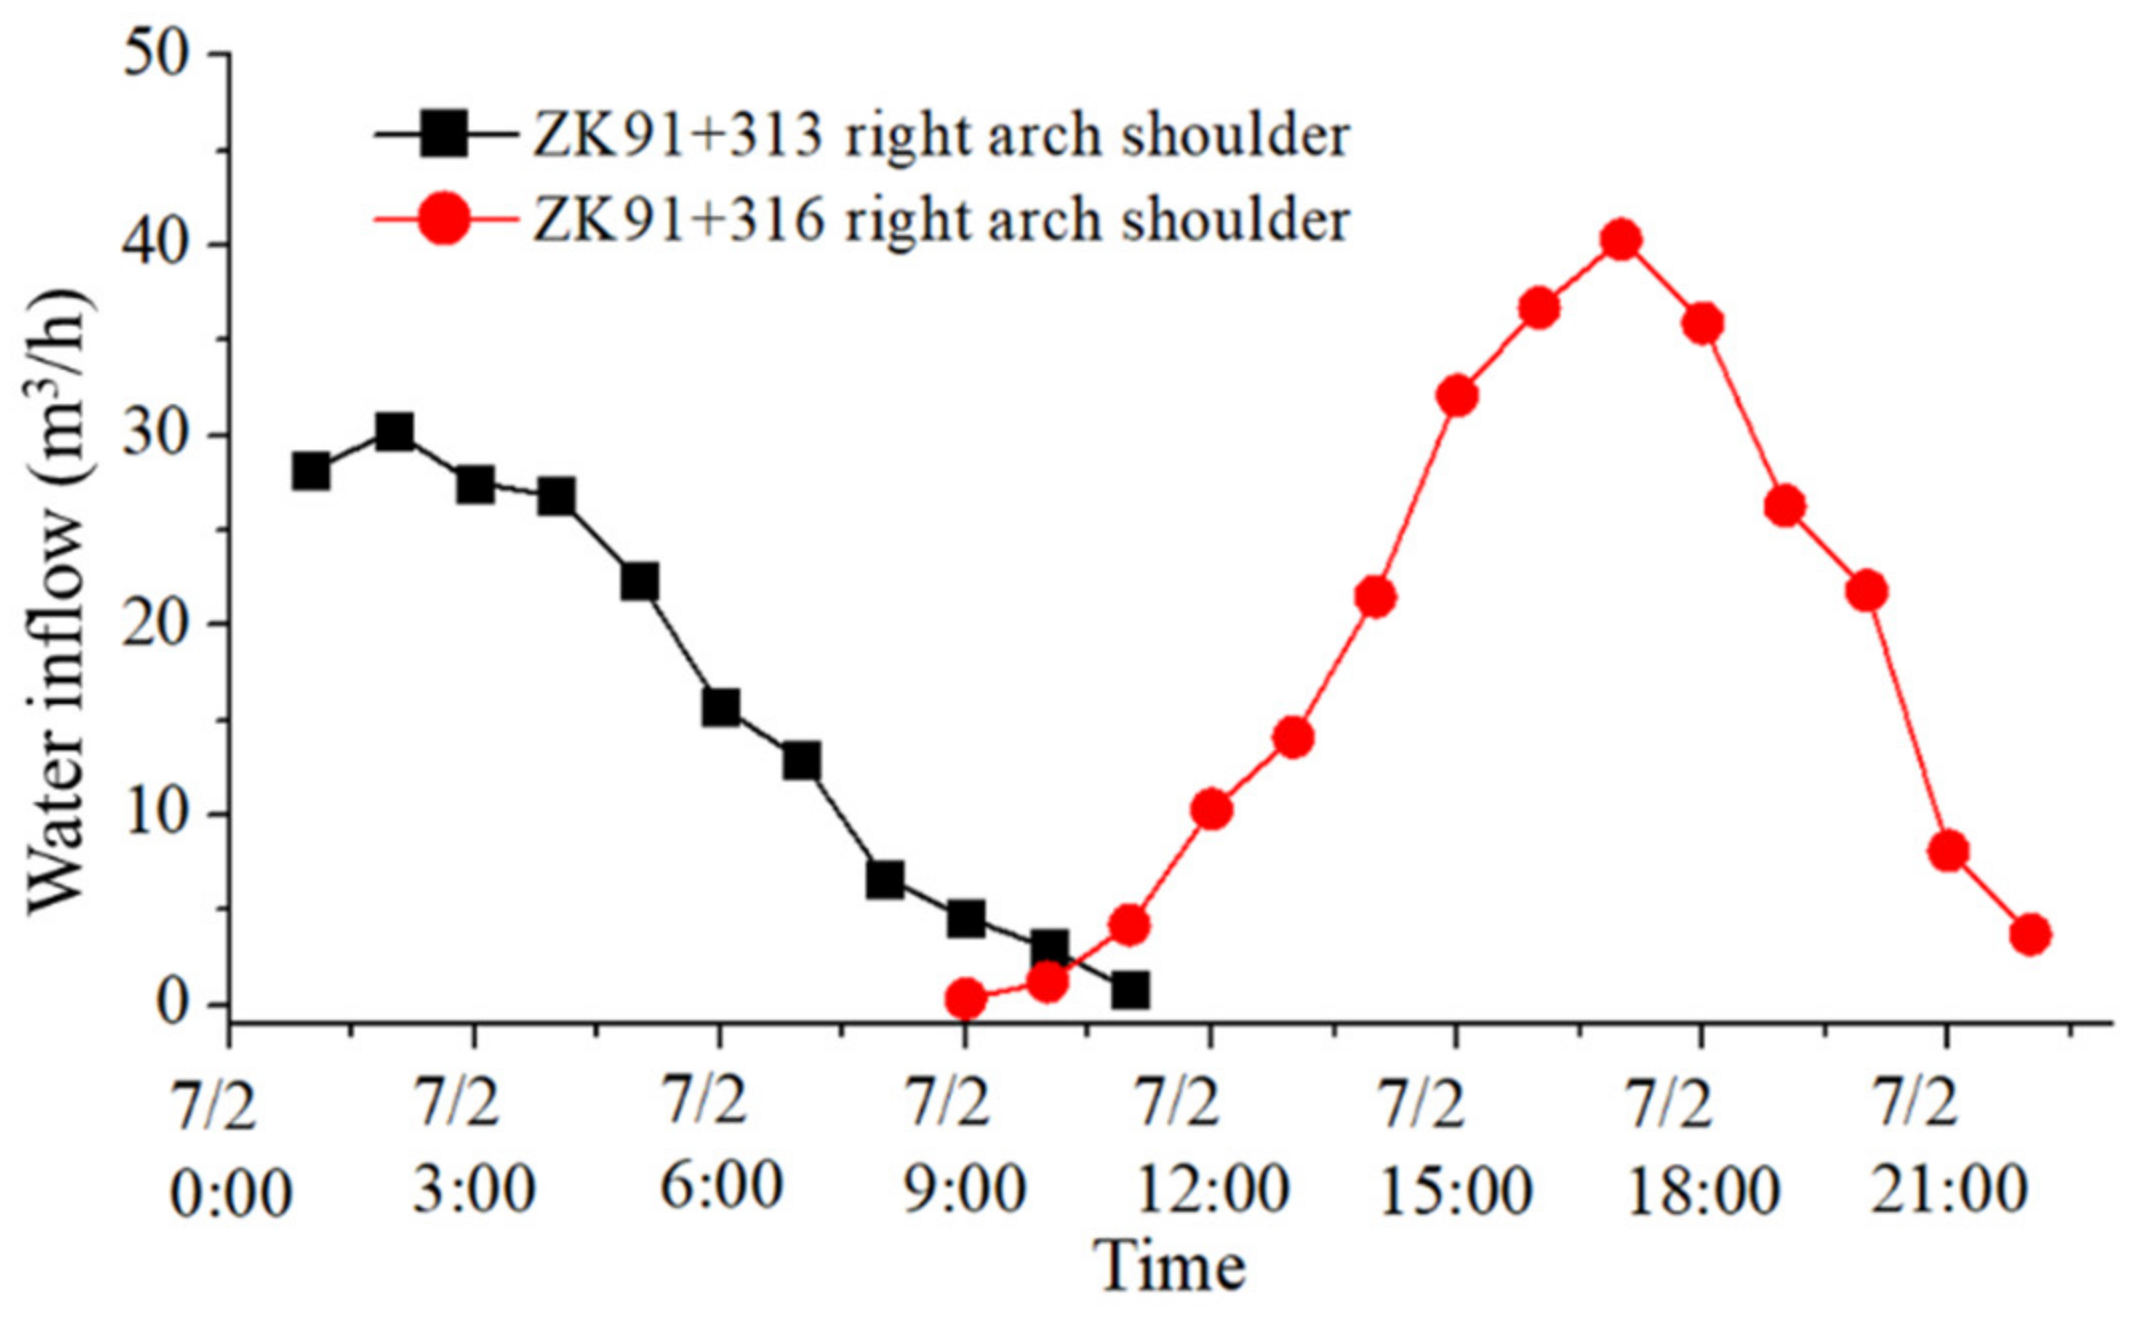
The changes occurring in the entrance to the left tunnel during this stage were as follows:
At 3:00 a.m. on 2 July 2012, water flow at the diversion point of the ZK91 + 313 arch shoulder began to decrease gradually, and there was almost no water at the outlet point at about 10:00 a.m. Simultaneously, the gushing point gradually shifted to the tunnel face. At 8:00 a.m. on 2 July, when the grid steel frame was replaced at the ZK91 + 316 mileage (at the tunnel face), groundwater transferred to the right arch shoulder at the tunnel face. Water flow gradually increased and a large amount of yellow mud and stones were brought out by the gushing water. At 4:00 p.m., the water output flow rate increased to 40 m3/h. Subsequently, water flow began to decrease again and, at about 10:00 p.m., the water output flow rate was almost reduced to 0. The variation curve of water flow from the outlet point of the tunnel during this stage is shown in Figure 14.
(3) Occurrence stage
As disturbed zone of surrounding rock in the fault expands continuously and moves downward due to gravity, the stress carried by the “protective layer” and the initial supports increase. When the support stress increases to a certain critical state, the “protective layer” and initial supports suddenly lose stability and are destroyed. Consequently, a mixture of high-energy groundwater, gravel and argillaceous fillings gushes out on a large scale and a water and mud inrush occurs. Due to the water and mud inrush, the surrounding rock has no ability to bear any stress. If the disaster cannot be solved quickly, a water and mud inrush can easily be induced several times under the action of groundwater erosion and softening.
After the development of the first two stages, at 11:30 p.m. on 2 July 2012, water flow increased sharply at the right arch shoulder of the tunnel face (ZK91 + 316), and a large amount of groundwater inrush flowed instantly. Simultaneously, mixtures of gravel and muddy fillings outburst, resulting in the first water and mud inrush. The mud burst formed an irregular hole with an area of 1 m2 at the steel arch on right side of the tunnel face, and caused serious silt accumulation at ZK91 + 316~ZK91 + 308. Since then, water and mud inrushes occurred many times near the entrance to the left tunnel.
The three above stages of the evolution process of water and mud inrush can happen again if generation conditions are met. In other words, if the stratum lithology is still poor, groundwater is still abundant and excavation disturbance still exists, another water and mush inrush will occur, and this cycle of inrushes occurred eight times in the left tunnel and seven times in the right tunnel.
5. Discussion
These research results could provide some references for the effective prediction of similar engineering disasters. The mechanism of water and mud inrushes can be further studied in the furture using analytical or numerical methods.
The topography and dip direction of the rock level are important factors in water and mud inrush [20,21,22,23,24]. The topography directly affects the development and occurrence characteristics of the underground karst strata. The dip direction of the rock level affects the recharge, runoff, infiltration of groundwater and the development degree of karst. We can study the influence of the topography and dip direction of the rock level on water inrush mechanisms using the numerical method.
Sensitivity analysis, as a widely used tool in geotechnical engineering [25,26], can play an important role in calibrating and interpreting the models describing water inrush mechanisms. Using the numerical method, the influence of fault width, tunnel depth and soil mechanical properties on the mechanisms of water inrush can be revealed. Then, sensitivity analysis can be conducted based on numerical results in the future.
6. Conclusions
The conditions under which water and mud inrushes can occur in tunnel faults mainly include poor stratum lithology, abundant groundwater and the disturbance of tunnel excavation. The poor stratum lithology and low strength of fault rock mass, compounded by the rich content of broken materials inside, provide a material basis for the occurrence of water and mud inrushes; abundant groundwater provides their start-up power. Tunnel excavation, which disturbs surrounding rock and breaks the original equilibrium state, makes it much easier for these disasters to occur.
The evolution process of water and mud inrush in tunnels constructed on faults can be divided into three stages: generation, development and occurrence. (1) In the generation stage, with the process of seepage, soil particles in the seepage channel are washed out gradually, and the channel expands. Therefore, a large range of loose rock zone is formed. (2) In the development stage, the protective layer forms in the upper part of the tunnel supports. Water flow from the outlet point fluctuates, and then decrease gradually. At the same time, a large amount of groundwater accumulates around the tunnel, which increases the risk of a water and mud inrush. (3) In the occurrence stage, with the increasing of water pressure, the “protective layer” and the supports suddenly lose stability. Gravel and argillaceous fillings gush out, and then, a water and mud inrush occurs.
Author Contributions
Conceptualization, J.L., Z.L.; formal analysis, X.Z.; investigation, J.L., Z.L.; methodology, Z.L.; supervision, X.W.; validation, X.Z., X.W.; writing, J.L., Z.L., X.Z., X.W. All authors have read and agreed to the published version of the manuscript.
Funding
This research was funded by the National Key Research and Development Project (Grant No. 2018YFB1600200); the Shandong Provincial Key Research and Development Project (Grant No. 2019JZZY010427) and the National Natural Science Foundation of China (Grant No. 51909270 and No. 51909147).
Institutional Review Board Statement
Not applicable.
Informed Consent Statement
Not applicable.
Data Availability Statement
The data used to support the findings of this study are available from the corresponding author upon request.
Acknowledgments
We thank the anonymous reviewers and editors for their constructive comments and suggestions to improve the quality of this article.
Conflicts of Interest
The authors declare that they have no conflict of interest.
References
- Li, S.C.; Liu, R.T.; Zhang, Q.S.; Zhang, X. Protection against water or mud inrush in tunnels by grouting: A review. J. Rock Mech. Geotech. Eng. 2016, 8, 753–766. [Google Scholar] [CrossRef] [Green Version]
- Wu, Y.Q.; Wang, K.; Zhang, L.Z.; Peng, S.H. Sand-layer collapse treatment: An engineering example from Qingdao Metro subway tunnel. J. Clean. Prod. 2018, 197, 19–24. [Google Scholar] [CrossRef]
- Zhou, W.F.; Liao, S.M. The analysis and control of inrush and mud gushing in the broken rock tunnel under high water pressure. Procedia Eng. 2016, 165, 259–264. [Google Scholar] [CrossRef]
- Zhao, Y.; Li, P.F.; Tian, S.M. Prevention and treatment technologies of railway tunnel water inrush and mud gushing in China. J. Rock Mech. Geotech. Eng. 2013, 5, 468–477. [Google Scholar] [CrossRef] [Green Version]
- Li, X.Z.; Zhang, P.X.; He, Z.C.; Huang, Z.; Cheng, M.L.; Guo, L. Identification of geological structure which induced heavy water and mud inrush in tunnel excavation: A case study on Lingjiao Tunnel. Tunn. Undergr. Space Technol. 2017, 69, 203–208. [Google Scholar] [CrossRef]
- Yang, W.M.; Wang, M.X.; Zhou, Z.Q.; Li, L.P.; Yuan, Y.C.; Gao, C.L. A true triaxial geomechanical model test apparatus for studying the precursory information of water inrush from impermeable rock mass failure. Tunn. Undergr. Space Technol. 2019, 93, 103078. [Google Scholar] [CrossRef]
- Zhang, Q.S.; Wang, D.M.; Li, S.C.; Zhang, X.; Tan, Y.H.; Wang, K. Development and application of model test system for inrush of water and mud of tunnel in fault rupture zone. Chin. J. Geotech. Eng. 2017, 39, 417–426. [Google Scholar]
- Yang, W.F.; Jin, L.; Zhang, X.Q. Simulation test on mixed water and sand inrush disaster induced by mining under the thin bedrock. J. Loss Prevent. Proc. 2019, 57, 1–6. [Google Scholar] [CrossRef]
- Shi, L.Q.; Singh, R.N. Study of mine water in rush from floor strata through faults. Mine Water Environ. 2001, 20, 140–147. [Google Scholar] [CrossRef]
- Li, S.C.; Wang, J.; Li, L.P.; Shi, S.S.; Zhou, Z.Q. The theoretical and numerical analysis of water inrush through filling structures. Math. Comput. Simulat. 2019, 162, 115–134. [Google Scholar] [CrossRef]
- Wu, J.; Li, S.C.; Xu, Z.H.; Zhao, J. Determination of required rock thickness to resist water and mud inrush from karst caves under earthquake action. Tunn. Undergr. Space Technol. 2019, 85, 43–55. [Google Scholar] [CrossRef]
- Zhang, X.; Sanderson, D.J.; Barker, A.J. Numerical study of fluid flow of deforming fractured rocks using dual permeability model. Geophys. J. Int. 2002, 151, 452–468. [Google Scholar] [CrossRef] [Green Version]
- Lin, C.J.; Zhang, M.; Zhou, Z.Q.; Li, L.P.; Shi, S.S.; Chen, Y.X.; Dai, W.J. A new quantitative method for risk assessment of water inrush in karst tunnels based on variable weight function and improved cloud model. Tunn. Undergr. Space Technol. 2020, 95, 103136. [Google Scholar] [CrossRef]
- Bukowski, P. Water hazard assessment in active shafts in upper Silesian Coal Basin mines. Mine Water Environ. 2011, 30, 302–311. [Google Scholar] [CrossRef] [Green Version]
- Zarei, H.R.; Uromeihy, A.; Sharifzadeh, M. Evaluation of high local groundwater inflow to a rock tunnel by characterization of geological features. Tunn. Undergr. Space Technol. 2011, 26, 364–373. [Google Scholar] [CrossRef]
- Islam, M.; Islam, M. Water inrush hazard in Barapukuria coal mine, Dinajpur District, Bangladesh. Bangladesh J. Geol. 2005, 24, 1–17. [Google Scholar]
- Song, K.I.; Cho, G.C.; Chang, S.B. Identification, remediation, and analysis of karst sinkholes in the longest railroad tunnel in South Korea. Eng. Geol. 2012, 135–136, 92–105. [Google Scholar] [CrossRef]
- Lin, G.; Song, R. Research on the mechanism and treatment technology of mud gushing in karst tunnel. Tunnel Constr. 2012, 32, 169–174. (In Chinese) [Google Scholar]
- Chen, T.Y. Study on Regional Seepage Field of Natm Tunnel and Model Tests of Catastrophe Occurance in Debris Flow Strata; Southwest Jiaotong University: Chengdu, China, 2010. [Google Scholar]
- Shahri, A.A.; Larsson, S.; Renkel, C. Artificial intelligence models to generate visualized bedrock level: A case study in Sweden. Model. Earth Syst. Environ. 2020, 6, 1509–1528. [Google Scholar] [CrossRef]
- Pfaffhuber, A.A.; Grimstad, E.; Domaas, U.; Auken, E.; Foged, N.; Halkjær, M. Airborne EM mapping of rockslides and tunneling hazards. Lead. Edge 2010, 29, 956–959. [Google Scholar] [CrossRef]
- Ma, D.; Cai, X.; Li, Q.; Duan, H. In-situ and numerical investigation of groundwater inrush hazard from grouted karst collapse pillar in longwall mining. Water 2018, 10, 1187. [Google Scholar] [CrossRef] [Green Version]
- Yau, K.; Paraskevopoulou, C.; Konstantis, S. Spatial variability of karst and effect on tunnel lining and water inflow. A probabilistic approach. Tunn. Undergr. Space Technol. 2020, 97, 103248. [Google Scholar] [CrossRef]
- Shahri, A.A.; Kheiri, A.; Hamzeh, A. Subsurface topographic modeling using geospatial and data driven algorithm. ISPRS Int. J. Geo-Inf. 2021, 10, 341. [Google Scholar] [CrossRef]
- Shahri, A.A.; Asheghi, R.; Zak, M.K. A hybridized intelligence model to improve the predictability level of strength index parameters of rocks. Neural Comput. Appl. 2021, 33, 3841–3854. [Google Scholar] [CrossRef]
- Asheghi, R.; Hosseini, S.A.; Saneie, M.; Shahri, A.A. Updating the neural network sediment load models using different sensitivity analysis methods: A regional application. J. Hydroinform. 2020, 22, 562–577. [Google Scholar] [CrossRef] [Green Version]
Figure 1.
Regional geological structure of Yonglian Tunnel.

Figure 2.
Hydrogeological profile of Yonglian Tunnel.

Figure 3.
Water and mud inrush in the left tunnel for the second time.

Figure 4.
Water and mud inrush in left tunnel at third time.

Figure 5.
Inrush in right tunnel for the second time.

Figure 6.
Inrush in right tunnel for the third time.

Figure 7.
Inrush in right tunnel at sixth time.

Figure 8.
Inrush in right tunnel at seventh time.

Figure 9.
Subsidence collapse after water and mud inrush. (a) Pictures of the surface collapse; (b) The relative positions of surface collapse area and F2 fault.
Figure 9.
Subsidence collapse after water and mud inrush. (a) Pictures of the surface collapse; (b) The relative positions of surface collapse area and F2 fault.

Figure 10.
Rock cores in F2 fault zone.

Figure 11.
Confluence area of F2 and F5 fault zone.

Figure 12.
Circumstance of water inflow in tunnel. (a) Water dropping from the arch at first; (b) water flow increasing at the outlet; and (c) a large channel formed.
Figure 12.
Circumstance of water inflow in tunnel. (a) Water dropping from the arch at first; (b) water flow increasing at the outlet; and (c) a large channel formed.

Figure 13.
Curve of water inflow during the generation stage.

Figure 14.
Curve of water inflow during the development stage.


Table 1.
Circumstances of water and mud inrush in left tunnel.
| Time | Sequence | Description | Volume of Mixture of Water and Mud (m3) | Volume of Mud (m3) |
|---|---|---|---|---|
| 11:30 p.m. on 7/2/2012 | 1st | Water and mud inrush | 2000 | 600 |
| 4:20 a.m. on 7/3 | 2nd | Water and mud inrush | 5000 | 1200 |
| 10:50 a.m. on 7/3 | 3rd | Water and mud inrush | 30,000 | 3000 |
| Afternoon on 7/15 | 4th | Mud inrush | 1100 | 1100 |
| 2:30 p.m. on 7/24 | 5th | Mud inrush | 4000 | 4000 |
| 8/13, 8/15 and 8/19 | 6th–8th | Mud inrush | 4200 | 4200 |
| unknown | 3000 m3 mud gushing out during imperceptible period | 3000 | 3000 | |
| 11 a.m. on 9/19 | After cleaning of accumulated silt, the team backfilled sag at the face and sealed the outlet. | |||
| Sum | 8 times | 49,300 | 17,100 |
Table 2.
Circumstances of water and mud inrush in right tunnel.
| Time | Sequence | Description | Volume of Mixture of Water and Mud (m3) | Volume of Mud (m3) |
|---|---|---|---|---|
| Afternoon on 7/15/2012 | Water flow occurred in vault at YK91 + 385. The position (365–380) deformed at 3–10 cm/d | |||
| 8/12 | 1st | Water and mud inrush | 1100 | 600 |
| 11 a.m. on 9/19 | 2nd | Water and mud inrush | 3000 | 2100 |
| 4 p.m. on 9/23 | 3th | Mud inrush | 4200 | 4200 |
| 9/29 | Surface collapse at the hill top | |||
| 10/1 | 4th and 5th | Mud inrush | 2200 | 2200 |
| 10/7 | 6th | Mud inrush | 4900 | 4900 |
| 10/25 | 7th | Mud inrush | 8500 | 8500 |
| Sum | 7 times | 23,900 | 22,500 |
Publisher’s Note: MDPI stays neutral with regard to jurisdictional claims in published maps and institutional affiliations. |
© 2021 by the authors. Licensee MDPI, Basel, Switzerland. This article is an open access article distributed under the terms and conditions of the Creative Commons Attribution (CC BY) license (https://creativecommons.org/licenses/by/4.0/).
Share and Cite
MDPI and ACS Style
Liu, J.; Li, Z.; Zhang, X.; Weng, X. Analysis of Water and Mud Inrush in Tunnel Fault Fracture Zone—A Case Study of Yonglian Tunnel. Sustainability 2021, 13, 9585. https://0-doi-org.brum.beds.ac.uk/10.3390/su13179585
AMA Style
Liu J, Li Z, Zhang X, Weng X. Analysis of Water and Mud Inrush in Tunnel Fault Fracture Zone—A Case Study of Yonglian Tunnel. Sustainability. 2021; 13(17):9585. https://0-doi-org.brum.beds.ac.uk/10.3390/su13179585
Chicago/Turabian StyleLiu, Jun, Zhipeng Li, Xiao Zhang, and Xianjie Weng. 2021. "Analysis of Water and Mud Inrush in Tunnel Fault Fracture Zone—A Case Study of Yonglian Tunnel" Sustainability 13, no. 17: 9585. https://0-doi-org.brum.beds.ac.uk/10.3390/su13179585
Note that from the first issue of 2016, this journal uses article numbers instead of page numbers. See further details here.