
Redesigning the Municipal Solid Waste Supply Chain Considering the Classified Collection and Disposal: A Case Study of Incinerable Waste in Beijing

Abstract
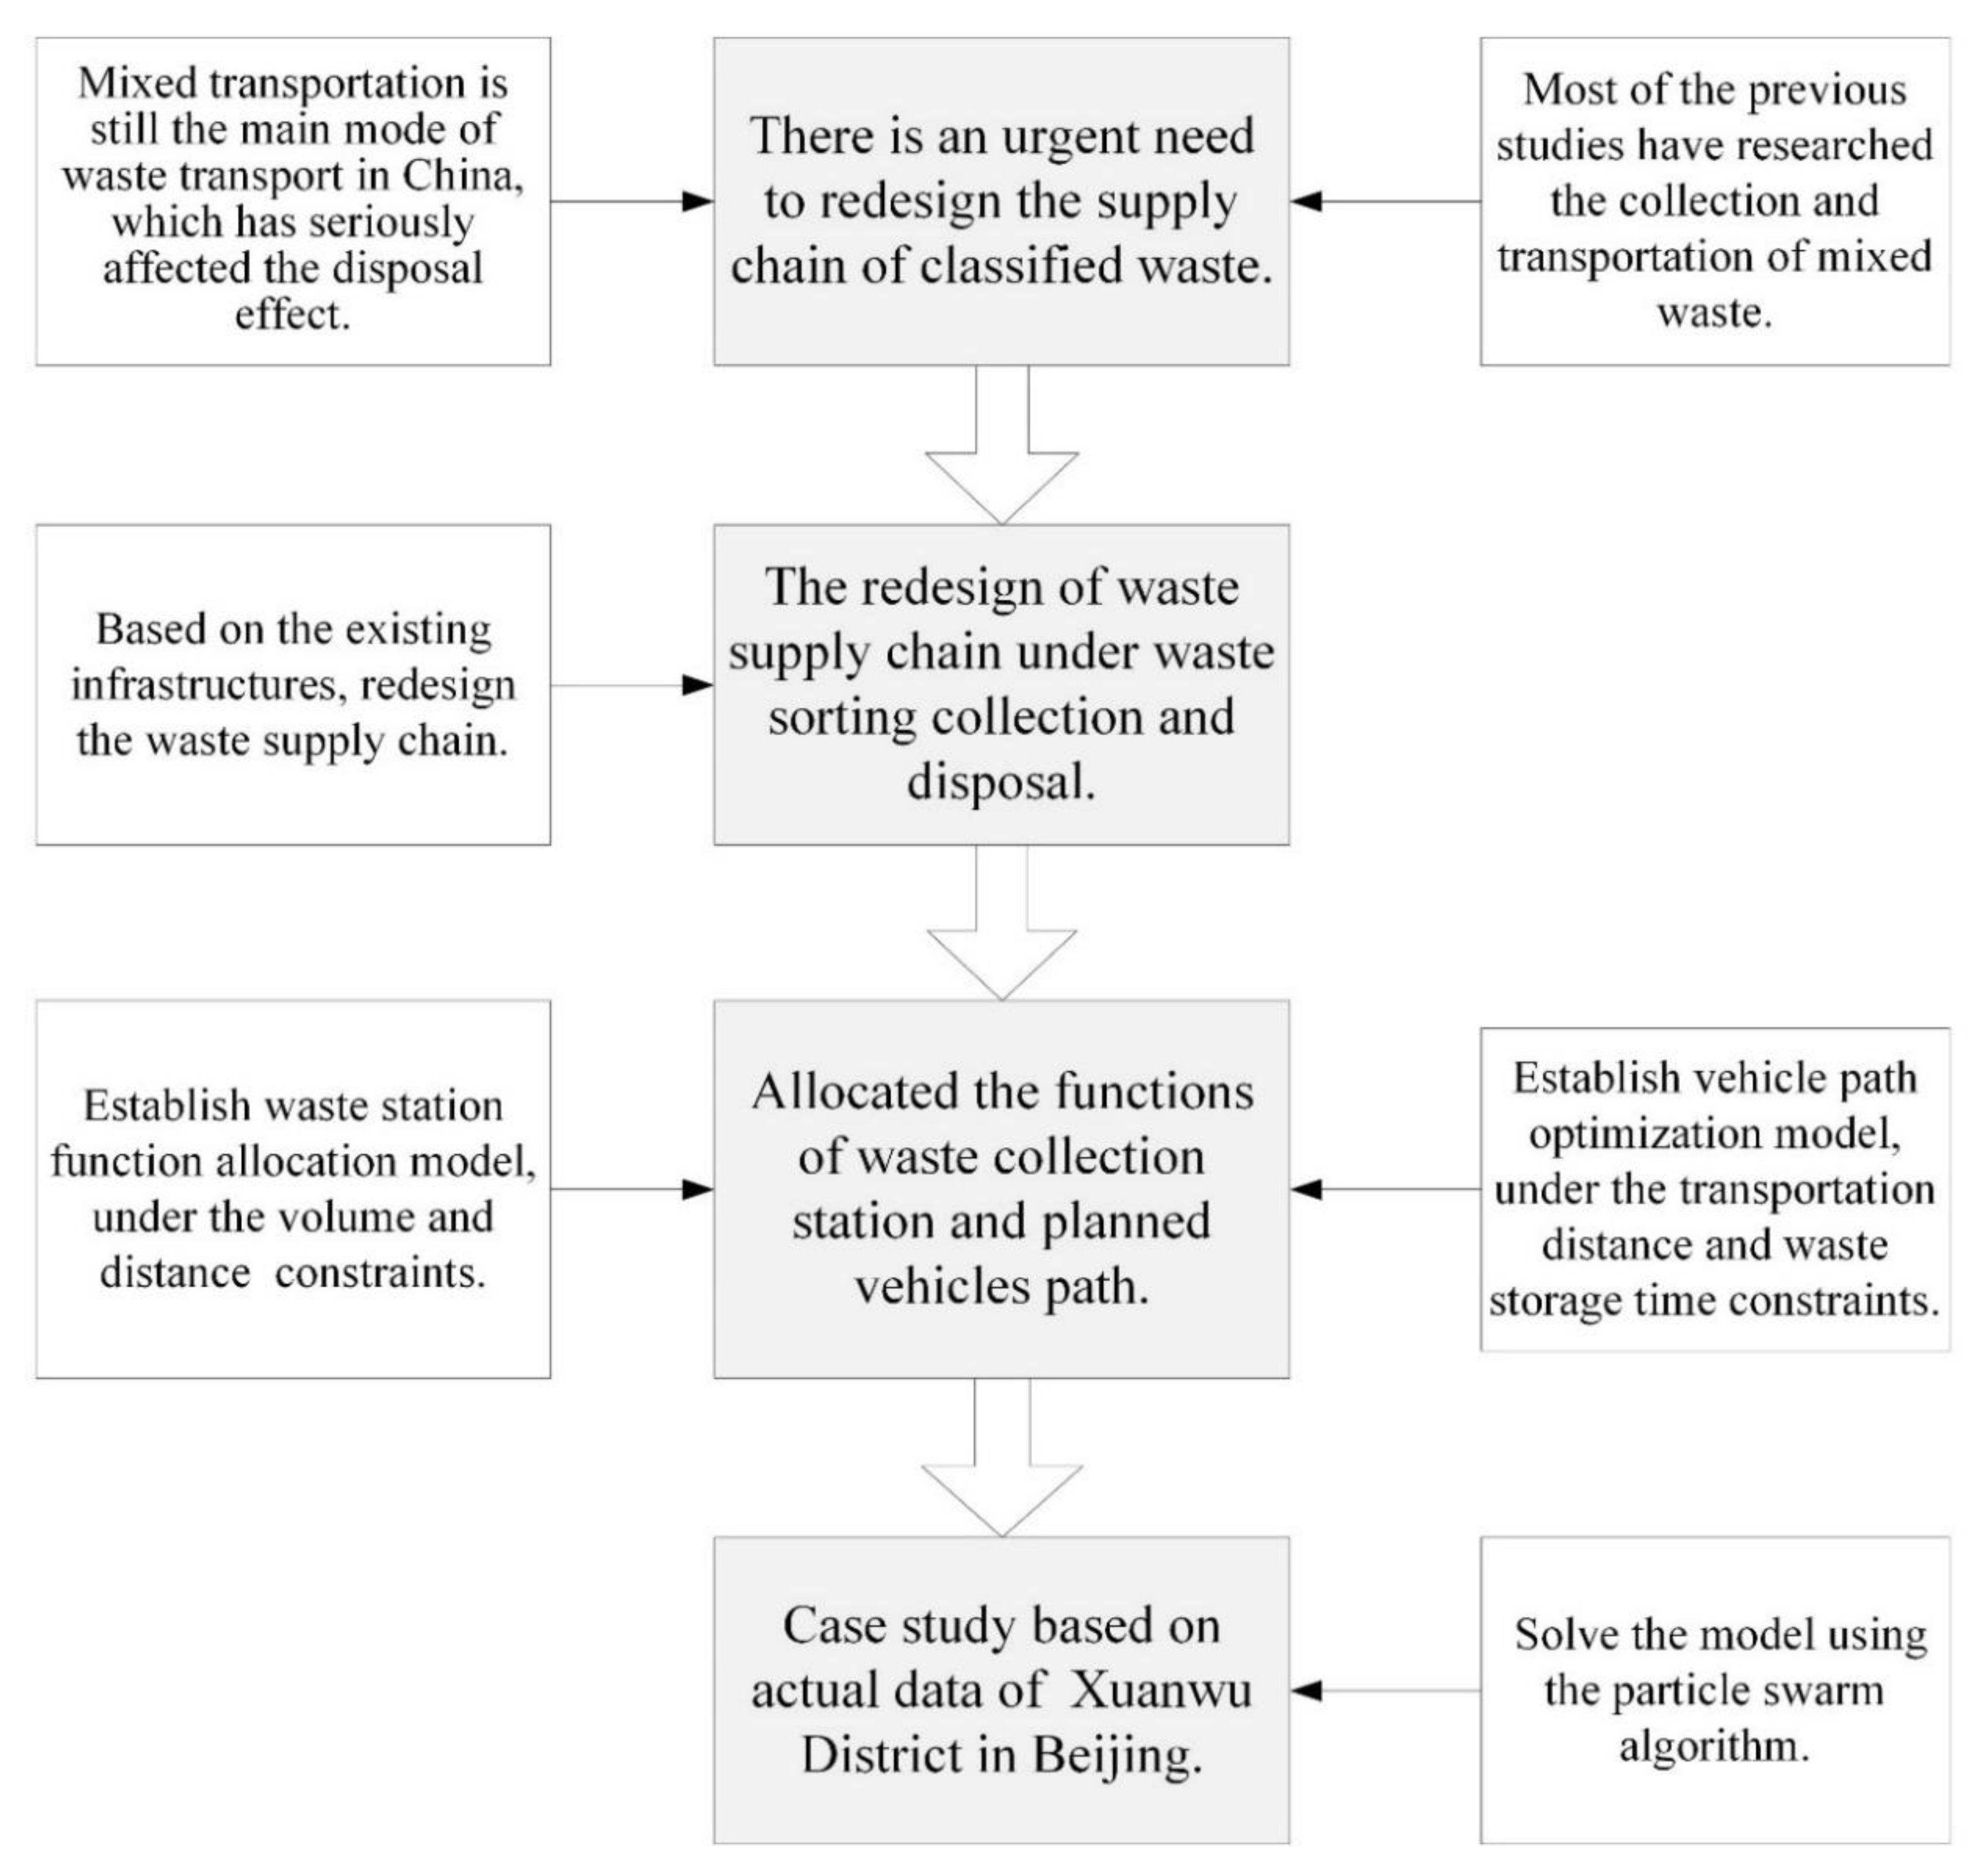
:1. Introduction
2. Literature Review
2.1. The Design of MSW Supply Chain
2.2. The Layout of Waste Treatment Facility
2.3. The Optimization of Waste Transportation Routes
3. The Methodology for Supply Chain Redesign
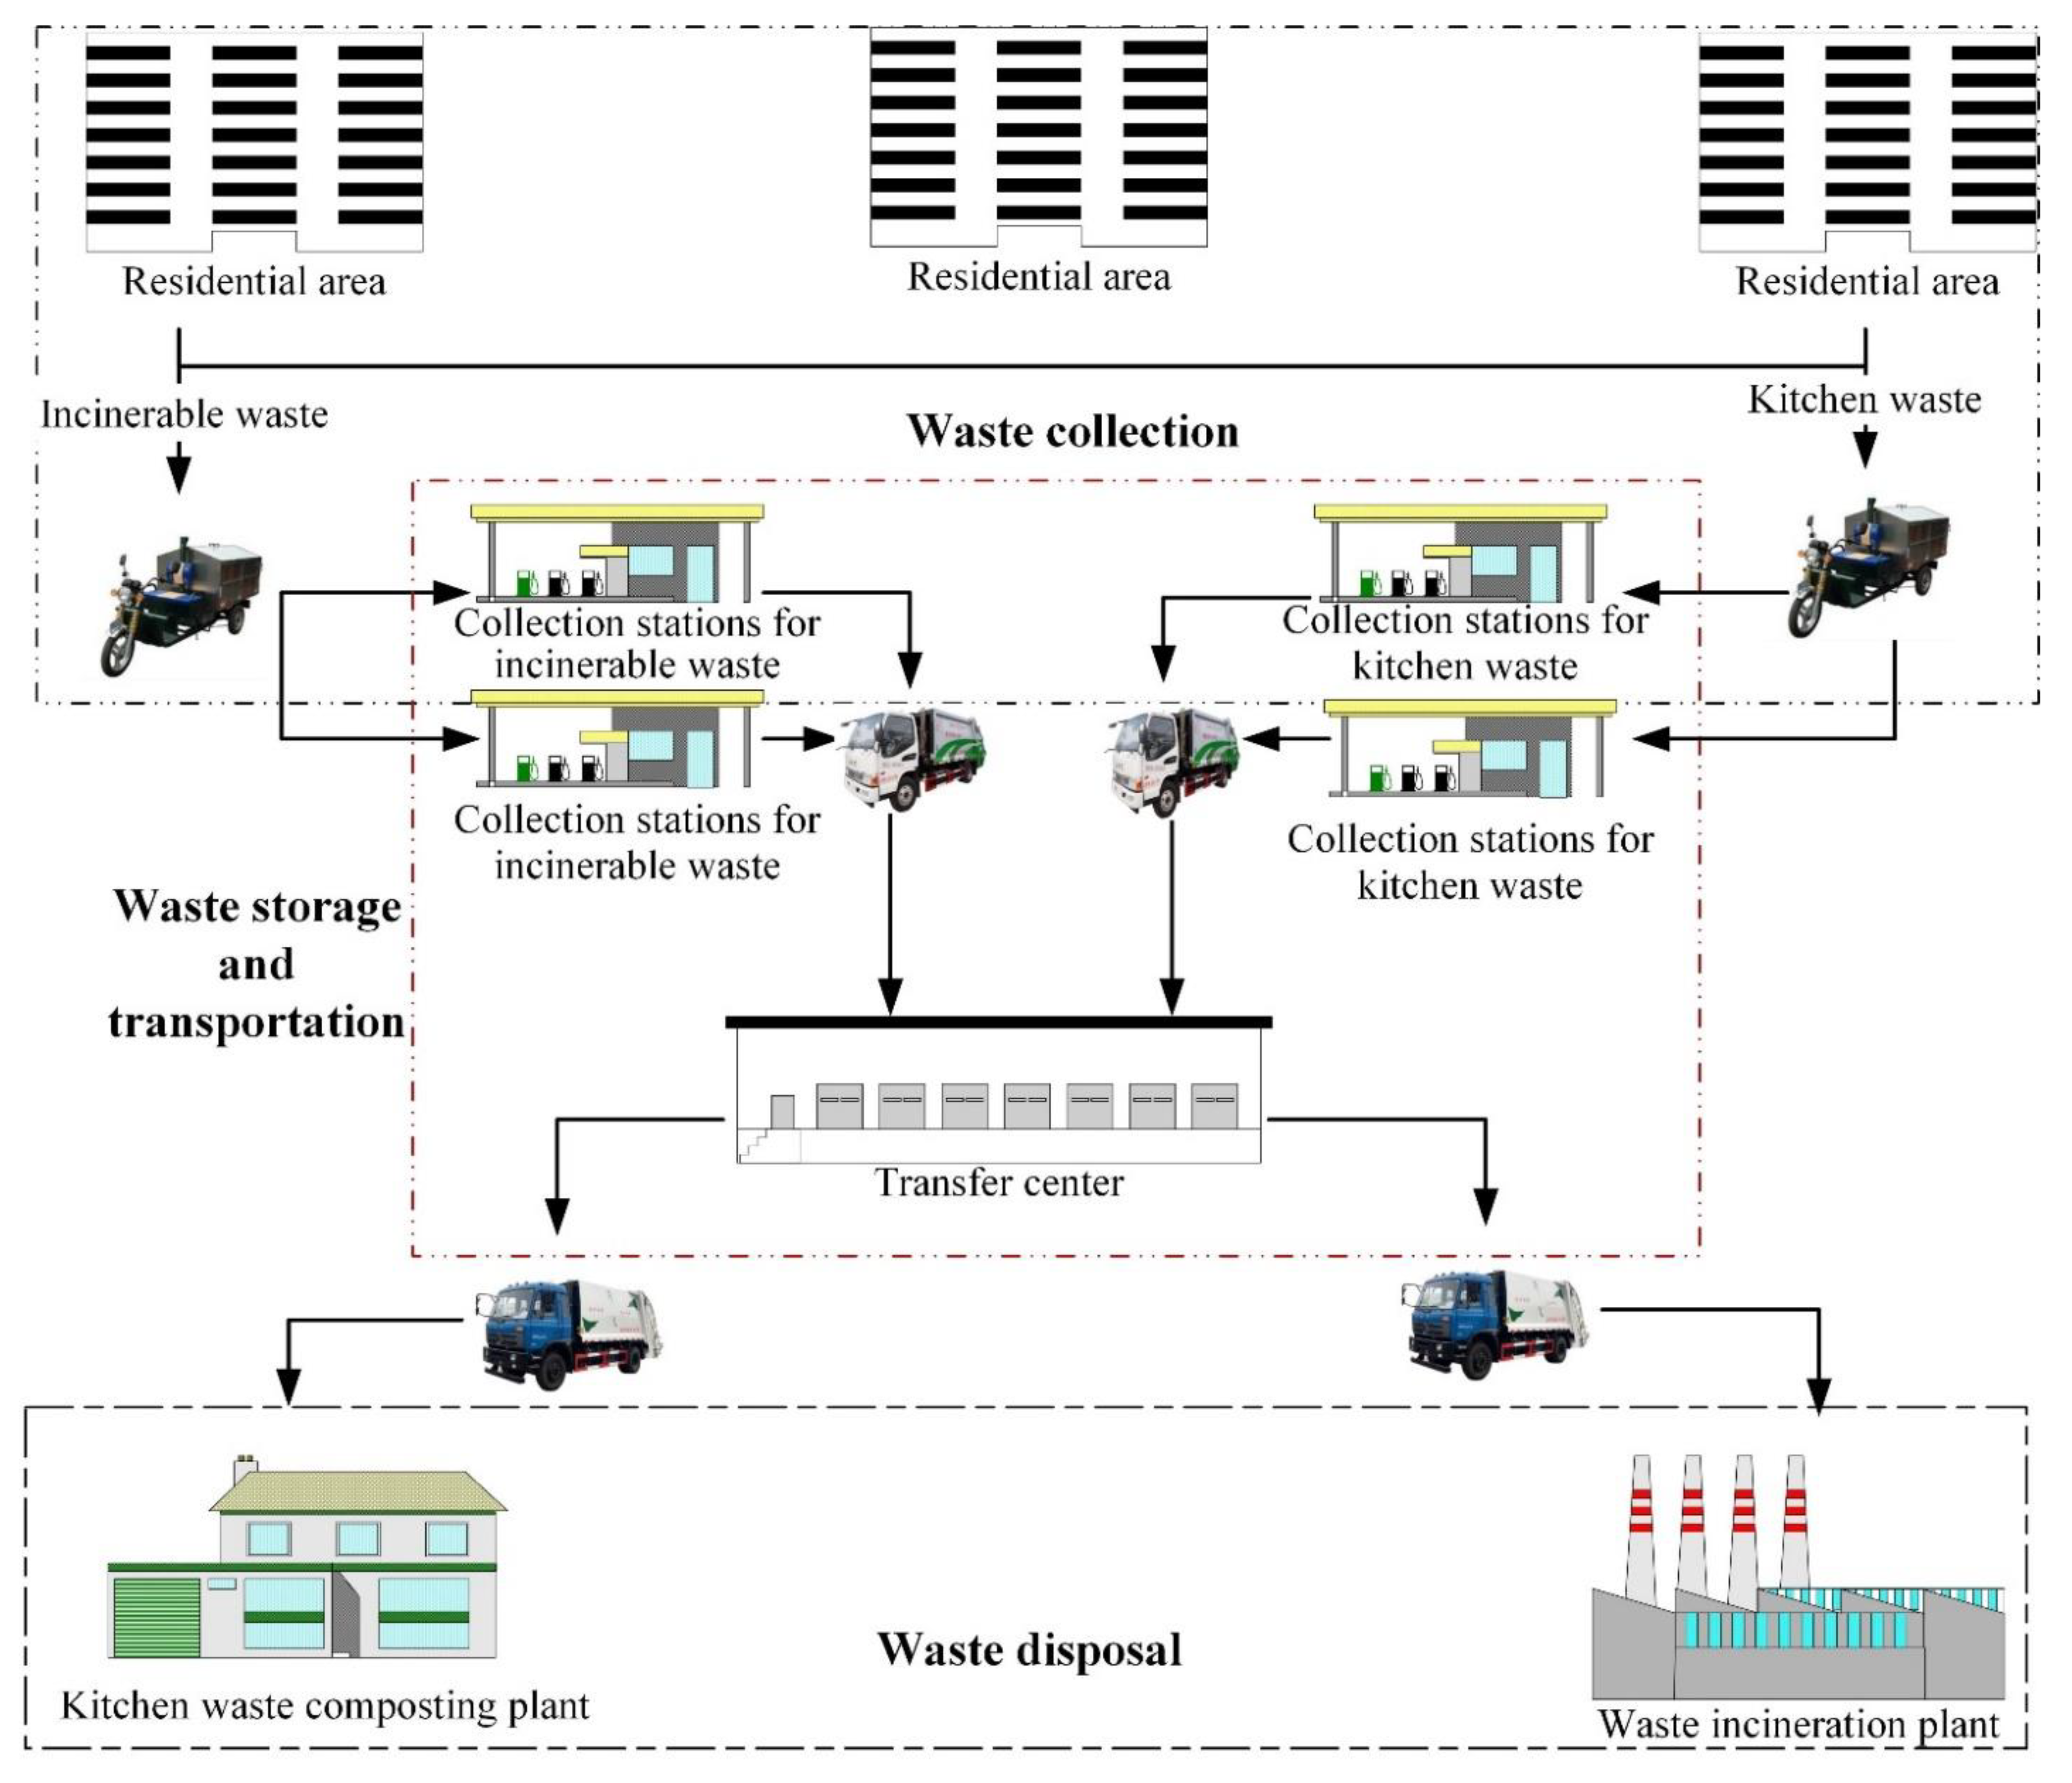
3.1. The Supply Chain Redesign
3.2. The Function Allocation Model for Waste Collection Station
3.2.1. Modeling Assumptions
- (1)
- The waste production sources are evenly distributed around the collection station.
- (2)
- The capacity of the collection station meets the maximum volume of waste in one day.
- (3)
- The unit cost of waste transportation is the same between all stations.
- (4)
- Collection stations can gather the same kind of waste from multiple residential areas.
- (5)
- The same kind of waste in a waste production source can be transported to multiple collection stations.
- (6)
- Straight-line transportation can be realized from the waste production source to the collection station, and the transportation distance can be calculated by the Euclidean Distance.
- (7)
- The construction and operation of collection stations are the same, and the impact of collection stations on the surrounding environment is equal.
- (8)
- There is no demolished risk for the existing collection stations.
3.2.2. Symbol Description
- (1)
- Common variables:
The aggregate of waste collection stations, , . The aggregate of waste production source, The capacity of waste collection station, The volume of kitchen waste in waste production source , The volume of incinerable waste in waste production source , The volume of kitchen waste transferred from production source to collection station The volume of incinerable waste transferred from production source to collection station The distance between and - (2)
- Decision variables:
3.2.3. The Function Allocation Model
3.3. The Transportation Path Planning Model for Waste Truck
3.3.1. Modeling Assumptions
- (1)
- The amount of waste in the collection station is known and will not significantly change.
- (2)
- When the load and time permit, the truck can go to multiple collection stations to transport waste.
- (3)
- The truck does not affect each other in driving and operation;
- (4)
- The opening hours of the collection station are consistent with the waste truck.
- (5)
- The truck travels at the same speed.
- (6)
- Straight-line transportation can be realized between collection stations, and the distance is equal to the Euclidean Distance.
- (7)
- All trucks start from the transfer center, and after finished waste transportation, they will return to the transfer center.
- (8)
- The unit transportation cost of trucks is the same.
3.3.2. Symbol Description
- (1)
- Common variables:
The aggregate of waste collection stations i that gather the same kind of waste, , The aggregate of the transfer center and the aggregate of the waste collection station The volume of waste in the collection station i, . The aggregate of a waste truck k, , The number aggregate of a truck, , . The maximum load of a truck The collection station starting work time The collection station ending work time v The speed of a truck Time for waste truck loading The time point that the collection station i was cleared by the truck k when it starts from transfer center in Cth time. The transported volume of waste in collection stations i, if the truck k collected waste from collection station i when it starts from transfer center in Cth time. - (2)
- Decision variables:
3.3.3. The Transportation Path Planning Model
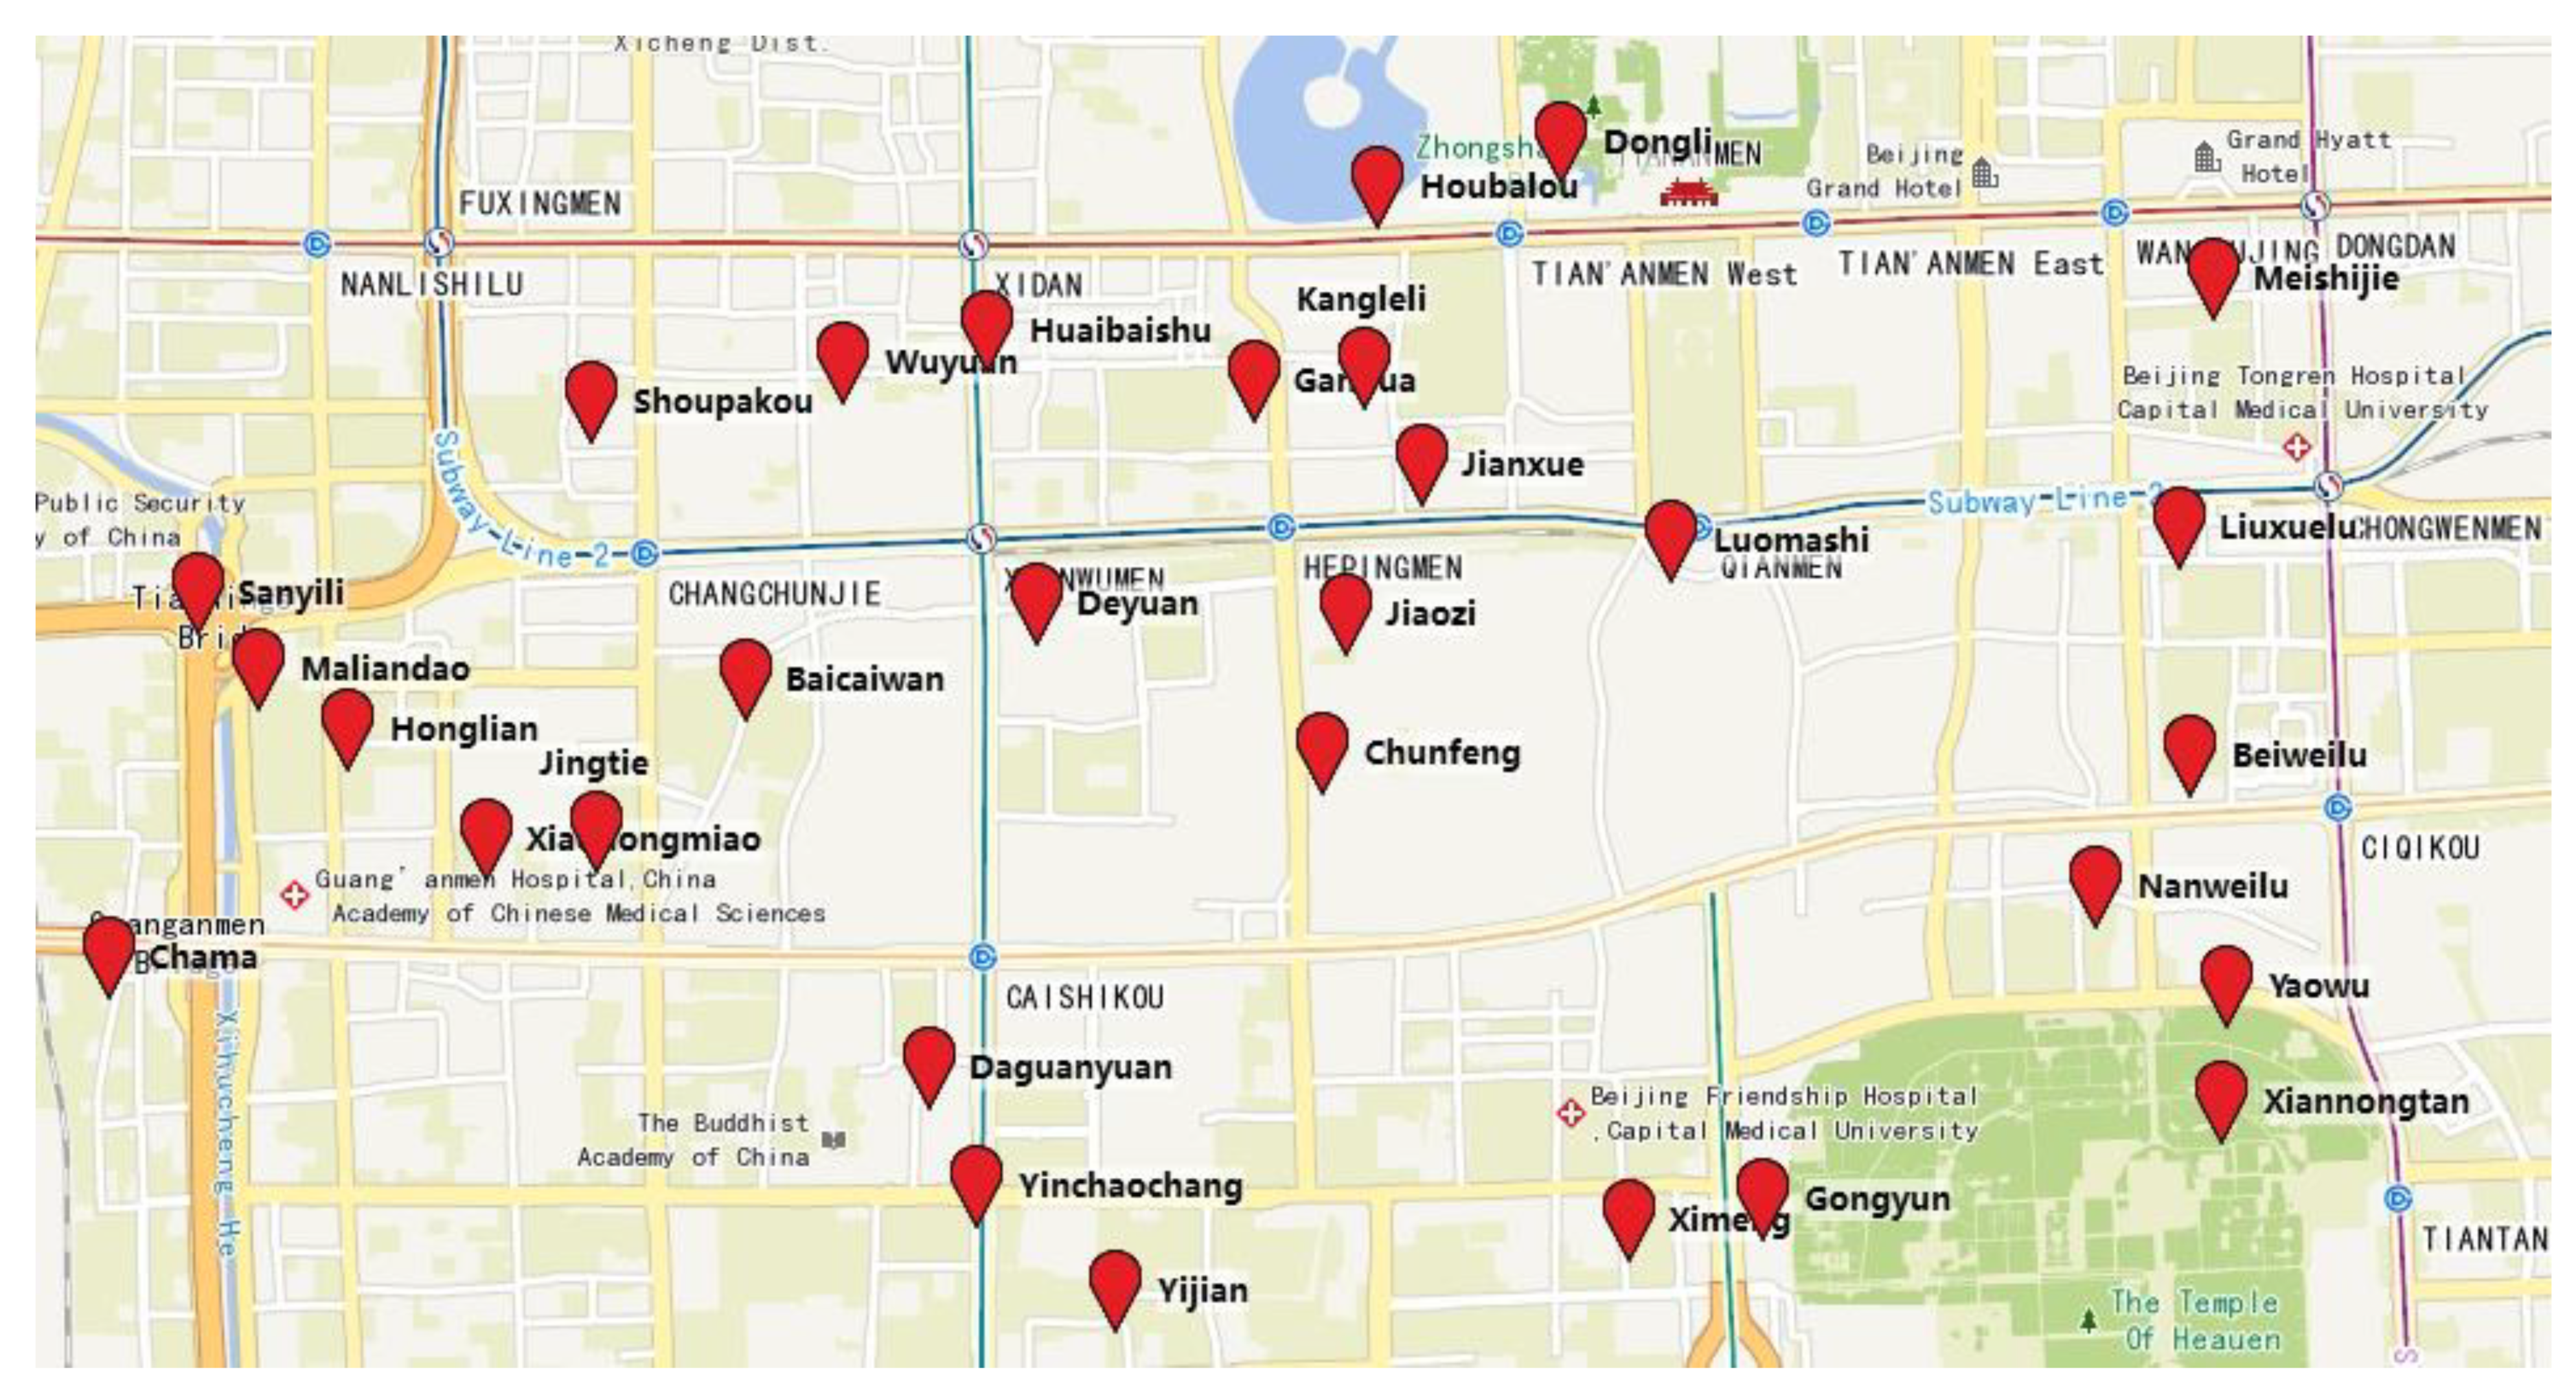
4. Data Collection and Processing
- (1)
- The basic data of waste output and collection stations
- (2)
- The basic data of vehicles
- (3)
- The basic data of working time
5. Results and Discussion
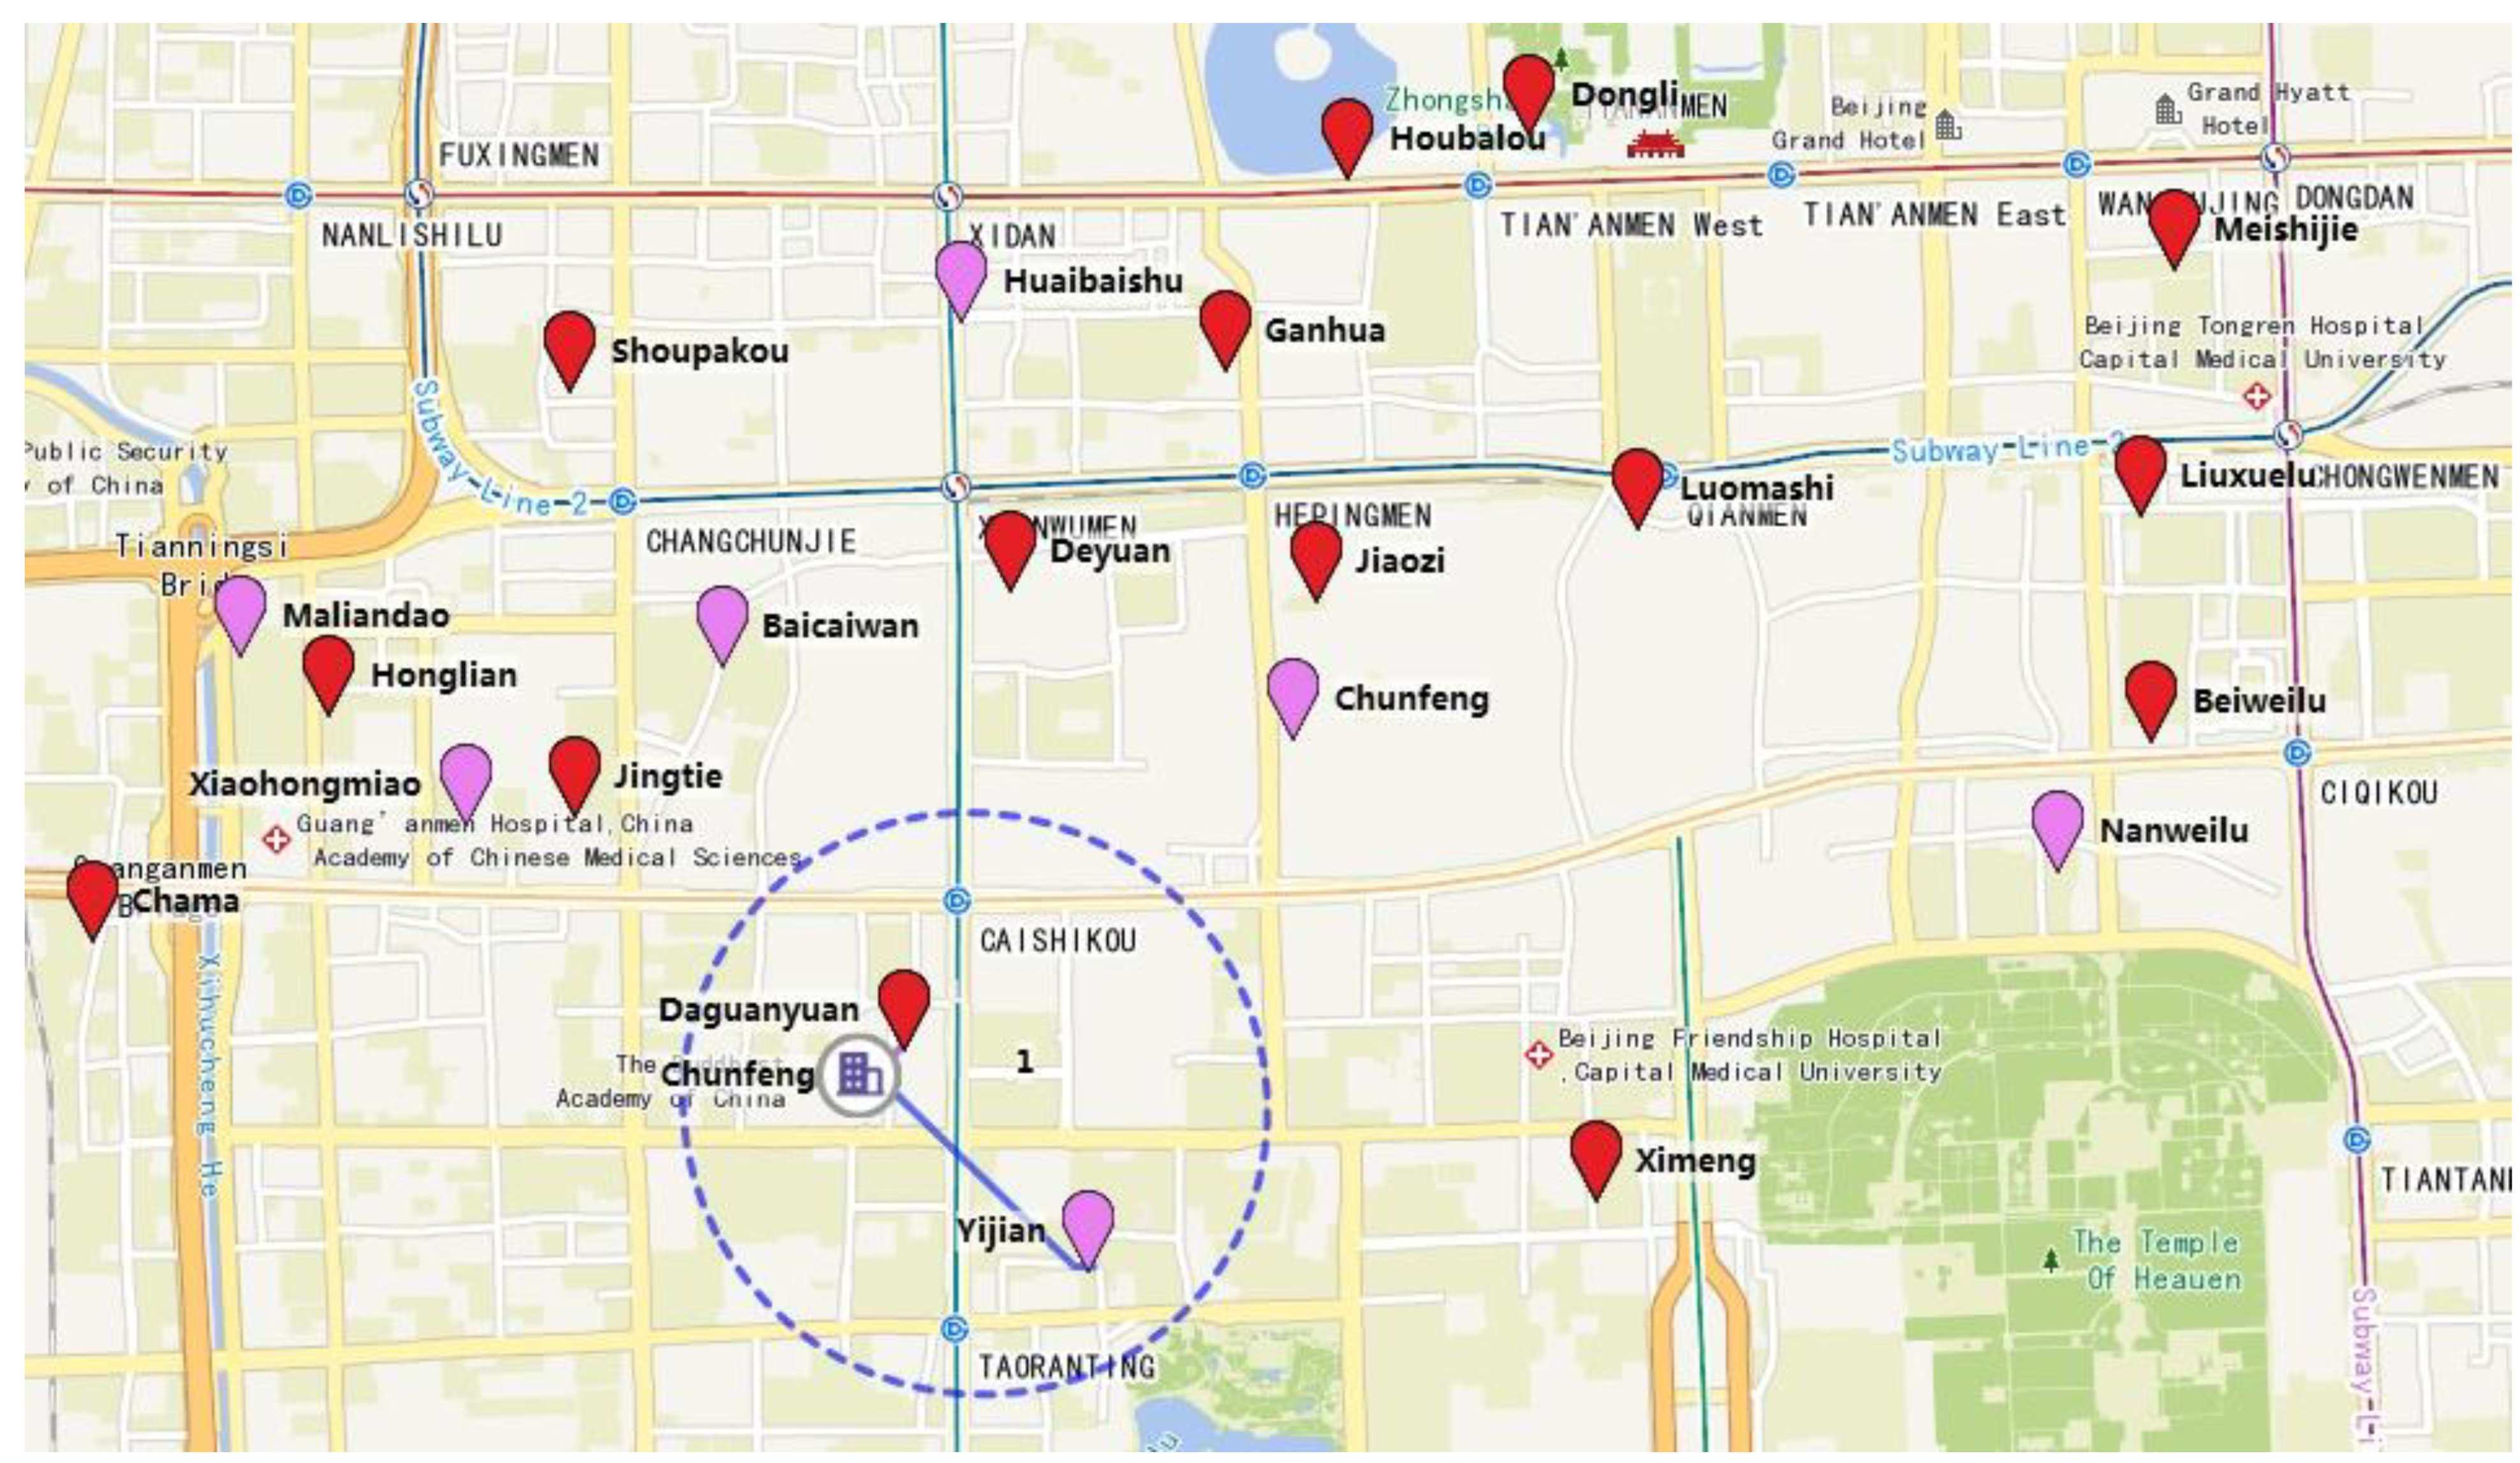
5.1. The Function Allocated Result of Collection Stations
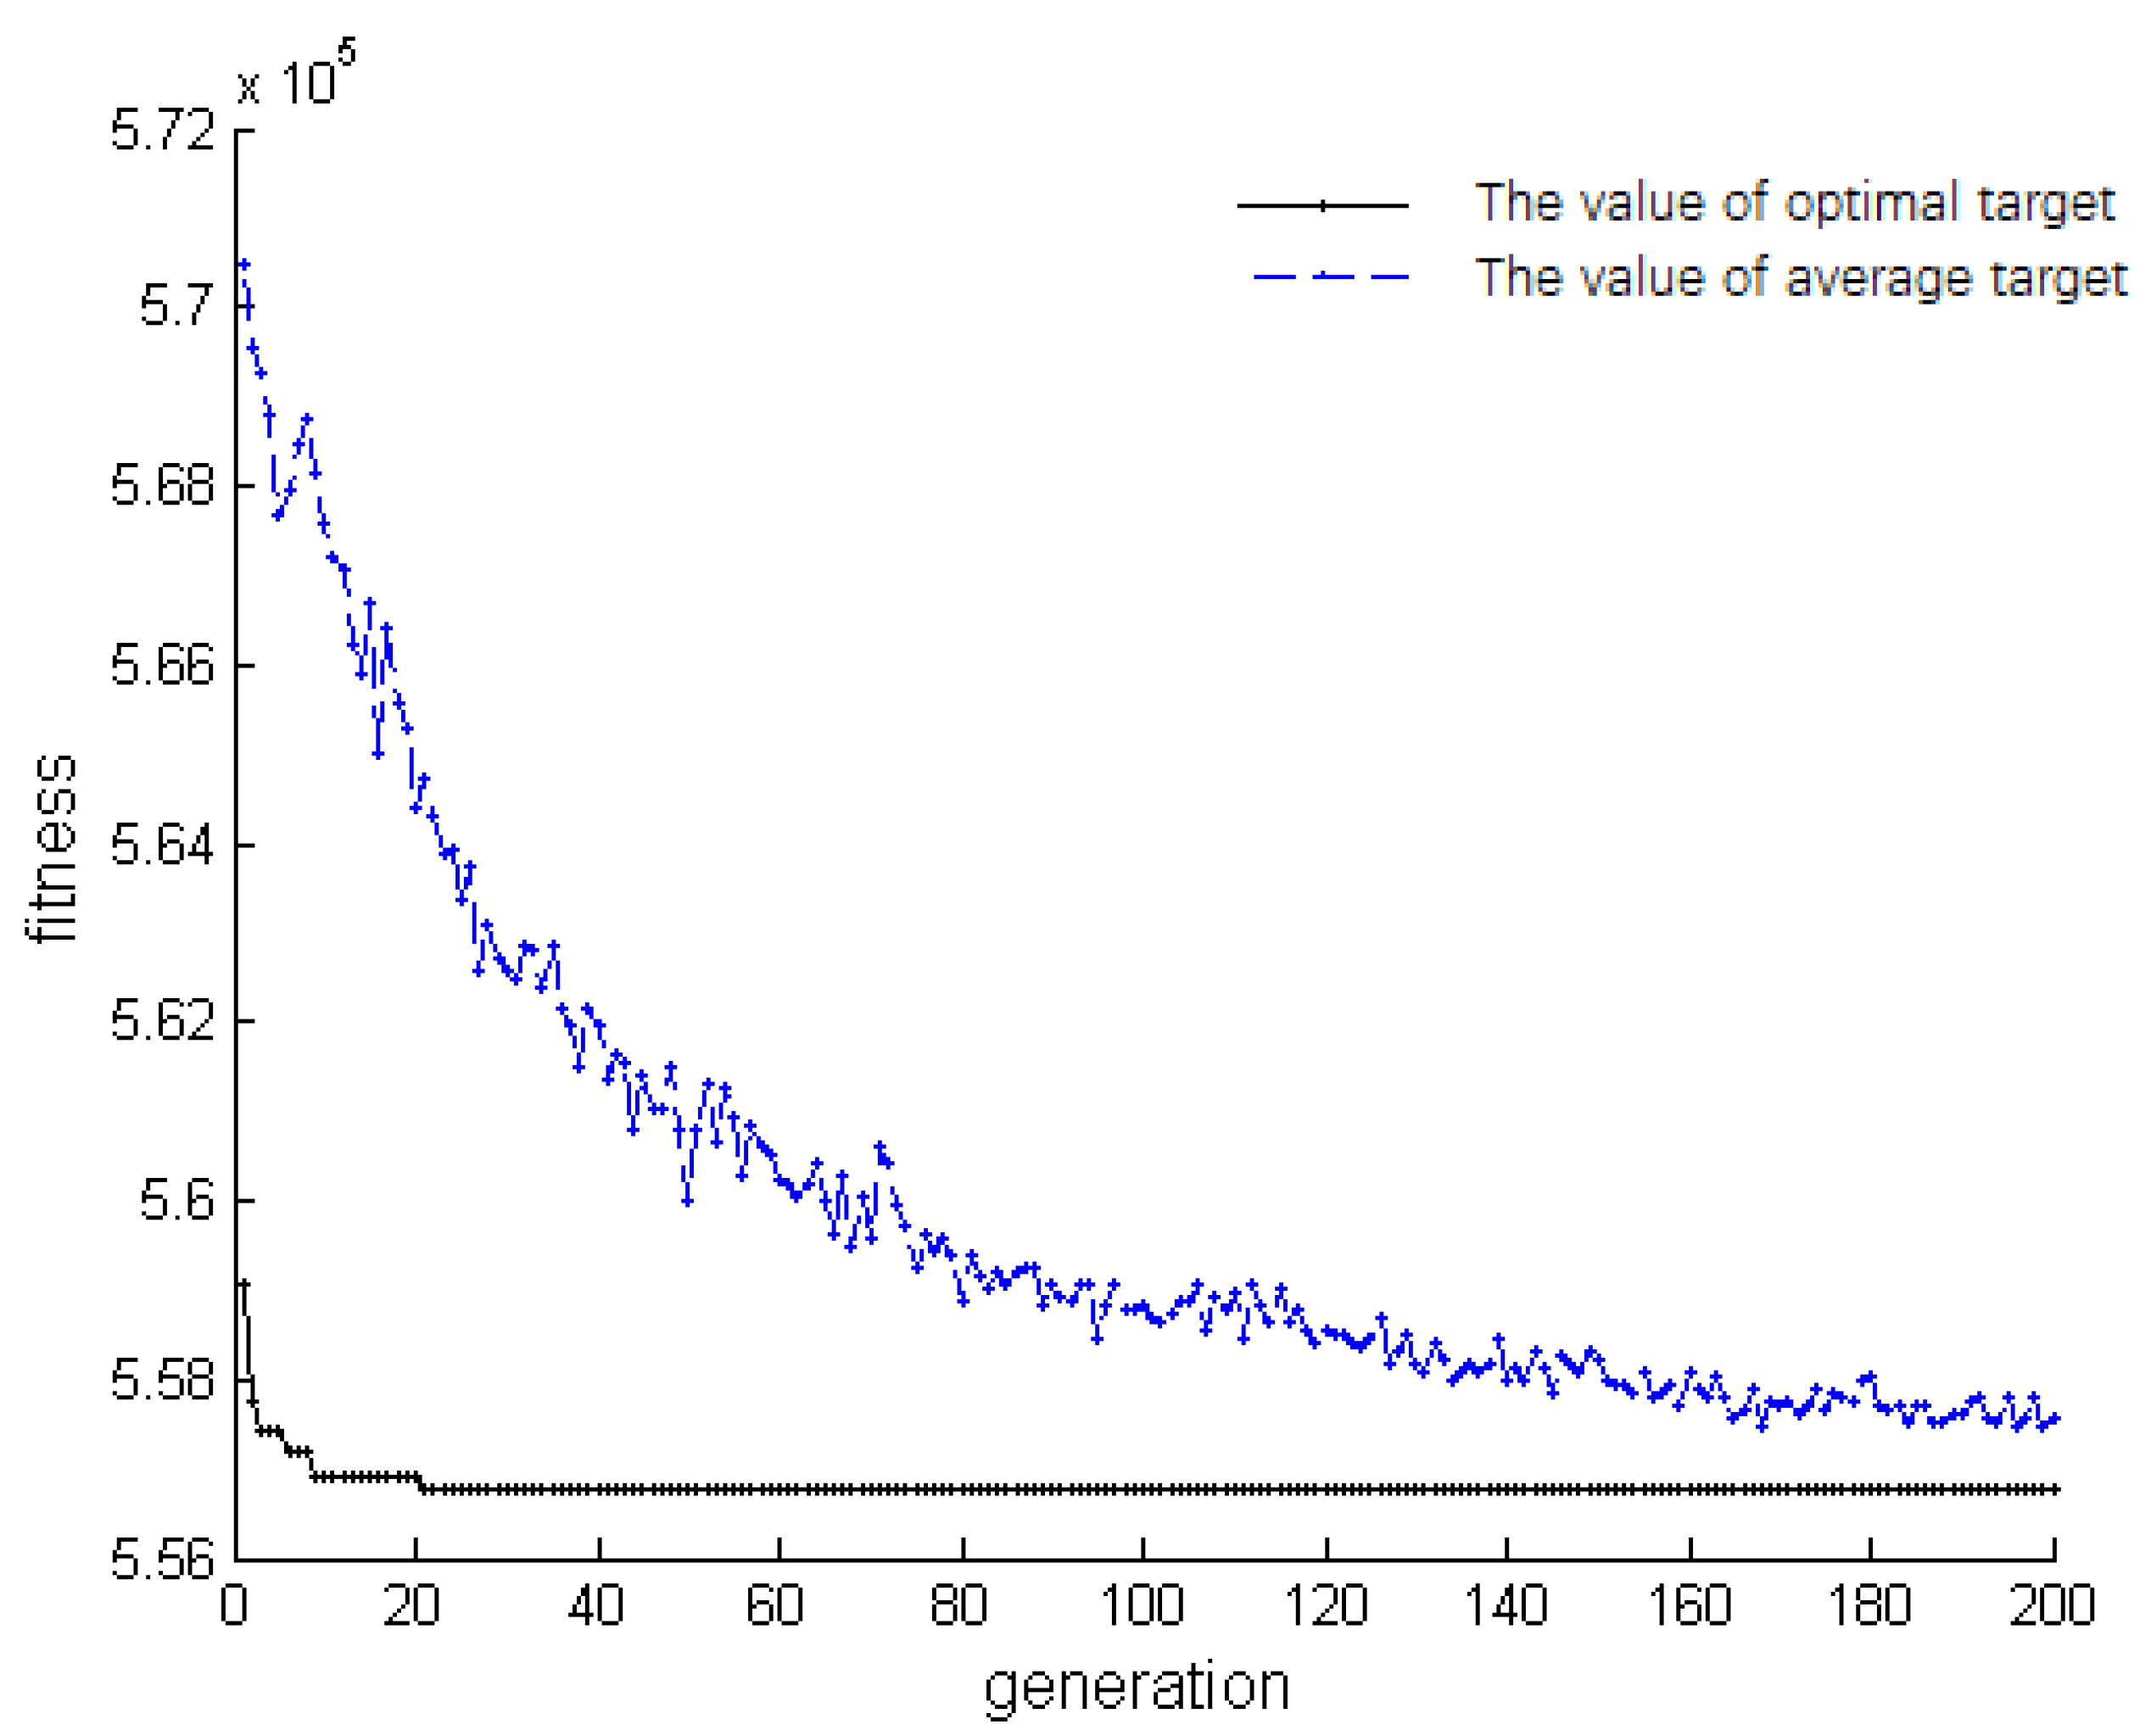
5.2. The Results of Transportation Path Planning
- (1)
- The dimensionless treatment of objective functions
- (2)
- Model solution using particle swarm optimization
5.3. Discussion of the Supply Chain Redesign Results
6. Conclusions
- (1)
- When allocating the functions of waste collection stations, this paper only considers the transportation volume and collection station capacity and does not consider the environment around the collection station and the residents’ attitude. Because of the limited data, in the function allocation model, we only use 30 waste collection stations simulating the waste generation sources. The actual waste generation sources are more complicated.
- (2)
- The production and composition of waste will vary with seasons and positions. The composition of waste in residential areas and commercial areas is different. In this paper, neither the function allocation model for waste collection stations nor the transportation path planning model for waste trucks takes the changes of waste production and composition into account. In the model actual application, the changes in waste production and composition should be considered.
Author Contributions
Funding
Institutional Review Board Statement
Informed Consent Statement
Data Availability Statement
Conflicts of Interest
References
- Guojun, S.; Yueyang, S.; Chang, Z.; Shuai, L.; Ying, W. Social cost accounting for municipal solid waste incineration in Beijing. China Popul. Resour. Environ. 2017, 27, 17–27. [Google Scholar]
- Mota, B.; Gomes, M.I.; Carvalho, A.; Barbosa-Povoa, A.P. Sustainable supply chains: An integrated modeling approach under uncertainty. Omega 2018, 77, 32–57. [Google Scholar] [CrossRef]
- Pan, S.Y.; Du, M.A.; Huang, I.T.; Liu, I.H.; Chang, E.E.; Chiang, P.-C. Strategies on implementation of waste-to-energy (WTE) supply chain for circular economy system: A review. J. Clean. Prod. 2015, 108, 409–421. [Google Scholar] [CrossRef]
- Rai, R.K.; Nepal, M.; Khadayat, M.S.; Bhardwaj, B. Improving Municipal Solid Waste Collection Services in Developing Countries: A Case of Bharatpur Metropolitan City, Nepal. Sustainability 2019, 11, 3010. [Google Scholar] [CrossRef] [Green Version]
- Hannan, M.A.; Hossain Lipu, M.S.; Akhtar, M.; Begum, R.A.; Al Mamun, M.A.; Hussain, A.; Mia, M.S.; Basri, H. Solid waste collection optimization objectives, constraints, modeling approaches, and their challenges toward achieving sustainable development goals. J. Clean. Prod. 2020, 277. [Google Scholar] [CrossRef]
- Peng, L.; Gu, M.; Peng, Z. Study on the Optimized Mode of Waste Governance with Sustainable Urban Development Case from China’s Urban Waste Classified Collection. Sustainability 2020, 12, 3706. [Google Scholar] [CrossRef]
- Jafari, H.; Hejazi, S.R.; Rasti-Barzoki, M. Sustainable development by waste recycling under a three-echelon supply chain: A game-theoretic approach. J. Clean. Prod. 2017, 142, 2252–2261. [Google Scholar] [CrossRef]
- Ghalehkhondabi, I.; Maihami, R. Sustainable municipal solid waste disposal supply chain analysis under price-sensitive demand: A game theory approach. Waste Manag. Res. 2020, 38, 300–311. [Google Scholar] [CrossRef]
- Van Engeland, J.; Beliën, J.; De Boeck, L.; De Jaeger, S. Literature review: Strategic network optimization models in waste reverse supply chains. Omega 2020, 91, 102012. [Google Scholar] [CrossRef]
- Mamashli, Z.; Javadian, N. Sustainable design modifications municipal solid waste management network and better optimization for risk reduction analyses. J. Clean. Prod. 2021, 279, 123824. [Google Scholar] [CrossRef]
- Yılmaz Balaman, Ş.; Wright, D.G.; Scott, J.; Matopoulos, A. Network design and technology management for waste to energy production: An integrated optimization framework under the principles of circular economy. Energy 2018, 143, 911–933. [Google Scholar] [CrossRef] [Green Version]
- Xu, Z.; Elomri, A.; Pokharel, S.; Zhang, Q.; Ming, X.G.; Liu, W. Global reverse supply chain design for solid waste recycling under uncertainties and carbon emission constraint. Waste Manag. 2017, 64, 358–370. [Google Scholar] [CrossRef] [PubMed]
- Olapiriyakul, S.; Pannakkong, W.; Kachapanya, W.; Starita, S. Multiobjective Optimization Model for Sustainable Waste Management Network Design. J. Adv. Transp. 2019, 2019, 3612809. [Google Scholar] [CrossRef]
- Mohammadi, M.; Jämsä-Jounela, S.-L.; Harjunkoski, I. Optimal planning of municipal solid waste management systems in an integrated supply chain network. Comput. Chem. Eng. 2019, 123, 155–169. [Google Scholar] [CrossRef]
- Mohammadi, M.; Harjunkoski, I. Performance analysis of waste-to-energy technologies for sustainable energy generation in integrated supply chains. Comput. Chem. Eng. 2020, 140, 106905. [Google Scholar] [CrossRef]
- Saif, Y.; Rizwan, M.; Almansoori, A.; Elkamel, A. Municipality solid waste supply chain optimization to power production under uncertainty. Comput. Chem. Eng. 2019, 121, 338–353. [Google Scholar] [CrossRef]
- Mohammadi, M.; Jämsä-Jounela, S.L.; Harjunkoski, I. Sustainable supply chain network design for the optimal utilization of municipal solid waste. AIChE J. 2018, 65, e16464. [Google Scholar] [CrossRef]
- Zimin, Z. Status and Countermeasures of Waste Collection and Transportation in Xicheng District of Beijing. Environ. Sanit. Eng. 2017, 6, 7–9. [Google Scholar]
- Ying, L.; Shaohua, X.; Jing, Z. Study of Collection and Transportion System of Beijing Municipal Solid Wastes. China Popul. Resour. Environ. 2011, 21, 136–139. [Google Scholar]
- Zhao, W.; Zhenshan, L.; Yabin, F.; Anying, J.; An, X. Characteristics and Influence Factors of the Energy Consumption and Pollutant Discharge of Municipal Solid Waste Transfer Stations in Beijing. Environ. Sci. 2013, 4, 2456–2463. [Google Scholar]
- Yadav, V.; Karmakar, S.; Dikshit, A.K.; Vanjari, S. A feasibility study for the locations of waste transfer stations in urban centers: A case study on the city of Nashik, India. J. Clean. Prod. 2016, 126, 191–205. [Google Scholar] [CrossRef]
- Yadav, V.; Bhurjee, A.K.; Karmakar, S.; Dikshit, A.K. A facility location model for municipal solid waste management system under uncertain environment. Sci. Total. Env. 2017, 603–604, 760–771. [Google Scholar] [CrossRef]
- Sijun, L.; Changfeng, J.; Ming, D.; Yanli, F. Spatial layout optimization and location of urban waste buildings based on GIS-multicria. Sci. Surv. Mapp. 2018, 43, 45–49. [Google Scholar]
- Wang, Y.; Li, J.; An, D.; Xi, B.; Tang, J.; Wang, Y.; Yang, Y. Site selection for municipal solid waste landfill considering environmental health risks. Resour. Conserv. Recycl. 2018, 138, 40–46. [Google Scholar] [CrossRef]
- Demesouka, O.E.; Anagnostopoulos, K.P.; Siskos, E. Spatial multicriteria decision support for robust land-use suitability: The case of landfill site selection in Northeastern Greece. Eur. J. Oper. Res. 2019, 272, 574–586. [Google Scholar] [CrossRef]
- Soroudi, M.; Omrani, G.; Moataar, F.; Jozi, S.A. A comprehensive multi-criteria decision making-based land capability assessment for municipal solid waste landfill sitting. Env. Sci. Pollut. Res. Int. 2018, 25, 27877–27889. [Google Scholar] [CrossRef]
- Spigolon, L.M.; Giannotti, M.; Larocca, A.P.; Russo, M.A.; Souza, N.D.C. Landfill siting based on optimisation, multiple decision analysis, and geographic information system analyses. Waste Manag. Res. 2018, 36, 606–615. [Google Scholar] [CrossRef]
- Liu, K.M.; Lin, S.H.; Hsieh, J.C.; Tzeng, G.H. Improving the food waste composting facilities site selection for sustainable development using a hybrid modified MADM model. Waste Manag. 2018, 75, 44–59. [Google Scholar] [CrossRef] [PubMed]
- Kyriakis, E.; Psomopoulos, C.; Kokkotis, P.; Bourtsalas, A.; Themelis, N. A step by step selection method for the location and the size of a waste-to-energy facility targeting the maximum output energy and minimization of gate fee. Env. Sci. Pollut. Res. Int. 2018, 25, 26715–26724. [Google Scholar] [CrossRef]
- Vecchi, T.P.B.; Surco, D.F.; Constantino, A.A.; Steiner, M.T.A.; Jorge, L.M.M.; Ravagnani, M.A.S.S.; Paraíso, P.R. A sequential approach for the optimization of truck routes for solid waste collection. Process. Saf. Environ. Prot. 2016, 102, 238–250. [Google Scholar] [CrossRef]
- Carlos, M.; Gallardo, A.; Edo-Alcon, N.; Abaso, J.R. Influence of the Municipal Solid Waste Collection System on the Time Spent at a Collection Point: A Case Study. Sustainability 2019, 11, 6481. [Google Scholar] [CrossRef] [Green Version]
- Yonggang, W.; Xiangxin, X.; Mei, L.; Long, Z. Research on City Waste Removal Routes Based on Genetic Algorithm. Comput. Simul. 2012, 4, 259–262. [Google Scholar]
- Son, L.H.; Louati, A. Modeling municipal solid waste collection: A generalized vehicle routing model with multiple transfer stations, gather sites and inhomogeneous vehicles in time windows. Waste Manag. 2016, 52, 34–49. [Google Scholar] [CrossRef]
- Chunping, L. Atmosphere Monitoring and Safe Protective Distance inside and outside Municipal Solid Waste Collecting Station in Beijing. Urban Environ. Urban Ecol. 2017, 24, 39–42. [Google Scholar]
- Zsigraiova, Z.; Semiao, V.; Beijoco, F. Operation costs and pollutant emissions reduction by definition of new collection scheduling and optimization of MSW collection routes using GIS. The case study of Barreiro, Portugal. Waste Manag. 2013, 33, 793–806. [Google Scholar] [CrossRef]
- Inghels, D.; Dullaert, W.; Vigo, D. A service network design model for multimodal municipal solid waste transport. Eur. J. Oper. Res. 2016, 254, 68–79. [Google Scholar] [CrossRef]
- Chatzouridis, C.; Komilis, D. A methodology to optimally site and design municipal solid waste transfer stations using binary programming. Resour. Conserv. Recycl. 2012, 60, 89–98. [Google Scholar] [CrossRef]
- Kinobe, J.R.; Bosona, T.; Gebresenbet, G.; Niwagaba, C.B.; Vinnerås, B. Optimization of waste collection and disposal in Kampala city. Habitat Int. 2015, 49, 126–137. [Google Scholar] [CrossRef]
- Nguyen-Trong, K.; Nguyen-Thi-Ngoc, A.; Nguyen-Ngoc, D.; Dinh-Thi-Hai, V. Optimization of municipal solid waste transportation by integrating GIS analysis, equation-based, and agent-based model. Waste Manag. 2017, 59, 14–22. [Google Scholar] [CrossRef]
- Xue, W.; Cao, K.; Li, W. Municipal solid waste collection optimization in Singapore. Appl. Geogr. 2015, 62, 182–190. [Google Scholar] [CrossRef]
- Li, Z.; Guiqin, W.; Dian, W. Investigation and Analysis of Domestic Waste Output of Residential Area in Central Six Districts of Beijing. Environ. Sanit. Eng. 2018, 26, 59–62. [Google Scholar]
- Benis, K.; Safaiyan, A.; Farajzadeh, D.; Nadji, F.; Shakerkhatibi, M.; Harati, H.; Safari, G.; Sarbazan, M. Municipal solid waste characterization and household wast behaviors in a megacity in the northwest of Iran. Int. J. Environ. Sci. Technol. 2019, 16, 4863–4872. [Google Scholar] [CrossRef]
- Zakarya, I.A.; Fazhil, N.S.A.; Izhar, T.N.T.; Zaaba, S.K.; Jamaluddin, M.N.F. Municipal Solid Waste Characterization and Quantification as A Measure Towards Effective Solid Waste Management in UniMAP. IOP Conf. Ser. Earth Environ. Sci. 2020, 616, 12047. [Google Scholar] [CrossRef]
- Chendi, W. Research on Vehicle Dispatching and Optimization of Beijing Refuse Collection Based On Municipal Solid Waste Classification; Beijing Jiaotong University: Beijing, China, 2018. [Google Scholar]
- Feng, P.; Weixng, L.; Qi, G.; Al, E. Particle Swarm Optimizer and Multi-Object Optimization; Beijing Institute of Technology Press: Beijing, China, 2013; pp. 89–92. [Google Scholar]
- Guo, X.; Yang, X. The economic and environmental benefits analysis for food waste anaerobic treatment: A case study in Beijing. Env. Sci. Pollut. Res. Int. 2019, 26, 10374–10386. [Google Scholar] [CrossRef] [PubMed]


| Number | Name | X Position (m) | Y Position (m) | The Amount of Kitchen Waste (Kg) | The Amount of Incinerable Waste (Kg) | The Amount of Recyclable Waste (Kg) | The Maximum Capacity of Collection Station (Kg) |
|---|---|---|---|---|---|---|---|
| 1 | Meishijie | 7659 | 6925 | 12,685 | 7436 | 4180 | 27,000 |
| 2 | Liuxuelu | 7536 | 6233 | 5638 | 3305 | 1858 | 12,000 |
| 3 | Dongli | 5288 | 7309 | 2819 | 1652 | 929 | 6000 |
| 4 | Luomashi | 5688 | 6193 | 5638 | 3305 | 1858 | 12,000 |
| 5 | Beiweilu | 7581 | 5590 | 4228 | 2479 | 1393 | 9000 |
| 6 | Nanweilu | 7236 | 5227 | 7047 | 4131 | 2322 | 15,000 |
| 7 | Yaowu | 7714 | 4951 | 1409 | 826 | 464 | 3000 |
| 8 | Xiannongtan | 7692 | 4624 | 1409 | 826 | 464 | 3000 |
| 9 | Gongyun | 6022 | 4356 | 1409 | 826 | 464 | 3000 |
| 10 | Ximeng | 5533 | 4298 | 5638 | 3305 | 1858 | 12,000 |
| 11 | Houbalou | 4620 | 7183 | 7047 | 4131 | 2322 | 15,000 |
| 12 | Kangleli | 4564 | 6677 | 1409 | 826 | 464 | 3000 |
| 13 | Jianxue | 4776 | 6408 | 1409 | 826 | 464 | 3000 |
| 14 | Jiaozi | 4497 | 5993 | 4228 | 2479 | 1393 | 9000 |
| 15 | Chunfeng | 4419 | 5606 | 4228 | 2479 | 1393 | 9000 |
| 16 | Ganhua | 4163 | 6644 | 4228 | 2479 | 1393 | 9000 |
| 17 | Deyuan | 3373 | 6020 | 4228 | 2479 | 1393 | 9000 |
| 18 | Huaibaishu | 3195 | 6782 | 4228 | 2479 | 1393 | 9000 |
| 19 | Wuyuan | 2672 | 6700 | 1409 | 826 | 464 | 3000 |
| 20 | Daguanyuan | 2983 | 4723 | 8456 | 4957 | 2786 | 18,000 |
| 21 | Yinchaochang | 3162 | 4392 | 1409 | 826 | 464 | 3000 |
| 22 | Yijian | 3662 | 4103 | 4228 | 2479 | 1393 | 9000 |
| 23 | Shoupakou | 1759 | 6588 | 9866 | 5783 | 3251 | 21,000 |
| 24 | Baicaiwan | 2315 | 5813 | 7047 | 4131 | 2322 | 15,000 |
| 25 | Jingtie | 1770 | 5387 | 4228 | 2479 | 1393 | 9000 |
| 26 | Xiaohongmiao | 1369 | 5364 | 7047 | 4131 | 2322 | 15,000 |
| 27 | Honglian | 868 | 5677 | 7047 | 4131 | 2322 | 15,000 |
| 28 | Maliandao | 546 | 5845 | 7047 | 4131 | 2322 | 15,000 |
| 29 | Sanyili | 323 | 6058 | 1409 | 826 | 464 | 3000 |
| 30 | Chama | 0 | 5036 | 4228 | 2479 | 1393 | 9000 |
| 31 | Majialou transfer center | 2661 | 0 | -- | -- | -- | -- |
| Number | Name | X Position (m) | Y Position (m) | The Maximum Capacity of Collection Station (Kg) | The Volume of Incinerable Waste (Kg) |
|---|---|---|---|---|---|
| 1 | Chunfeng | 4419 | 5606 | 9000 | 8689 |
| 2 | Huaibaishu | 3195 | 6782 | 9000 | 8689 |
| 3 | Yijian | 3662 | 4103 | 9000 | 8689 |
| 4 | Baicaiwan | 2315 | 5813 | 15,000 | 14,482 |
| 5 | Xiaohongmiao | 1369 | 5364 | 15,000 | 14,482 |
| 6 | Nanweilu | 7236 | 5227 | 15,000 | 14,482 |
| 7 | Maliandao | 546 | 5845 | 15,000 | 14,482 |
| 0 | Majialou Transfer Center | 2661 | 0 | -- | -- |
| Vehicles | Name | Path and Time | ||||||||||
|---|---|---|---|---|---|---|---|---|---|---|---|---|
| Truck 1 | The number of collection station | 0 | 5 | 0 | 5 | 0 | 3 | 0 | 3 | 1 | 2 | 0 |
| Arrival time | 5.5 | 6.02 | 6.83 | 7.35 | 8.17 | 8.49 | 9.11 | 9.43 | 9.8 | 10.12 | 10.79 | |
| Departure time | 5.5 | 6.32 | 6.83 | 7.65 | 8.17 | 8.79 | 9.11 | 9.73 | 10.1 | 10.42 | 11.09 | |
| Truck 2 | The number of collection station | 0 | 4 | 0 | 6 | 0 | 7 | 0 | -- | -- | -- | -- |
| Arrival time | 5.5 | 6.02 | 6.84 | 7.36 | 8.18 | 8.71 | 9.54 | -- | -- | -- | -- | |
| Departure time | 5.5 | 6.32 | 6.84 | 7.66 | 8.18 | 9.01 | 9.54 | -- | -- | -- | -- | |
| Truck 3 | The number of collection station | 0 | 7 | 0 | 6 | 0 | 7 | 6 | 5 | 0 | -- | -- |
| Arrival time | 5.5 | 6.03 | 6.85 | 7.37 | 8.19 | 8.72 | 9.03 | 9.34 | 10.16 | -- | -- | |
| Departure time | 5.5 | 6.33 | 6.85 | 7.67 | 8.19 | 9.02 | 9.33 | 9.64 | 10.46 | -- | -- | |
| Truck 4 | The number of collection station | 0 | 4 | 0 | 2 | 0 | 1 | 0 | 5 | 4 | 3 | 0 |
| Arrival time | 5.5 | 6.02 | 6.84 | 7.21 | 7.88 | 8.23 | 8.88 | 9.4 | 9.73 | 10.07 | 10.69 | |
| Departure time | 5.5 | 6.32 | 6.84 | 7.51 | 7.88 | 8.53 | 8.88 | 9.7 | 10.03 | 10.37 | 10.99 | |
Publisher’s Note: MDPI stays neutral with regard to jurisdictional claims in published maps and institutional affiliations. |
© 2021 by the authors. Licensee MDPI, Basel, Switzerland. This article is an open access article distributed under the terms and conditions of the Creative Commons Attribution (CC BY) license (https://creativecommons.org/licenses/by/4.0/).
Share and Cite
Yang, X.; Guo, X.; Yang, K. Redesigning the Municipal Solid Waste Supply Chain Considering the Classified Collection and Disposal: A Case Study of Incinerable Waste in Beijing. Sustainability 2021, 13, 9855. https://0-doi-org.brum.beds.ac.uk/10.3390/su13179855
Yang X, Guo X, Yang K. Redesigning the Municipal Solid Waste Supply Chain Considering the Classified Collection and Disposal: A Case Study of Incinerable Waste in Beijing. Sustainability. 2021; 13(17):9855. https://0-doi-org.brum.beds.ac.uk/10.3390/su13179855
Chicago/Turabian StyleYang, Xiaoyu, Xiaopeng Guo, and Kun Yang. 2021. "Redesigning the Municipal Solid Waste Supply Chain Considering the Classified Collection and Disposal: A Case Study of Incinerable Waste in Beijing" Sustainability 13, no. 17: 9855. https://0-doi-org.brum.beds.ac.uk/10.3390/su13179855