1. Introduction
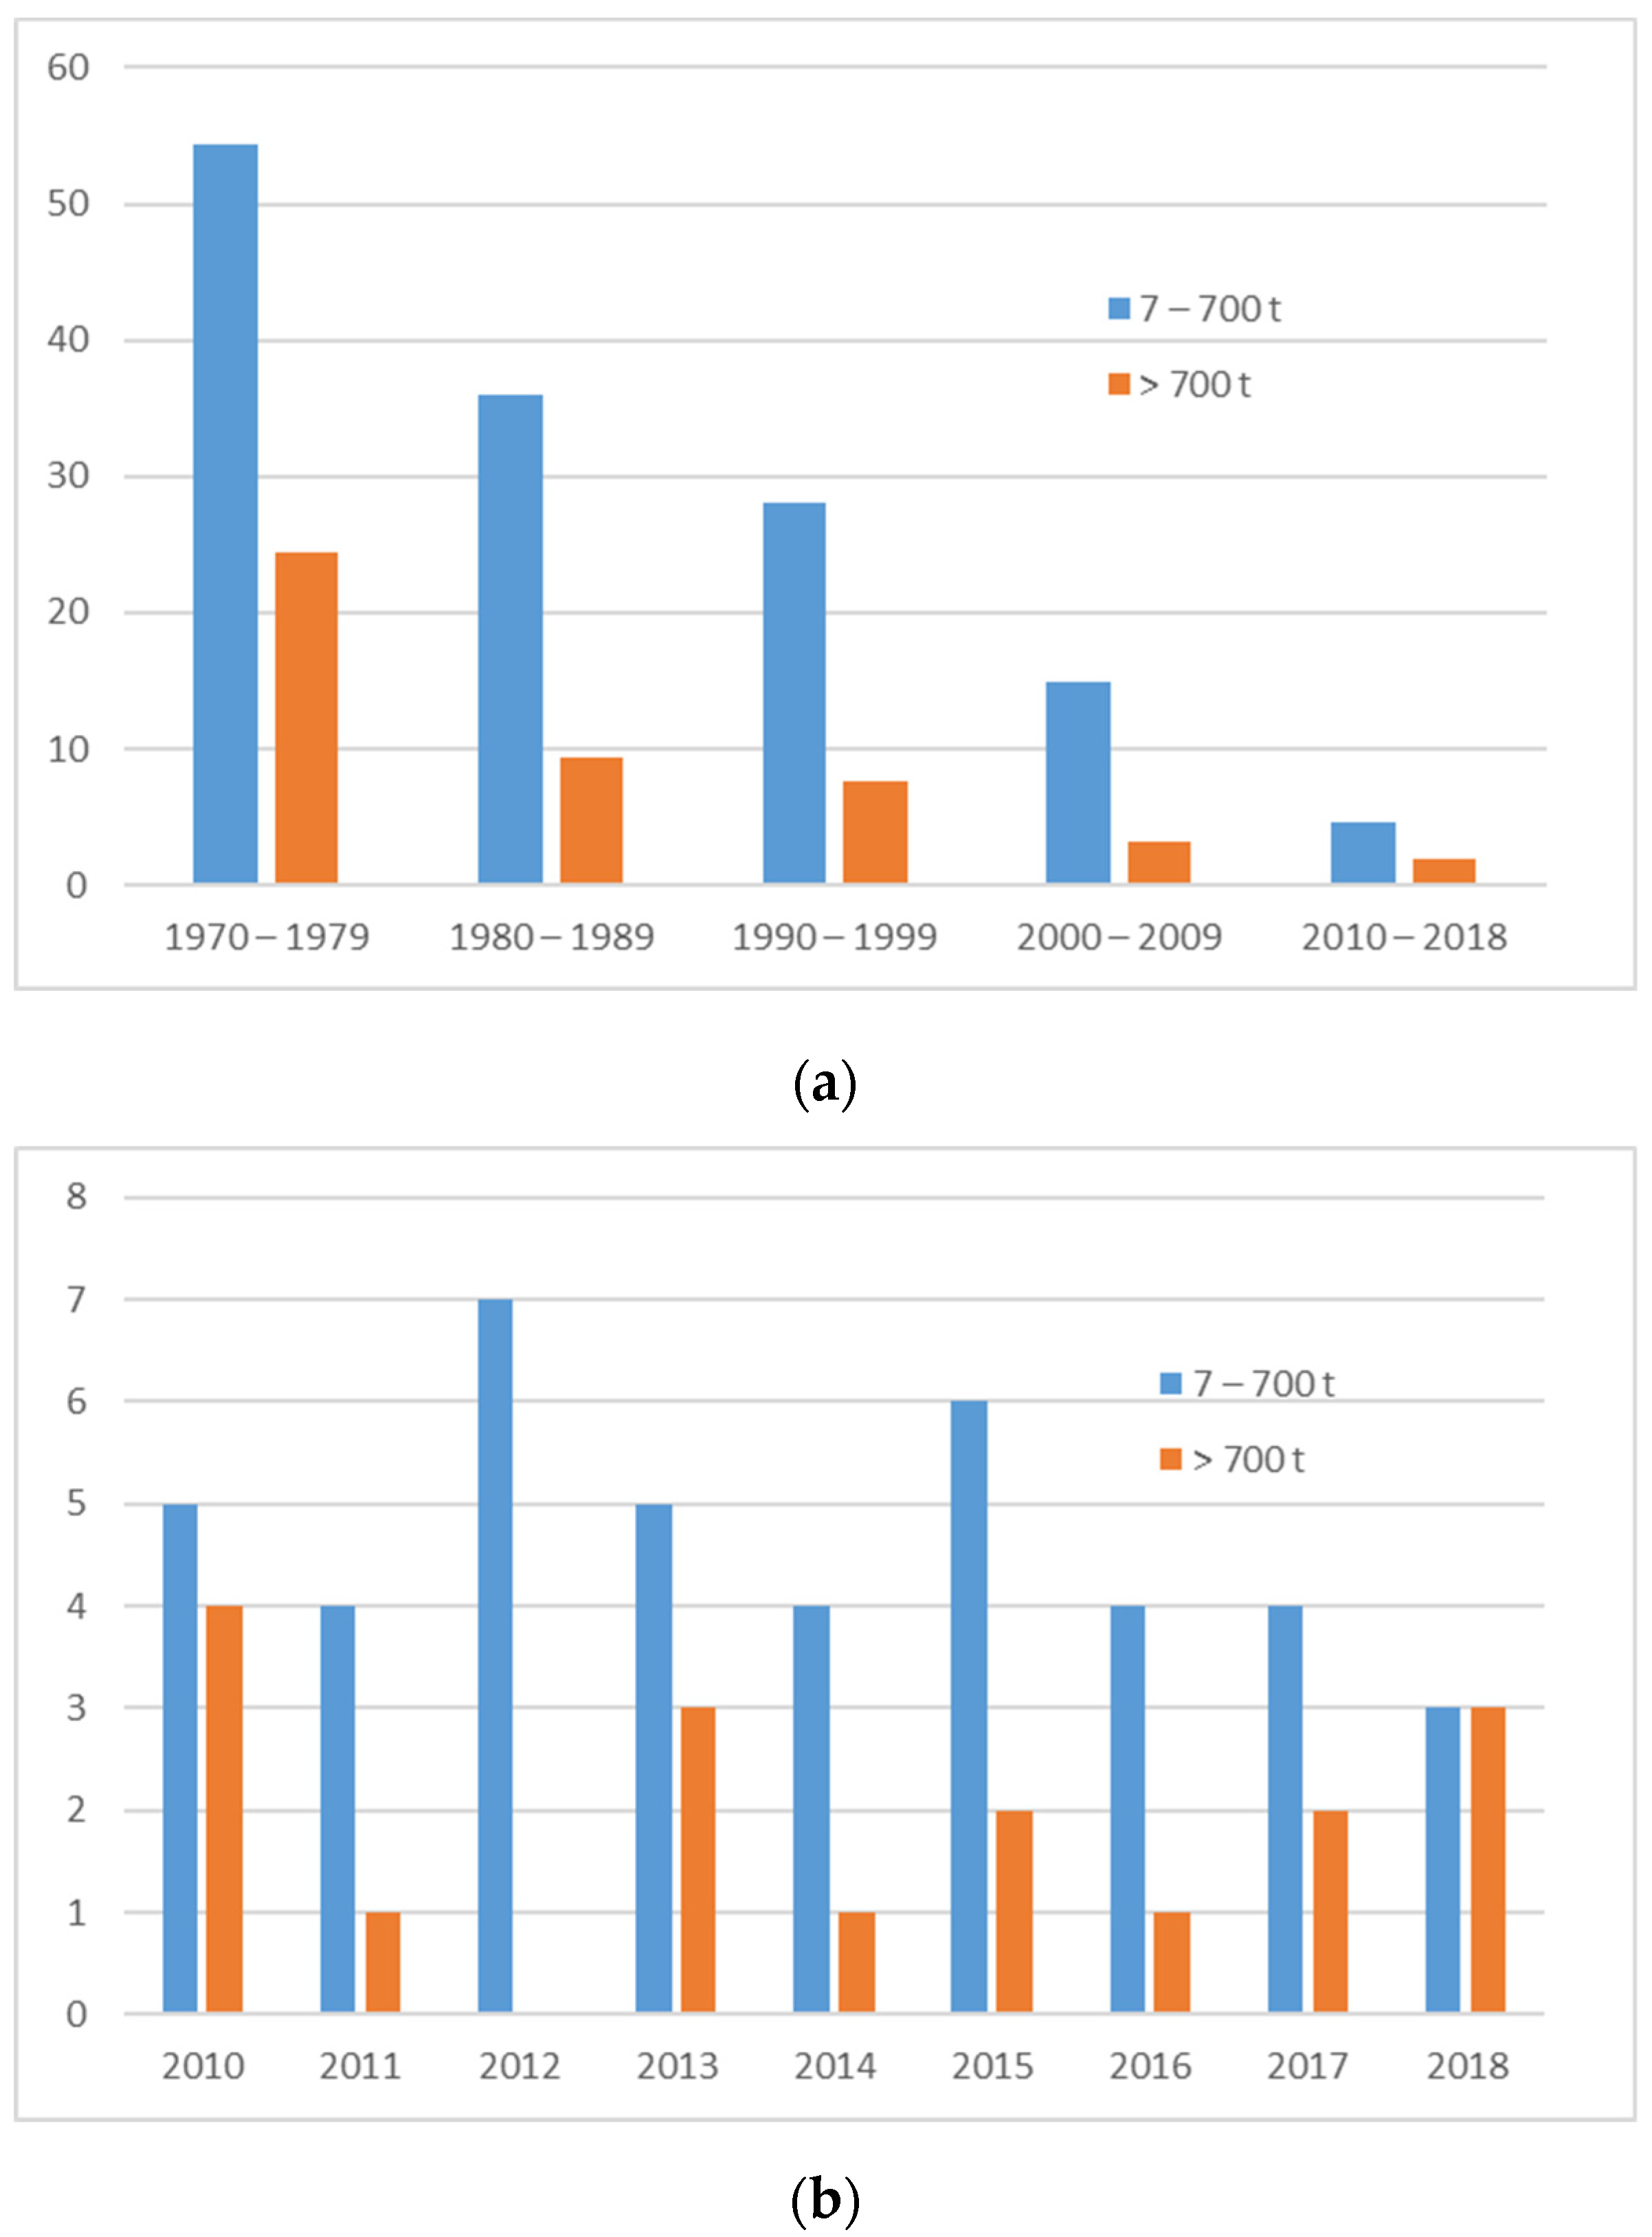
Despite efforts to improve navigation safety, maritime accidents still happen and will certainly continue to happen in the future. One of the most undesirable consequences of these accidents is an oil spill. Of course, the largest spills, such as from the Torrey Canyon, Exxon Valdez, Atlantic Empress, and Aegean Captain, are caused by tanker accidents. Over recent decades, the number of oil spills caused by oil tanker accidents has fallen sharply, but in recent years this trend has stopped, and the number of oil spills remains steady [
1] (
Figure 1).
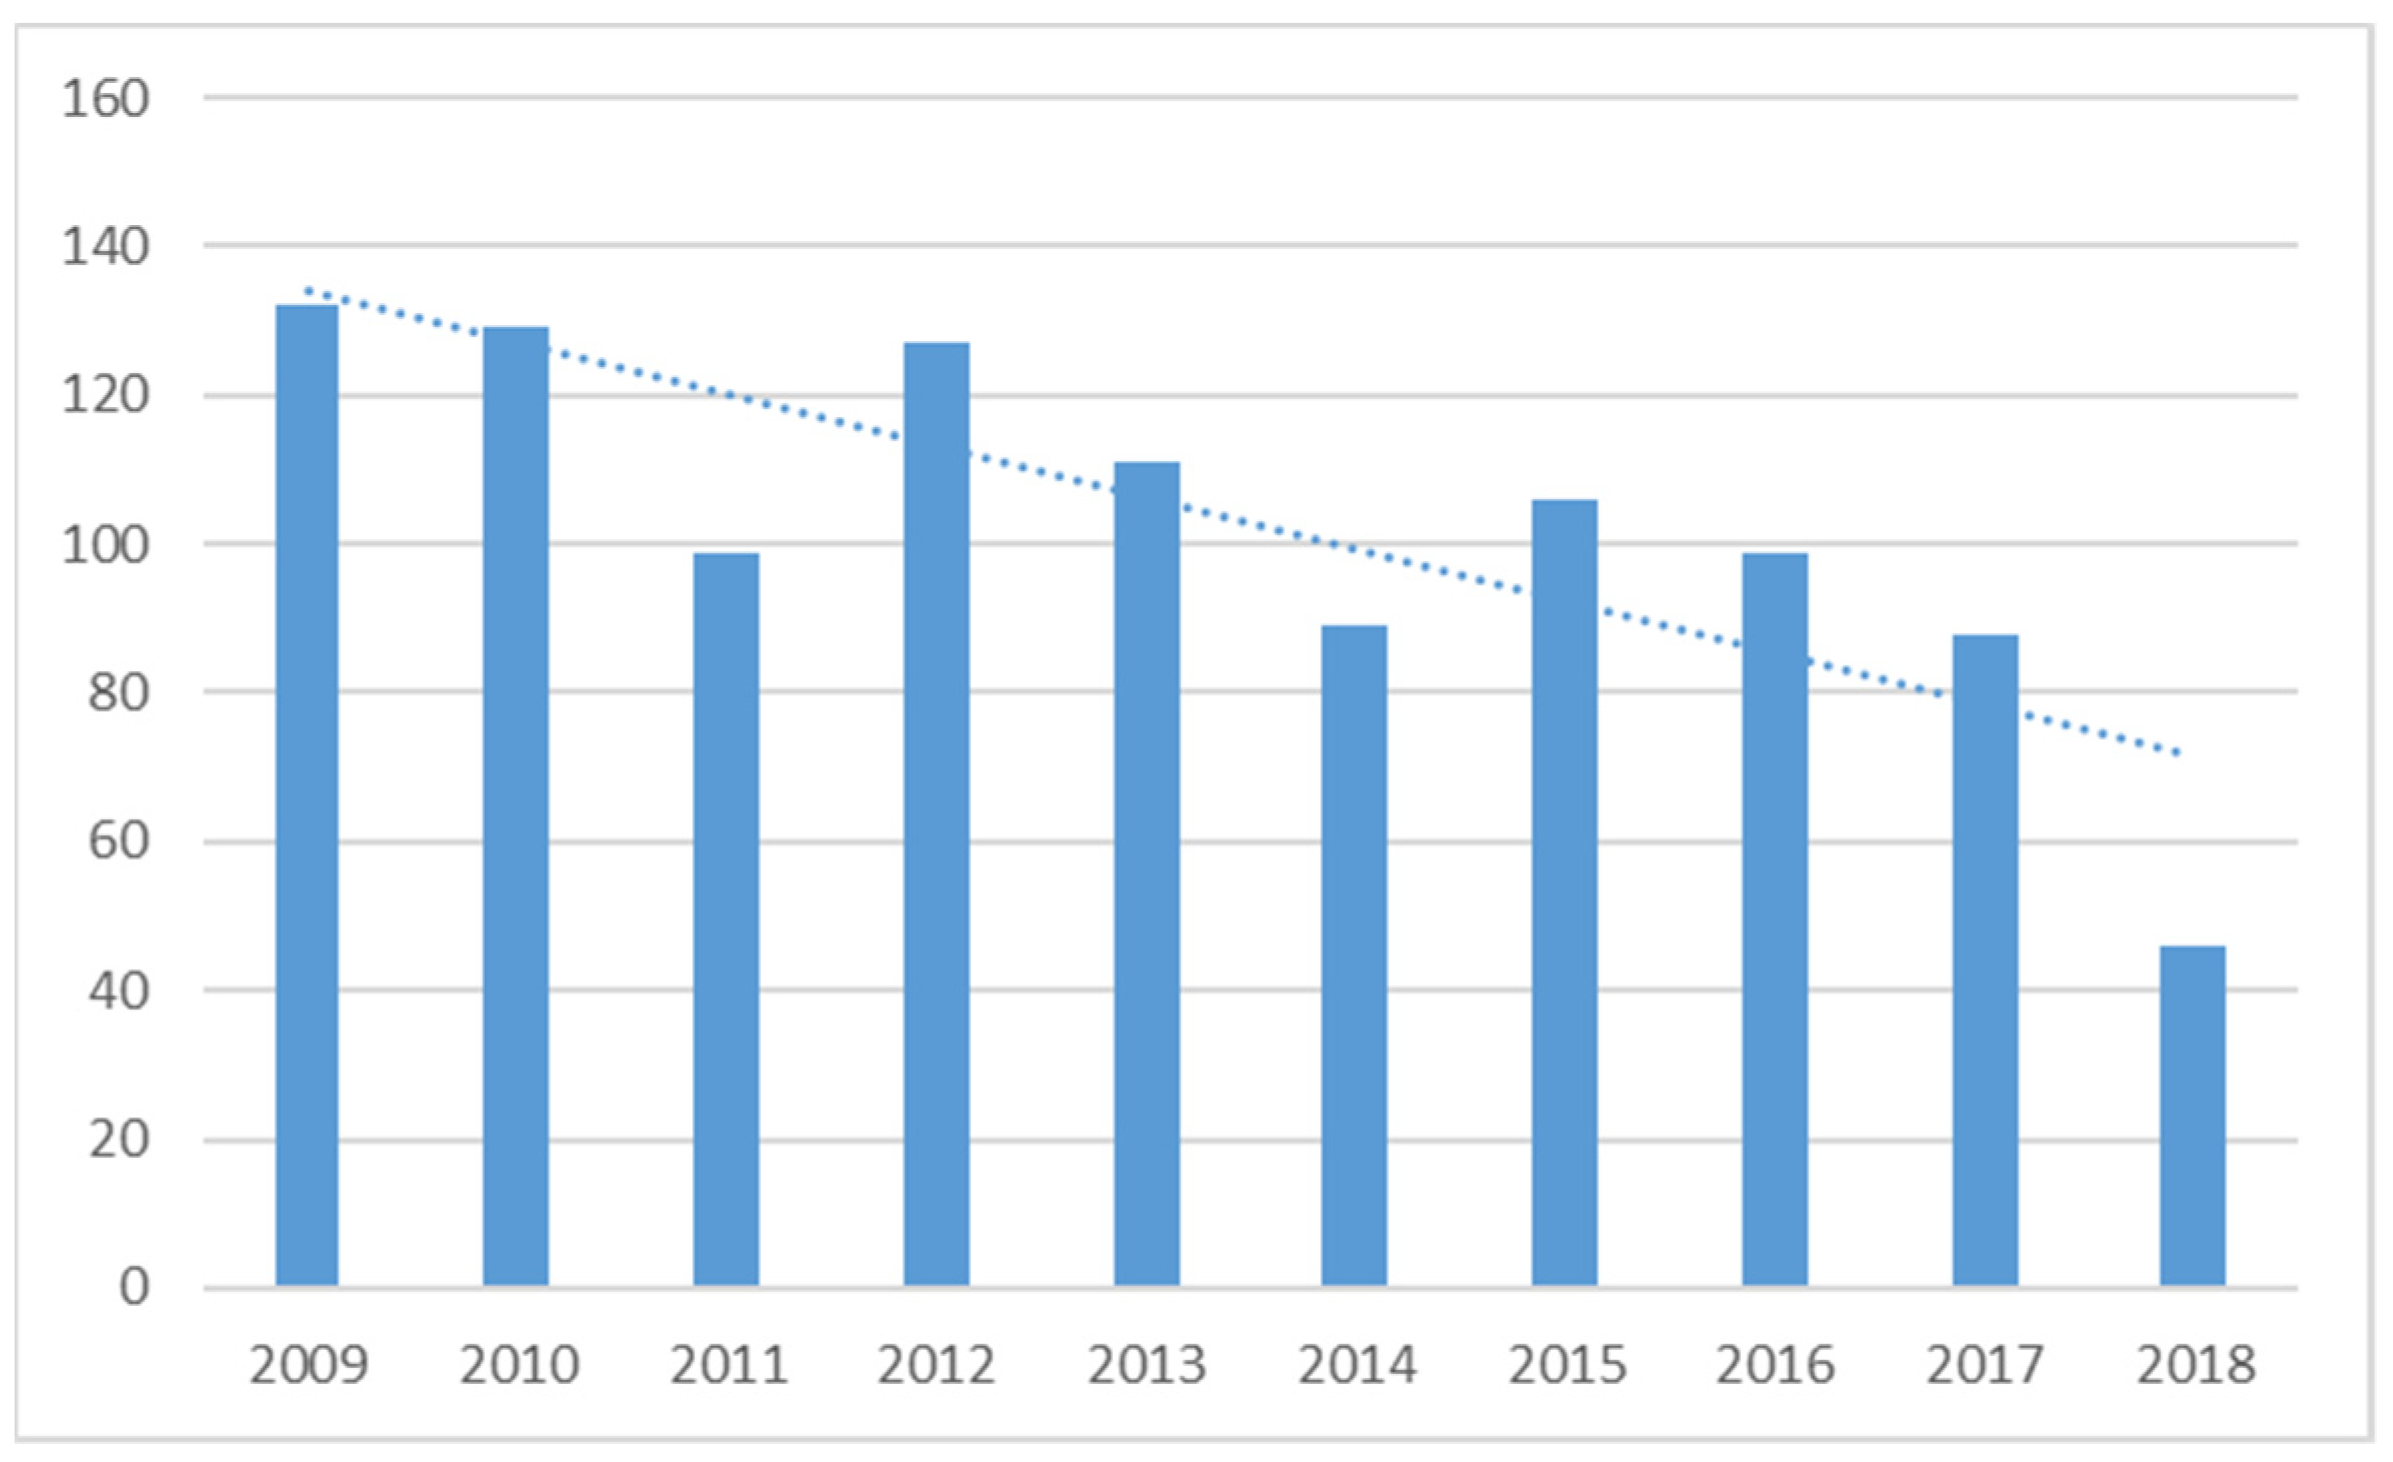
In addition to those oil spills caused by tanker accidents, oil pollution may be caused by bunker spills caused by accidents involving any type of ship, technical failures, or illegal oil discharges. According to a report published by Allianz Global Corporate & Specialty [
2], the number of total losses of vessels above 100 GT decreases year by year, and, over the last decade, it has decreased by about 65% (
Figure 2). The same report states that despite the clear decrease in total ship losses, the overall number of accidents remains at a consistent, high level (an annual decrease of around 1%).
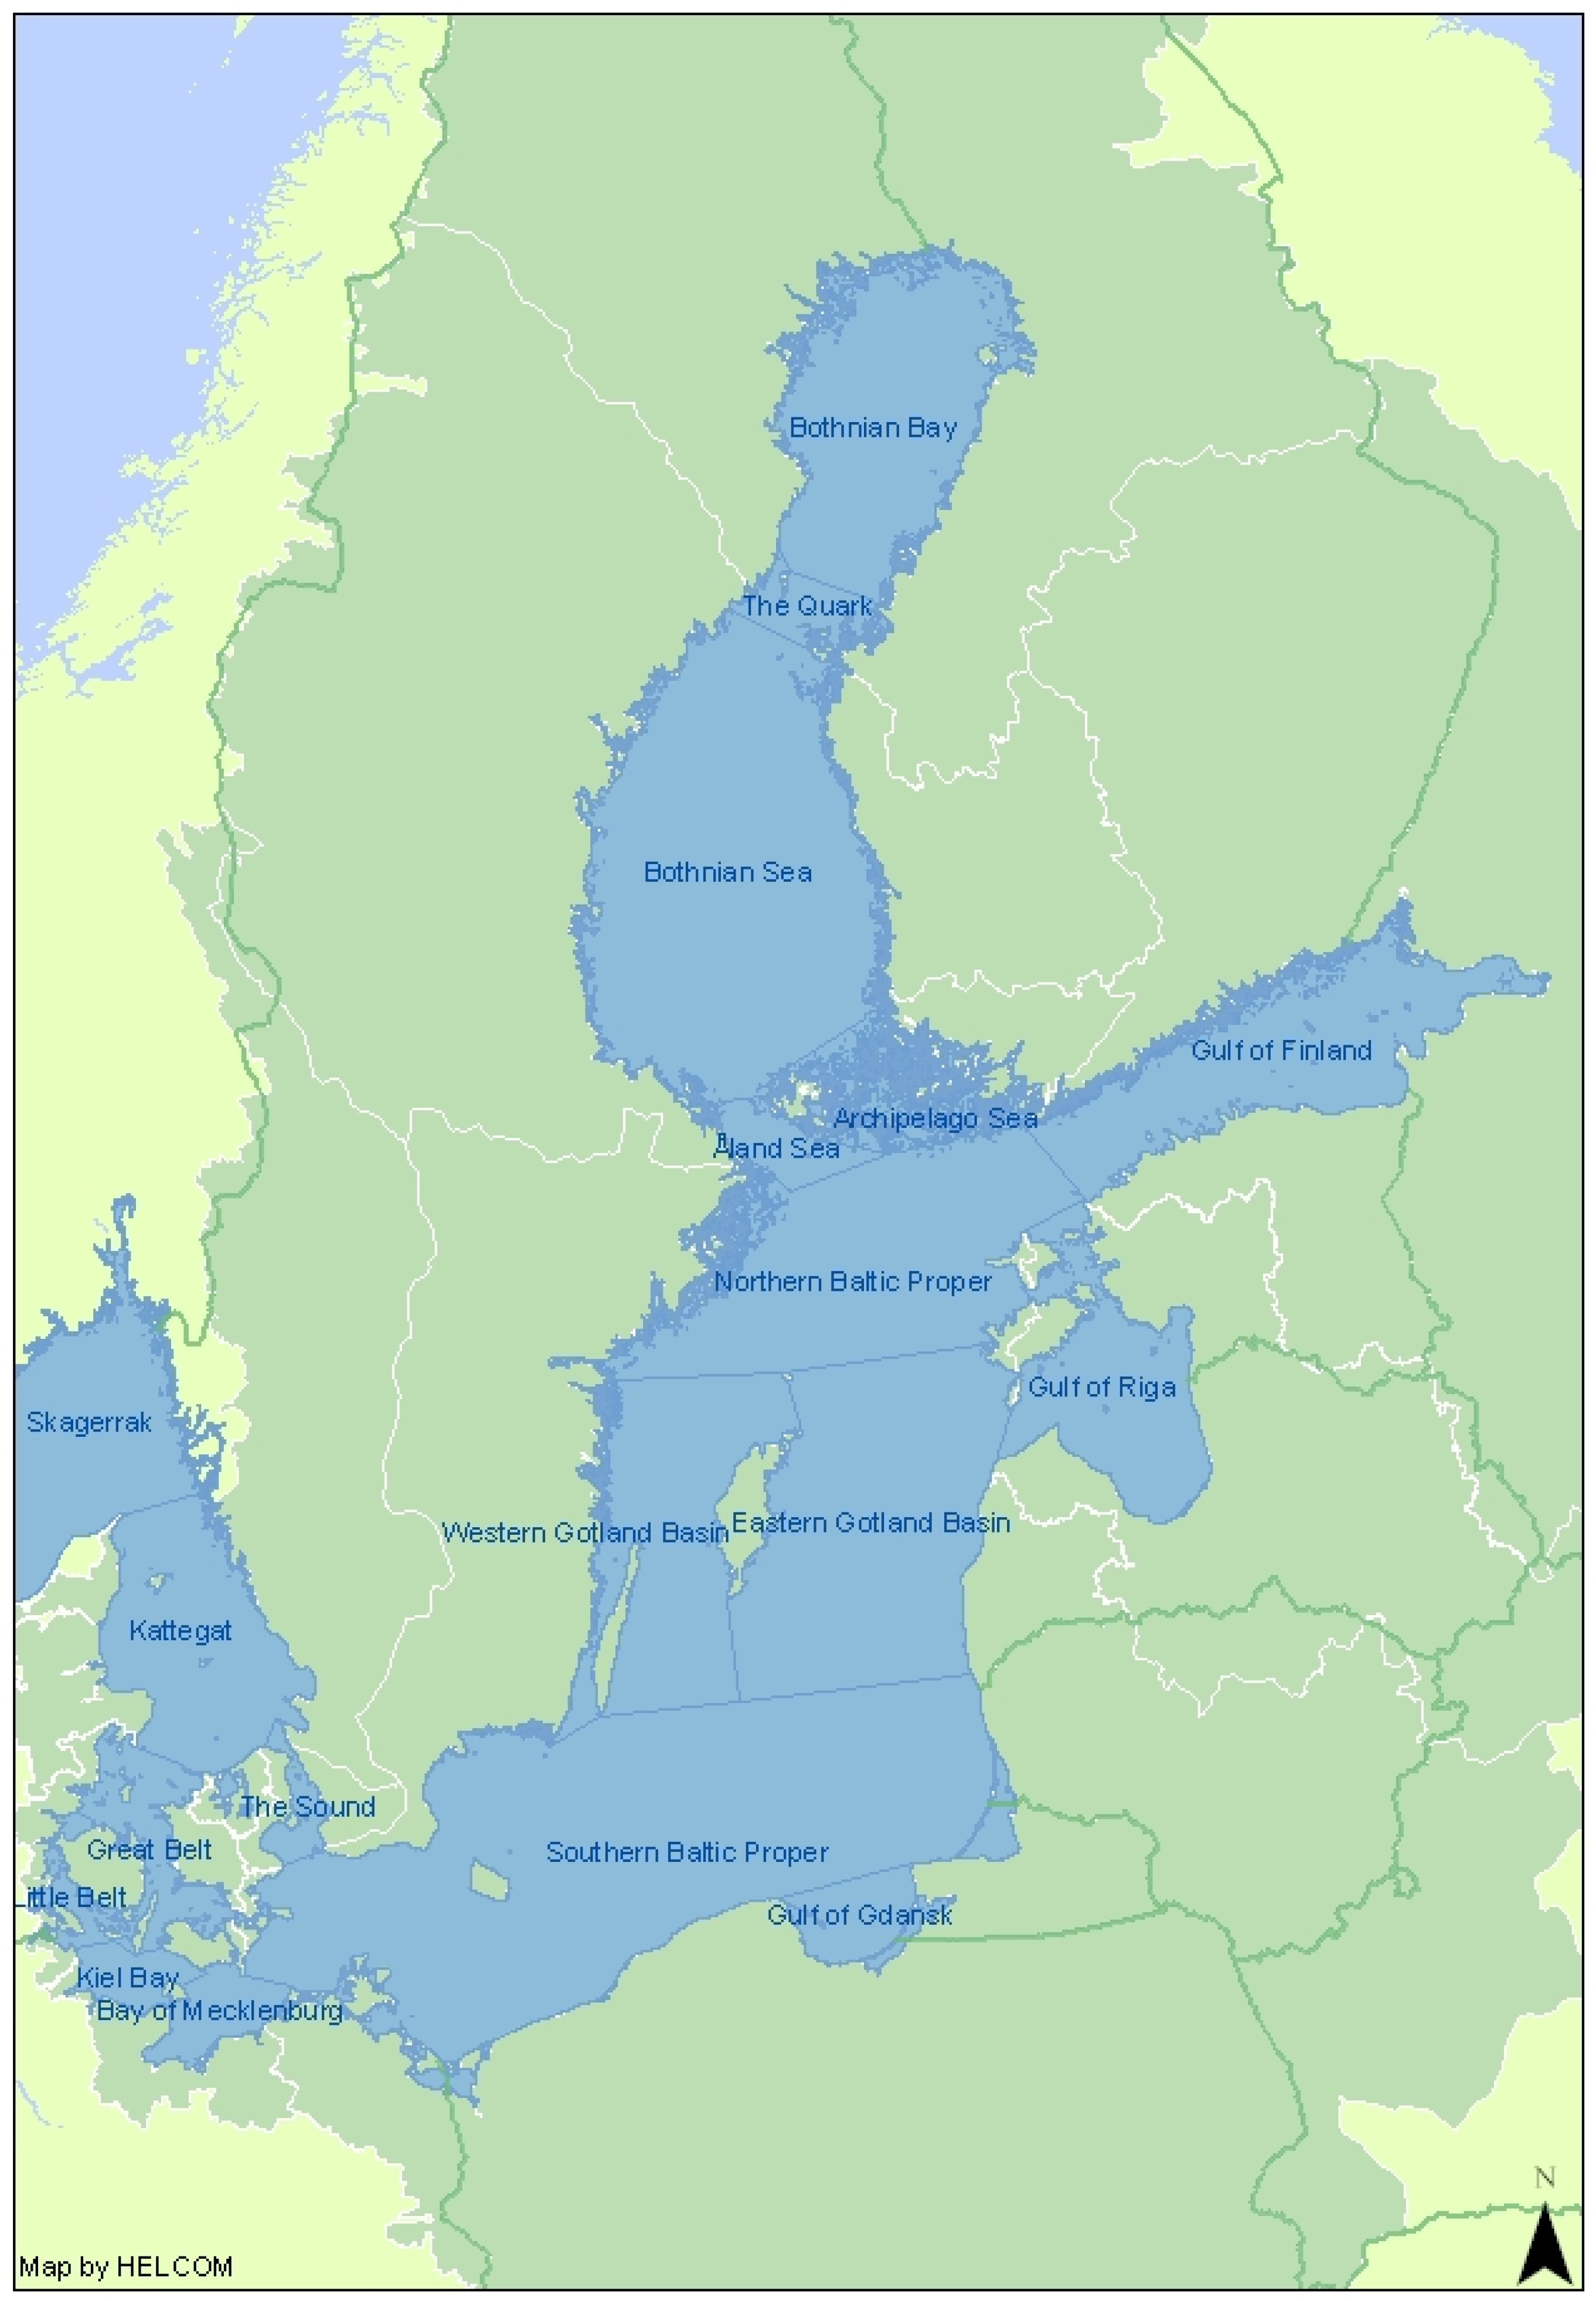
Oil spills have a negative impact on the natural environment, choking and poisoning flora and fauna. They can also affect socio-economic interests, such as tourism, aquaculture, and fisheries. The consequences of pollution are particularly acute in relatively small, closed water bodies, such as the Baltic Sea.
The Baltic Sea is relatively shallow and is divided into several basins: Kattegat, the Great and Little Belts, Kiel Bay, the Bay of Mecklenburg and the Sound in the west; the Southern Baltic Proper, the Gulf of Gdansk, and the Eastern and Western Gotland Basins in the south; the Gulf of Riga and the Gulf of Finland in the east; and Bothnian Bay, the Bothnian Sea, the Archipelago, and Aland Sea in the north (
Figure 3) [
3].
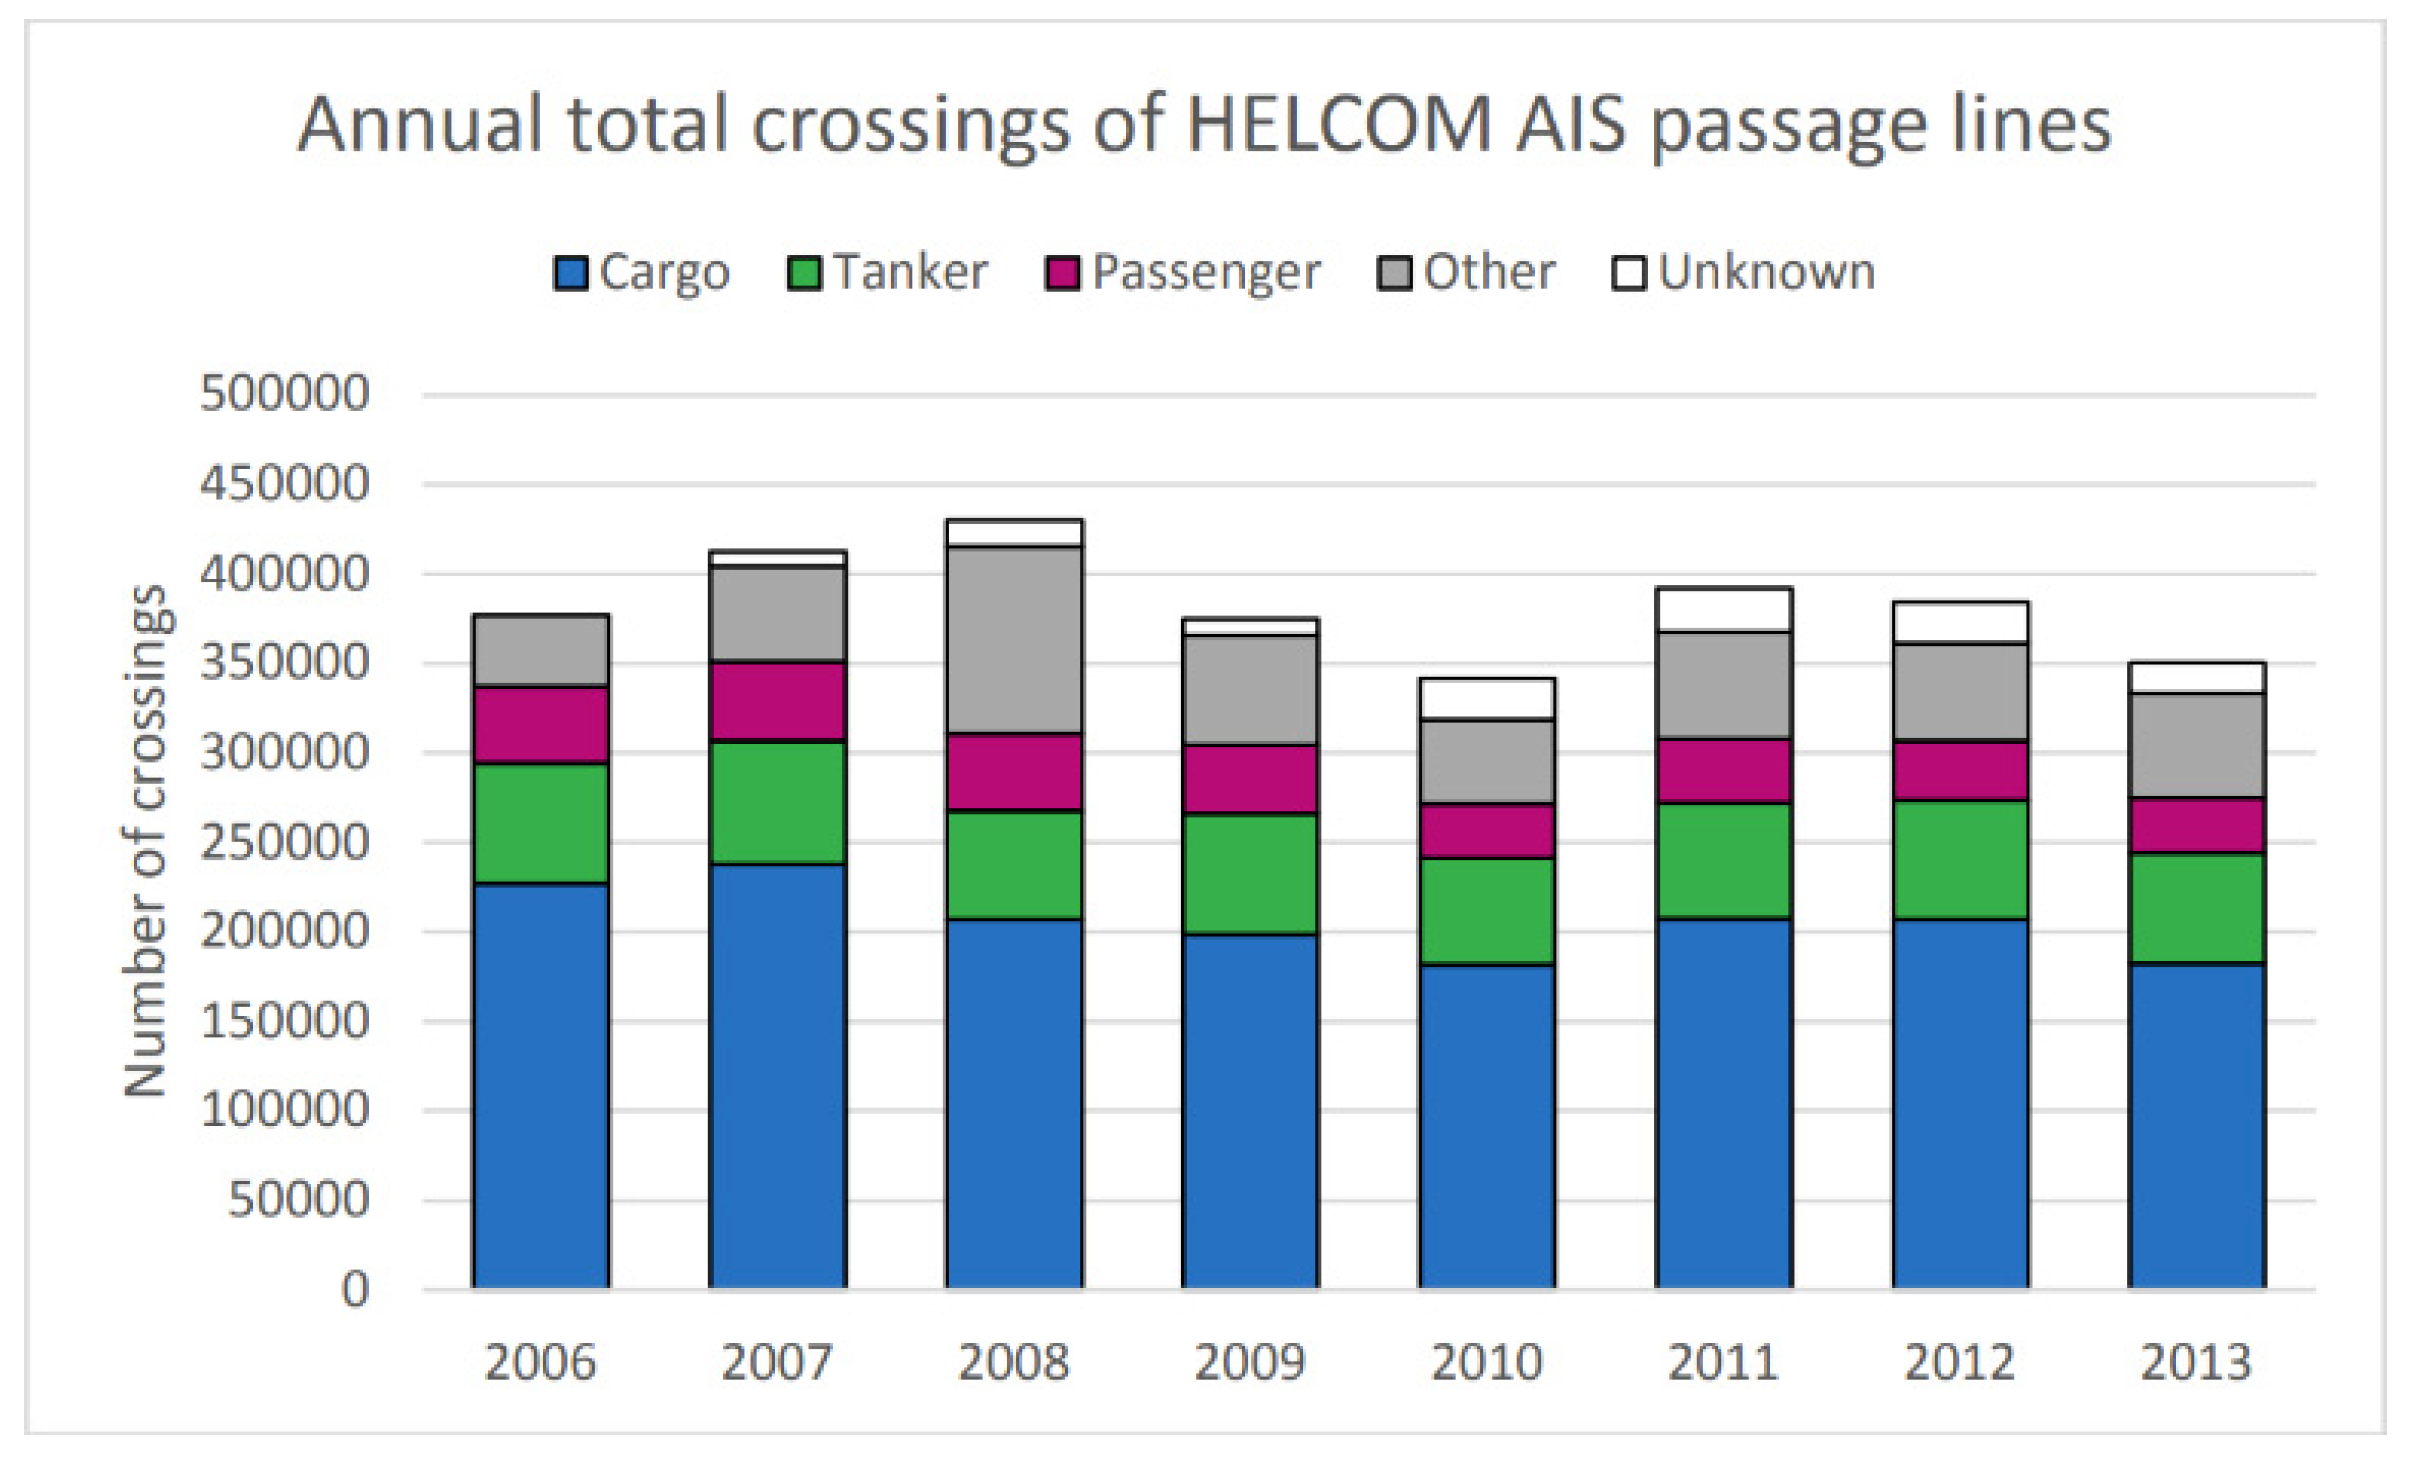
The Baltic Sea is one of the busiest shipping regions in the world. According to the report of the Baltic Marine Environment Protection Commission (HELCOM), a total of 350,392 ships crossed the fixed Automatic Identification System (AIS) lines in the Baltic Sea in 2013 (
Figure 4) [
4].
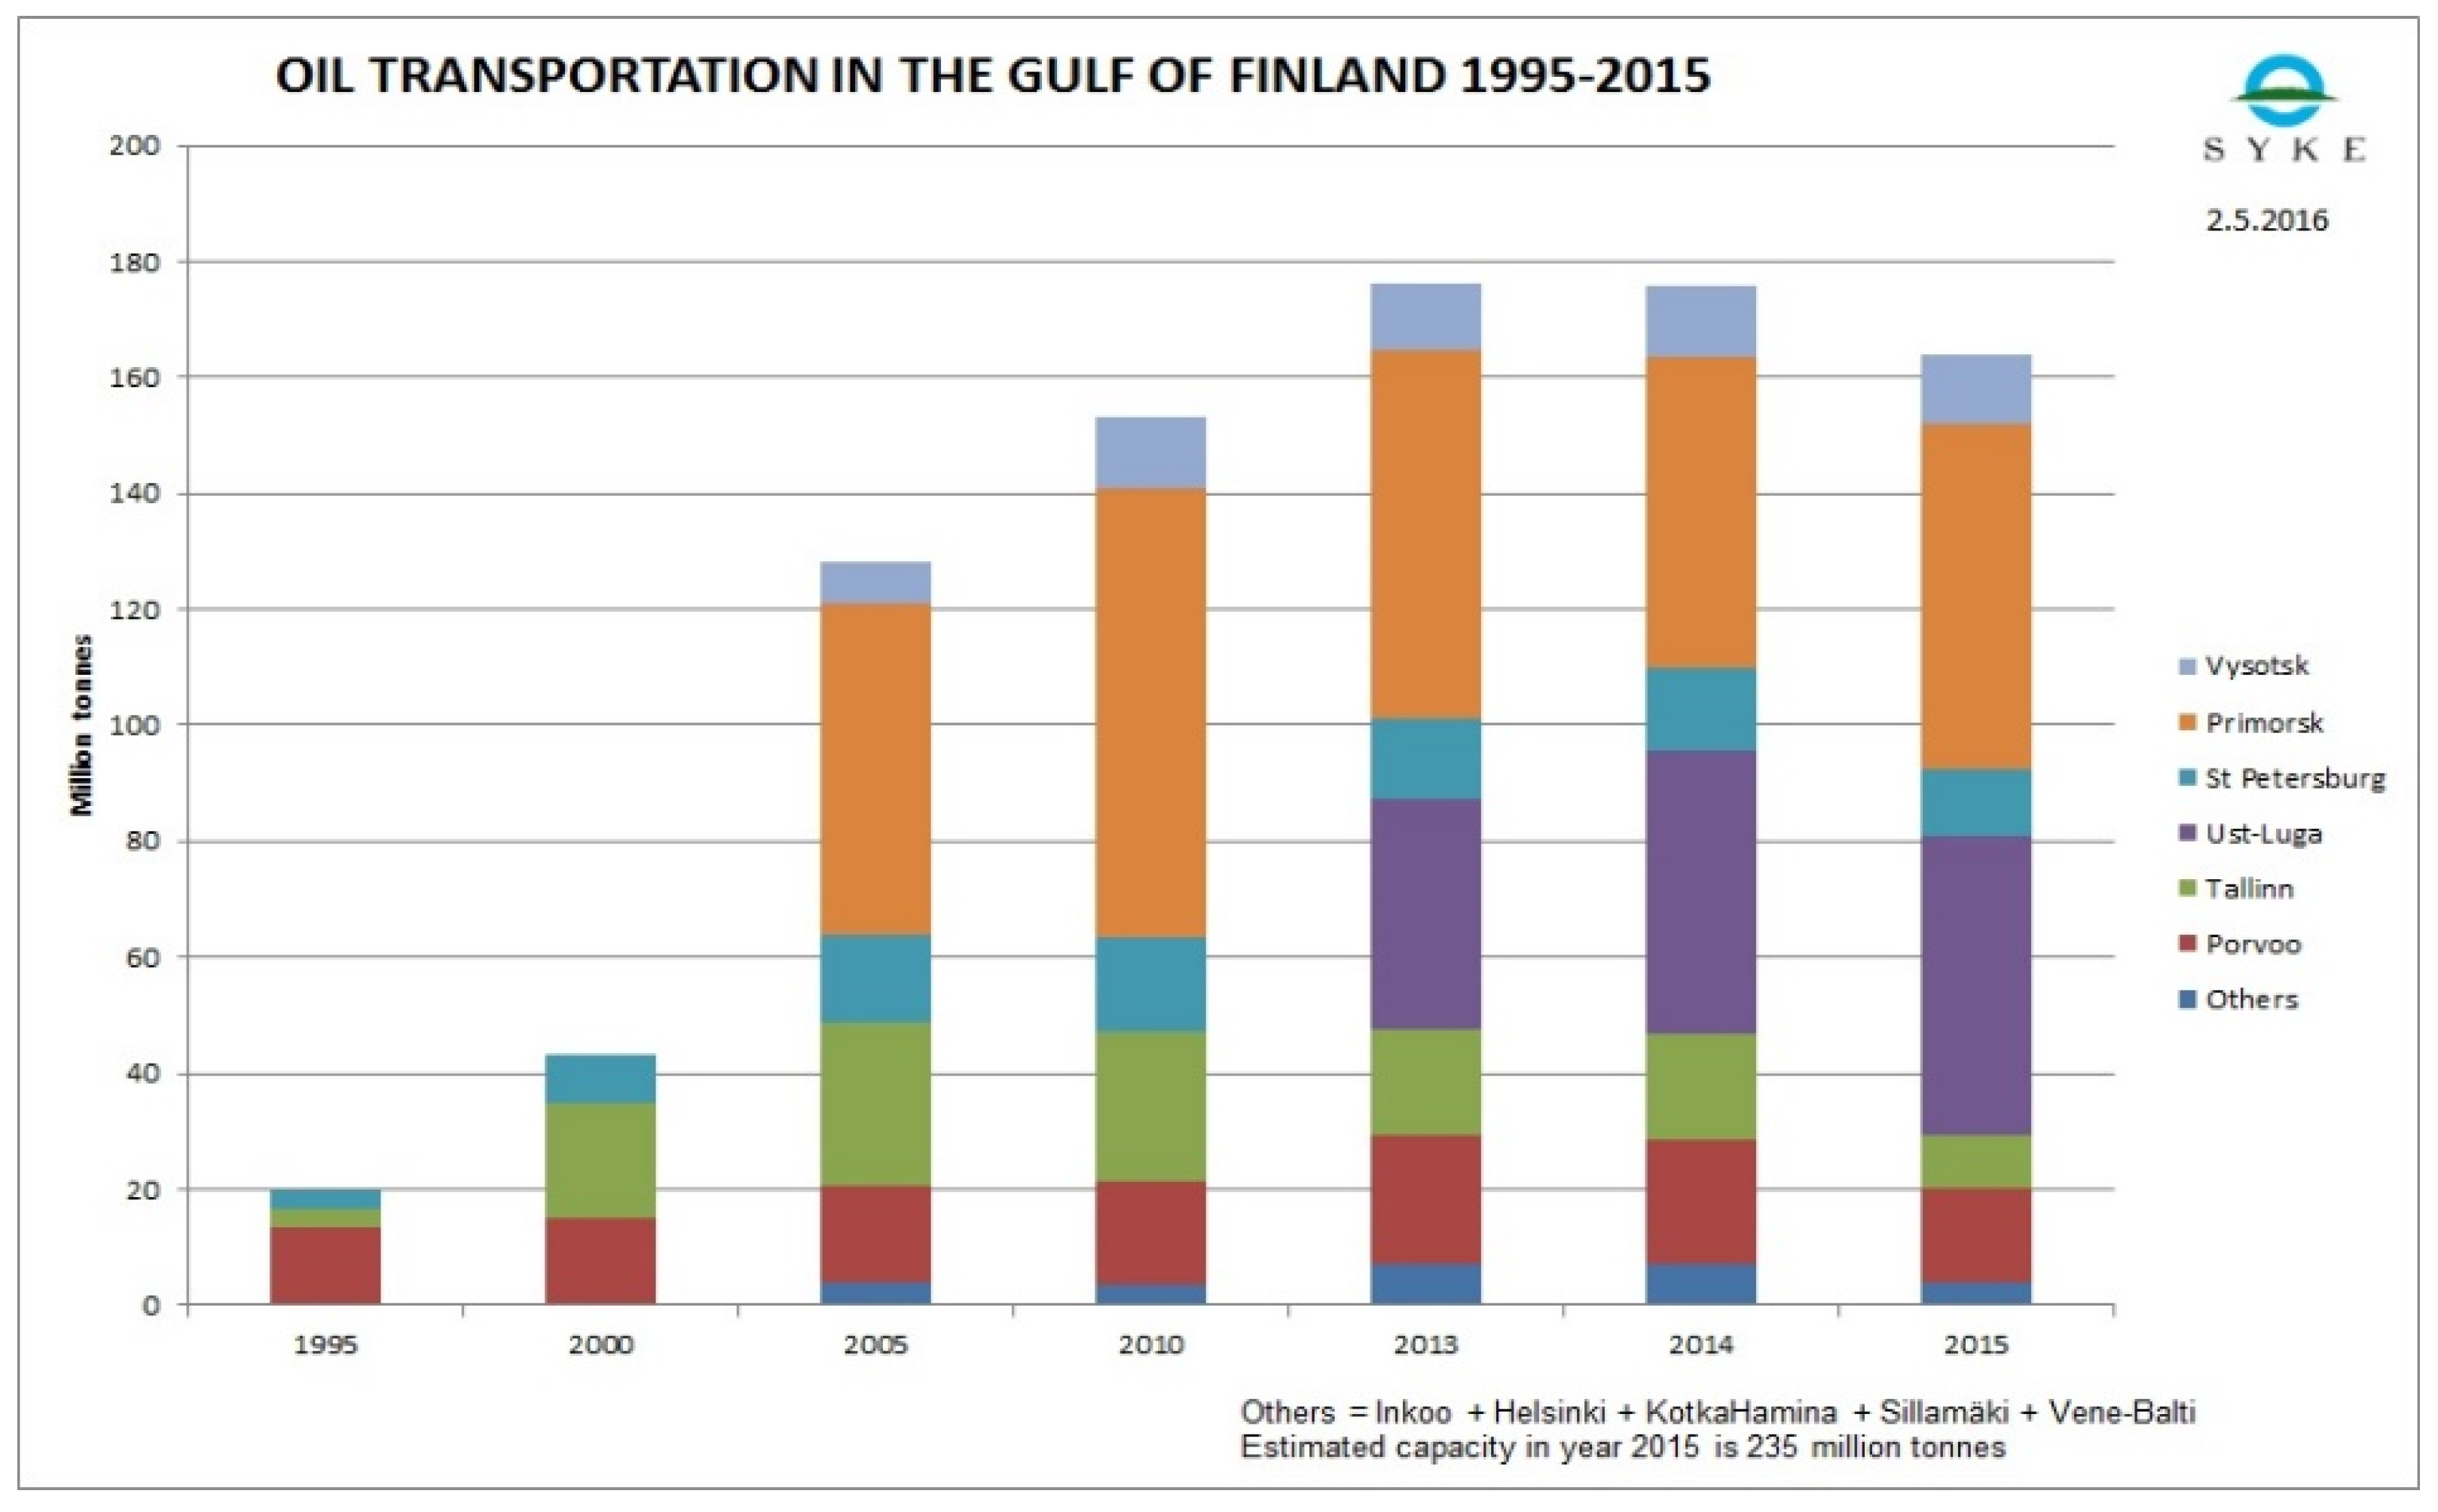
The overall transport intensity does not change significantly, but changes in the distribution of ship types can be observed. For example, oil transport in the Gulf of Finland has increased significantly, from 128 million tonnes in 2005 to 164 million tonnes in 2015, albeit with a slight decrease from the peak of 178 million tonnes in 2013 (
Figure 5) [
5]. This increase is primarily because of the expanded Russian port of Primorsk and the new port of Ust-Luga. The slight decline is likely to be as a result of the ongoing economic sanctions against Russia. The majority of this oil is subsequently transported out of the Baltic Sea.
Despite measures aimed at increasing the level of navigational safety, accidents and oil spills still occur. The data concerning accidents can be found in many studies [
6,
7,
8,
9]. A list of the largest recorded oil spills is presented in
Table 1 [
10].
The risk of oil spills has been the subject of many studies and numerous scientific analyses, leading to risk assessments [
11,
12,
13,
14,
15,
16] and sensitivity mapping [
17,
18]. One of the most comprehensive studies was conducted as part of the BRISK project (Sub-regional risk of spill of oil and hazardous substances in the Baltic Sea). Based on the results of the BRISK project, it can be stated that an oil spill between 0 and 5000 tonnes will occur every 4 years, and a significant release (5000 tonnes or more) will occur once every 26 years [
11,
12]. According to the report, oil spills smaller than 300 tonnes are mainly caused by illegal discharges, and accidental spills have a minor role in this size category. The given results were obtained on the basis of a statistical analysis of historical data, taking into account the spills caused by ship accidents. Detailed data about the estimated frequency of accidental oil spills in the Baltic Sea is presented in
Table 2 [
19]. Although the significant differences in the frequencies of possible spills can be observed in different parts of the Baltic Sea, the estimated intervals for the entire Baltic Sea remain disturbing.
Besides the accidental oil spills, numerous deliberate, illegal discharges from ships are observed each year by national surveillance aircraft and satellites over the Baltic Sea area. Thanks to the actions taken, the number of detected oil spills is decreasing—but still, approximately 150 illicit oil spills can be expected every year in the Baltic Sea area.
One of the most important issues in regard to the preparation for dealing with oil spills is contingency planning, but to have a plan is not enough. If the personnel of responsible institutions and organizations are not familiar with the plan, and the procedures are not regularly exercised, the plan will have little or no actual impact. In order to increase knowledge of the oil-spill response procedures and their practical applications, projects such as SBOIL (South Baltic Oil spill response) are being implemented.
2. Methods and Materials
The project “South Baltic Oil spill response” (SBOIL) focused on two main objectives:
The uptake of a new spill response technology called BioBind to train staff and strengthen existing cross-border spill response capacities;
Raising awareness at different administrative levels and in the public regarding oil spill responses in the South Baltic area.
The project was co-funded by the European Union’s (EU) South Baltic Programme, and was realized by the University of Rostock, as the leading partner, together with the World Maritime University, the Maritime University of Szczecin, and nine associated partners from different administrations of the South Baltic Area.
SBOIL was a continuation of the BioBind project, the primary goal of which was to develop and deploy an oil recovery system designed for coastal waters and during adverse weather conditions. The BioBind project has developed a methodology based on biodegradable oil binders that are dropped by aircraft and/or helicopter. The removal process involves a special net-boom consisting of fishing nets and conventional containment booms.
The goal of the SBOIL project was to use this new technology to improve the current response capabilities regarding cross-border oil spills. As a result of the SBOIL project, a very wide range of activities was designed and implemented (various oil-spill response exercises, national workshops, and an international table-top exercise), with spill response scenarios and a spill response training kit that was intended to inform and train those involved. A dedicated station was created for future use during an emergency. Additionally, a biogenic spill response training package was developed in a simulator setting (via a marine simulator) to meet the training needs of those who will operate this new equipment/technology [
10].
The supplementary result of the SBOIL project is an application developed to help in the efficient coordination of spill response actions using biogenic oil binders.
The sources of oil input into the sea are diverse, but they can be divided into four major categories:
Natural seeps;
Oil extraction;
Oil transportation;
Oil consumption.
According to the GESAMP (the Joint Group of Experts on the Scientific Aspects of Marine Environmental Protection) report [
8], natural seeps are responsible for 49% of the oil entering the seas worldwide. This is the biggest source but because oil is released at a low rate, the surrounding ecosystem can adapt and even thrive in its presence. The operational discharges from ships (15%) are the second biggest source, the next, in decreasing order, are ship accidents (13%), coastal facilities (9%), and VOC (volatile organic compounds) (5%). The remaining sources, such as small craft activity, offshore drilling, and ships’ cargo-related pollution are responsible for less than 10% of oil input into the marine environment in total.
In the event of an oil spill, there are three main response options [
20,
21,
22,
23]:
Containment and recovery;
Application of dispersants;
Possibly, the burning of surfactants (in situ burning).
The selection of the most appropriate strategy will depend on many factors, i.a.:
The availability of resources;
National and local pollution control regulations;
The specific nature of the pollution;
The physical and ecological characteristics of the area affected by the oil pollution.
Considering the legal, economic, and ecological aspects, in most cases, the only option is to reduce the area of the spill and to recover oil from the water surface. The efficiency of the response to oil spills strongly depends on the time taken to reach the accident location and the hydro-meteorological conditions. The efficacy of the systems currently used to combat spills is strongly limited by external conditions (available depth, waves). To reduce the impact of these restrictions, an oil-spill response system called BioBind has been created. BioBind is an effective and fast system for the removal of oil spills in coastal waters and offshore, one that is applicable in both good and bad weather conditions. The system is based on the airborne application of biogenic oil binders. The quantity of oil binders depends on the size of the oil spill and the capacity of the aircraft used. The capacity of the Dromader M18 that was used during the test is 1.5 m3; larger planes can also be used for the deployment (e.g., a Transall C-160 with a storage capacity of ~130 m3).
The binder achieved an oil recovery rate of at least 80%, with a coverage dosage of 11% (0.11 m
2 binder for a 1-m
2 oil-covered surface). It consists of wood fibers and has an oil binding capacity of 600 kg/m
3. A single oil binder is a small, light, square element with a size of 5 cm × 5 cm × 0.4 cm and a density of 250 to 280 kg/m
3 (
Figure 6).
The oil-soaked binder can be recovered at sea using a custom-built boom that accumulates the binders into a replaceable net bag, which can be removed to a seagoing barge or container onboard a ship. The use of nets instead of non-permeable booms extends the use of the system to include harsh sea-state conditions, with high waves and strong currents. If it is not possible to recover the binders at sea, they can be collected on land using mobile vacuum technology. The advantage of the system is that the oil stays in the binders while they are tugged in by the booms, so the action of the waves does not lead to a release of oil.
To enable the efficient coordination of the spill response actions, it is crucial to know where the oil binders should be dropped from the aircraft and where they will be located after the assumed time of saturation. To support the coordination of the oil spill response action, an application has been developed. It allows for determining all basic parameters related to the oil binders’ drop and their subsequent recovery from the water’s surface. To construct the application, it was necessary to establish the relationship between external conditions and the motion parameters of the oil binders. The research presented in this paper aimed to develop a model that describes the movement of oil binders from the time they are dropped from the aircraft until they are contained by a floating barrier (boom) or recovered using vacuum technology.
The assumed goal was achieved using two methods: empirical experimentation and computer modeling. The first one consisted of carrying out real experiments in conditions as similar to the real conditions as possible, which allowed for a theoretical description of the movement of oil binders. Due to the different characteristics of the movement of oil binders in the air and on the water surface, the experiment was divided into two phases:
Phase I—from the moment of the oil binders’ drop from the aircraft (helicopter) to the moment of contact with the water—freefall model (described in
Section 2.1).
Phase II—from the moment of contact with the water to the moment of recovery—drift model (described in
Section 2.2).
Computer modeling (described in
Section 3) involved the use of theoretical models to create a computer application. This stage also included the design of the interface and the development of methods of input of the source data and the presentation of the results.
2.1. Model of Oil Binder Fall Trajectory
The motion of light, small bodies, such as oil binders, has been shown to display a chaotic nature [
24], which is strongly influenced by the Reynolds number, calculated as R = Ud/ν, where U is the mean vertical disk velocity, d is its diameter, and ν is the kinematic viscosity of the liquid/air.
Taking the above into account, we decided to model the dispersion of the oil binder cluster, based on empirical data from earlier experiments. The research focused on two main factors that can affect the fall trajectory of the oil binder, namely:
Flight altitude and velocity, i.e., the initial horizontal (parallel to the water’s surface) velocity of the oil binder;
Wind speed and direction.
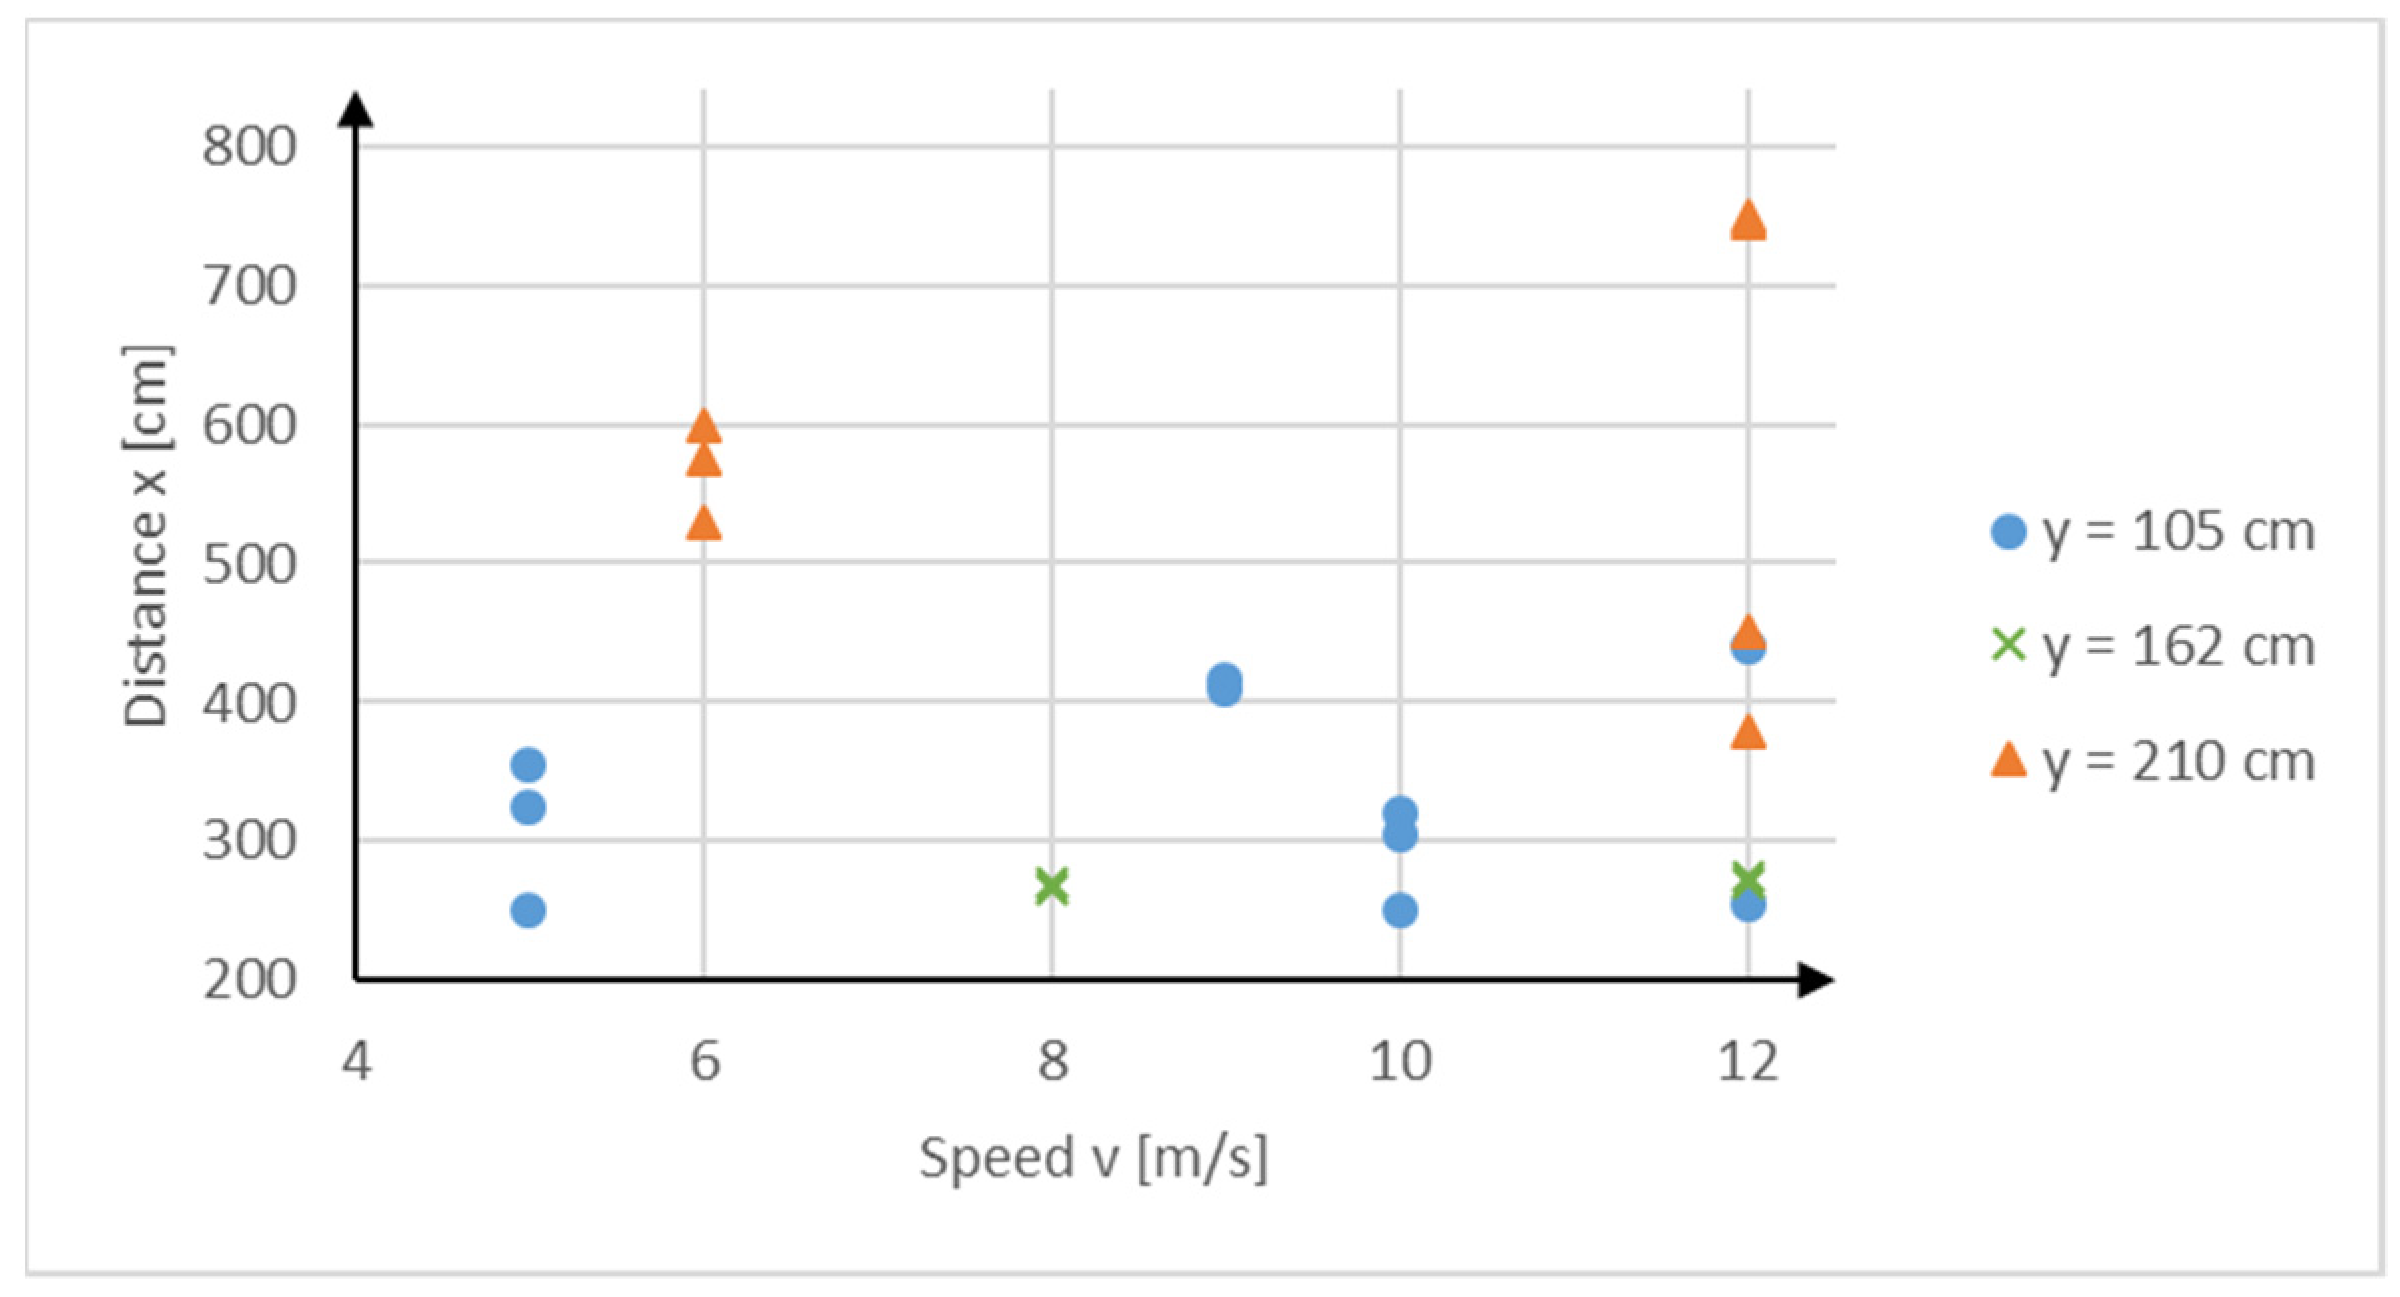
In order to investigate the influence of the initial horizontal velocity on the drop trajectory, a dedicated measurement system was built. It consists of the original device showing the initial velocity of the binder, a slow-motion video camera, and a reference line that allows the initial velocity to be calculated. The binder shooting device is a kind of slingshot, with a horizontally arranged barrel that can shoot oil binders at different, assumed forces, and the height of the barrel can be adjusted according to the research assumptions. In order to evaluate the dependencies among initial velocity, height, and falling trajectories, experiments were conducted with different initial conditions (initial velocity and height). The exact initial velocity and the fall trajectory were determined by analyzing the slow-motion footage from a video camera. The eventual distance at which the oil binder fell to the ground was measured with a tape measure.
The results of the measurements of distance where the oil binder fell, for a certain horizontal initial velocity, are shown in
Figure 7 [
25].
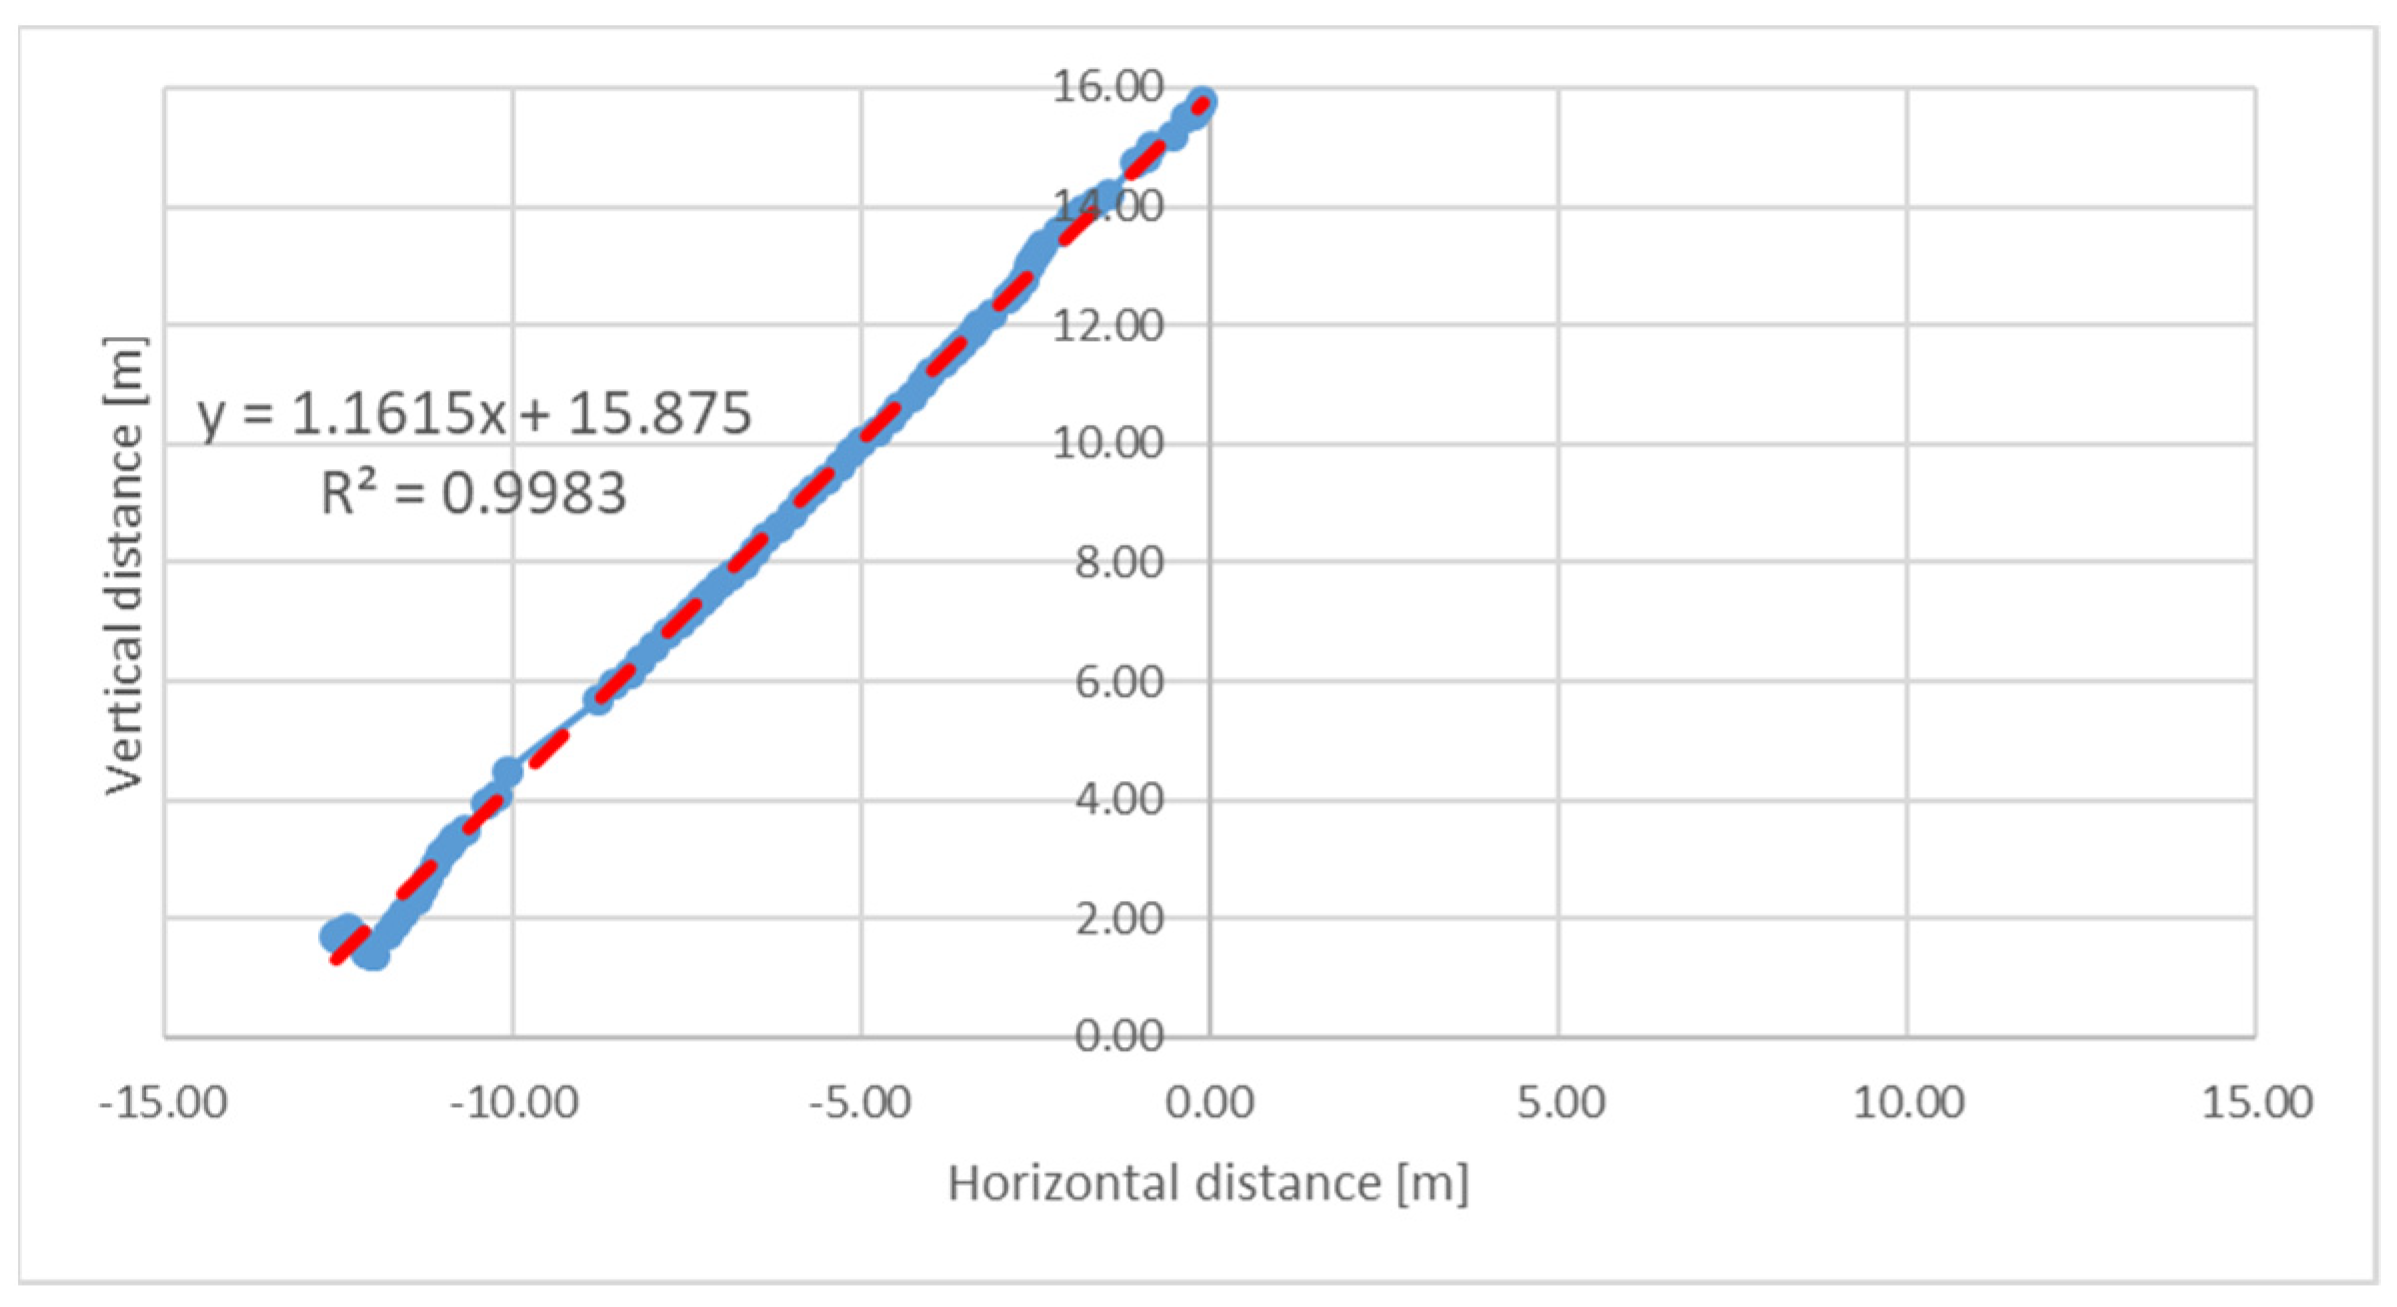
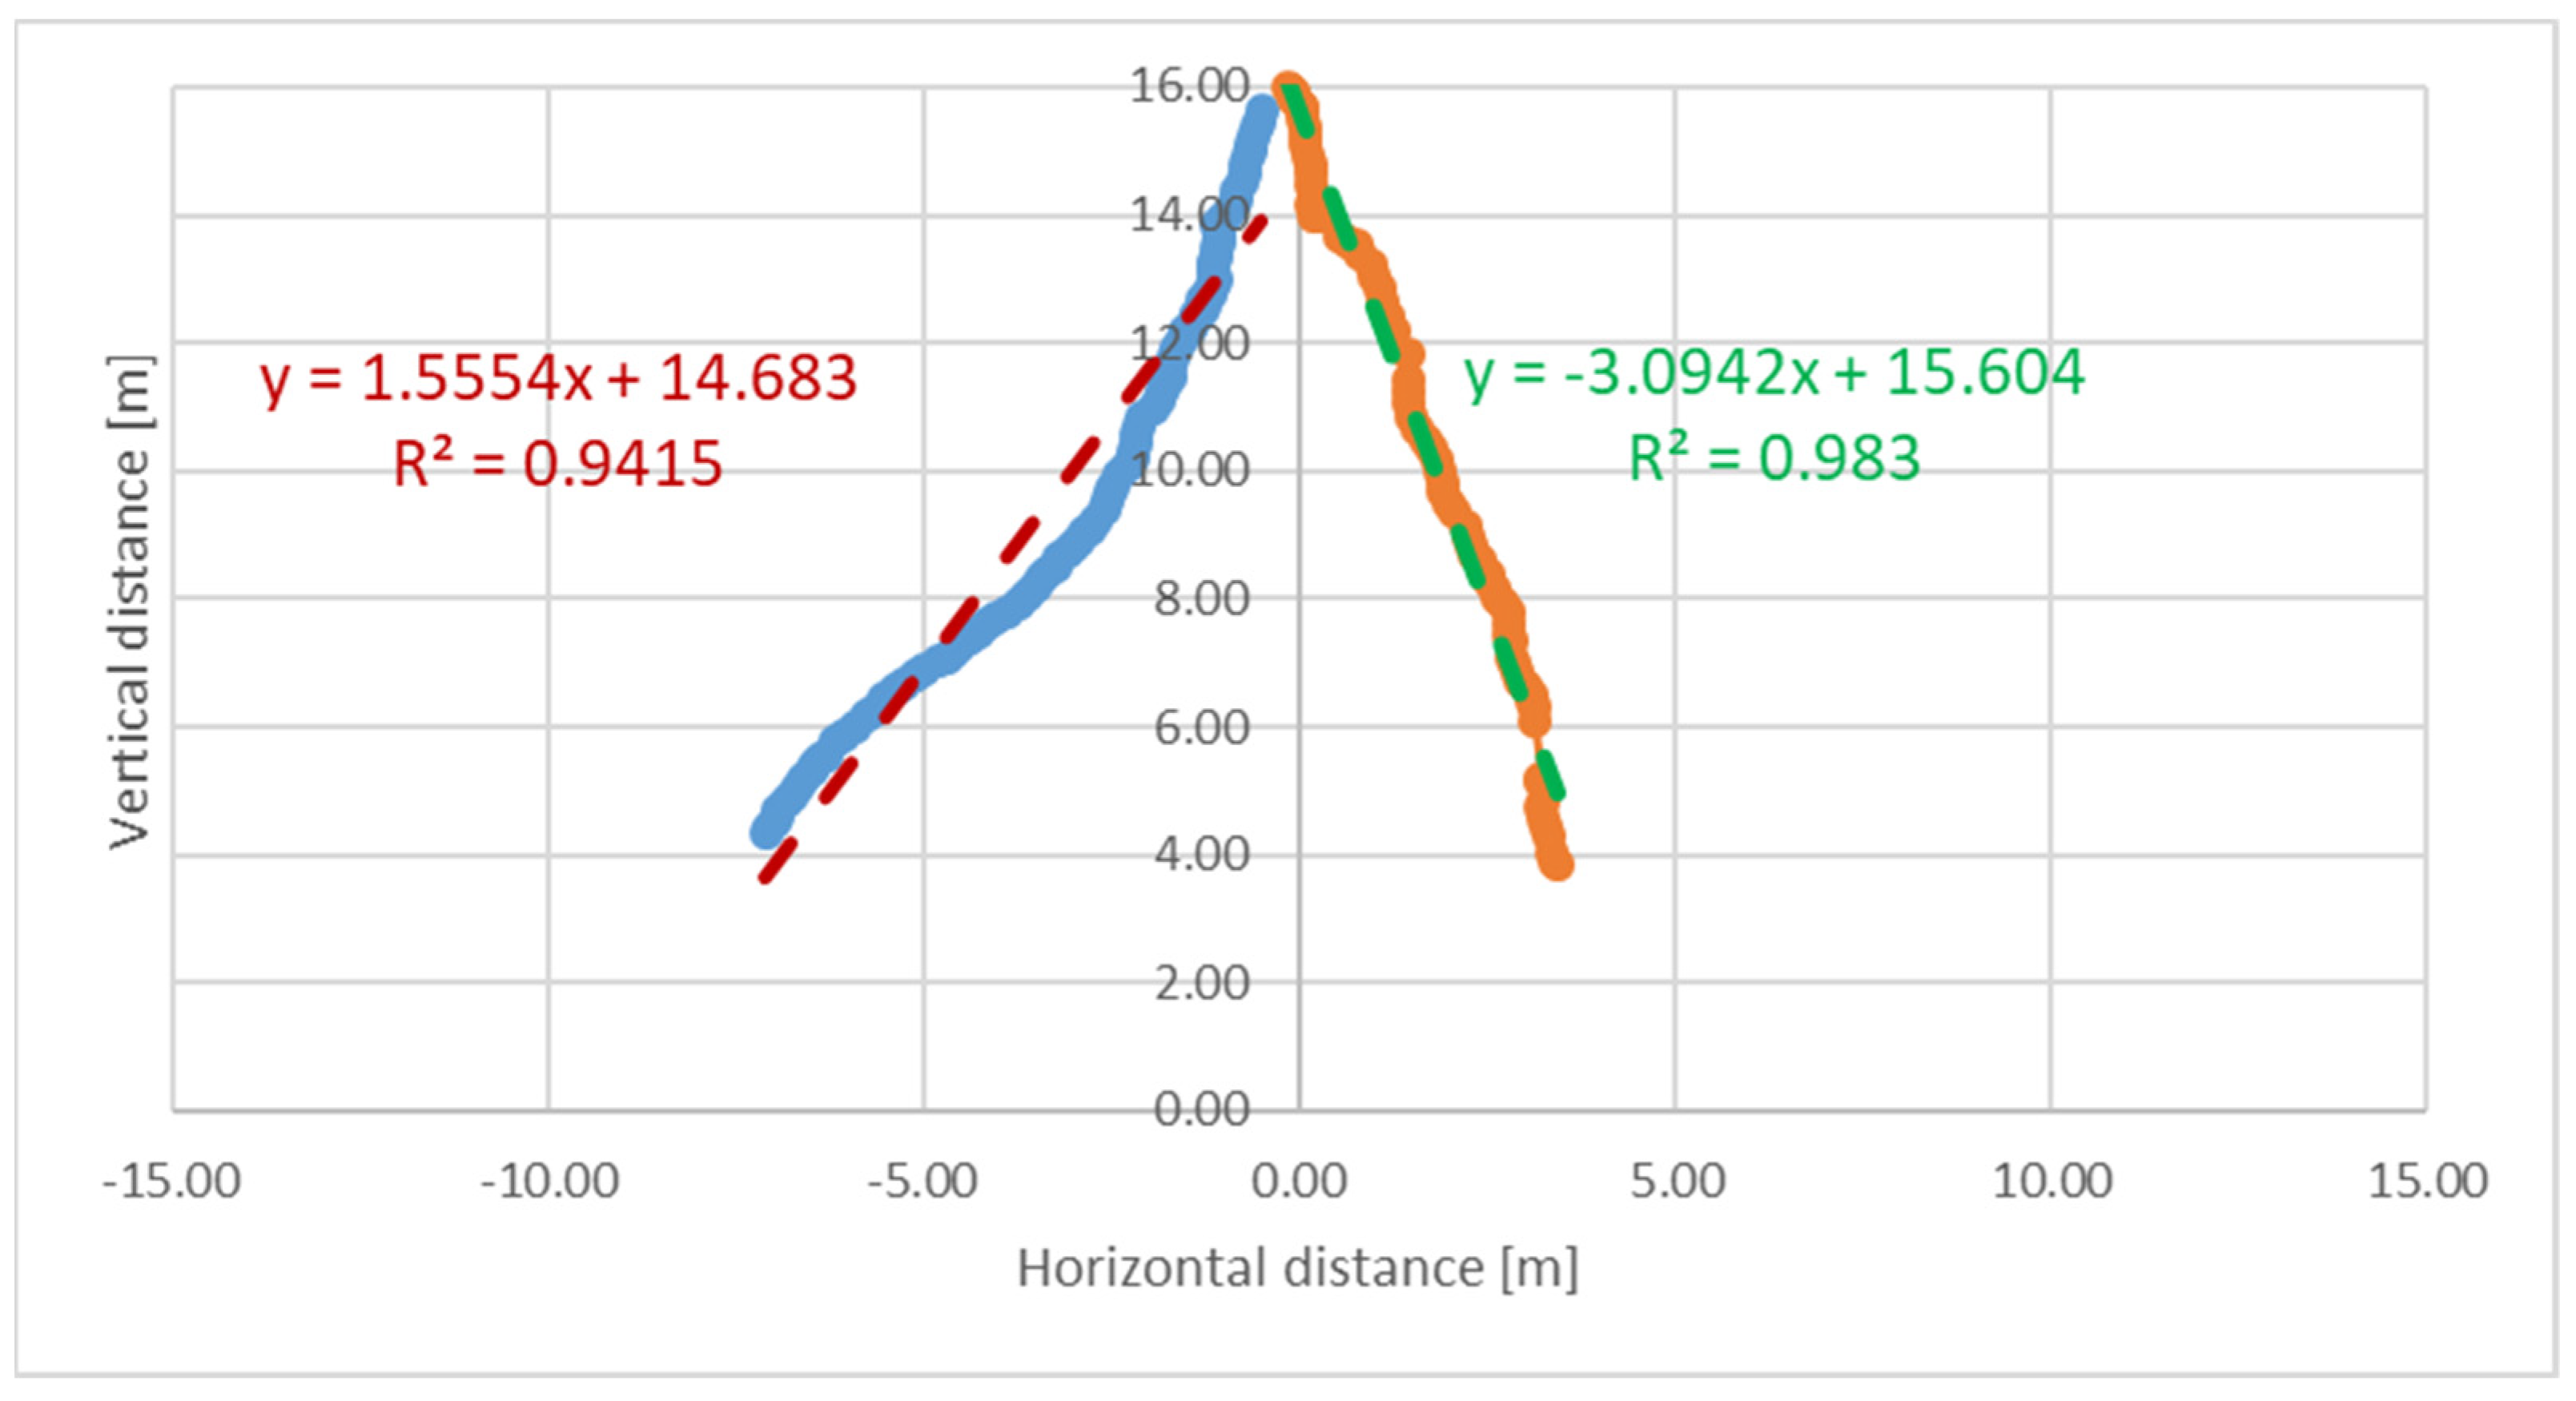
The second step of the experiment was concerned with an evaluation of the influence of external conditions on the falling trajectory of the oil binder. Based on the observations and peculiarities of the phenomenon of free fall, it was assumed that the direction of fall coincides with the wind direction. A natural experiment was conducted to determine the dependency among wind speed, drop height and drop trajectories. In the experiment, binders were dropped from a certain height at different wind speeds, which were measured at two heights (at the drop point and about 2 m above the ground). The fall trajectories of the binders were determined from the recordings of two vertically positioned video cameras. In addition, the maximum spread of the oil binders on the ground was measured. The results of the second part of the experiment allow the assessment of the fall position and dispersion for different heights and wind speeds. An example of the analyzed trajectory is shown in
Figure 8.
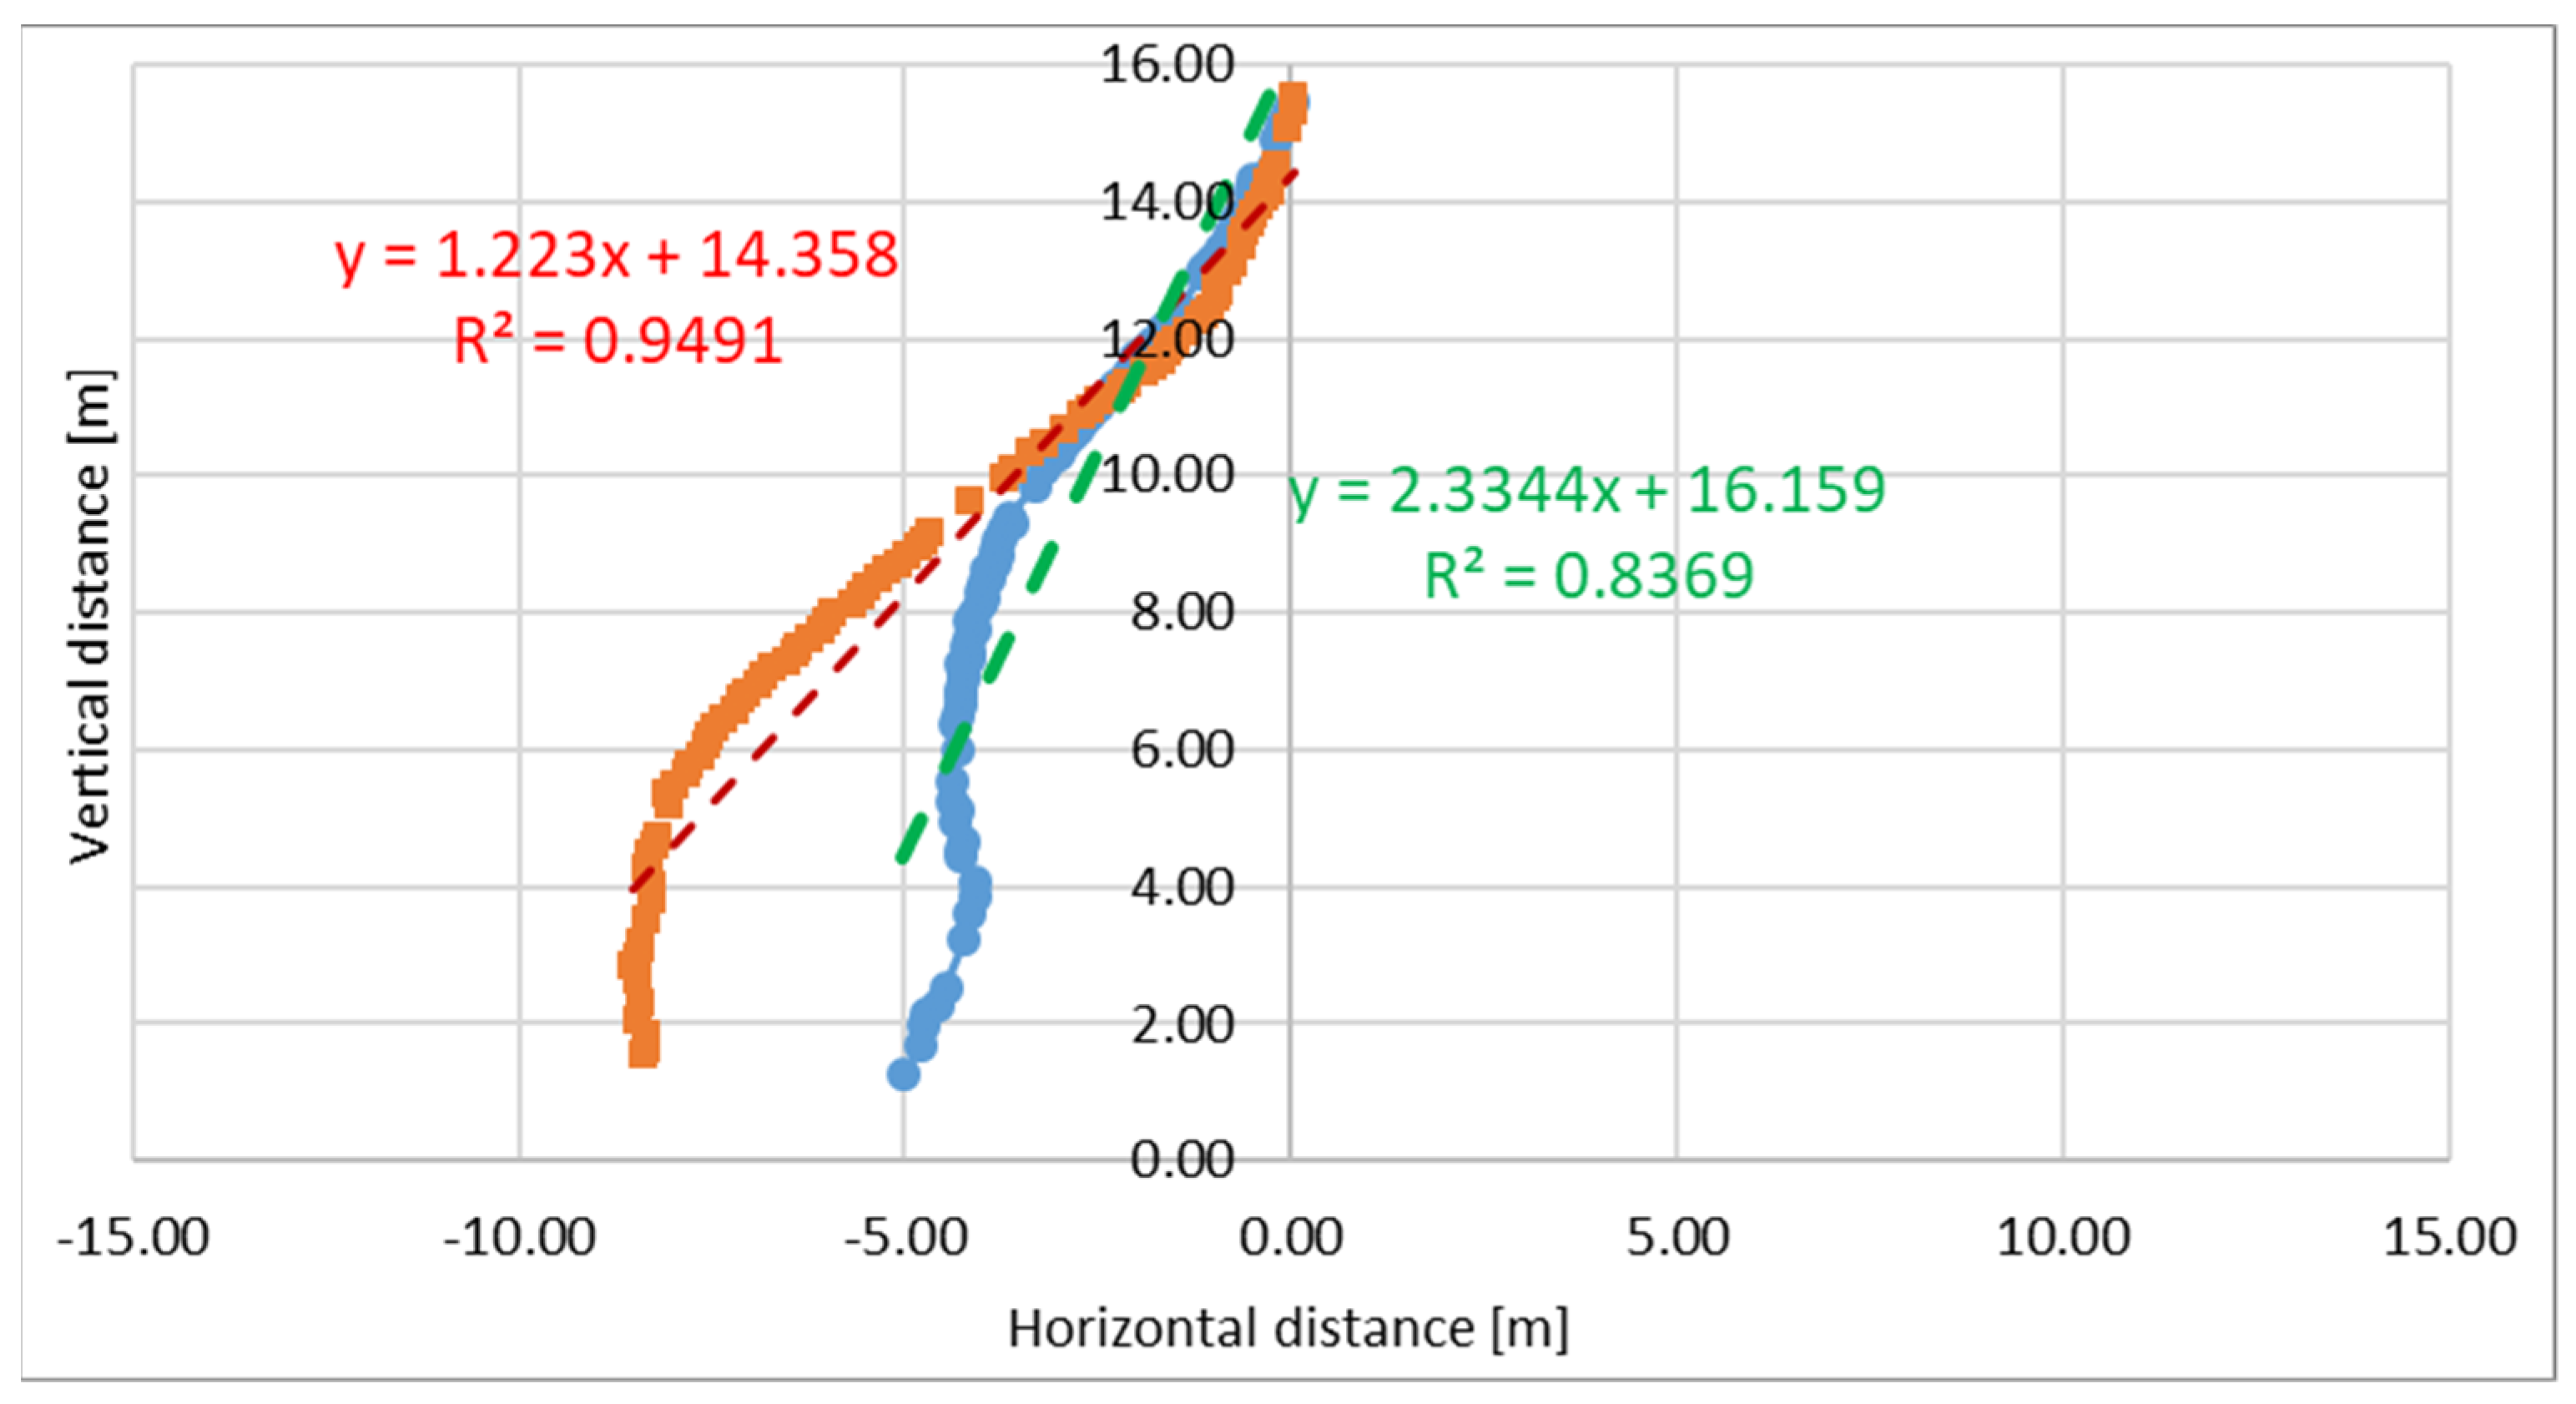
In the last phase of the experiment, 20 to 100 absorbent pads were dropped at different wind speeds. The plots show two extreme situations for constant wind speed (
Figure 9) and for variable wind (
Figure 10).
The results of the study have shown that the fall trajectory of the oil-binding units can be approximated as a linear function, where the shape of the exact plot depends on the wind speed and direction, as well as the speed and direction of each oil-binding pad rotation. This rotation has a random character and depends on the initial conditions of the drop, including the position of a single oil-binding unit, the number of oil binders, and the force of deflection from other oil-binding units in the vicinity.
It is assumed that bivariate normal distribution can be used to calculate the positions where the oil binders fall. On the basis of real experiments, it was established that the offset of the mean fall position, referred to as the drop position, can be calculated with the following formula:
where
D is the offset of the mean fall position referred to the drop (aircraft) position (m);
H is the altitude of the drop (aircraft) (m); and
v is the wind speed (m/s).
The direction of the offset is consistent with the direction of the wind. The standard deviation of the fall positions of the oil binders can be calculated with the following formula:
where
s is the standard deviation of the fall positions of the oil binders (m).
2.2. Model of Oil Binders’ Drift
Modeling the drift of oil binders requires knowledge of the current, wind, and waves in the area [
26]. Currents in offshore areas can be determined by models and satellite systems, and their influence is direct on drifting binders; that is, the vector of the predicted current can be applied to a group of drifting binders. The influence of wind is more complicated. In the literature, it is generally assumed that the wind causes a drift of small objects on the sea surface of between 1% and 4% of its speed [
27,
28,
29,
30]. An additional influence is that of the wind-wave but this is difficult to measure, and it is generally assumed that the wave and wind interact as a combined force because they are difficult to separate. The drift of oil binders will depend strongly on the submerged surface area of a given absorbent material. The more oil-soaked a given material is, the lower its emergent (windward) surface area will be. Therefore, an experiment was conducted to study the wind drift of individual gradations of both oil-soaked and clean binders at different wind speeds. The layout of the experiment was planned in the Szczecin Lagoon. This is a relatively large body of water (covering an area equal to 687 km
2), sheltered, with an average depth of 5 m. The experiment was performed on a platform, where the absorbent pads were dropped on the water and the passage of time for a 5-m long section was measured. The experiment was performed with the wind towards the land and the water depth of approximately 2 m. The wind speed was measured at about 10 cm from the water level by averaging the measurement during the drift of the absorbent pads. The wind speed was averaged for the entire experiment. Fifteen measurements were taken for two different wind speeds and two groups of absorbent pads (oil-soaked and clean–unsoaked) drifting individually. The absorbent pads were soaked in vegetable oil with a density of 850 kg/m
3 and weighed after soaking. Their weight was 2.57 g +/− 0.07 g non-soaked and 9.96 g +/− 0.21 g soaked, respectively. The immersion of the oil-soaked absorbent pads was visually determined to be over 95%. The non-oil-soaked absorbent pads were more than 50% submerged, as shown in
Figure 11.
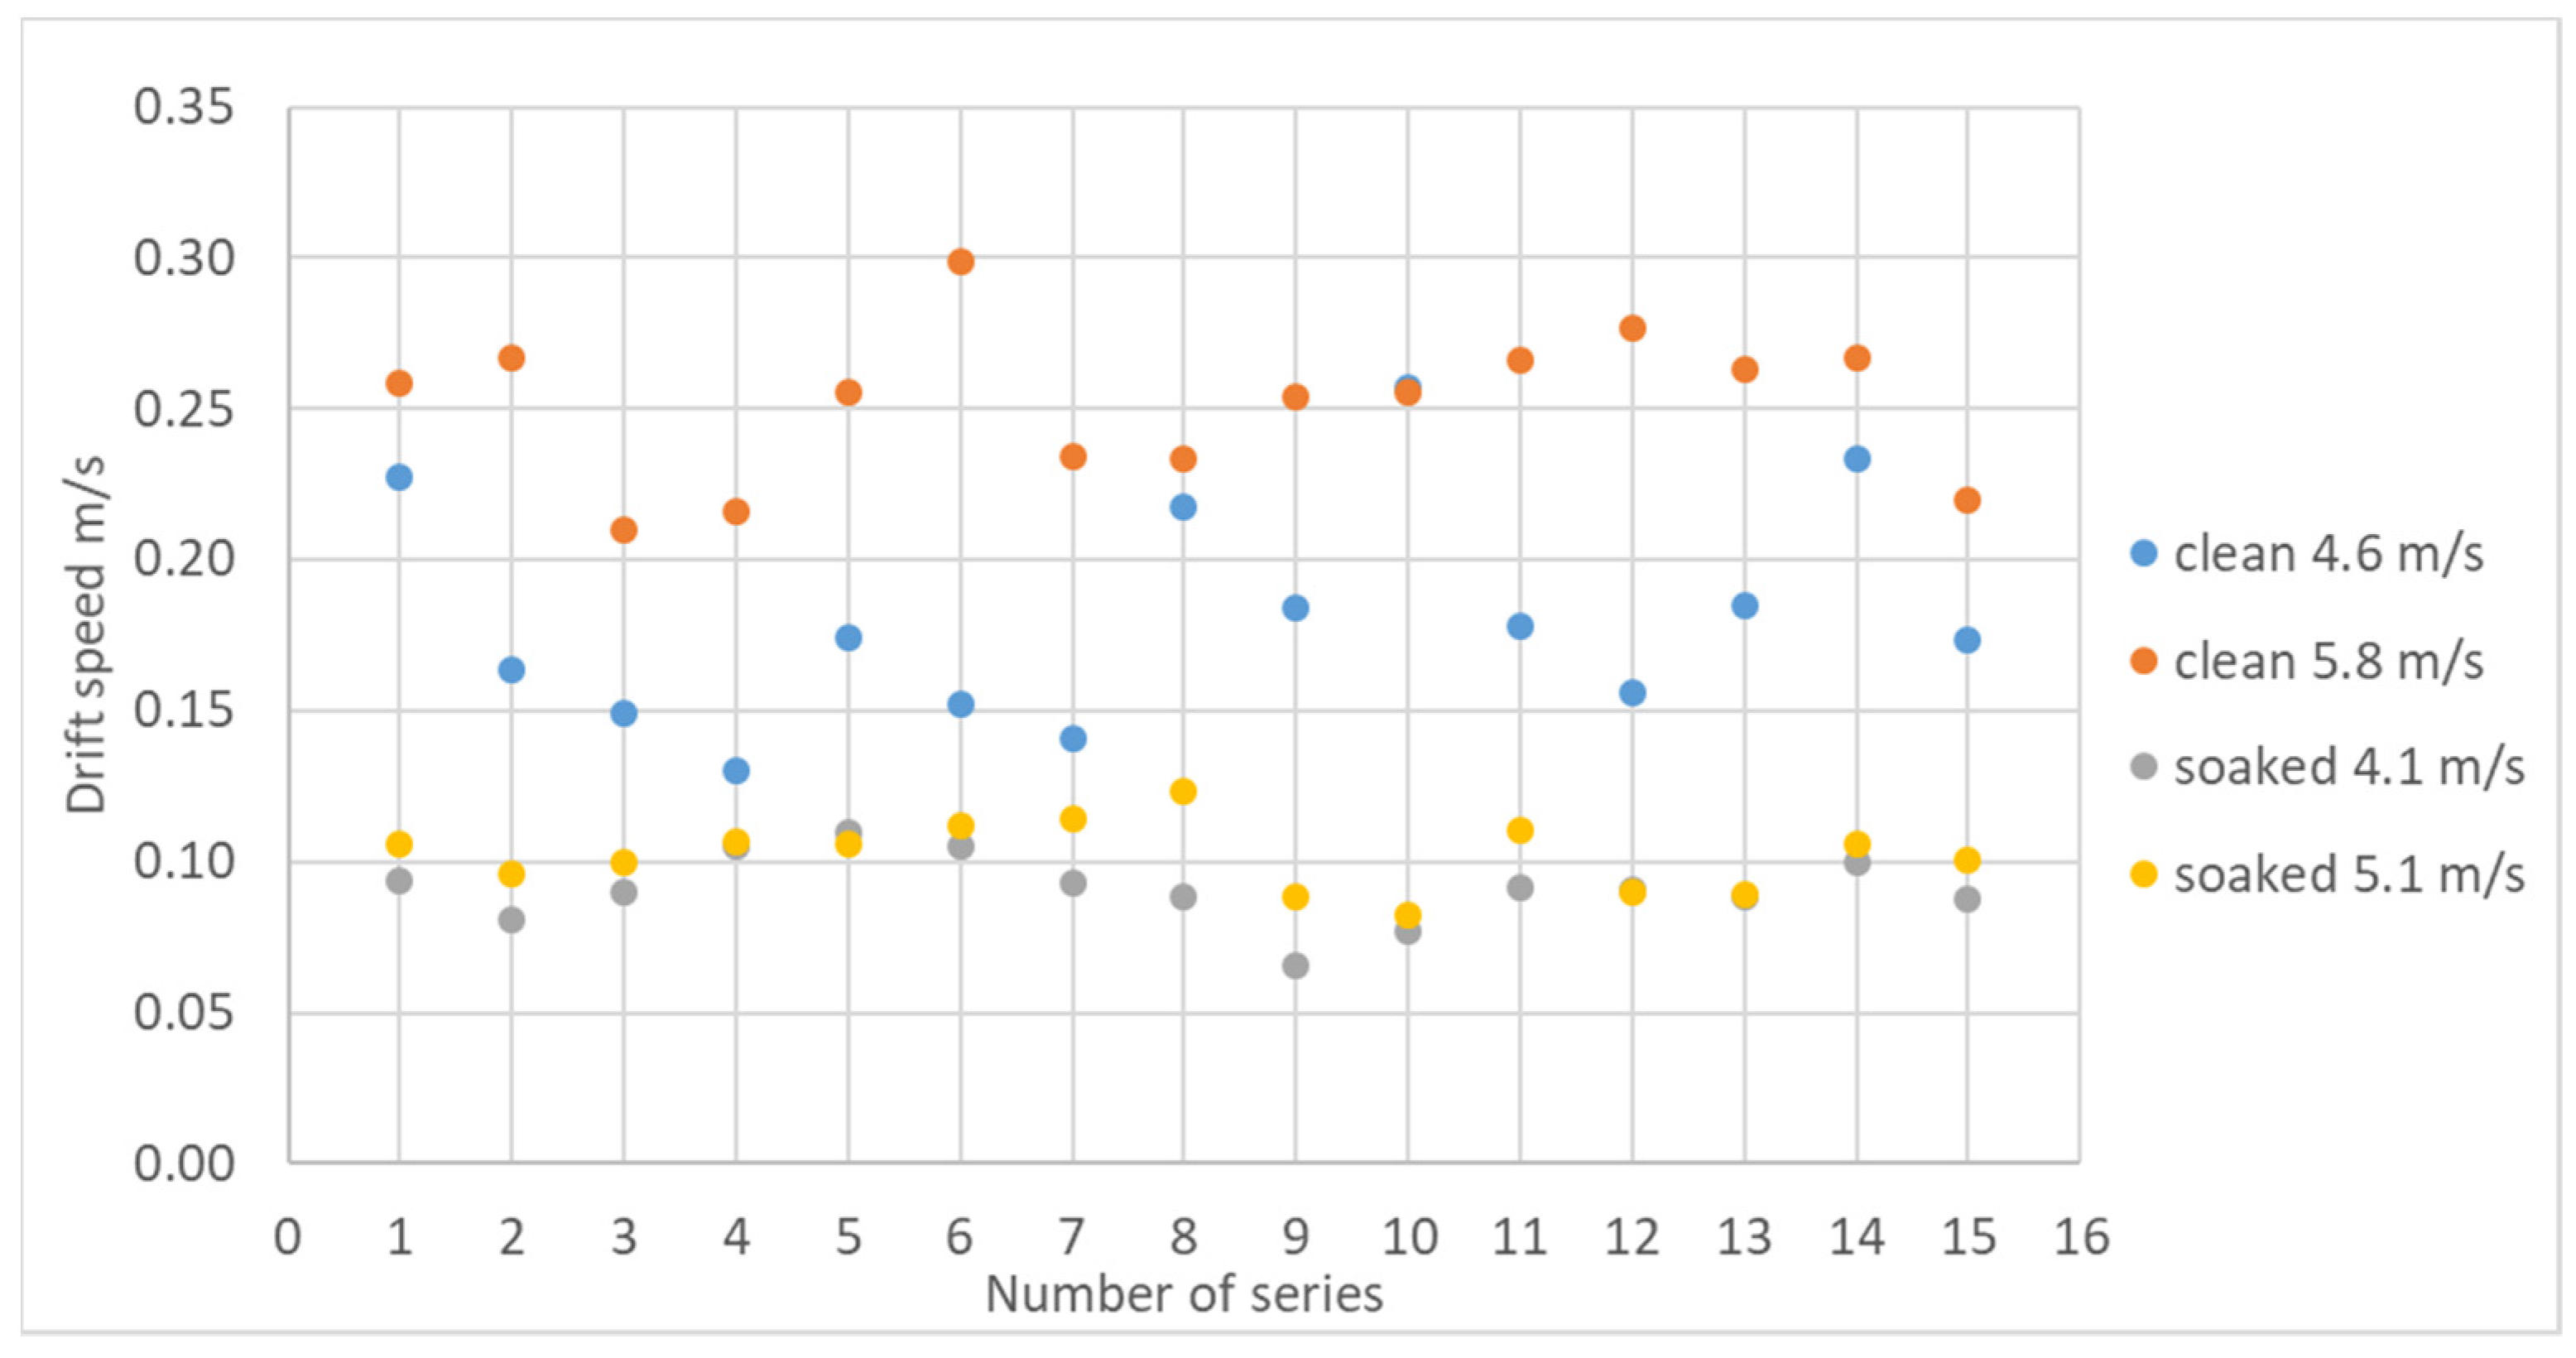
The average drift velocities for different wind values are shown in
Table 3. A plot of the drift velocities of the absorbent pads is shown in
Figure 12. It can be seen that the drift velocities clearly differ between the two groups and are 2% of the wind velocity for the fully soaked absorbent and 4% for the clean absorbent, respectively, which is consistent with the literature data. Note that in practice, the absorbent pad will be far from completely saturated with oil because water blocks the pores of the absorbent material.
Since the designed software application will be used in various conditions, often under time pressure, it must be easy to operate and must produce results in a short time. Thus, the absorbent binders’ drift velocity has been approximated as 3% of the measured wind speed, with the same direction as the wind. If a water current is present in the area it will be also taken under consideration.
In order to take into account the random nature of the oil binders’ movement, resulting from the variability of conditions and the accuracy of input data, it was assumed that wind velocities and directions are described by normal distributions, with a mean value entered by the user and standard deviation adopted, on the basis of literature analysis and our own measurements, of 3% of wind speed and 1 degree for the direction. The direction and speed of the current are also described by normal distributions, with the means entered by the user and standard deviations, adopted at the level of 1% of the speed and 1 degree for the direction.
3. Results—Application Functionalities
It was assumed that the application, based on the developed models of oil binder fall trajectory and drift, should have the following functionalities:
Determination of the position of the aircraft in which it should be located at the time of oil binders drop/determination of the oil binders fall position (contact with water) for a specific aircraft position;
Determination of the position of oil binders after a certain time, in order to plan the action of recovering it from the water surface/determination of the time after which the oil binders will be in a specific position.
An additional goal was to create an interface that on the one hand is time-efficient and on the other enables full control over the changing external conditions, and that presents the results in a full and clear way.
Thanks to its capabilities, this application can be used by various participants in the oil spill response action (on-scene commander, air flight control, on-sea ship recovery commander) at its various stages (e.g., to assess the parameters of aircraft deployment during the oil binders drop, to plan the action of recovering it from the water surface, and to assess the time when the oil binders will reach the shoreline).
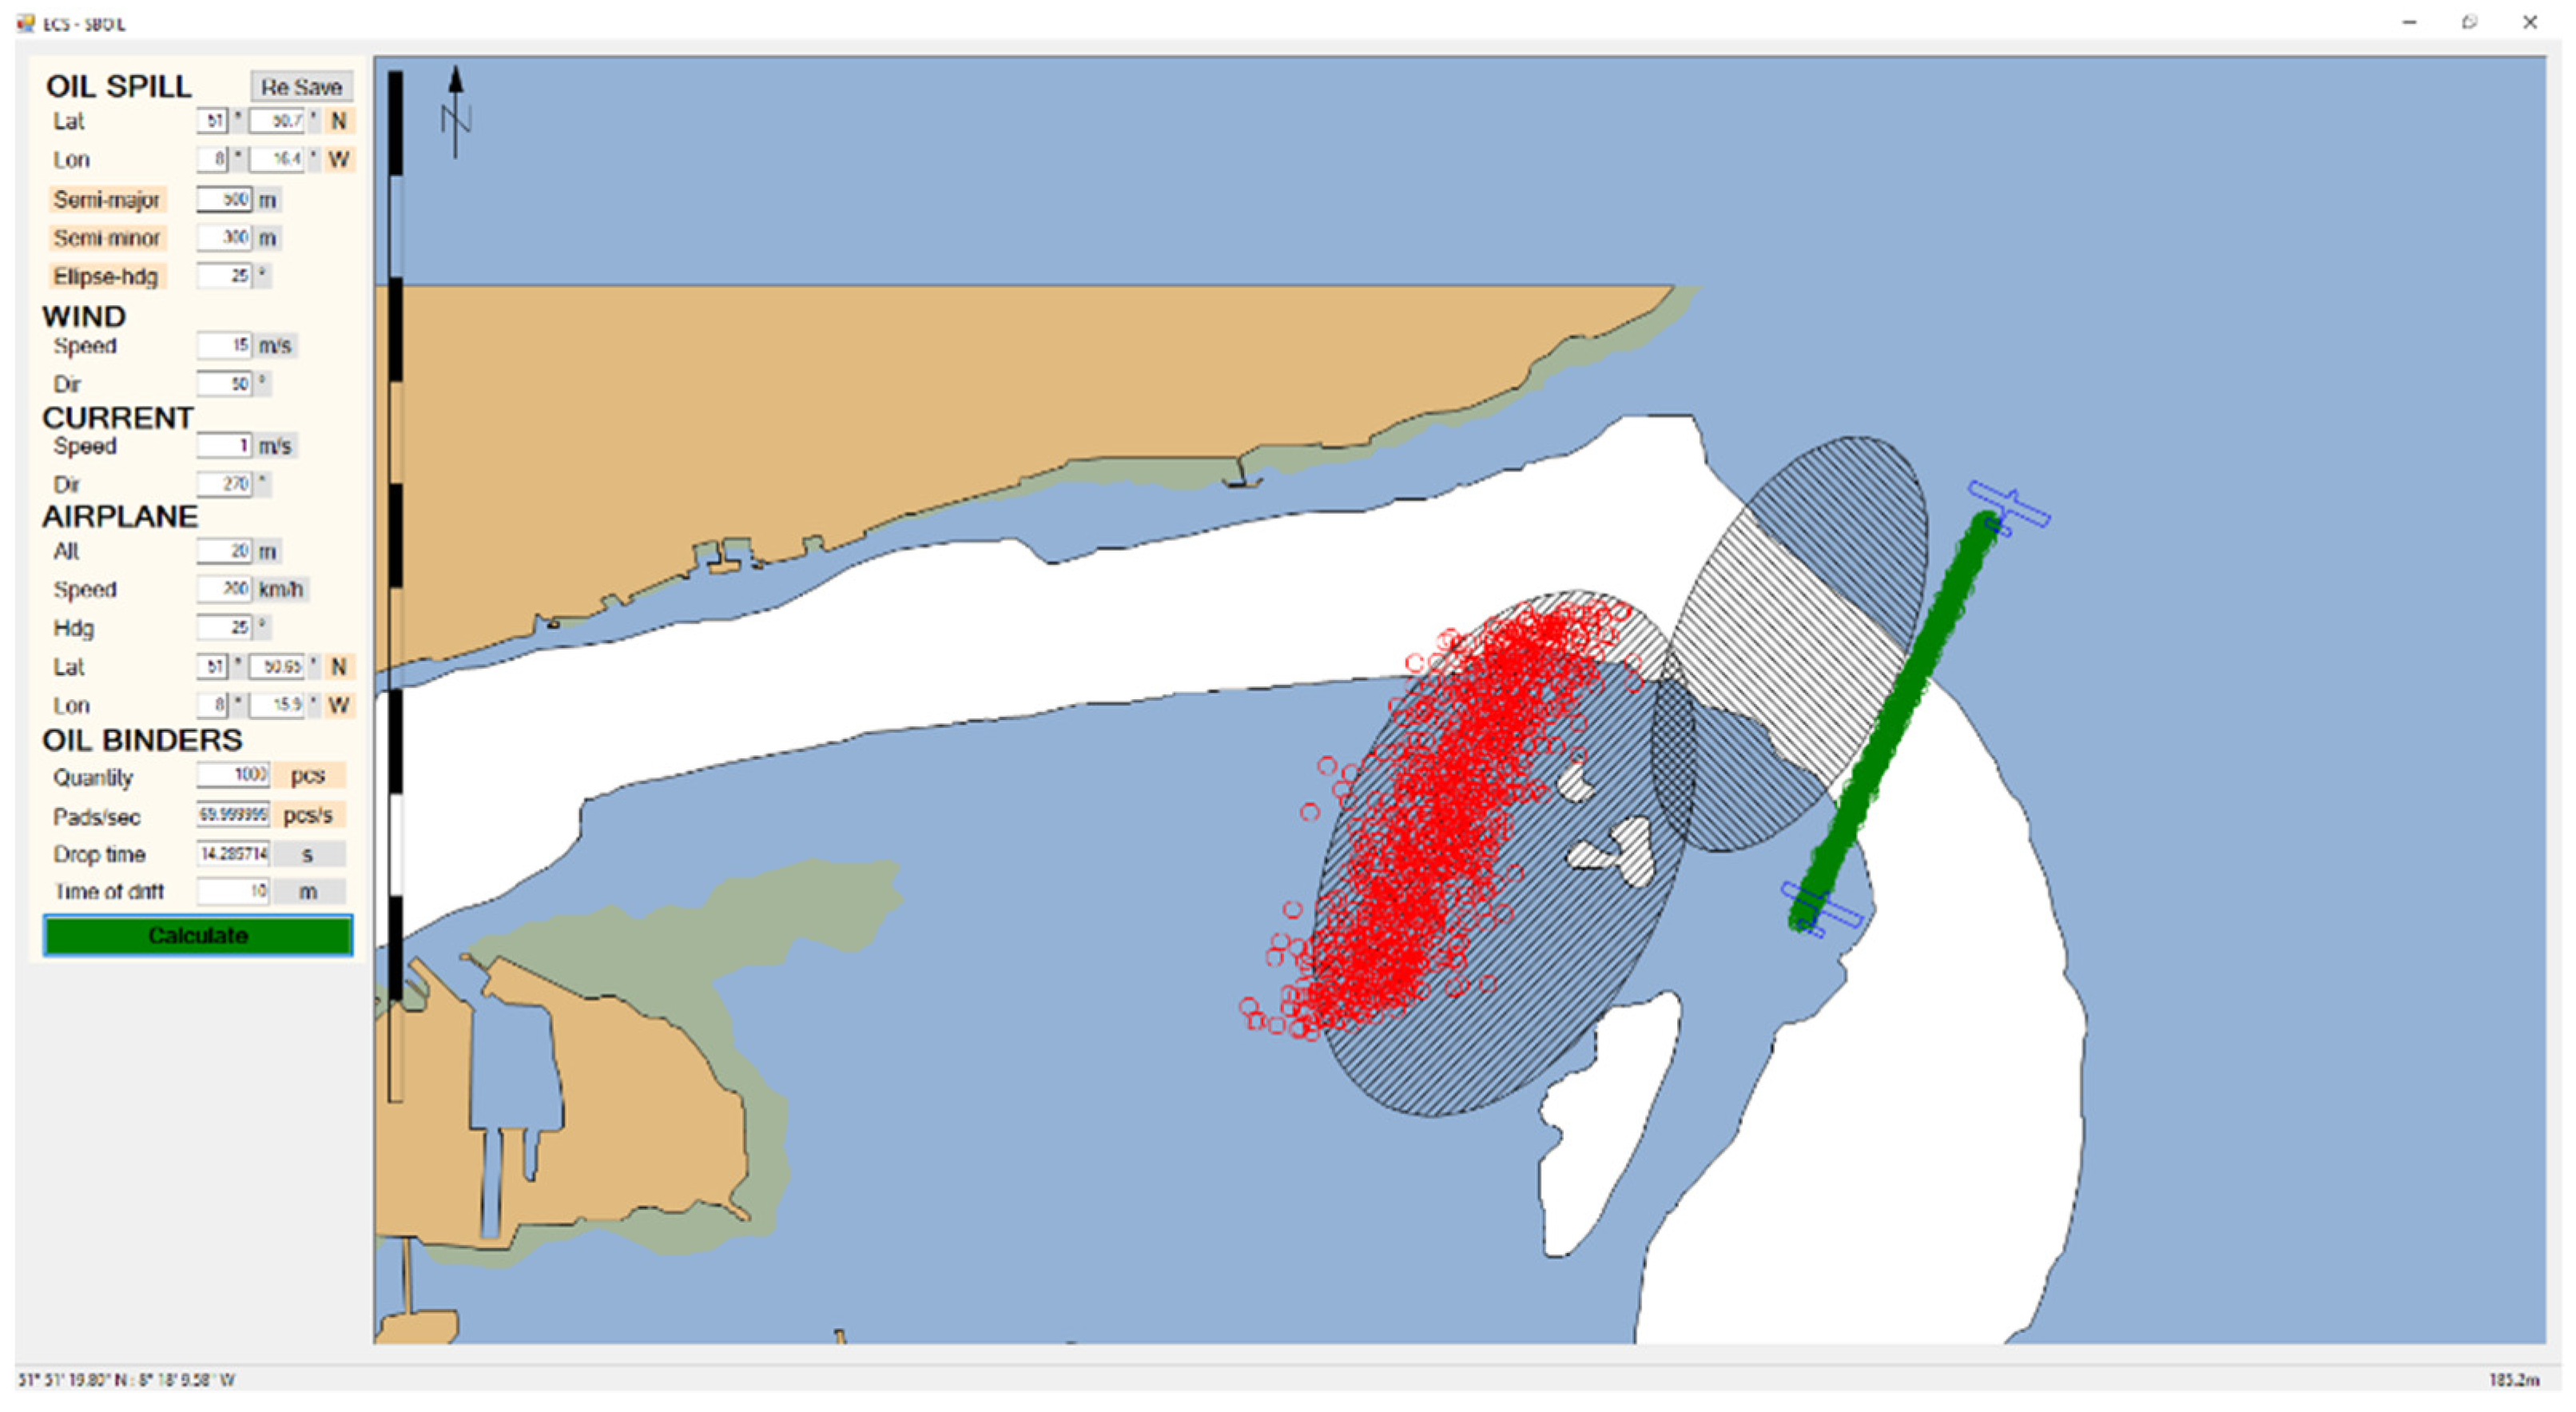
Figure 13 presents the developed application interface with exemplary results. It is possible to enter the following input data:
Position and size of the spillage: latitude and longitude of the center of the ellipse and its parameters: semi-axis and orientation;
Position and size of the spillage after assumed time: latitude and longitude of the center of the ellipse and its parameters: semi-axis and orientation;
Wind parameters: speed (m/s), direction (deg);
Current parameters: speed (m/s), direction (deg);
Aircraft parameters: altitude (m), speed (km/h), heading (deg) and position of the drop where the drop starts;
Drop parameters: oil binders’ quantity (pcs) or (kg) or (m3), drop rate (unit/s), time of drift (min).
As a result, the positions of an aircraft where the drop starts and stops, and the positions of oil binders dropped on the water surface (green points) and positions of oil binders after the assumed drift time (red points), are presented on the chart. Additionally, the present and assumed (after the given time) positions and sizes of the oil spill are presented (black hatched ellipses).
4. Discussion
Oil spills continue to pose a serious threat to the Baltic Sea environment. While it is debatable which oil-spill response methods are most effective, the solution developed by the SBOIL project has proven to be a viable alternative, especially when considering deployment time. In environmental disasters, time is of the essence. Therefore, any practical solution should allow for the easy planning and implementation of countermeasures.
However, the use of air-dropped absorbent materials can occur in wind conditions that are well beyond the capabilities of conventional oil-spill response measures, such as oil booms, skimmers, and oil-spill response vessels. For example, Polish vessels designed to combat oil spills (m.s. Kapitan Poinc and m.s. Czeslaw II) are equipped with an active skimmer system, the use of which is limited to a sea state of 3 (wave heights up to 1.25 m).
The subsequent problem, of course, is to collect the absorbent materials from the sea surface. However, in critical cases, where the spill threatens to spread to land and contaminate sensitive coastal areas, the use of air-dropped absorbent materials may be the only reasonable option.
The use of binders may also be necessary for inland waters where an oil spill response by conventional means is difficult, especially when coastal areas are covered with vegetation. Then, the use of air-dropped or floating absorbent materials can be of great benefit.
The authors presented how two separate problems were tackled: modeling large quantities of light and small objects with chaotic motion properties and developing a specific application for end-users.
Very interesting results were obtained in regard to modeling the aerodynamics and hydrodynamics of absorbent pads. The very fast deceleration of binders in air and their linear dependence on wind speed allowed the creation of a model, unprecedented in the literature, that greatly facilitates the unloading of absorbent binders from airborne vehicles. The hydrodynamic studies of oil binders and their behavior in the wind have revealed interesting phenomena related to the relationship between the drift velocity and the degree of oil saturation, which is 2% of the wind velocity for saturated binders and 4% for clean ones. The latter value is used in the literature as a first approximation for determining the drift of small objects floating at sea.
The approach presented in this paper complements the classical approaches to oil spill response. It provides those dealing with oil spills with a tool to combat them under certain circumstances. Of course, free-floating, absorbent methods of combating oil spills are not without their drawbacks. First and foremost is the critical problem of waste products in the ocean that must be disposed of after the spill.
Due to the chaotic movement of a single oil binder and the unpredictable interactions between oil binders during the airdrop under certain weather conditions, the authors opted for one of the simplest possible experimental designs, in favor of a complex numerical simulation.
It could be argued that the simulation could provide more accurate results for a wider range of hydro-meteorological conditions. However, the authors believe that this increased accuracy would not be significant for practical purposes and would not justify the time required to develop and validate such a model.
5. Conclusions
Reducing the risk of environmental pollution by oil products, resulting from the constantly growing ship traffic and size, in particular of oil tankers, can be achieved, inter alia, by building new systems for oil-spill response actions. An example of such a system is the SBOIL, which is based on the airborne deployment of biogenic oil binders; for this reason, it can be used even in shallow waters during adverse weather conditions.
Because the cost of the oil binders’ production is relatively low, the total costs of oil-spill response action with the use of binders are strongly dependent on the costs of their collection and subsequent disposal. This, in turn, depends on the size of the oil spill, the shape of the shore, vegetation, and a number of other factors. In the case of collecting the binders from the sea surface, a custom-built boom that accumulates the binders in a replaceable net bag is used. It can be assumed that, in this case, the cost of response action is comparable to the other techniques. The cost of collecting the binders from shore is difficult to assess. For the southern Baltic beaches, which are mainly sandy, a specially designed vacuum cleaner can be used. For rocky or vegetated shores, the cost of collecting will be incomparably higher, but a similar problem can be observed with other techniques.
The main goal of the presented research was to develop models of the free fall and drift of the oil binders and to implement them in computer applications supporting the coordination of oil-spill response action. The application can be used to determine the position of the aircraft, where it should be located at the time of the oil binder drop or, alternatively, to determine the oil binders’ falling position (contact with water) for a specific aircraft position, and additionally to determine the position of oil binders after a certain time in order to plan actions to recover them from the water’s surface or, alternatively, to determine the time after which the oil binders will be in an assumed position. The application will be usable during the coordination of oil-spill response action with the use of oil binders deployed by aircraft.
The development of the application included the creation of theoretical models of the oil binders’ fall and drift trajectories and the implementation of the models into a computer application.
The results of the study on the fall trajectory of the oil binders have shown that this can be approximated as a linear function, where the parameters of the binders’ fall depend on the altitude of the aircraft, the wind speed, and the direction. The resulting relationships allowed us to determine the position of the binders when falling under various external conditions.
The drift trajectory depends on the current and wind parameters. It was assumed that the vector of the predicted current could be applied directly to a group of drifting binders. To study the wind drift of binders at different wind speeds, an experiment was conducted. The results showed that drift velocity can be approximated as being 3% of the measured wind speed, with the same direction as the wind, which is consistent with the published literature data.
The last stage of the work included the design of the application interface and the implementation of the developed theoretical models.


 ,
, 


